Article

Interactive Effects of Drought and Saline Aerosol Stress on Morphological and Physiological Characteristics of Two Ornamental Shrub Species

by
Stefania Toscano
1,
Antonio Ferrante
2,
Daniela Romano
1,* and
Alessandro Tribulato
1
1
Department of Agriculture, Food and Environment (Di3A), Università degli Studi di Catania, Via Valdisavoia 5, 95123 Catania, Italy
2
Department of Agricultural and Environmental Sciences, Università degli Studi di Milano, Via Celoria 2, 20133 Milan, Italy
*
Author to whom correspondence should be addressed.
Horticulturae 2021, 7(12), 517; https://doi.org/10.3390/horticulturae7120517
Submission received: 21 October 2021 / Revised: 19 November 2021 / Accepted: 22 November 2021 / Published: 23 November 2021
(This article belongs to the Special Issue Drought Stress in Horticultural Plants)

Abstract

:
Effects of drought and aerosol stresses were studied in a factorial experiment based on a Randomized Complete Design with triplicates on two ornamental shrubs. Treatments consisted of four levels of water container (40%, 30%, 20%, and 10% of water volumetric content of the substrate) and, after 30 days from experiment onset, three aerosol treatments (distilled water and 50% and 100% salt sea water concentrations). The trial was contextually replicated on two species: Callistemon citrinus (Curtis) Skeels and Viburnum tinus L. ‘Lucidum’. In both species, increasing drought stress negatively affected dry biomass, leaf area, net photosynthesis, chlorophyll a fluorescence, and relative water content. The added saline aerosol stress induced a further physiological water deficit in plants of both species, with more emphasis on Callistemon. The interaction between the two stress conditions was found to be additive for almost all the physiological parameters, resulting in enhanced damage on plants under stress combination. Total biomass, for effect of combined stresses, ranged from 120.1 to 86.4 g plant−1 in Callistemon and from 122.3 to 94.6 g plant−1 in Viburnum. The net photosynthesis in Callistemon declined by the 70% after 30 days in WC 10% and by the 45% and 53% in WC 20% and WC 10% respectively after 60 days. In Viburnum plants, since the first measurement (7 days), a decrease of net photosynthesis was observed for the more stressed treatments (WC 20% and WC 10%), by 57%. The overall data suggested that Viburnum was more tolerant compared the Callistemon under the experimental conditions studied.

1. Introduction

The Mediterranean environment is characterized by high summer temperatures often associated with shortage and poor quality of irrigation water. These conditions represent a limit for optimal plant growth and somehow even survival [1]. Along coastal areas, plants in many cases are also affected by salinity stress (soil salinity and spray aerosol) that represents a relevant restriction affecting distribution and survival of native plants [2]. The presence of simultaneous stresses (drought and saline aerosol), which have a cumulative negative effect on plant growth and survival [3]. Álvarez et al. [4] have investigated on drought and saline aerosol stress separately, but only a few studies report the effect of interaction between these stresses. These two abiotic stresses share common physiological, biochemical, and molecular responses in plants. Therefore, plants can undergo synergistic negative effects subjected to both stresses [5].
In coastal areas, the management of landscape and its ornamental value due to the expansion of tourist industry and, as a consequence, the growing of residential uses implies a large interest in green areas realization [6]. Since the end of XX century, tourism has grown by almost 75% in the Mediterranean coasts [7], and projections, before the COVID-19 pandemic, showed a continuing increase in the number of tourists, until to reach 637 million by 2025 [8]. For these reasons the areas destined for both private gardens and public parks are increasing, due to the importance to have recreational areas near homes and hotels. Due to residential use of coastal area, the consumption of water resources has increased, and the irrigation of these area in the summer months for the metropolitan area of Barcelona (Spain), determines a consumption of approximately of 4.28 litres/m2/day to watering the gardens; this water quantity represents about the 50% of the total domestic water consumption [9]. These quantities of water not always are available; for this reason the expansion of green areas, especially under suboptimal environmental conditions, has motivated number of studies to identify the most suitable species to be used in gardens [10] and their most suitable cultivation methods [11]. Many ornamental plants adopted in green areas present, at inter and intraspecific levels, relevant differences on response to stress conditions [12]. The interest in ornamental species choice is linked to individuate plants that are able to tolerate environmental stresses. The negative effects of abiotic stresses hamper important physiological functions [4] and damage organographic structure and, consequently, aesthetic features of plants.
In nature, all living organisms included plants are continuously exposed to different abiotic and biotic stresses, quite often overlapping at the same time. Abiotic stresses, like drought, salinity, floods, heat, and frost shock and other environmental extreme events, represent the main reasons of losses in plant growth and crop yield [13]. The combination of abiotic stresses, like drought and salinity, often occurs in climatic areas where warm summers are associated with lack of rain/irrigation water, especially along the coasts, resulting in severe yield losses compared to a single stress [14]. Current knowledge indicate that plants are able to manage with a number of overlapping biotic and abiotic stresses through exhibition of tailored responses, which can hardly be understood from data coming from results of a single independently imposed stress [15,16,17]. Facing these threats, plant resilience results are especially important when stresses could cause negative effects on plant growth and reproduction [18].
The response of plants to both salt and drought stress differs according to the different potentially usable species [19] and, sometimes, within the cultivars of the same species [20]. Salt stress in coastal areas, can occur both at the root and foliage level. At root level, the presence of high levels of ions in the irrigation water or soil reduce the plants’ performance. At foliage level, the direct action of saline water spray is due to salt accumulation on leaves. Plants are generally more susceptible to salt damage when the salt directly arrives on leaves than when the saline water arrives to the soil and roots [21]. The salinity stress can be even worse in presence of sandy banks, since marine aerosol carries salts and dust on leaves. The abrasive action of the dust can enhance the salt damage. Moreover, in coastal environments, marine aerosol contains salts and other pollutants that can affect growth and sometimes even survival of indigenous plant species [22]. These two aspects can show an independent trend [23] or, in other words, there is a positive relationship between tolerance to salt spray and to soil salinity [24]. Plants are usually 3 to 4 times more tolerant to salt in the roots than in the leaves [24].
Effects of saline aerosol strongly depend on the intensity and on the duration of the stress [25]. Effects of marine aerosol and pollutants on coastal vegetation have been studied for several decades in the European Mediterranean regions [26]. Several experiments demonstrated that leaves can absorb sodium and chlorine ions from sea water drops accumulated on the surface [27]. The salt experimentally applied on leaves of sensitive species induces symptoms similar to those observed on coastal or roadside vegetation near the sea [28]. The abrasive action of the wind excoriates leaf surface and creates possible ways for salt absorption [29]. The damage observed in plants near the sea is attributed to the excessive absorption of chlorine and sodium ions, facilitated by the presence of surfactants that are present in polluted sea water [26].
As consequence, the efficiency of photosynthesis and gas exchanges is negatively influenced by saline aerosol [30], although differences can be found among species [31] because of the characteristics of their cuticles and the epithelial cells [32]. The salts that lay on the surface of the leaf after the evaporation of water [33] can negatively modify the water balance and compromise the characteristics of the cuticle or guard cells, resulting in incomplete stomatal closure [34]. Although the combined action of drought and salt stress has been a key issue for ornamental plants quality [35,36]. The response to saline aerosol in plants subjected to differentiated conditions of water availability has been little investigated.
Callistemon citrinus (Curtis) Skeels (Myrtaceae) and Viburnum tinus L. ‘Lucidum’ (Adoxaceae) play an important role in European market as ornamental potted shrubs for the showy flowering of Callistemon and brilliant color of foliage in Viburnum [37,38]; these two species show from moderate to high tolerance to drought and salt stress, allowing their use also in marginal urban areas [39,40]. Although various investigations have been carried out to study the physiological responses of these species to drought and salt stress [4,40], little information is available on the combined effects of two stresses (drought and saline aerosol), which are very frequent in coastal area in the Mediterranean environments.
In this view, it appears quite relevant to elucidate the morphological and physiological mechanisms of adaptation of potted C. citrinus and V. tinus to drought and saline aerosol stress in order to discriminate effects of single stress or cumulative actions of the two stresses. Responses of the two species to the different stress factors were focusing on growth parameters, leaf gas exchanges, photosystem efficiency, water relations, and leaf functional traits. The information obtained from this experiment could be used to discriminate the effects of drought and saline aerosol stress and to understand how the combination of the two stressors can modify the responses of plants, with the aim to individuate the most functional strategy adopted by plants to overcome these conditions, which are very common in the Mediterranean coastal areas.

2. Materials and Methods

2.1. Experimental Conditions and Plant Materials

The experiment was carried out during 2019 springtime on two ornamental shrubs, Callistemon citrinus (Curtis) Skeels and Viburnum tinus L. ‘Lucidum’, grown in a cold greenhouse located in Catania area, Italy (37°41′ N 15°11′ E 80 m a.s.l.). Two-month-old rooted cuttings of both species were transplanted into 3.4 L pots, filled with sand (75%), silt (18%) and clay (7%), and fertilized with 2 g L−1 Osmocote Plus (14/13/13, +microelements). At the beginning of the experiment, the dry biomass of the plants was on average 27.8 ± 2.09 g and 33.6 ± 3.28 g for Callistemon and Viburnum, respectively.
In the experiment two species (Callistemon and Viburnum), four water regimes (WC 40%, WC 30%, WC 20%, and WC 10%) and three saline aerosol solutions (S0, distilled water; S1, 50% of simulated sea water solution, and S2, 100% of simulated sea water solution) were studied. For the beginning 4 weeks the plants of the two species were subjected to the differentiated water regimes; after this period, three saline aerosol treatments for another 4 weeks were imposed on the same plants differently subject to water stress. To determine the volumetric content of water in the substrate, an automated management system with dielectric sensors EC 5TE (Decagon Devices Inc., Pullman, WA, USA) was used. Two sensors were used for each treatment and for each replicate, and data were recorded using a data acquisition system (data logger) CR1000 (Campbell Scientific Ltd., Loughborough, UK). Sensors were calibrated following the protocol of Starr and Paltineanu [41] and Tribulato et al. [42]. Sensors were calibrated where a series of each measurement is taken in connection with samples of volumetric soil to quantify the relationship between the substrate (measured with the 5TM) and the volumetric water content (WC). The sensors were installed 10 cm below the substrate surface at the center of each sample pot. The use of the probes was preceded by their calibration to determine the real content of water in the substrate samples, which were placed in a thermo-ventilated oven at 70 °C until the constant weight (W cal.) reached (R2 = 0.9742). The irrigation, scheduled at 8:00 a.m. and at 7:00 p.m., was activated when the water content dropped below the pre-set threshold values of WC 10% (severe drought stress), WC 20% (moderate drought stress), WC 30% (light drought stress), and WC 40% (control, Capacity Control) of the volume of the substrate. The same threshold values were adopted to determine irrigation interruption. Full composition of saline aerosol solution was as follows: NaCl, Na2SO4, MgCl2, CaCl2, and KCl at concentrations of 23.48, 3.92, 4.98, 1.10, and 0.66 g L−1 respectively, with a concentration of 401.8 mM NaCl [43] while in the treatment S1 it was reduced to 50%. The treatments were performed by spraying the canopies of plants twice a week.
For each species, triplicates of four plants for 12 treatments (144 plants in total for each species) were adopted. The mean air temperatures and relative humidity levels during the experimental periods were registered on a data logger (CR 1000; Campbell Scientific Ltd., Loughborough, UK). The mean temperature was 25.2 °C, the relative humidity levels were 66% (Figure S1) and mean photosynthetic active radiation (PAR) was 13.7 MJ m−2 d−1.

2.2. Biomass and Leaf Area

At the end of the experiment, six plants per treatment were separated into stems, leaves, and roots. The dry biomass was determined by drying weighed fresh samples in a thermo-ventilated oven at 70 °C up to constant weight. Total leaf area was measured with leaf area meter (Delta-T Devices Ltd., Cambridge, UK) and the SPAD index of 25 fully expanded leaves per each replicate was registered using a SPAD-502 chlorophyll meter (Minolta Camera Co., Osaka, Japan).

2.3. Leaf Gas Exchanges, Chlorophyll a Fluorescence, and Relative Water Content

At 7, 15, 30, 45, and 60 days from experiment onset, leaf gas exchange was measured using a CO2/H2O infrared gas analyzer (LCi, ADC Bioscientific Ltd., Hoddesdon, UK). The measurements were carried out from 09:00 a.m. to 1:00 p.m. For each treatment, net photosynthetic rate (AN) and stomatal conductance (gs) were measured. The mean irradiance was 224.6, 149.2, 137.0, 170.4, and 290.6 µM m−2 s −1 of photosynthetically active radiation (PAR) at day 7, 15, 30, 45, and 60 respectively. With a normal concentration of CO2, the temperature in the measurement chamber was 32.1, 33.3, 32.3, 33.9, and 32.9 °C at day 7, 15, 30, 45, and 60 respectively; the H2O reference as partial pressure was 20.1, 19.4, 23.6, 20.5, and 22.4 mBar at the day 7, 15, 30, 45, and 60 respectively.
The chlorophyll a fluorescence was measured using the modulated chlorophyll fluorimeter OS1-FL (Opti-Sciences Corporation, Tyngsboro, MA, USA). Under abiotic stress conditions, one parameter that is commonly used to identify the presence of photosynthetic plant damage in plants is the measurement of chlorophyll a fluorescence. The ratio variable to maximal fluorescence ratio (Fv/Fm) (i.e., the maximum primary photochemical efficiency of the PSII) allows the evaluation of the efficiency of the PSII photosystem, indirectly measuring the physiological state of the plant. Every leaf was dark-adapted using cuvette clips for 15 min. The chlorophyll a fluorescence was expressed as the Fv/Fm ratio, which indicates the maximal quantum yield of PSII photochemistry, where Fm = the maximal fluorescence and Fv = the variable fluorescence.
The Relative Water Content (RWC) was measured at the end of the trial between 12:00 a.m. and 2:00 p.m. For the determination of RWC, 30 leaf discs of 10 mm in diameter, per each replicate were collected, and their fresh weights (FW) were registered. Samples were then soaked for 24 h in distilled water in dark conditions and their turgid weight (TW) was determined. The samples later were dried at 75 °C up to constant dry weight (DW). The RWC was measured by using the following formula
RWC% = (FW − DW/TW − DW) × 100

2.4. Statistical Analysis

The experimental design was a completely randomized experiment with three replicates. The CoStat version 6.311 (CoHortSoftware, Monterey, CA, USA) was used for statistical analysis. Data were subjected to three-way ANOVA to compare the effects of drought (D), saline aerosol (A), and species (S). For each species, data were subjected to two-way ANOVA to compare the effects of drought and saline aerosol treatments. The differences between means were conducted by Tukey’s test (p < 0.05). The data presented in Figures are means ± standard error (SE) (Graphpad 7.0). The Heat map was realized using Graphpad 7.0. The principal component loading plot and scores of PCA were performed using Minitab 16, LLC.

3. Results

Statistical analysis results, main and interaction effects of drought, salinity, and species on morphometric parameters were reported in Table 1. Three-way ANOVA showed that the morphometric characteristics were affected by drought, saline stress, and species (Table 1). The statistical analysis revealed that total biomass data were statistically different for drought and saline aerosol factors and interactions among all three factors were also significant. Epigeous biomass and leaf number data were statistically significant for all factors and interactions. Significant differences were detected in the root/shoot ratio for the three factors, while the interactions were only significant for DxS and AxS. Total leaf area was statistically significant for the three factors and interactions, except AxS. SPAD data were significantly different for saline aerosol and species, while the only significant interaction was the AxS.
To better understand effects of drought and saline aerosol stress, two species were separately analyzed. The individual and the combined effects of drought and saline aerosol stress on plant growth were reported in Table 2 and Table 3.
In Callistemon, the total dry biomass was affected by drought and saline treatment, but no interaction was detected among the experimental factors. Drought effect on total dry biomass showed a reduction in WC 30%, WC 20% and WC 10% of about 10%, 22%, and 28% respectively. Saline stress also caused a reduction for this parameter by ~10% for S1 and S2 compared with the S0 (Table 2).
In Callistemon, the epigeous dry biomass showed a similar trend as the total dry biomass with a reduction by ~10, 24, and 33% WC 30%, WC 20%, and WC 10% respectively as compared with the control (Table 2). Saline stress as well affected a reduction for this parameter by ~9% for S1 and S2 compared with the S0 (Table 2).
The root-to-shoot ratio increased in Callistemon plants grown under higher deficit irrigation (WC 10%) as well as for the saline stress conditions in S1 and S2, with an increase by 36% (Table 2, Figure 1a).
The combination of two abiotic stresses resulted in a greater decrease in total leaf area, as shown by the lower values obtained for the WC 10%, S0, S1, and S2 (Table 2, Figure 1b).
Similarly at the total leaf area, the combination of the two stresses resulted in a greater decrease in the leaf number in WC 10% S0, S1, and S2 (Table 2, Figure 1c).
In Viburnum plants, the total dry biomass varied with drought, but not with saline aerosol treatment. Drought affected total dry biomass, which showed a reduction in WC 30%, WC 20%, and WC 10% of ~14%, 18% and 23% respectively, compared with control. The saline stress, instead, did not show any significant reduction (Table 3).
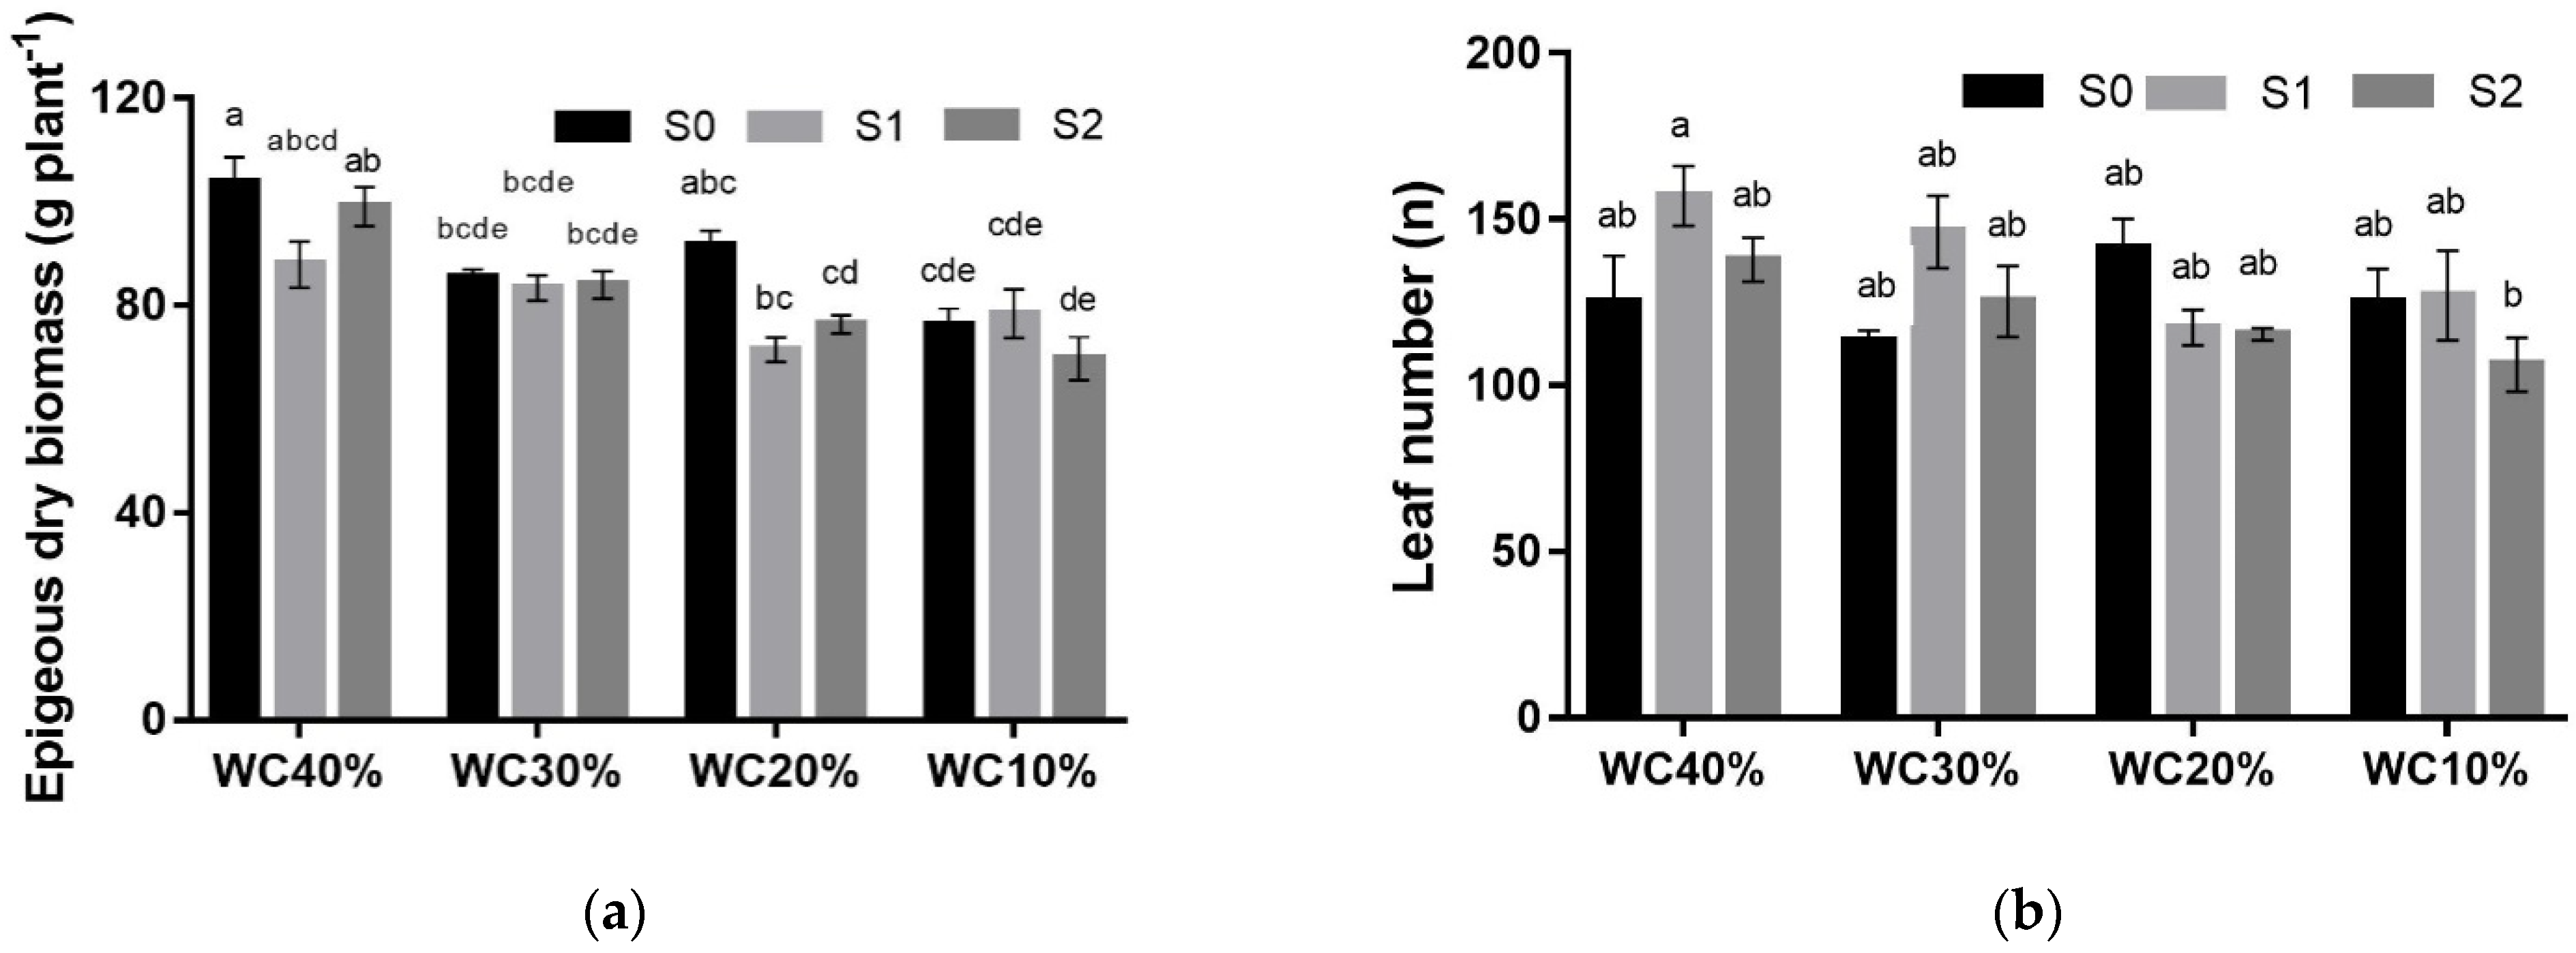
The combined effects of drought and saline aerosol stress showed a significant interaction (Table 3) while the highest decrease was observed from WC 10% S2 (~33%) compared with the control plants (Table 3, Figure 2a).
The root-to-shoot ratio varied with saline aerosol stress but not with drought and the interaction among them (Table 3). An increase in Viburnum plants grown under saline aerosol stress (S1) was observed with an increase by ~20% compared with the control plants (Table 3).
In Viburnum plants, the total leaf area varied with drought and saline treatment, but no interaction was significant. Drought reduced the total leaf area in WC 30%, WC 20%, and WC 10% by ~16%, 19% and 24% respectively compared with the control plants (Table 3). Saline stress also affected a reduction for this parameter by ~18% for S1 and by 11% for S2 compared with the S0 (Table 3).
At the end of the experiment, with the intensification of water and saline aerosol stress (WC 10% S2), a reduction in leaf number was observed. In particular, leaf number decreased by 33% compared with WC 40% and S1 (Figure 2b).
In Callistemon plants, the combination of the two stresses together resulted in a significant decrease for SPAD index, as shown by the lowest values obtained for the WC 10% in S1 and S2 (Figure 3a). No interaction effects were observed in Viburnum plants (Figure 3b).
Leaf damage was observed in both species and in particular in Callistemon plants, although the percentage of leaf damaged was always lower than 10% (data not shown).
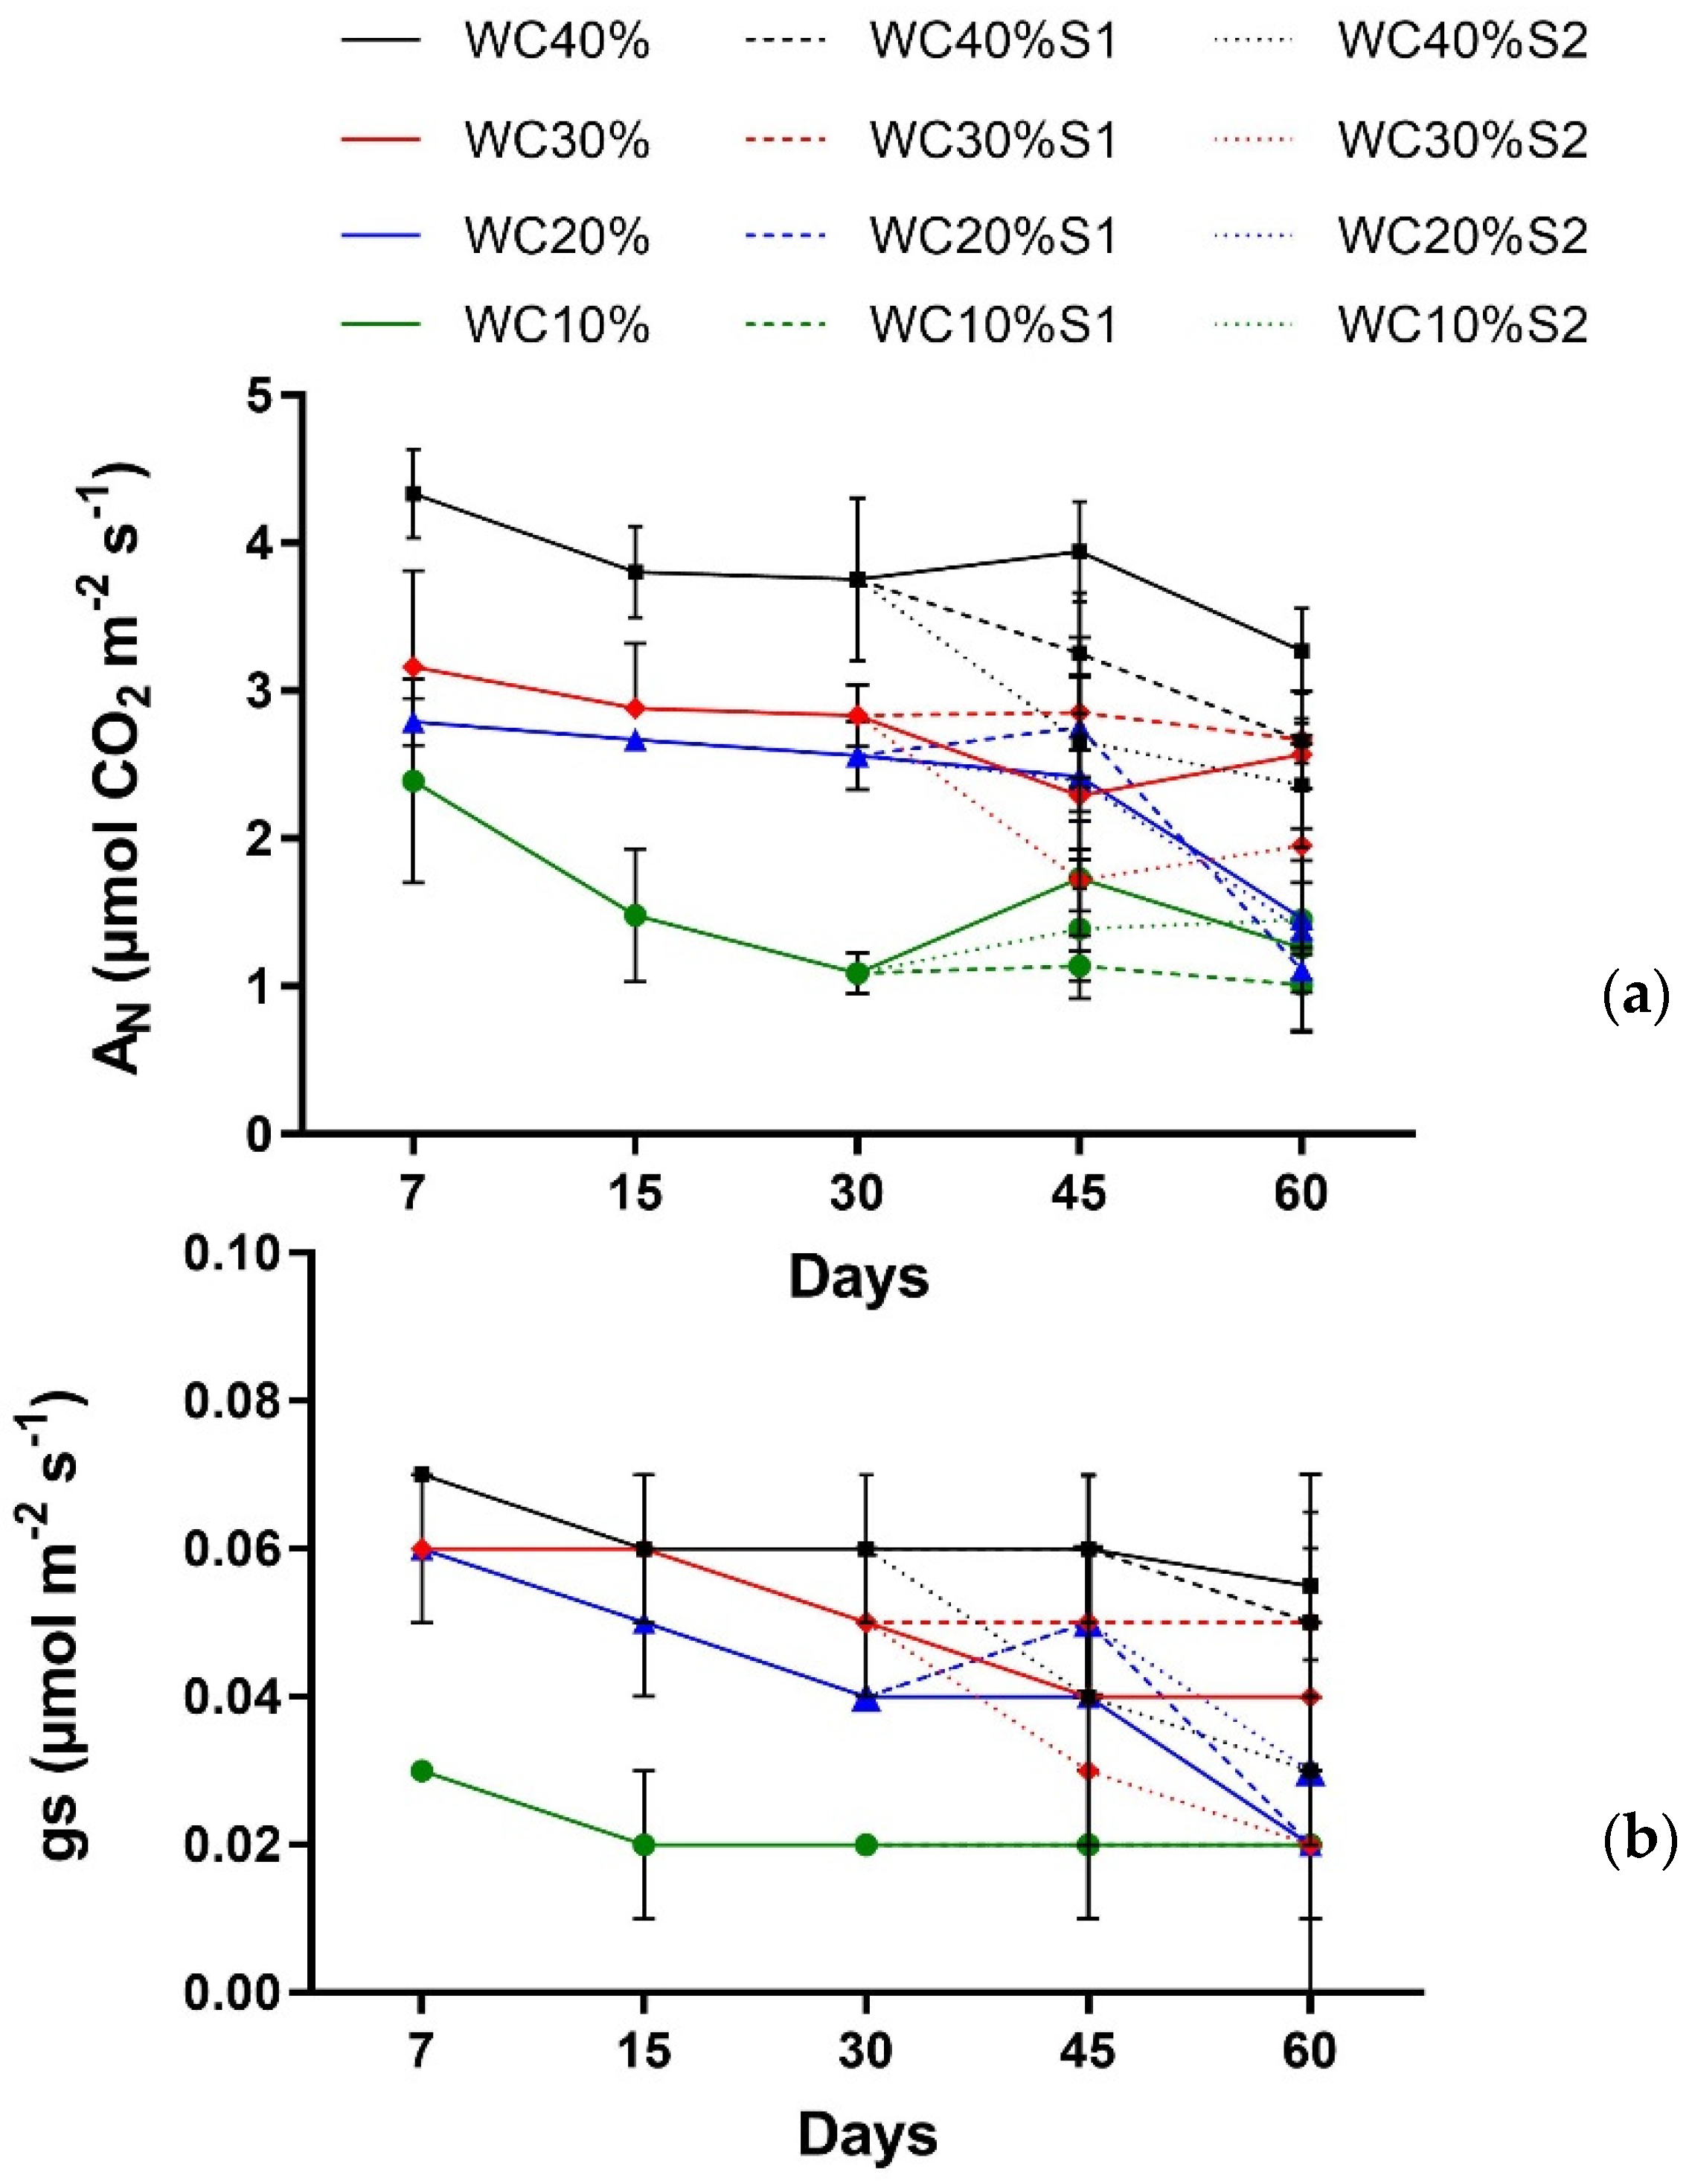
Gas exchange measurements in Callistemon plants were severely affected under water deficit. The AN was reduced by water deficit and plants exposed to severe water stress (WC 10%) for 30 days (p < 0.0026 **) showed a reduction by 70% compared to control. At the end of the trial, 60 days, with a reduction by 45% and 53% in WC 20% and WC 10% plants (p < 0.0002 ***). The addition of saline aerosol stress, after 30 days, differences were amplified comparing treatments with control plants, and at the end of the trial, Callistemon showed significant differences (p < 0.0001 ***) in WC 20% S1 and S2 and WC 10% S0, S1, and S2 treatments compared with the control plants (Figure 4a, Table 4).
The gs in Callistemon plants was reduced in WC 10% after 7 days (p < 0.0068 **). At 30 days significant differences (p < 0.0000 ***) were observed in the more stressed treatments (WC 20% and WC 10%). No significant differences were observed at the end of the trial (p > 0.5225 ns) (Figure 4b, Table 4).
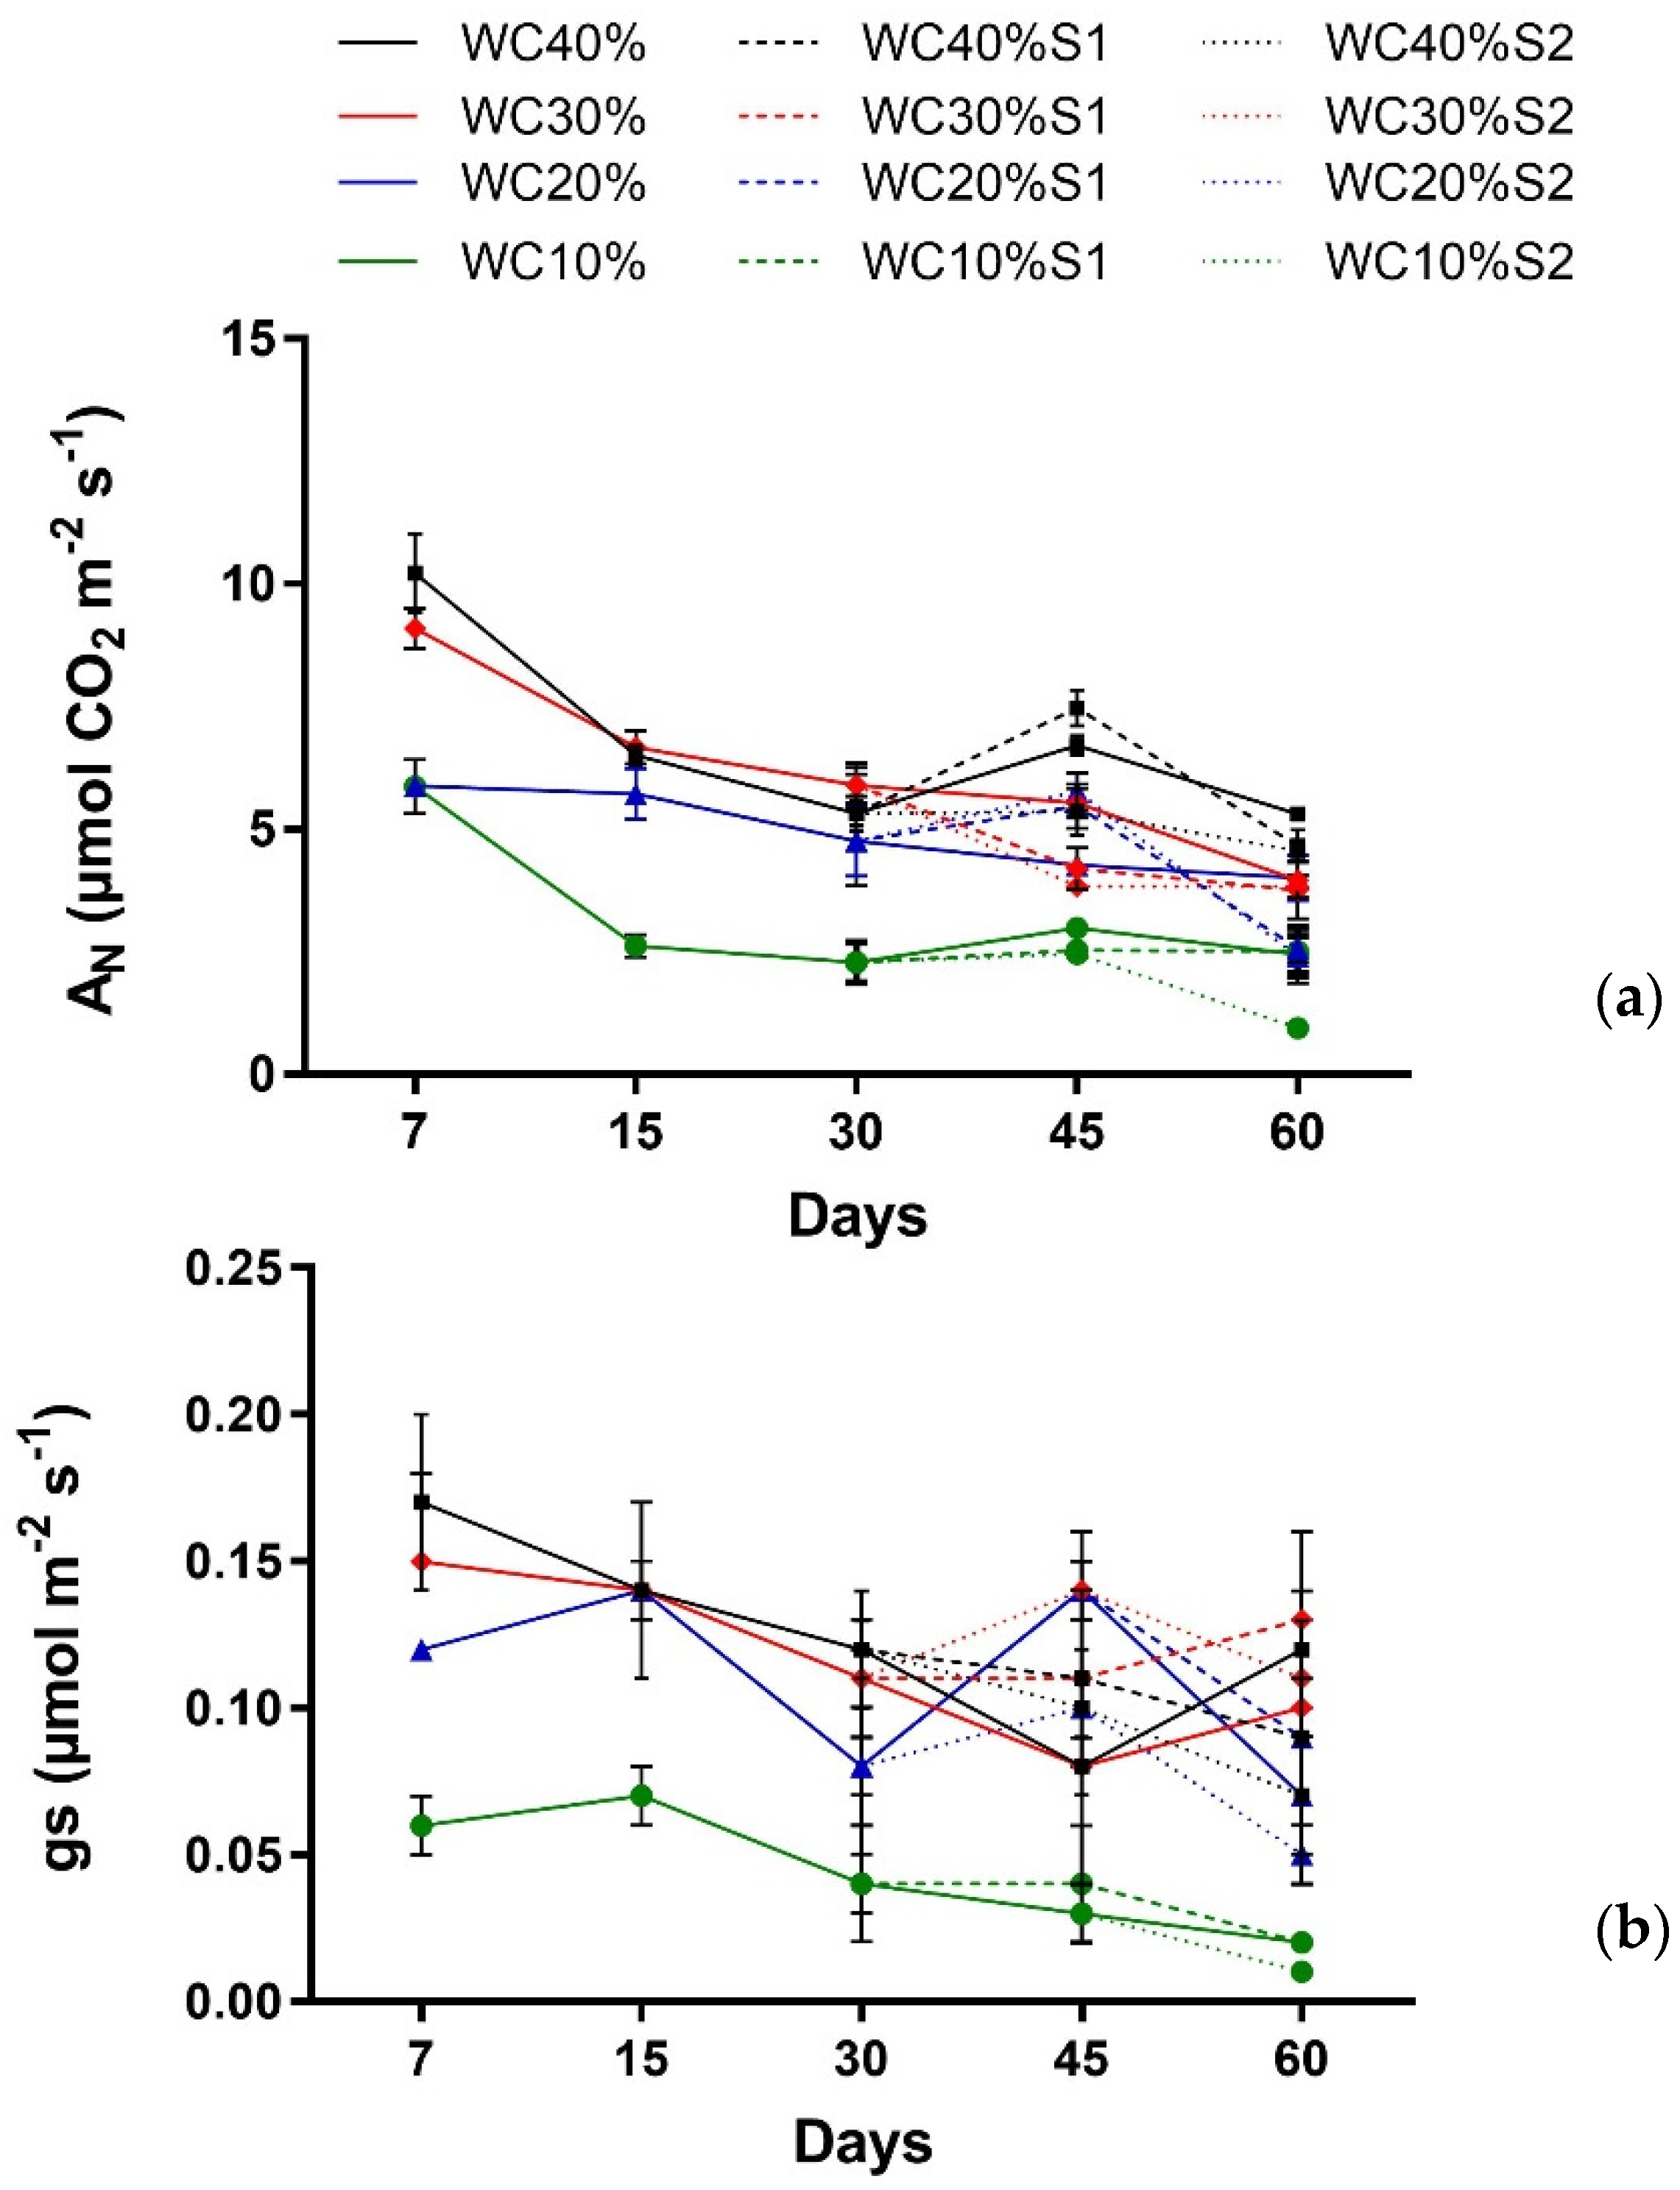
In Viburnum plants, as observed for Callistemon, since the first measurement (7 days) a decrease of net photosynthesis was observed for the more stressed treatments (WC 20% and WC 10%, by 57%, p < 0.0068 **) and remained thereafter significant for the entire experimental period. With the addition of saline aerosol stress after 30 days, also for Viburnum plants, the differences with the control plants, at the end of the trial, were more pronounced in WC 20% S1 and S2, and WC 10% S0, S1, and S2 (p < 0.0000 ***) (Figure 5a, Table 5).
The gs in Viburnum plants was reduced in WC 10% since the first measurement (p < 0.0068 **). At 30 days significant differences (p < 0.003 **) were observed in the more stressed treatments (WC 20% and WC 10%). With the addition of saline aerosol stress the differences with the control plants, at the end of the trial, were more pronounced in WC 10% S0, S1, and S2 (p < 0.0009 ***) (Figure 5b, Table 5).
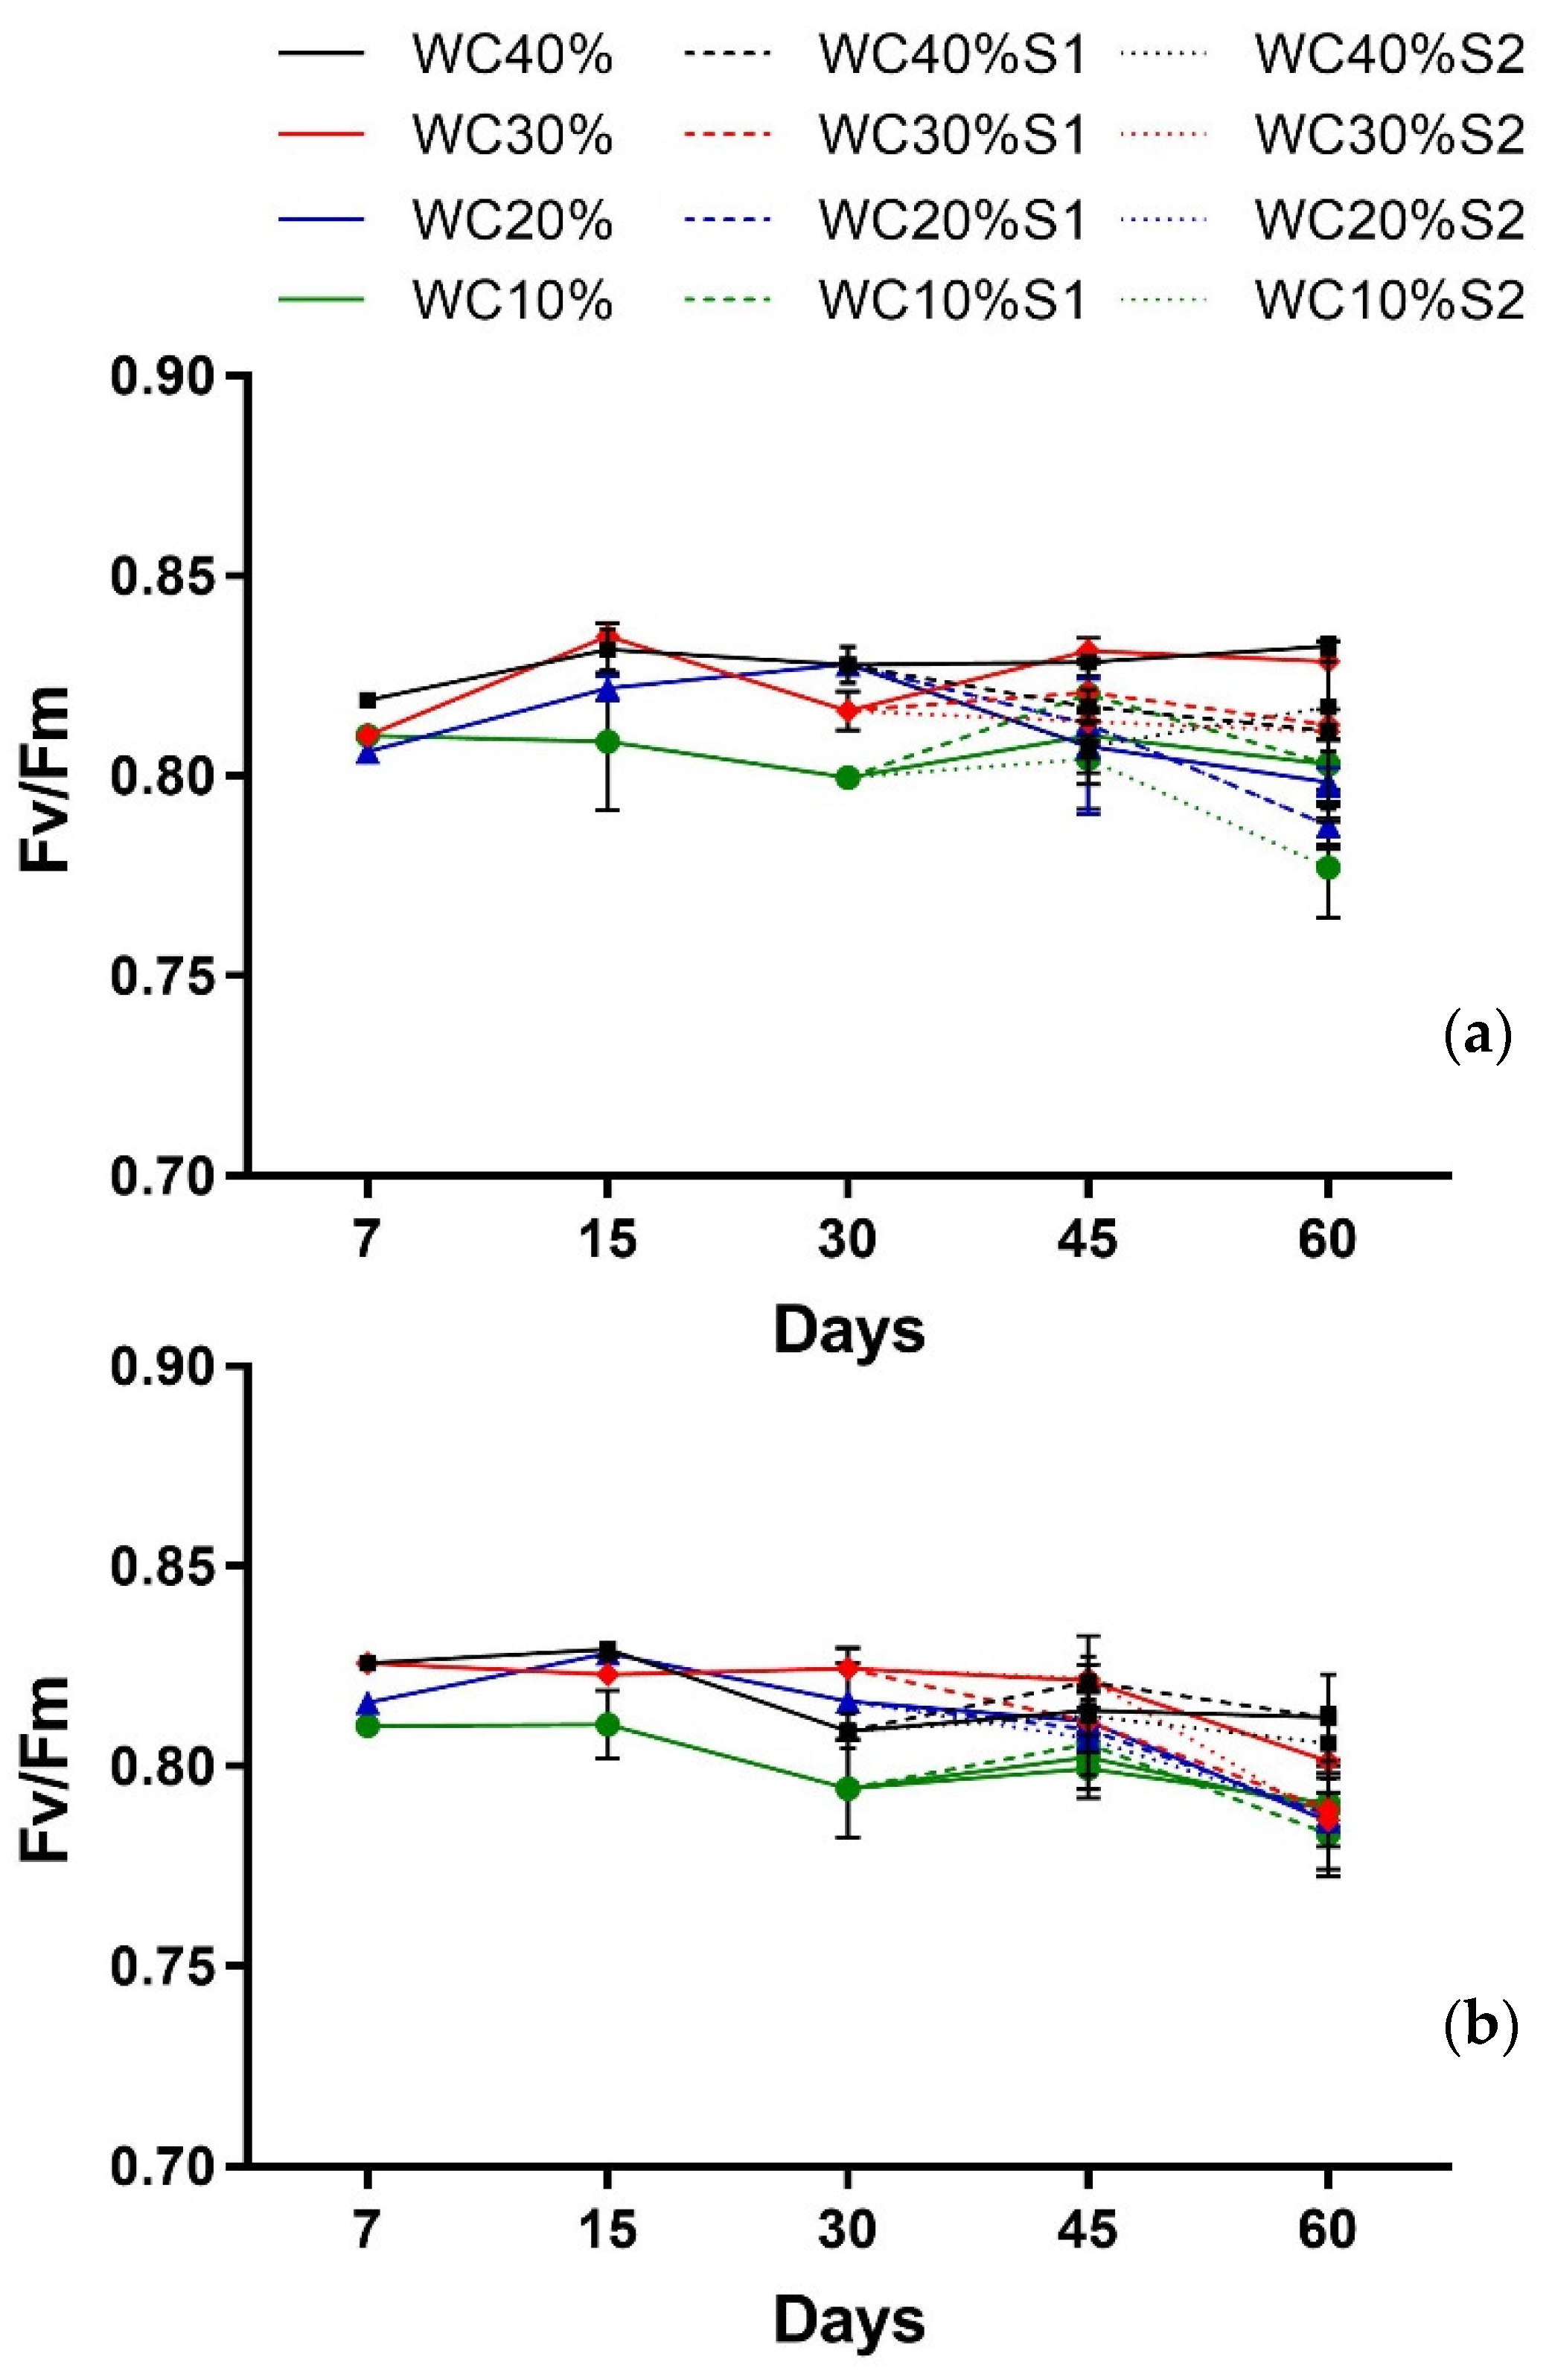
Chlorophyll a fluorescence is a good non-destructive marker of stress in plants. In our experiment, the maximum quantum efficiency of PSII (Fv/Fm ratio) decreased at the end of the experiment in both species. The Fv/Fm ratio in Callistemon showed significant differences (p < 0.0034 **) at the end of the experiment in WC 20% and WC 10% S0, S1, and S2 treatments compared with the control plants (Figure 6a, Table 6). No significant differences for Fv/Fm were observed between WC 30% and control plants (Figure 6a). Significant differences was observed in Viburnum at the end of the trial in WC 20% S0, S1, and S2 and WC 10% S0 and S1 (p < 0.0000 ***) compared with the control plants (Figure 6b, Table 6).
In Callistemon the RWC was only influenced by drought treatments and, in the most stressed treatment (WC 10%), the decrease from the control (WC 40%) was by 37%; in Viburnum, instead, the RWC was influenced by saline aerosol stress with a decrease in the more stressed treatments by 8% (Figure 7a,b).
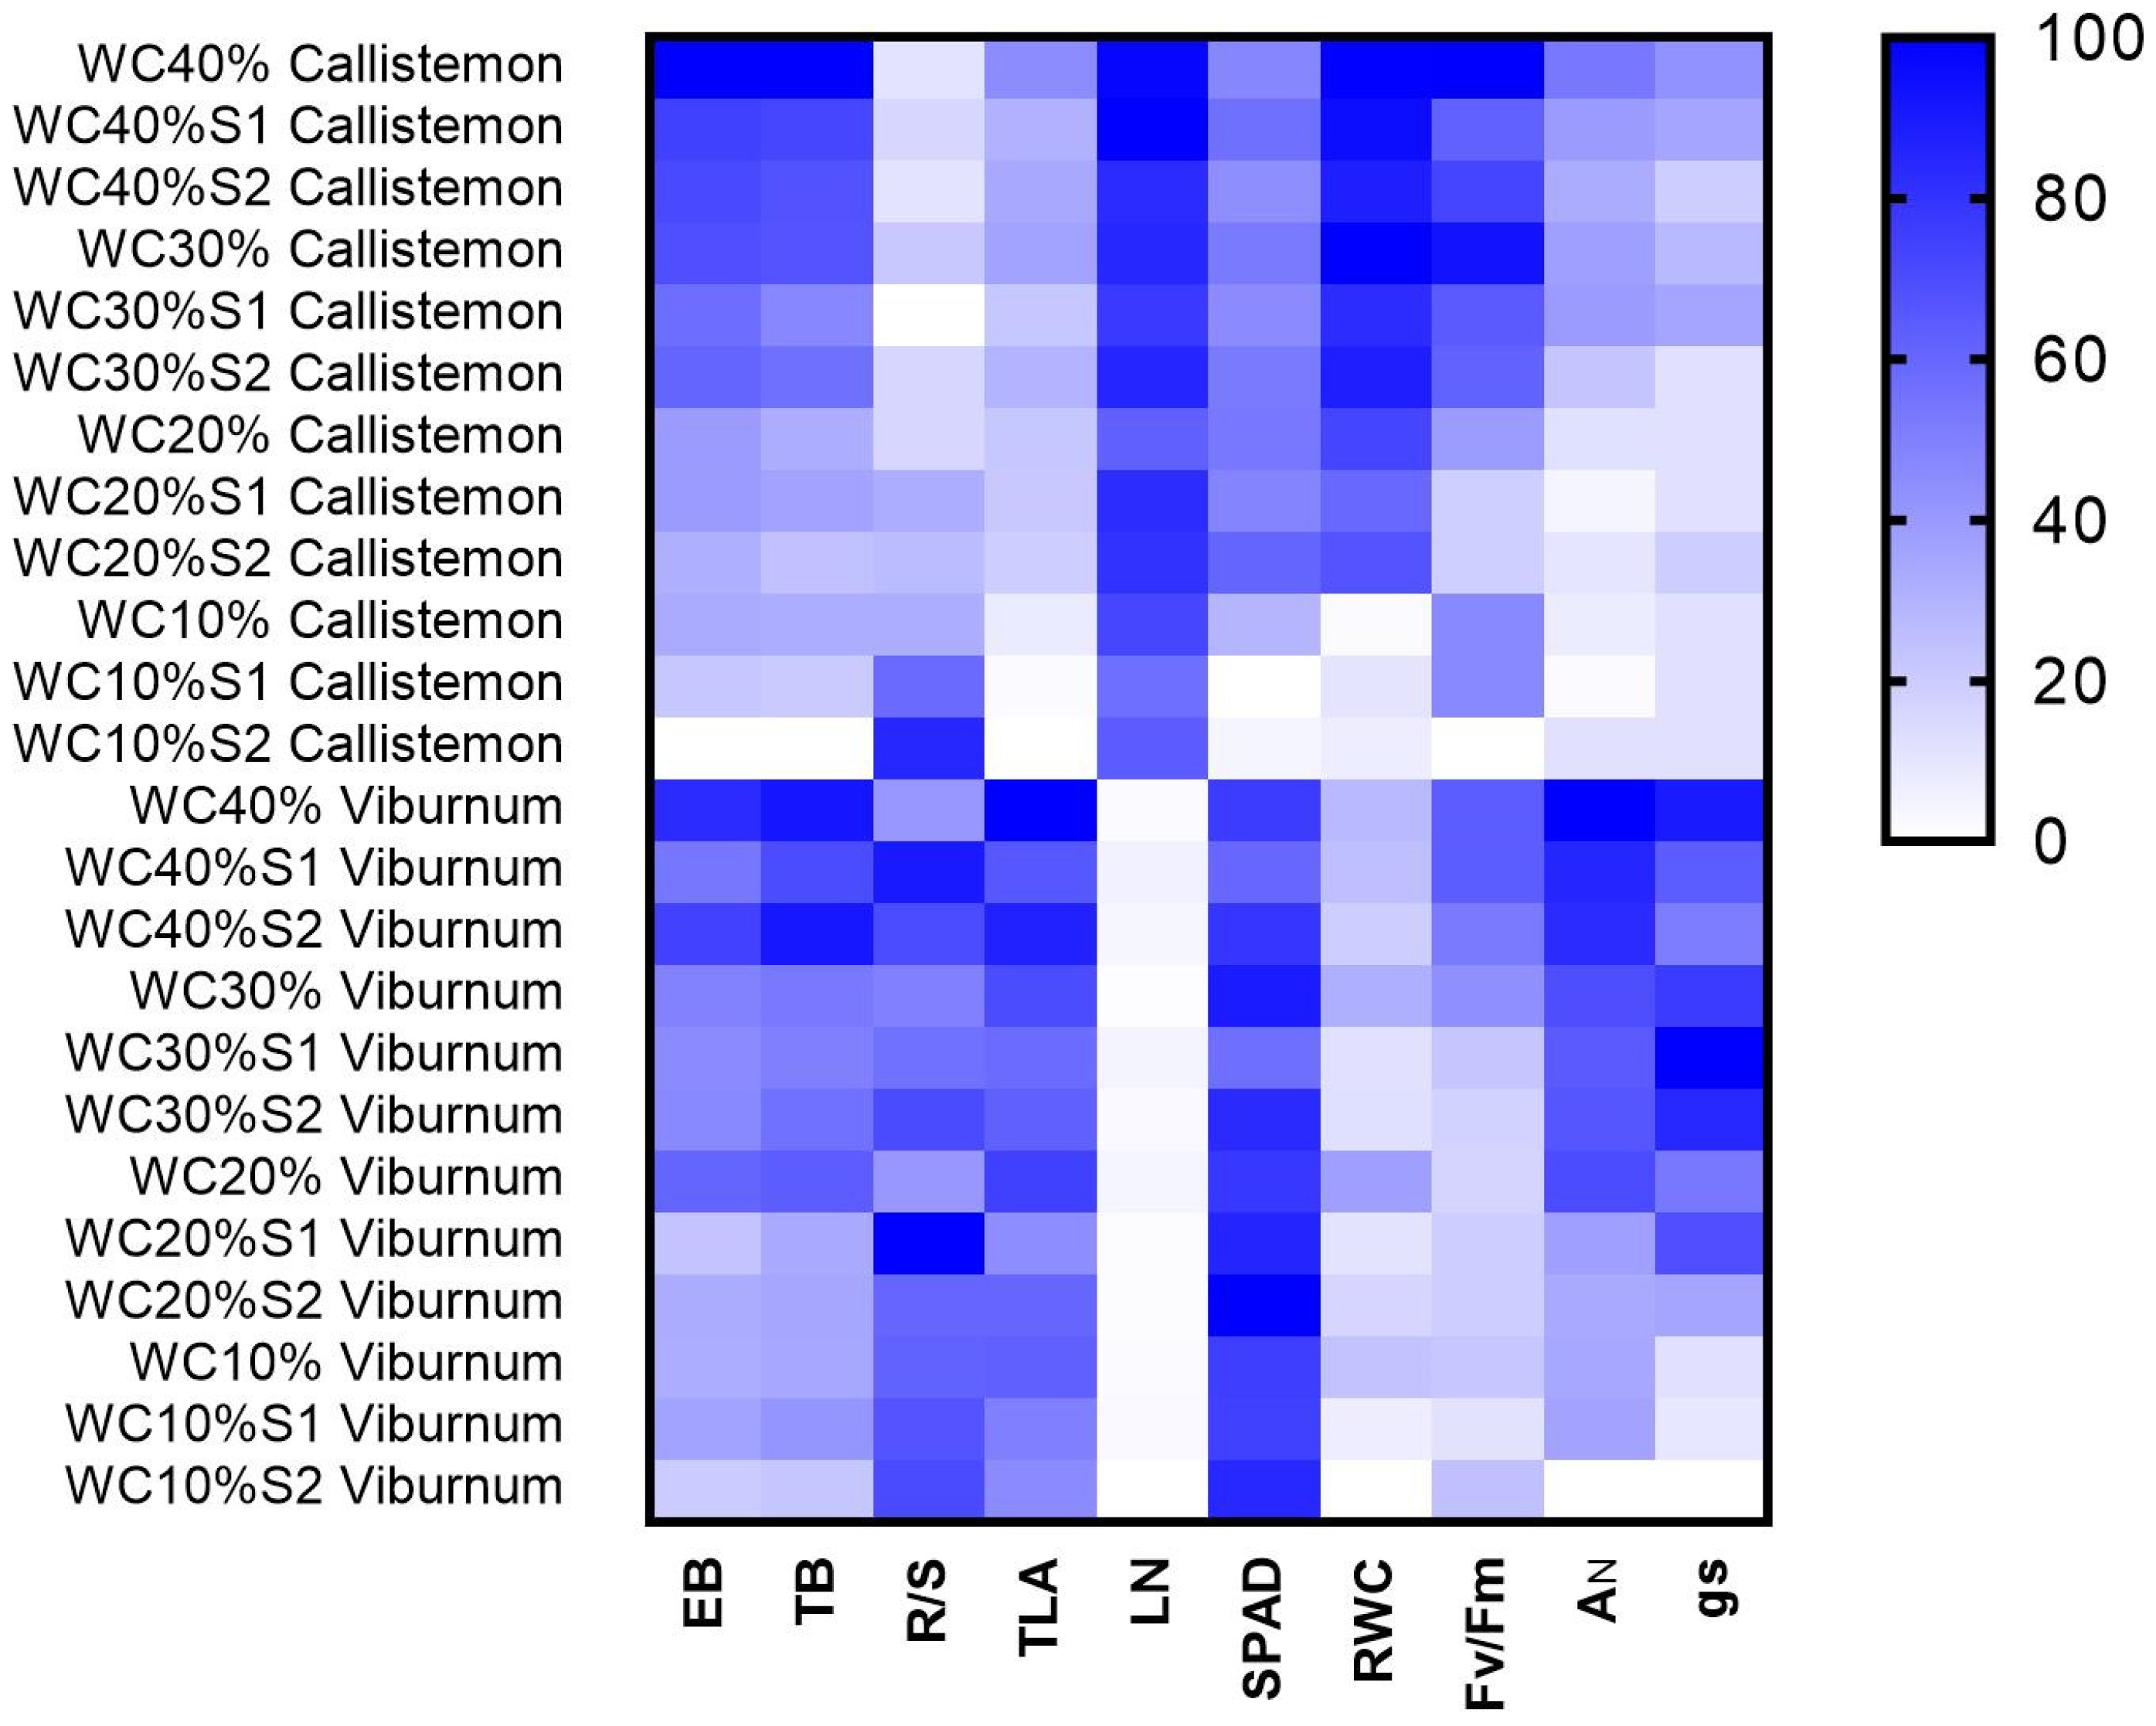
To visualize the effects of drought and saline aerosol stress on the relationships among the measured parameters, a correlation-based heat map was displayed (Figure 8). The heat map clearly revealed a considerable variation among the lines in their responses to progressive drought stress and interaction with saline aerosol stress. Cumulative effects of increasing the drought quantity and salinity levels have resulted in higher decreases in vegetative growth. Under severe treatments, the total and epigeous dry biomass decreased in all lines, while the R/S ratio increased in both species. The reduction of the total leaf area and the total leaf number was specifically observed in Callistemon. In Callistemon the combination of the two stresses together resulted in a significant decrease in SPAD values while effects were observed in Viburnum. Irrigation and saline aerosol treatments noticeably affected the leaf relative water content (RWC), chlorophyll a fluorescence (Fv/Fm) in the most stressed Callistemon plants; the differences in net photosynthetic activity (AN) and stomatal conductance (gs) were more prominently in Viburnum plants.
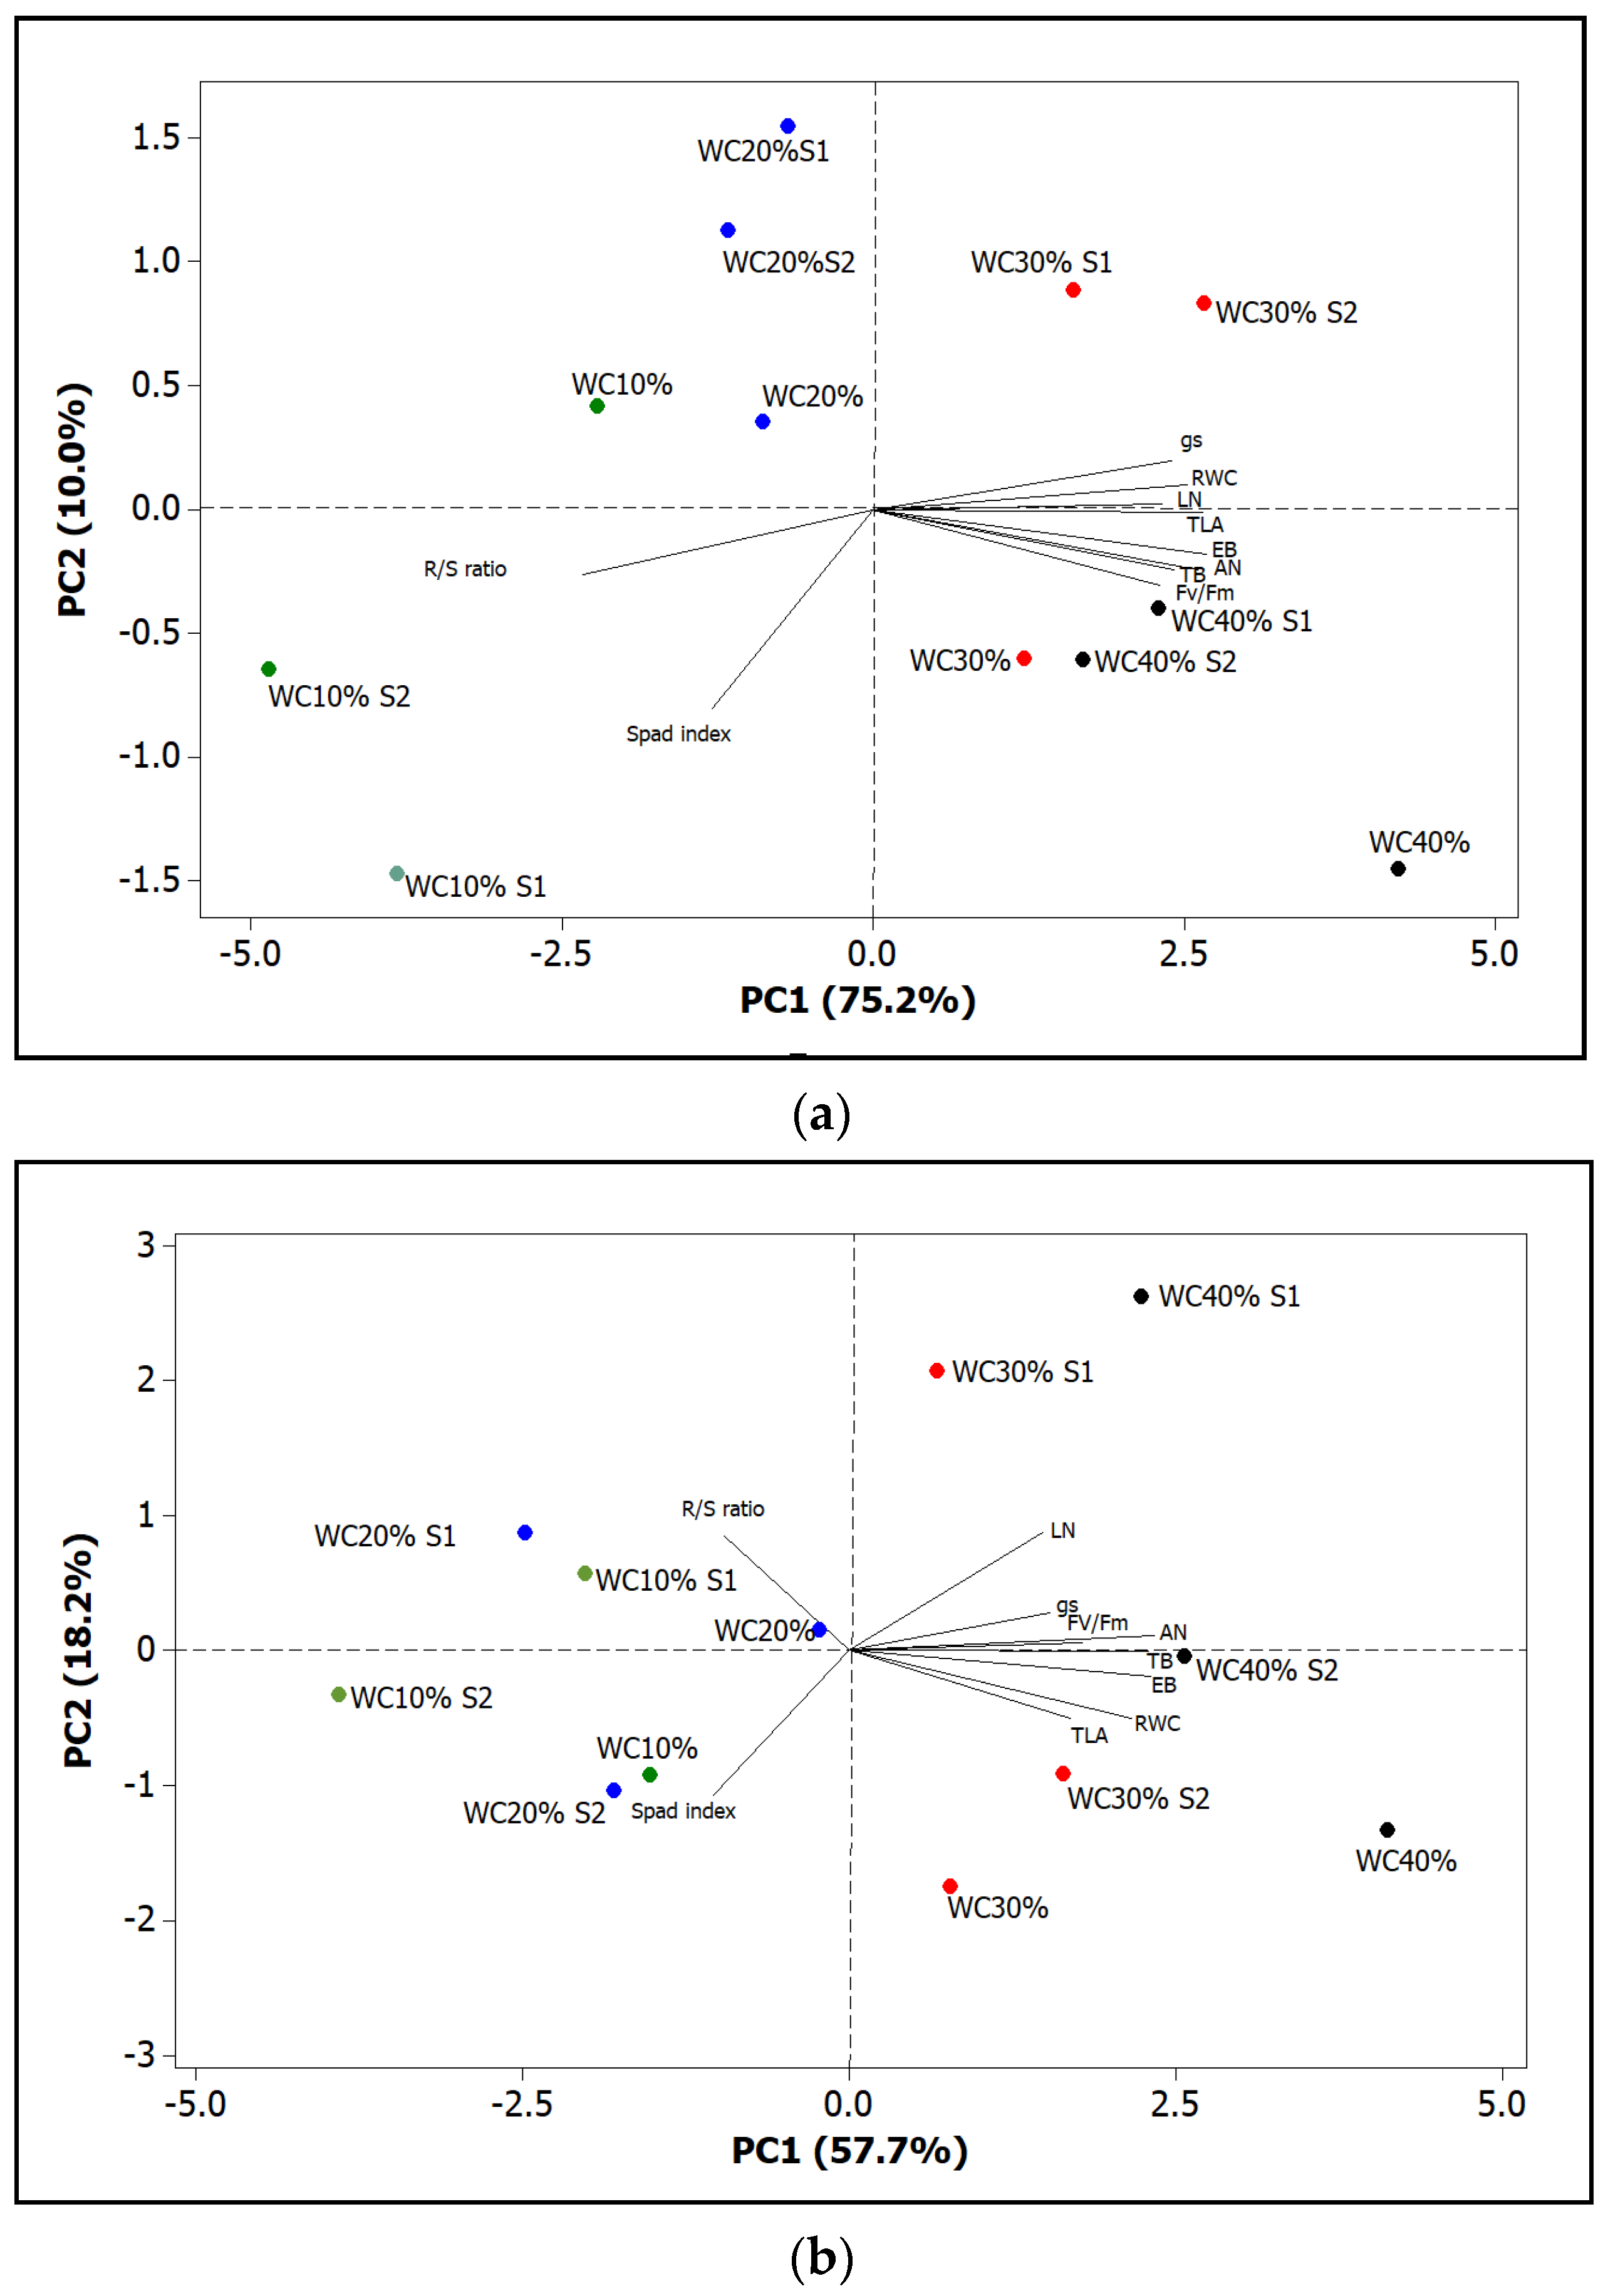
From the PCA analysis, effects were summary score plot, similar response of the two species to drought and saline aerosol stress treatments were observed (Figure 9a,b). In Callistemon, the first two PCs were related with eigen values >1 and explained more than 80% of the total variance, with PC1 and PC2 accounting for 75.2% and 10.0%; in Viburnum the values were 57.7% and 18.2% respectively for PC1 and PC2. The PCA showed that the most morphological and physiological parameters were associated in Callistemon with the WC 40% and WC 30% and related saline treatments, whereas the Spad index and R/S ratio, were associated with the WC 10% S1 and WC 10% S2 (Figure 9a).
In Viburnum, the most important morphological and physiological parameters were also associated with the WC 40% and WC 30% and saline treatments, the SPAD index was associated with WC 20% S2, WC 10%, and WC 10% S2, whereas the R/S ratio with WC 20%, WC 20% S1, and WC 10% S1 (Figure 9b).

4. Discussion

The selection of ornamental plants tolerant/resistant to number of stresses is a priority to increasing the private or public gardens, in urban and peri-urban coastal areas, but information in literature to discriminate the response of plant species to abiotic stress and hence help the plant species choice is lacking [2]. In our study, two ornamental shrubs exposed to drought and subsequently saline aerosol for 4 weeks showed different responses. The analysis of physiological and morphological traits presented in this study may help to clarify the different strategies adopted by these species. In our study, the interaction between drought and saline aerosol stress was responsible for plant growth parameters in both shrubs. Dry biomass in Callistemon plants decreased under drought and saline aerosol treatments without interaction effects. In Viburnum, the effects of the two stresses appeared to be more evident in epigeous dry biomass; in fact, the differences due to the drought and saline aerosol stresses were more pronounced than in total biomass. Plants subjected to drought stress did not show the same amount of total biomass compared to plants grown under optimal irrigation, and these reductions also increased when saline aerosol stress was imposed. Significant interactions were observed between the water regime and saline aerosol treatment: plants, under the WC 10% treatment, were the most stressed due to the lack of water and were the most affected by the adoption of the saline solution. Species’ response to stresses in terms of growth is the final manifestation of several interacting physiological and biochemical parameters and has been often used to characterize salinity or drought tolerance [44].
When plants are subjected to drought and/or saline stresses, the reduction of leaf area is considered an avoidance mechanism leading to the reduction of water losses by regulating the stomata closure, which is the most common defense strategy of many species under osmotic stress [45,46]. In our trial, the total leaf area of Callistemon showed interaction effects with differences due to saline aerosol in the control and light drought stress, while in Viburnum plants no interaction effects were observed. Previous attempts to study environmental stresses, such as drought, reported that plants can shift biomass allocation and change root/shoot ratios to cope with various environmental conditions [47]. It is proved that increasing R/S ratio is one of the avoidance mechanisms that enable plants to optimize water uptake under drought condition [48]. In presence of drought stress, plants need a wider root surface, while in saline aerosol stress conditions in some cases this surface can be even reduced to minimize toxic ions uptake and their consequent accumulation in the shoots, inducing in both situations a different distribution of the roots [49,50,51]. Our results reported that the plants of Callistemon in presence of severe drought stress and saline aerosol (10% WC S1 and S2), showed a higher R/S ratio thus optimizing water uptake.
Drought and salinity stresses induce the generic response of creating a physiological water deficit in plants. So far, interaction between drought and saline aerosol stress was reported to be detrimental for a number of physiological parameters, with the result of an increase of damage in plants under combined stress [52]. Both drought and salinity stresses induce a very complex photosynthetic response in plants, which occur in different leaf cell sites during the different steps of plants growth and development. The strength, length, and rate of development of the stress affect plant reactions to water shortage and salinity, because these issues dictate whether mitigation processes occur or not [53]. As a result, both single and overlapped water shortage and saline aerosol stress imposed to plants lead to drastic inhibition of net photosynthetic rate, stomatal conductance, and increased oxidative damage [52].
In our study, the photosynthetic rate and the stomatal conductance in both shrubs significantly decreased under both drought and saline aerosol treatments. As reported by Toscano et al., [54] in a study regarding two ornamental shrubs subjected by drought stress, a severe water deficit also had a negative effect on the photosynthetic rate and stomatal conductance of both species; however, these parameters were more affected, particularly in early summer, when these plants had very low gs values. Other studies reported that both stresses can adversely affect the photosynthetic activity in plants [55,56,57,58]. Good photosynthesis activity, even under salinity aerosol stress, can contribute to the biosynthesis of different related primary metabolism as an antioxidant defense mechanism, which help plants in detoxifying free radicals induced by stress conditions [43].
In this work, as expected, drought and saline aerosol stress resulted in reduced photosynthesis as a consequence of reduced CO2 assimilation following stomatal closure. Achou et al. [59] reported the same results in a study on tomato plants. Moreover, stomatal closure minimizes water loss by transpiration, which leads to a decrease in photosynthetic carbon assimilation [60,61,62] and affects osmotic regulation [63,64]. Beside the gas exchange analyses, the stress conditions can be also monitored using chlorophyll a fluorescence that is a non-destructive method, largely used in studying plant response and adaptation to stressful environments [43]. The reduction of Fv/Fm can help to assess the tolerance of different species to the different stresses.
The combination of drought stress and saline aerosol treatments determined significant reduction in the values of parameter Fv/Fm at the end of the experiment in both species in plants treated with severe water deficit (20% WC and 10% WC). This indicates that no photo-damage of PSII reaction centers or relaxing, developing slowly quenching excitation energy, occurred [65]. Instead, in the combination of the two stresses, the lower Fv/Fm values indicated that PSII had been damaged. In a study conducted by Umar et al. [66] the maximum quantum yield of PSII (Fv/Fm) decreased in all sunflower cultivars when exposed to combined stress as compared with control while the Fv/Fm was not much affected under salt and drought stress alone. A study on the effect of marine aerosol on ornamental plants showed that Callistemon citrinus has been considered as intermediate saline spray tolerant species [6]. The tolerance of the species was evaluated using chlorophyll a fluorescence and relative derived indexes, classifying this species as medium tolerant [6].
RWC is a strong parameter to detect water status in plant tissues and is more reliable than cell water potential since, through a direct connection with cell volume, it better demonstrates the balance between the plant water content and transpiration rate. In general, by increasing drought stress intensity, the reduction in RWC can be due to a decrease in water potential of leaves [67]. RWC is an indicator of the water status of plant tissues during drought stress. It decreases with the water deficit increase, although this reduction is genotype specific [68]. In particular, in Callistemon the reduction for effect of drought stress was of about 37%; in Viburnum differences were observed only in correspondence of saline aerosol. In our study, the lowest RWC was obtained at 10% WC treatment in Callistemon and at 10% WC, S1 and S2 in Viburnum.
Gas exchanges are closely related to the status of leaf water, which could be also considered indicators of stress under drought and saline conditions. In different studies it was reported that gas exchanges had a close relationship to leaf water status, in fact, the net photosynthesis of the plants decreased with the relative water content and leaf water potential [69,70,71]. Similar results were found in our experiment, where the more stressing treatments, showed a major reduction of RWC and gas exchanges.
To better understand the tolerance mechanisms to environmental stresses it is interesting to study and interpret the morphological and physiological parameters collected from plants grown under stressed and not-stressed conditions. Correlation analysis, PCA, and clustering give useful indication for evaluating the relationships between the parameters and their principal components for stress tolerance [72,73]. In our study, heat map and PCA showed that the differences in stress tolerance between Callistemon and Viburnum were largely linked to variations in physiological parameters, especially in Callistemon plants. The PCA analysis confirmed that the drought and saline aerosol treatments with higher water capacity did not differ between both shrubs analyzed, demonstrating that the level of stress did not influence the plant morphology and physiology. To overcome stressful conditions, plants implement a different change such as the increase in the R/S ratio and the increase in the SPAD index. A heat map is a visual method that can be useful to show the intensity of variation between multiple parameters measured from different treatments. After drought stress, the saline aerosol amplified the negative effects, especially in plants previously damaged by water shortage.
From the visual appearance and ornamental quality point of view, Viburnum showed lower changes compared with Callistemon at severe stress conditions. In mild stress conditions, Callistemon can also be considered as ornamental plants for garden and urban green areas.

5. Conclusions

The experiment demonstrates the combined effects of the two stresses investigated—drought and saline aerosol—on morphological and physiological parameters of two ornamental shrubs largely adopted in Mediterranean green areas near the sea. Both species showed a tolerance to saline aerosol, probably for the sclerophyll leaf characteristics, as demonstrated by small presence of leaf necrosis that can be associated to higher tolerance. Plants exposed to severe drought stress were more sensitive to saline aerosol, as demonstrated by marked reductions in plant morphological and physiological parameters. Results of this experiment can be useful for the utilization of these two species in coastal seaside green areas with or without irrigation systems and subjected to different degrees of salinity stress. The overall data analyses at morphological and physiological levels suggest that Viburnum tinus was the more tolerant species compared to Callistemon citrinus.

Supplementary Materials

The following are available online at https://www.mdpi.com/article/10.3390/horticulturae7120517/s1, Figure S1: Mean air temperature (°C) and relative humidity (%) during the trial.

Author Contributions

Conceptualization, S.T. and D.R.; Methodology, S.T.; Software, S.T.; Validation, D.R., A.T. and A.F.; Formal analysis, S.T.; Investigation, S.T.; Resources, D.R.; Data curation, S.T. and A.F.; Writing—original draft preparation, S.T., A.T. and D.R.; Writing—review and editing, S.T., D.R., A.F. and A.T.; Visualization, A.F.; Supervision, D.R. and A.T.; Funding acquisition, D.R. All authors have read and agreed to the published version of the manuscript.

Funding

This research received no external funding.

Institutional Review Board Statement

Not applicable.

Informed Consent Statement

Not applicable.

Data Availability Statement

Main data are contained within the article; further data presented in this study are available on request from the corresponding author.

Conflicts of Interest

The authors declare no conflict of interest.

References

  1. Savé, R.; Castell, C.; Terradas, J. Gas exchange and water relations. In Ecology of Mediterranean Evergreen Oak Forest; Rodá, F., Retama, J., Gracia, A., Bellot, J., Eds.; Ecological Studies, Springer: Berlin, Geramny, 1999; pp. 135–147. [Google Scholar]
  2. Farieri, E.; Toscano, S.; Ferrante, A.; Romano, D. Identification of ornamental shrubs tolerant to saline aerosol for coastal urban and peri-urban greening. Urban For Urban Green 2016, 18, 9–18. [Google Scholar] [CrossRef]
  3. Glenn, E.P.; Nelson, S.G.; Ambrose, B.; Martinez, R.; Soliz, D.; Pabendinskas, V.; Hultine, K. Comparison of salinity tolerance of three Atriplex spp. in well-watered and drying soils. Environ. Exp. Bot. 2012, 83, 62–72. [Google Scholar] [CrossRef]
  4. Álvarez, S.; Sánchez-Blanco, M.J. Comparison of individual and combined effects of salinity and deficit irrigation on physiological, nutritional and ornamental aspects of tolerance in Callistemon laevis plants. J. Plant Physiol. 2015, 185, 65–74. [Google Scholar] [CrossRef] [PubMed] [Green Version]
  5. Abdelraheem, A.; Esmaeili, N.; O’Connell, M.; Zhang, J. Progress and perspective on drought and salt stress tolerance in cotton. Ind. Crops Prod. 2019, 130, 118–129. [Google Scholar] [CrossRef]
  6. Ferrante, A.; Trivellini, A.; Malorgio, F.; Carmassi, G.; Vernieri, P.; Serra, G. Effect of seawater aerosol on leaves of six plant species potentially useful for ornamental purposes in coastal areas. Sci. Hortic. 2011, 128, 332–341. [Google Scholar] [CrossRef]
  7. EEA-UNEP/MAP Action Plan, 2014. In Horizon 2020 Mediterranean Report toward Shared Environmental Information Systems (Technical Report No 6/2014); Publications Office of the European Union: Luxembourg, 2014; Available online: https://www.eea.europa.eu/publications/horizon-2020-mediterranean-report/file (accessed on 12 November 2021).
  8. Pinna, M.S.; Bacchetta, G.; Cogoni, D.; Fenu, G. Is vegetation an indicator for evaluating the impact of tourism on the conservation status of Mediterranean coastal dunes? Sci. Total Environ. 2019, 674, 255–263. [Google Scholar] [CrossRef]
  9. Domene, E.; Saurí, D. Urbanisation and water consumption: Influencing factors in the metropolitan region of Barcelona. Urban Stud. 2006, 43, 1605–1623. [Google Scholar] [CrossRef]
  10. Toscano, S.; Ferrante, A.; Romano, D. Response of Mediterranean ornamental plants to drought stress. Horticulturae 2019, 5, 6. [Google Scholar] [CrossRef] [Green Version]
  11. Araújo-Alves, J.P.L.; Torres-Pereira, J.M.; Biel, C.; De Herralde, F.; Savé, R. Effects of minimum irrigation technique on ornamental parameters of two Mediterranean species used in xerigardening and landscaping. Acta Hortic. 1999, 541, 353–358. [Google Scholar] [CrossRef]
  12. Giordano, M.; Petropoulos, S.A.; Rouphael, Y. Response and defence mechanisms of vegetable crops against drought, heat and salinity stress. Agriculture 2021, 11, 463. [Google Scholar] [CrossRef]
  13. Acquaah, G. Principles of Plant Genetics and Breeding, 2nd ed.; John Wiley & Sons, Ltd.: Chichester, UK, 2012; p. 740. [Google Scholar]
  14. Mittler, R. Abiotic stress, the field environment and stress combination. Trend Plant Sci. 2006, 11, 15–19. [Google Scholar] [CrossRef]
  15. Atkinson, N.J.; Urwin, P.E. The interaction of plant biotic and abiotic stresses: From genes to the field. J. Exp. Bot. 2012, 63, 3523–3543. [Google Scholar] [CrossRef] [Green Version]
  16. Kissoudis, C.; van de Wiel, C.; Visser, R.G.; van der Linden, G. Enhancing crop resilience to combined abiotic and biotic stress through the dissection of physiological and molecular crosstalk. Front. Plant Sci. 2014, 5, 207. [Google Scholar] [CrossRef] [PubMed] [Green Version]
  17. Ramegowda, V.; Senthil-Kumar, M. The interactive effects of simultaneous biotic and abiotic stresses on plants: Mechanistic understanding from drought and pathogen combination. J. Plant Physiol. 2015, 176, 47–54. [Google Scholar] [CrossRef] [Green Version]
  18. Suzuki, N.; Rivero, R.M.; Shulaev, V.; Blumwald, E.; Mittler, R. Abiotic and biotic stress combinations. New Phytol. 2014, 203, 32–43. [Google Scholar] [CrossRef] [PubMed]
  19. Sánchez-Blanco, M.J.; Rodriguez, P.; Morales, M.A.; Torrecillas, A. Comparative growth and water relations of Cistus albidus and Cistus monspeliensis plants during water deficit conditions and recovery. Plant Sci. 2002, 162, 107–113. [Google Scholar] [CrossRef]
  20. Cai, X.; Starman, T.; Niu, G.; Hall, C.; Lombardini, L. Response of selected garden roses to drought stress. HortScience 2012, 47, 1050–1055. [Google Scholar] [CrossRef] [Green Version]
  21. Lumis, G.P.; Hofstra, G.; Hall, R. Sensitivity of roadside trees and shrubs to aerial drift of deicing salts in soils around trees. J. Arboric. 1973, 20, 196–200. [Google Scholar]
  22. Sánchez-Blanco, M.J.; Rodríguez, P.; Morales, M.A.; Torrecillas, A. Contrasting physiological responses of dwarf sea-lavender and marguerite to simulated sea aerosol deposition. J. Environ. Qual. 2003, 32, 3338–3344. [Google Scholar] [CrossRef]
  23. Ashraf, M.; McNeilly, T.; Bradshaw, A.D. Tolerance of Holcus lanatus and Agrostis stolonifera to sodium chloride in soil solution and saline spray. Plant Soil 1986, 96, 77–84. [Google Scholar] [CrossRef]
  24. Wu, L.; Guo, X.; Harivandi, A. Salt tolerance and salt accumulation of landscape plants irrigated by sprinkler and drip irrigation systems. J. Plant Nutr. 2001, 24, 1473–1490. [Google Scholar] [CrossRef]
  25. Niinemets, Ü. Responses of forest trees to single and multiple environmental stresses from seedlings to mature plants: Past stress history, stress interactions, tolerance and acclimation. For. Ecol. Manag. 2010, 260, 1623–1639. [Google Scholar] [CrossRef]
  26. Bussotti, F.; Grossoni, P.; Pantani, F. The role of marine salt and surfactants in the decline of Tyrrhenian coastal vegetation in Italy. Ann. For. Sci. 1995, 52, 251–261. [Google Scholar] [CrossRef]
  27. Waisel, Y. Biology of Halophytes; Academic Press: New York, NY, USA, 1972; p. 410. [Google Scholar]
  28. Shannon, M.C. Adaptation of plants to salinity. Adv. Agron. 1997, 60, 75–120. [Google Scholar] [CrossRef]
  29. Boyce, S.G. The salt spray community. Ecol. Monogr. 1954, 24, 29–67. [Google Scholar] [CrossRef]
  30. Bussotti, F.; Bottacci, A.; Grossoni, P.; Mori, B.; Tani, C. Cytological and structural changes in Pinus pinea L. needles following the application of an anionic surfactant. Plant Cell Environ. 1997, 20, 513–520. [Google Scholar] [CrossRef]
  31. Schönherr, J.; Bauer, H. Analysis of effects of surfactants on permeability of plant cuticles. In Adjuvant and Agrichemicals; Foy, C.L., Ed.; CRC: Boca Raton, FL, USA, 1992; pp. 17–35. [Google Scholar]
  32. Jefree, E.J. The cuticle, epicuticular waxes and trichomes of plants, with reference to their structure, functions and evolution. In Insects and the Plant Surface; Juniper, B., Southwood, R., Eds.; Edward Arnold: London, UK, 1986; pp. 23–64. [Google Scholar]
  33. Esch, A.; Mengel, K. Combined effects of acid mist and frost drought on the water status of young spruce trees (Picea abies). Environ. Exp. Bot. 1998, 39, 57–65. [Google Scholar] [CrossRef]
  34. Burkhardt, J.; Basi, S.; Pariyar, S.; Hunsche, M. Stomatal penetration by aqueous solutions–an update involving leaf surface particles. New Phytol. 2012, 196, 774–787. [Google Scholar] [CrossRef]
  35. Rodríguez, P.; Torrecillas, A.; Morales, M.A.; Ortũno, M.F.; Sánchez-Blanco, M.J. Effects of NaCl salinity and water stress on growth and leaf water relations of Asteriscus maritimus plants. Environ. Exp. Bot. 2005, 53, 113–123. [Google Scholar] [CrossRef]
  36. Navarro, A.; Bañón, S.; Conejero, W.; Sánchez-Blanco, M.J. Ornamental characters, ion accumulation and water status in Arbutus unedo seedlings irrigated with saline water and subsequent relief and transplanting. Environ. Exp. Bot. 2008, 62, 364–370. [Google Scholar] [CrossRef]
  37. Vernieri, P.; Mugnai, S.; Borghesi, E.; Petrognani, L.; Serra, G. Non-chemical growth control of potted Callistemon laevis. Agric. Med. 2006, 160, 85–90. [Google Scholar]
  38. Gori, R.; Lubello, C.; Ferrini, F.; Nicese, F.P.; Coppini, E. Reuse of industrial wastewater for the irrigation of ornamental plants. Water Sci. Technol. 2008, 57, 883–889. [Google Scholar] [CrossRef] [PubMed]
  39. Álvarez, S.; Sánchez-Blanco, M.J. Long-term effect of salinity on plant quality, water relations, photosynthetic parameters and ion distribution in Callistemon citrinus. Plant Biol. 2014, 16, 757–764. [Google Scholar] [CrossRef] [PubMed] [Green Version]
  40. Cirillo, C.; De Micco, V.; Arena, C.; Carillo, P.; Pannico, A.; De Pascale, S.; Rouphael, Y. Biochemical, Physiological and Anatomical Mechanisms of Adaptation of Callistemon citrinus and Viburnum lucidum to NaCl and CaCl2 Salinization. Front. Plant Sci. 2019, 10, 742. [Google Scholar] [CrossRef]
  41. Starr, J.L.; Paltineanu, I.C. Methods for Measurement of SoilWater Content: Capacitance Devices. In Methods of Soil Analysis; United States Department of Agriculture, Agricultural Research Service: Washington, DC, USA, 2002. [Google Scholar]
  42. Tribulato, A.; Toscano, S.; Di Lorenzo, V.; Romano, D. Effects of water stress on gas exchange, water relations and leaf structure in two ornamental shrubs in the Mediterranean area. Agronomy 2019, 9, 381. [Google Scholar] [CrossRef] [Green Version]
  43. Toscano, S.; Branca, F.; Romano, D.; Ferrante, A. An evaluation of different parameters to screen ornamental shrubs for salt spray tolerance. Biology 2020, 9, 250. [Google Scholar] [CrossRef] [PubMed]
  44. Sidari, M.; Mallamaci, C.; Muscolo, M. Drought, salinity and heat differently affect seed germination of Pinus pinea. J. For. Res. 2008, 13, 326–330. [Google Scholar] [CrossRef]
  45. Savé, R.; Biel, C.; Domingo, R.; Ruiz-Sánchez, M.C.; Torrecillas, A. Some physiological and morphological characteristics of citrus plants for drought resistance. Plant Sci. 1995, 110, 167–172. [Google Scholar] [CrossRef]
  46. Ruiz-Sánchez, M.C.; Domingo, R.; Torrecillas, A.; Pérez-Pastor, A. Water stress preconditioning to improve drought resistance in young apricot plants. Plant Sci. 2000, 156, 245–251. [Google Scholar] [CrossRef] [Green Version]
  47. Zhou, G.; Zhou, X.; Nie, Y.; Bai, S.H.; Zhou, L.; Shao, J.; Cheng, W.; Wang, J.; Hu, F.; Fu, Y. Drought-induced changes in root biomass largely result from altered root morphological traits: Evidence from a synthesis of global field trials. Plant Cell Environ. 2018, 41, 2589–2599. [Google Scholar] [CrossRef]
  48. Chaves, M.M.; Maroco, J.P.; Pereira, J.S. Understanding plant responses to drought—From genes to the whole plant. Funct. Plant Biol. 2003, 30, 239–264. [Google Scholar] [CrossRef] [PubMed]
  49. Munns, R. Comparative physiology of salt and water stress. Plant Cell Environ. 2002, 25, 239–250. [Google Scholar] [CrossRef] [PubMed]
  50. Alarcón, J.J.; Morales, M.A.; Ferrández, T.; Sánchez-Blanco, M.J. Effects of water and salt stresses on growth, water relations and gas exchange in Rosmarinus officinalis. J. Hortic. Sci. Biotechnol. 2006, 81, 845–853. [Google Scholar] [CrossRef]
  51. Álvarez, S.; Castillo, M.; Acosta, J.; Navarro, A.; Sánchez-Blanco, M. Photosynthetic response, biomass distribution and water status changes in Rhamnus alaternus plants during drought. Acta Hortic. 2012, 937, 853–860. [Google Scholar] [CrossRef]
  52. Pandey, P.; Ramegowda, V.; Senthil-Kumar, M. Shared and unique responses of plants to multiple individual stresses and stress combinations: Physiological and molecular mechanisms. Front. Plant Sci. 2015, 6, 723. [Google Scholar] [CrossRef] [Green Version]
  53. Chaves, M.M.; Flexas, J.; Pinheiro, C. Photosynthesis under drought and salt stress: Regulation mechanisms from whole plant to cell. Ann. Bot. 2009, 103, 551–560. [Google Scholar] [CrossRef] [Green Version]
  54. Toscano, S.; Ferrante, A.; Tribulato, A.; Romano, D. Leaf physiological and anatomical responses of Lantana and Ligustrum species under different water availability. Plant Physiol. Biochem. 2018, 127, 380–392. [Google Scholar] [CrossRef]
  55. Farooq, M.; Basra, S.M.A.; Wahid, A.; Rehman, H. Exogenously applied nitric oxide enhances the drought tolerance in fine grain aromatic rice (Oryza sativa L.). J Agron Crop Sci. 2009, 195, 254–261. [Google Scholar] [CrossRef]
  56. Xu, C.; Leskovar, D.I. Growth, physiology and yield responses of cabbage to deficit irrigation. Hortic. Sci. 2014, 41, 138–146. [Google Scholar] [CrossRef] [Green Version]
  57. Ors, S.; Ekinci, M.; Yildirim, E.; Sahin, U. Changes in gas exchange capacity and selected physiological properties of squash seedlings (Cucurbita pepo L.) under well-watered and drought stress conditions. Arch. Agron. Soil Sci. 2016, 62, 1700–1710. [Google Scholar] [CrossRef]
  58. Ekinci, M.; Ors, S.; Yildirim, E.; Turan, M.E.T.İ.N.; Sahin, U.; Dursun, A.; Kul, R. Determination of physiological indices and some antioxidant enzymes of chard exposed to nitric oxide under drought stress. Russ. J Plant Physiol. 2020, 67, 740–749. [Google Scholar] [CrossRef]
  59. Achuo, E.A.; Prinsen, E.; Höfte, M. Influence of drought, salt stress and abscisic acid on the resistance of tomato to Botrytis cinerea and Oidium neolycopersici. Plant Pathol. 2006, 55, 178–186. [Google Scholar] [CrossRef]
  60. Adams, H.D.; Germino, M.J.; Breshears, D.D.; Barron-Gafford, G.A.; Guardiola-Claramonte, M.; Zou, C.B.; Huxmanet, T.E. Nonstructural leaf carbohydrate dynamics of Pinus edulis during drought-induced tree mortality reveal role for carbon metabolism in mortality mechanism. New Phytol. 2013, 197, 1142–1151. [Google Scholar] [CrossRef] [PubMed]
  61. Chen, L.; Zhang, S.; Zhao, H.; Korpelainen, H.; Li, C. Sex-related adaptive responses to interaction of drought and salinity in Populus yunnanensis. Plant Cell Environ. 2010, 33, 1767–1778. [Google Scholar] [CrossRef] [PubMed]
  62. Choat, B.; Brodribb, T.J.; Brodersen, C.R.; Remko, A.; Duursma, R.A.; Rosana López, R.; Medlyn, B.E. Triggers of tree mortality under drought. Nature 2018, 558, 531–539. [Google Scholar] [CrossRef]
  63. Hartmann, H.; Trumbore, S. Understanding the roles of nonstructural carbohydrates in forest trees—From what we can measure to what we want to know. New Phytol 2016, 211, 386–403. [Google Scholar] [CrossRef] [PubMed] [Green Version]
  64. Karst, J.; Gaster, J.; Wiley, E.; Simon, M.; Landhäusser, S.M. Stress differentially causes roots of tree seedlings to exude carbon. Tree Physiol. 2017, 37, 154–164. [Google Scholar] [CrossRef] [PubMed] [Green Version]
  65. Umar, M.; Uddin, Z.; Siddiqui, Z.S. Responses of photosynthetic apparatus in sunflower cultivars to combined drought and salt stress. Photosynthetica 2019, 57, 627–639. [Google Scholar] [CrossRef] [Green Version]
  66. Nogués, S.; Baker, N.R. Effects of drought on photosynthesis in Mediterranean plants grown under enhanced UV-B radiation. J. Exp. Bot. 2000, 51, 1309–1317. [Google Scholar] [CrossRef] [PubMed] [Green Version]
  67. Sharif, P.; Seyedsalehi, M.; Paladino, O.; Van Damme, P.; Sillanpää, M.; Sharifi, A.A. Effect of drought and salinity stresses on morphological and physiological characteristics of canola. Int. J. Environ. Sci. Technol. 2018, 15, 1859–1866. [Google Scholar] [CrossRef]
  68. Zhu, Y.; Luo, X.; Nawaz, G.; Yin, J.; Yang, J. Physiological and biochemical responses of four cassava cultivars to drought stress. Sci. Rep. 2020, 10, 6968. [Google Scholar] [CrossRef] [PubMed] [Green Version]
  69. Chaves, M. Effects of water deficits on carbon assimilation. J. Exp. Bot. 1991, 42, 1–16. [Google Scholar] [CrossRef]
  70. Lawlor, D.W. Limitation to photosynthesis in water-stressed leaves: Stomata vs. metabolism and the role of ATP. Ann. Bot. 2002, 89, 871–885. [Google Scholar] [CrossRef] [PubMed]
  71. Yan, W.; Zhong, Y.; Shangguan, Z. A meta-analysis of leaf gas exchange and water status responses to drought. Sci. Rep. 2016, 6, 20917. [Google Scholar] [CrossRef] [Green Version]
  72. Dehbalaei, S.; Farshadfar, E.; Farshadfar, M. Assessment of drought tolerance in bread wheat genotypes based on resistance/tolerance indices. Int. J. Agric. Crop Sci. 2013, 5, 2352–2358. [Google Scholar]
  73. Sun, J.; Luo, H.; Fu, J.; Huang, B. Classification of genetic variation for drought tolerance in Tall Fescue using physiological traits and molecular markers. Crop Sci. 2013, 53, 647–654. [Google Scholar] [CrossRef]
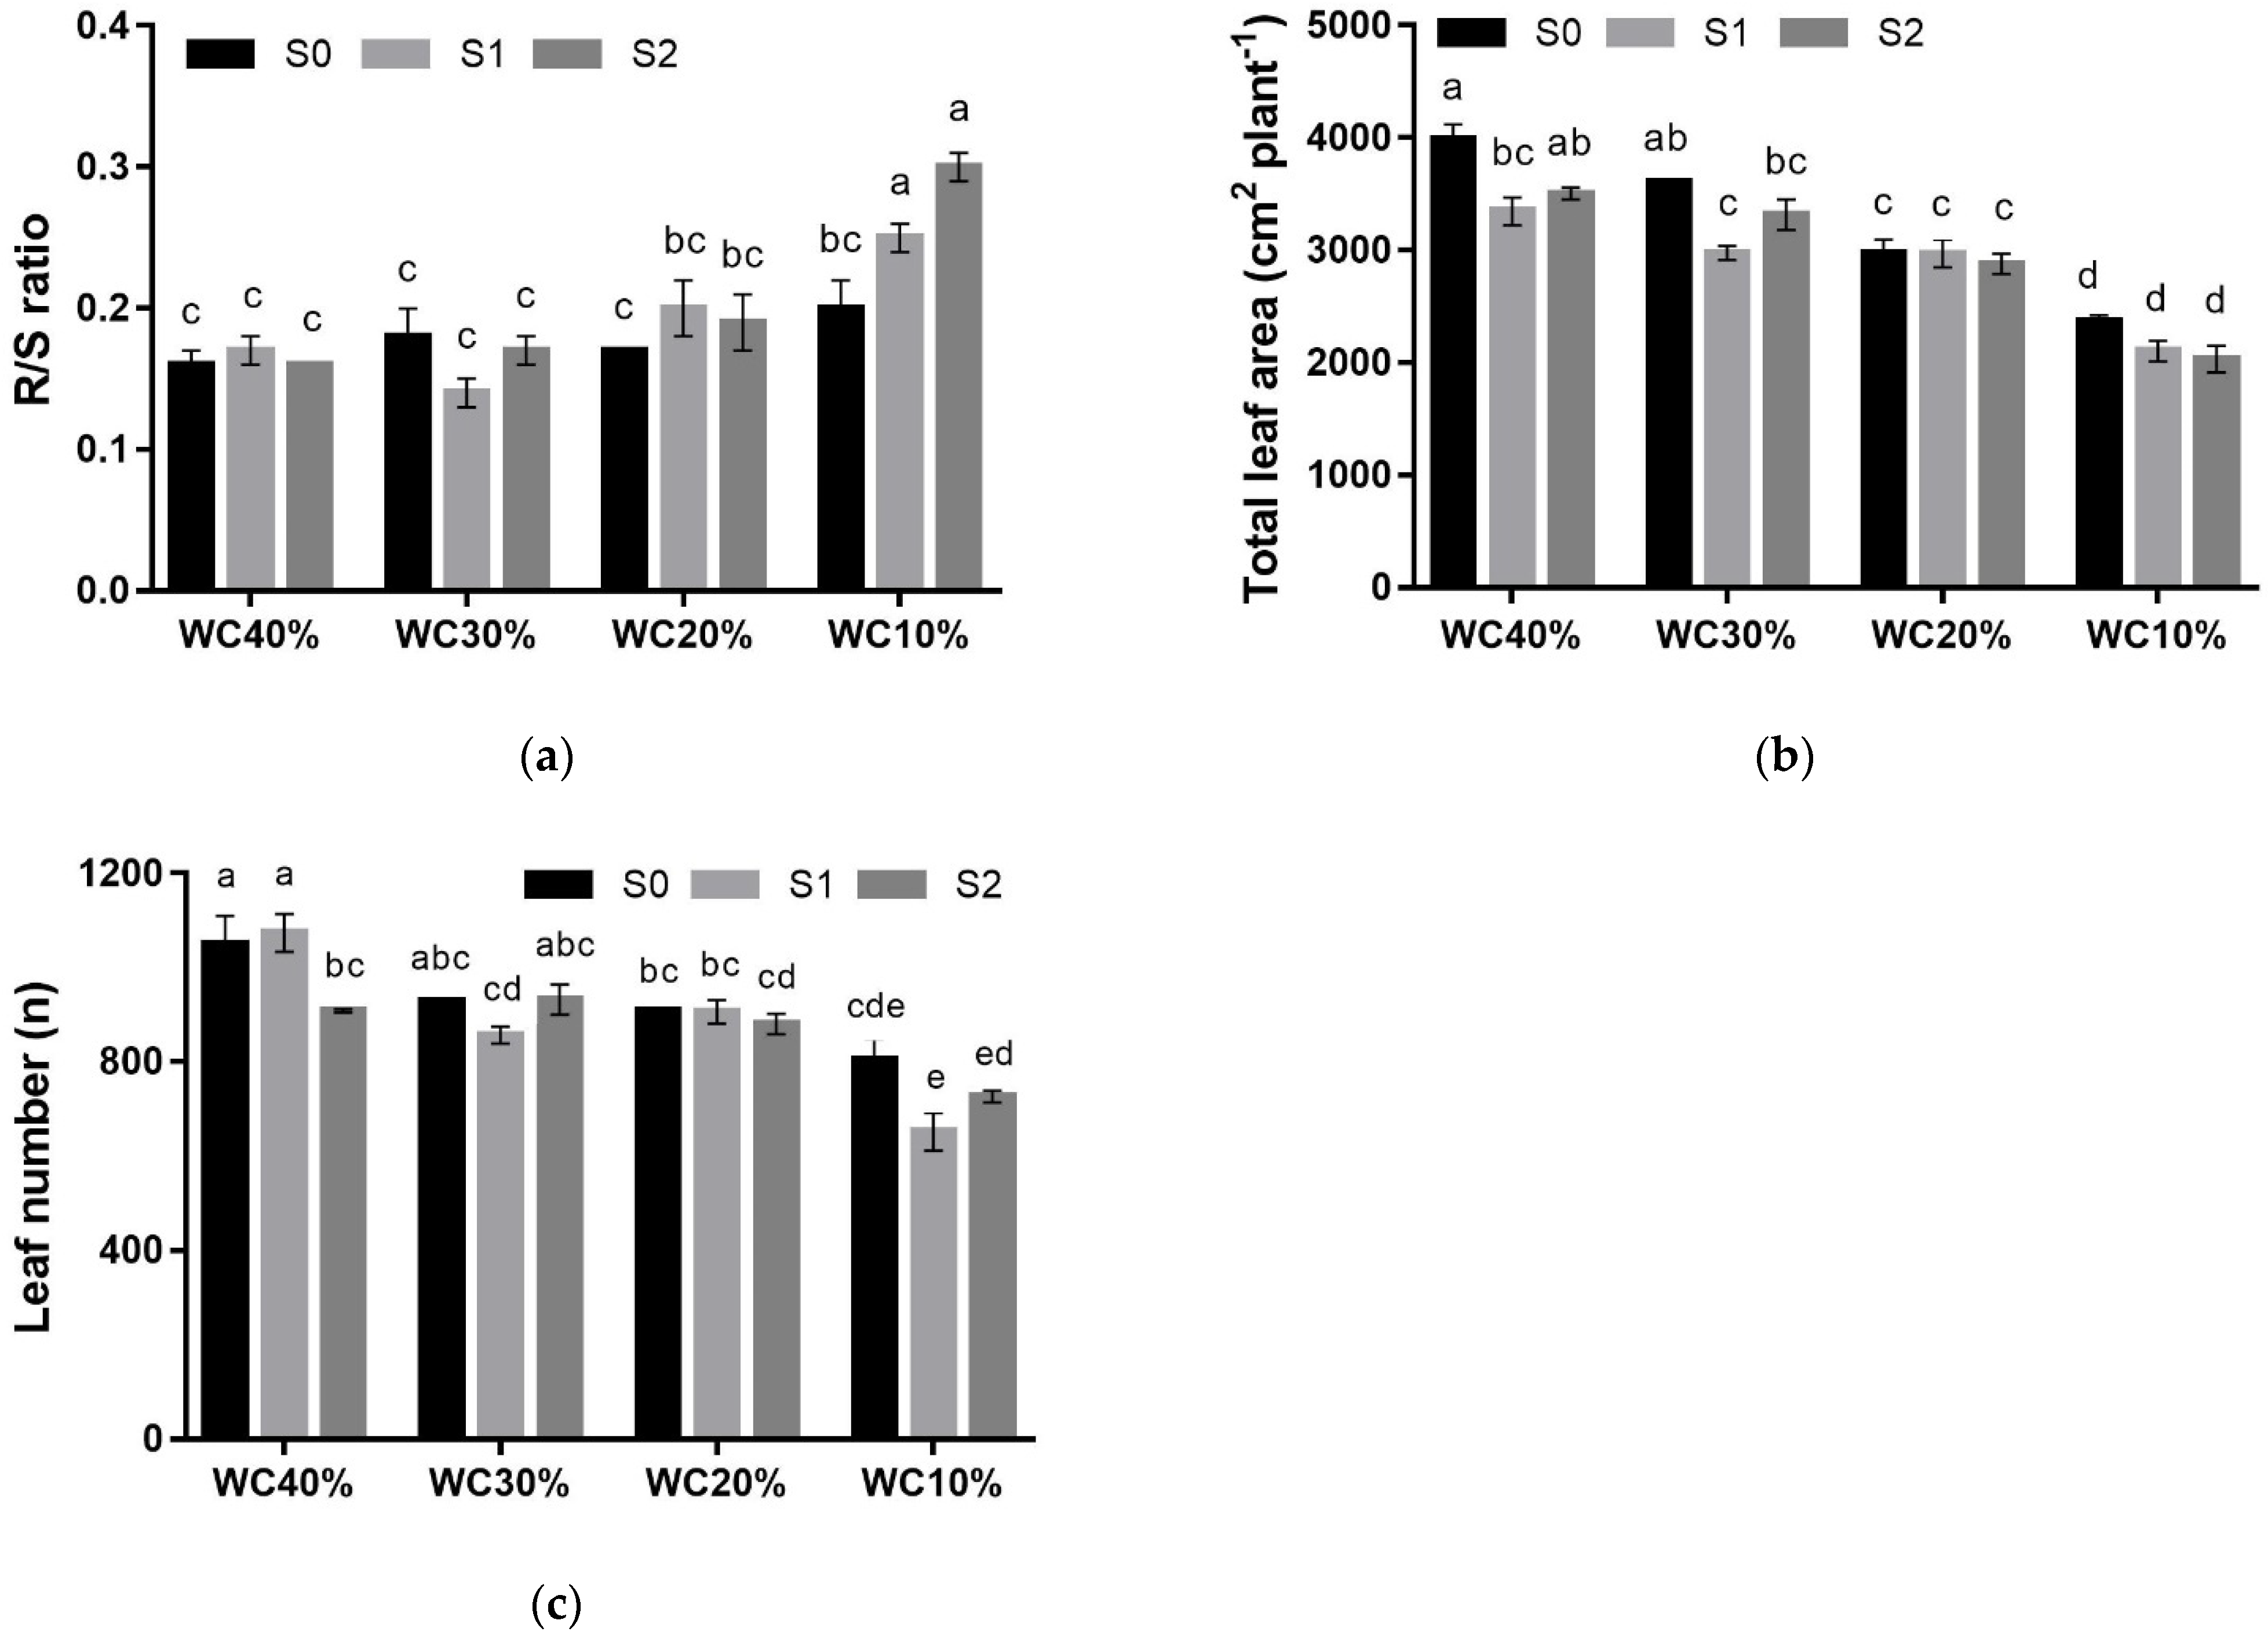
Figure 1. Interaction effect of drought (WC 40%: control; WC 30%: light drought stress; WC 20%: moderate drought stress; WC 10%: severe drought stress) × saline aerosol treatment (S0: Distilled water, S1: 50% Synthetic seawater solution, S2: 100% Synthetic seawater solution) for Callistemon plants on root to shoot ratio (a), total leaf area (b), and leaf number (c). Data are means ± standard error (n = 3). Three biological replicates were used for the measurements. Data were subjected to two-way ANOVA and differences among means were determined using Tukey’s post-test. Different letters indicate statistical differences for p < 0.05.
Horticulturae 07 00517 g001
Figure 2. Interaction effect of drought (WC 40%: control; WC 30%: light drought stress; WC 20%: moderate drought stress, WC 10% severe drought stress) × saline aerosol treatment (S0: Distilled water, S1: 50% Synthetic seawater solution, S2: 100% Synthetic seawater solution) for Viburnum plants on epigeous dry biomass (a) and leaf number (b). Data are means ± standard error (n = 3). Three biological replicates were used for the measurements. Data were subjected to two-way ANOVA and differences among means were determined using Tukey’s post-test. Different letters indicate statistical differences for p < 0.05.
Horticulturae 07 00517 g002
Figure 3. SPAD index in Callistemon (a) and Viburnum (b) potted plants subjected to drought (WC 40%: control; WC 30%: light drought stress; WC 20%: moderate drought stress; WC 10% severe drought stress) and saline aerosol treatment (S0: Distilled water, S1: 50% Synthetic seawater solution, S2: 100% Synthetic seawater solution). Data are means ± standard error (n = 3). Three biological replicates were used for the measurements. Data were subjected to two-way ANOVA and differences among means were determined using Tukey’s post-test. Different letters indicate statistical differences for p < 0.05; *: p < 0.05; **: p < 0.01; ***: p < 0.001; ns: p > 0.05.
Horticulturae 07 00517 g003
Figure 4. Trend of net photosynthesis (AN) (a) and stomatal conductance (gs) (b) in Callistemon plants affected by drought (WC 40%: control; WC 30%: light drought stress; WC 20%: moderate drought stress; WC 10% severe drought stress) and saline aerosol treatment (S0: Distilled water, S1: 50% Synthetic seawater solution, S2: 100% Synthetic seawater solution). The plants were subjected of drought stress for four weeks; subsequently the plants were also treated with saline aerosol treatment. Data are means ± standard error (n = 3). Three biological replicates were used for the measurements.
Horticulturae 07 00517 g004
Figure 5. Trend of net photosynthesis (AN) (a) and stomatal conductance (gs) (b) in Viburnum plants affected by drought (WC 40%: control; WC 30%: light drought stress; WC 20%: moderate drought stress; WC 10% severe drought stress) and saline aerosol treatment (S0: Distilled water, S1: 50% Synthetic seawater solution, S2: 100% Synthetic seawater solution). The plants were subjected of drought stress for four weeks; subsequently the plants were also treated with saline aerosol treatment. Data are means ± standard error (n = 3). Three biological replicates were used for the measurements.
Horticulturae 07 00517 g005
Figure 6. Trend of maximum quantum efficiency of PSII (Fv/Fm) in plants of Callistemon (a) and Viburnum (b) subjected to drought (WC 40%: control; WC 30%: light drought stress; WC 20%: moderate drought stress; WC 10% severe drought stress) and saline aerosol treatment (S0: Distilled water, S1: 50% Synthetic seawater solution, S2: 100% Synthetic seawater solution). Data are means ± standard error (n = 3). Three biological replicates were used for the measurements.
Horticulturae 07 00517 g006
Figure 7. Relative water content (RWC) at the end of the experiment in plants of Callistemon (a) and Viburnum (b) subjected of drought (D: WC 40%: control; WC 30%: light drought stress; WC 20%: moderate drought stress; WC 10% severe drought stress) and saline aerosol treatment (S: S0: Distilled water, S1: 50% Synthetic seawater solution, S2: 100% Synthetic seawater solution). Data are means ± standard error (n = 3). Three biological replicates were used for the measurements. Data were subjected to two-way ANOVA and differences among means were determined using Tukey’s post-test. Significance of differences of parameters: ns = not significant; ** p < 0.01; *** p < 0.001.
Horticulturae 07 00517 g007
Figure 8. Heat map analysis summarizing the morphological and physiological changes of potted Callistemon and Viburnum plants responses to drought (WC 40%: control; WC 30%: light drought stress; WC 20%: moderate drought stress; WC 10% severe drought stress) and saline aerosol treatment (S0: Distilled water, S1: 50% Synthetic seawater solution, S2: 100% Synthetic seawater solution). Blue color indicates higher and white color indicates lower value. The mean values were normalized. TB = total dry biomass; EB = epigeous dry biomass; R/S = root to shoot ratio; TLA = total leaf area; LN = leaf number; SPAD = SPAD index; RWC = relative water content; Fv/Fm = maximum quantum efficiency of PSII; AN = net photosynthesis; gs = stomatal conductance.
Horticulturae 07 00517 g008
Figure 9. Principal component loading plot and scores of PCA epigeous and total dry biomass, R/S ratio, total leaf area, leaf number, Spad index, gas exchange, chlorophyll a fluorescence, and RWC for Callistemon (a) and Viburnum (b) as drought and saline aerosol stress treatments. TB = total dry biomass; EB = epigeous dry biomass; R/S = root to shoot ratio; TLA = total leaf area; LN = leaf number.
Horticulturae 07 00517 g009
Table 1. Summary of the main and interaction effects of drought, saline aerosol, and species treatments on total and epigeous dry biomass, root/shoot ratio, total leaf area, leaf number, and SPAD of potted Callistemon and Viburnum plants with the corresponding significance of the F-values.
TBEBR/STLALNSPAD
Main Effects
Drought (D)F 41.86
p < 0.001 ***
F 45.77
p < 0.001 ***
F 3.28
p < 0.001 ***
F 32.49
p < 0.001 ***
F 5.09
p < 0.01 **
F 2.34
ns
Saline Aerosol (A)F 24.25
p < 0.001 ***
F 34.18
p < 0.001 ***
F 5.63
p < 0.01 **
F 46.51
p < 0.001 ***
F 3.49
p < 0.05 *
F 4.12
p < 0.05 *
Species (S)F 0.85
ns
F 22.91
p < 0.001 ***
F 154.95
p < 0.001 ***
F 448.94
p < 0.001 ***
F 1195.39
p < 0.001 ***
F 19.12
p < 0.001 ***
Interaction
D × AF 9.40
p < 0.001 ***
F 10.34
p< 0.001 ***
F 1.35
ns
F 4.29
p < 0.01 **
F 6.07
p < 0.001 ***
F 1.30
ns
D × SF 1.92
p < 0.001 **
F 0.67
p < 0.01 **
F 1.85
p < 0.01 **
F 4.29
p < 0.01 **
F 3.62
p < 0.05 *
F 2.73
ns
A × SF 6.33
p < 0.001 **
F 4.23
p < 0.05 *
F 3.53
p < 0.05 *
F 0.50
ns
F 4.62
p < 0.05 *
F 3.43
p < 0.05 *
D × A × SF 10.77
p < 0.001 ***
F 14.11
p < 0.001 ***
F 1.80
ns
F 6.20
p < 0.001 ***
F 5.00
p < 0.001 ***
F 1.13
ns
TB = Total dry biomass; EB = Epigeous dry biomass; R/S = Root to shoot ratio; TLA = Total leaf area; LN = leaf number. Significance of differences of parameters: ns = not significant; * p < 0.05; ** p < 0.01; *** p < 0.001 with the corresponding significance of the F-values.
Table 2. Effects of drought and saline aerosol treatments on total (TB) and epigeous (EB) dry biomass, root/shoot ratio (R/S), total leaf area (TLA), and leaf number (LN) of potted Callistemon plants.
Aerosol/DroughtWC 40%WC 30%WC 20%WC 10%MeanA × D
TB (g plant−1) ns
S0130.9 ± 2.9113.2 ± 2.494.2 ± 1.694.2 ± 0.9108.1 ± 4.7 a **
S1116.1 ± 0.7102.3 ± 8.596.4 ± 0.988.1 ± 4.4100.7 ± 3.7 b
S2113.4 ± 1.9107.1 ± 6.989.9 ± 2.277.0 ± 3.596.9 ± 4.7 b
Mean120.1 ± 2.9 A ***107.6 ± 3.6 B93.5 ± 1.3 C86.4 ± 3.0 C
EB (g plant−1) ns
S0113.0 ± 2.496.1 ± 0.980.2 ± 1.676.8 ± 2.091.5 ± 4.4 a **
S199.3 ± 1.689.7 ± 8.680.3 ± 1.870.6 ± 2.884.9 ± 3.8 b
S297.4 ± 1.891.6 ± 6.675.8 ± 1.058.9 ± 1.280.9 ± 4.8 b
Mean103.2 ± 2.7 A ***92.5 ± 3.3 B78.8 ± 1.0 C68.8 ± 2.8 D
R/S p < 0.01
S00.16 ± 0.010.18 ± 0.020.17 ± 0.000.20 ± 0.020.18 ± 0.01 ns
S10.17 ± 0.010.14 ± 0.010.20 ± 0.020.25 ± 0.010.19 ± 0.01
S20.16 ± 0.000.17 ± 0.010.19 ± 0.020.30 ± 0.010.20 ± 0.02
Mean0.17 ± 0.01 B ***0.16 ± 0.01 B0.19 ± 0.01 B0.25 ± 0.02 A
TLA (cm2) p < 0.05
S03979.9 ± 139.33611.7 ± 14.02978.9 ± 116.32364.8 ± 60.13233.8 ± 190.3 a ***
S13345.9 ± 123.72977.2 ± 61.22969.4 ± 122.42101.6 ± 90.82932.1 ± 144.7 b
S23503.9 ± 51.03315.5 ± 136.22878.1 ± 90.32030.8 ± 115.22848.5 ± 176.7 b
Mean3609.9 ± 110.4 A ***3301.5 ± 101.4 B2942.1 ± 57.6 C2165.7 ± 68.4 D
LN (n°) p < 0.01
S01050.2 ± 59.7928.1 ± 13.3908.5 ± 57.2804.5 ± 43.2922.7 ± 30.7 a *
S11073.0 ± 40.0865.5 ± 118.0905.6 ± 25.1651.8 ± 39.9871.7 ± 47.3 ab
S2907.8 ± 13.8931.4 ± 86.1913.6 ± 160.0727.7 ± 69.5861.3 ± 25.7 b
Mean1010.3 ± 33.2 A ***905.3 ± 43.9 B898.0 ± 10.7 B727.3 ± 34.3 C
*: p < 0.05; **: p < 0.01; ***: p < 0.001; ns: p > 0.05 Data followed by a different letter were significantly different according to LSD Test. WC 40%: control; WC 30%: light drought stress; WC 20%: moderate drought stress; WC 10%: severe drought stress. S0: Distilled water, S1: 50% Synthetic seawater solution, S2: 100% Synthetic seawater solution. Data are means ± standard error (n = 3). Three biological replicates were used for the measurements. TB = Total dry biomass; EB = Epigeous dry biomass; R/S = Root to shoot ratio; TLA = Total leaf area; LN = Leaf number.
Table 3. Effects of drought and saline aerosol treatments on total (TB) and epigeous (EB) dry biomass, root/shoot ratio (R/S), total leaf area (TLA), and leaf number (LN) of potted Viburnum plants.
Aerosol/DroughtWC 40%WC 30%WC 20%WC 10%MeanA × D
TB (g plant−1) p> 0.05
S0126.3 ± 8.0105.2 ± 0.7111.4 ± 2.895.4 ± 2.1109.6 ± 3.9 ns
S1114.7 ± 1.6103.8 ± 3.695.0 ± 4.499.4 ± 6.1103.2 ± 2.9
S2126.0 ± 3.9106.9 ± 2.295.6 ± 1.288.9 ± 2.2104.3 ± 3.5
Mean122.3 ± 3.2 A ***105.3 ± 1.3 B100.7 ± 3.1 BC94.6 ± 2.8 C
EB (g plant−1) p< 0.05
S0103.8 ± 4.985.3 ± 1.691.6 ± 2.876.2 ± 3.389.2 ± 3.3 a **
S187.9 ± 4.583.4 ± 2.471.5 ± 2.378.5 ± 4.780.3 ± 2.4 ab
S299.1 ± 3.884.0 ± 2.776.4 ± 1.869.8 ± 4.282.3 ± 3.6 b
Mean96.9 ± 3.2 A ***84.3 ± 1.2 B79.8 ± 3.3 BC74.8 ± 2.4 C
R/S ns
S00.22 ± 0.00.23 ± 0.00.22 ± 0.00.26 ± 0.10.23 ± 0.0 b *
S10.31 ± 0.10.24 ± 0.00.33 ± 0.00.27 ± 0.00.29 ± 0.0 a
S20.27 ± 0.00.27 ± 0.00.25 ± 0.00.27 ± 0.00.27 ± 0.1 ab
Mean0.27 ± 0.0 ns0.25 ± 0.00.27 ± 0.00.27 ± 0.0
TLA (cm2) ns
S06386.0 ± 240.35073.1 ± 9.95288.2 ± 436.34736.0 ± 111.45370.8 ± 215.9 a ***
S14890.8 ± 184.64584.9 ± 124.13963.6 ± 268.04202.1 ± 202.54401.4 ± 136.3 c
S25805.8 ± 251.14732.9 ± 308.64637.6 ± 145.84008.3 ± 319.64796.2 ± 225.3 b
Mean5694.2 ± 245.5 A ***4784.9 ± 123.0 B4629.8 ± 245.3 BC4315.5 ± 157.5 C
LN (n°) p< 0.05
S0125.0 ± 14.0113.3 ± 3.2141.4 ± 8.7125.0 ± 10.1126.2 ± 5.2 ab *
S1157.1 ± 8.9146.2 ± 11.0117.5 ± 5.3127.1 ± 13.5137.0 ± 6.4 a
S2137.8 ± 6.6125.2 ± 10.7115.5 ± 1.8106.2 ± 8.2121.2 ± 4.8 b
Mean140.0 ± 7.0 ns128.2 ± 6.6124.8 ± 5.1119.4 ± 6.3
*: p < 0.05; **: p < 0.01; ***: p < 0.001; ns: p > 0.05 Data followed by a different letter were significantly different according to LSD Test. WC 40%: control; WC 30%: light drought stress; WC 20%: moderate drought stress; WC 10%: severe drought stress. S0: 0% Distilled water, S1: 50% Synthetic seawater solution, S2: 100% Synthetic seawater solution. TB = Total dry biomass; EB = Epigeous dry biomass; R/S = Root to shoot ratio; TLA = Total leaf area; LN = Leaf number.
Table 4. Summary of the main and interaction effects of days (T) and drought (D) in the first 30 days, and of days (T), drought (D), and saline aerosol (A) for the other 30 days on net photosynthesis (AN) and stomatal conductance (gs) of potted Callistemon.
FactorANgs
Main effect
Days (T)p > 0.1360 nsp > 0.9479 ns
Drought (D)p < 0.001 ***p < 0.001 ***
Interaction
T × Dp > 0.9195 nsp > 0.3881 ns
Main effect
Days (T)p < 0.000 ***p > 0.9335 ns
Drought (D)p < 0.000 ***p > 0.7446 ns
Aerosol Saline (A)p < 0.0223 *p > 0.7487 ns
Interaction
T × Dp < 0.02 *p > 0.1859 ns
T × Ap > 0.2517 nsp > 0.4371 ns
D × Ap < 0.0492 *p > 0.1965 ns
T × D × Ap > 0.695 nsp > 0.4665 ns
Data were subjected to two-way ANOVA to compare the effects of days (T) and drought (D), while data were subjected to three-way ANOVA to compare the effects of days (T), drought (D), saline aerosol (A). Significance of differences of parameters: ns = not significant; * p < 0.05; *** p < 0.001.
Table 5. Summary of the main and interaction effects of days (T) and drought (D) in the first 30 days, and of days (T), drought (D), and saline aerosol (A) for the other 30 days on (AN) and stomatal conductance (gs) of potted Viburnum.
FactorANgs
Main effect
Days (T)p < 0.001 ***p < 0.0024 **
Drought (D)p < 0.001 ***p < 0.000 ***
Interaction
T × Dp < 0.0117 *p > 0.6831 ns
Main effect
Days (T)p < 0.0000 ***p < 0.0123 *
Drought (D)p < 0.0000 ***p < 0.0000 ***
Aerosol Saline (A)p < 0.0001 ***p > 0.1899 ns
Interaction
T × Dp < 0.0002 ***p < 0.0298 *
T × Ap> 0.1567 nsp > 0.2644 ns
D × Ap > 0.0677 nsp> 0.1738 ns
T × D × Ap < 0.0000***p > 0.5243 ns
Data were subjected to two-way ANOVA to compare the effects of days (T) and drought (D), while data were subjected to three-way ANOVA to compare the effects of days (T), drought (D), saline aerosol (A). Significance of differences of parameters: ns = not significant; * p < 0.05; ** p < 0.01; *** p < 0.001.
Table 6. Summary of the main and interaction effects of days (T) and drought (D) in the first 30 days, and of days (T), drought (D), and saline aerosol (A) for the other 30 days on of maximum quantum efficiency of PSII (Fv/Fm) of potted Callisemon and Viburnum.
FactorFv/Fm
Callistemon
Fv/Fm
Viburnum
Main effect
Days (T)p < 0.0001 ***p < 0.0002 ***
Drought (D)p < 0.0000 ***p < 0.0000 ***
Interaction
T × Dp < 0.0018 **p < 0.0259 *
Main effect
Days (T)p > 0.4355 nsp < 0.0000 ***
Drought (D)p < 0.0000 ***p < 0.0005 ***
Aerosol Saline (A)p < 0.0000 ***p > 0.7511 ns
Interaction
T × Dp > 0.4146 nsp < 0.0157 *
T × Ap < 0.0418 *p > 0.1429 ns
D × Ap < 0.0000 ***p < 0.4412 *
T × D × Ap < 0.0099 **p > 0.6064 ns
Data were subjected to two-way ANOVA to compare the effects of days (T) and drought (D), while data were subjected to three-way ANOVA to compare the effects of days (T), drought (D), saline aerosol (A). Significance of differences of parameters: ns = not significant; * p < 0.05; ** p < 0.01; *** p < 0.001
Publisher’s Note: MDPI stays neutral with regard to jurisdictional claims in published maps and institutional affiliations.