Article

The Growth of Leaf Lettuce and Bacterial Communities in a Closed Aquaponics System with Catfish

1
School of Agriculture, Utsunomiya University, Mine-machi 350, Utsunomiya 321-8505, Japan
2
Department of Horticulture and Landscape Architecture, Purdue University, West Lafayette, IN 47907, USA
*
Author to whom correspondence should be addressed.
Horticulturae 2021, 7(8), 222; https://doi.org/10.3390/horticulturae7080222
Submission received: 8 June 2021 / Revised: 31 July 2021 / Accepted: 31 July 2021 / Published: 4 August 2021

Abstract

:
Aquaponics is a circulating and sustainable system that combines aquaculture and hydroponics and forms a symbiotic relationship between fish, plants, and microorganisms. We hypothesized that feed alone could support plant growth, but the symbiosis with fish adds some beneficial effects on plant growth in aquaponics. In this study, we created three closed culture systems, namely, aquaponics, hydroponics without nitrogen (N) and phosphorus (P), and aquaculture, and added the same amount of feed containing N and P to all the treatments in order to test the hypothesis. Accumulation of NO3 and PO43− was alleviated in aquaponics and hydroponics as a result of plant uptake. Lettuce plants grown in aquaponics grew vigorously until 2 weeks and contained a constant level of N in plants throughout the production period, whereas those in hydroponics grew slowly in the early stage and then vigorously after 2 weeks with a late increment of N concentration. These results suggest that catfish help with the faster decomposition of the feed, but, in hydroponics, feed can be slowly dissolved and decomposed owing to the absence of the fish. The bacterial community structures of the culture solution were investigated using 16S rRNA gene amplicon sequencing. At the class level, Actinobacteria, Alphaproteobacteria, Betaproteobacteria, and Gammaproteobacteria were the major microbial groups in the solutions. Aquaponics prevented the pollution of tank solution and maintained a higher water quality compared with hydroponics and aquaculture, suggesting that aquaponics is a more sustainable cultivation system even in a small-scale system.

1. Introduction

Aquaponics (AP) is a combined system of growing aquatic organisms and plants symbiotically, in which the effluent of aquaculture (AC) undergoes microbial transformations to be used as a source of nutrients for plant growth, while nutrient absorption from plants remediates water for aquaculture [1,2,3,4]. In AC, 25% of fed nitrogen is absorbed, and more than 70% is discharged to the surroundings in the form of ammonia [5]. Organic inputs, senescent phytoplankton, fish fecal solids, and uneaten feed settle from the water column to the sediment in AC [5]. In AP, NH₄⁺ produced by fish is converted to NO₂⁻ and NO₃⁻ through ammonia-oxidizing and nitrifying bacteria; then, plants uptake them as nutrients. This type of AP system contributes to reducing the environmental impact by recycling nitrogen (N) and phosphorus (P) [6]. Thus, aquaponics is considered as a sustainable agricultural method advanced by the concepts of minimal usage of water compared with traditional agricultural systems [7].
For an AP system, catfish, largemouth bass, rainbow trout, goldfish, carp, and especially tilapia are commonly used [8]. Leafy and fruit vegetables suitable for hydroponics (HP) are preferred as plant species, such as leaf lettuce, pak choi, herbs, tomato, and cucumber [9,10,11,12,13]. AP systems must balance the physiological requirements of both plant and fish in order to maintain their health [8,14].
Plants grow rapidly with dissolved nutrients that are excreted directly by fish or generated from the microbial breakdown of fish wastes [8]. Among the factors involving AP systems, microbial community structure is one of the most important, but the influence of environmental conditions on microbes has yet to be elucidated [14,15]. An AP system must balance the promotion of beneficial microorganisms while minimizing the growth and rapid spread of plant pathogens [16]. It has also been reported that the bacterial flora in the AP system is involved in plant growth and disease incidence [8,17].
Research into nitrifying microorganisms suggests that certain species of nitrite-oxidizing bacteria become more competitive at lower pH levels [18]. The operational success of recirculating aquaculture systems (RASs) depends directly on system microbial community activities [19]. The 16S rRNA gene sequencing revealed that some sequence variants, mainly classified into Flavobacterium, Cetobacterium, the family Sphingomonadaceae, and nitrifying guilds of ammonia-oxidizing archaea and Nitrospira, were common across RAS, HP, and AP [19].
The main bacteria involved in N transformation are ammonia-oxidizing bacteria (AOB) such as Nitrosococcus, Nitrosospira, and Nitrosomonas and nitrite-oxidizing bacteria (NOB) such as Nitrobacter, Nitrospira, Nitrococcus, and Nitrospina [20,21,22]. According to these reports, both RAS and AP rely on microbial consortia for maintaining water quality and promoting fish/plant health, but little is known about the microorganisms that are actually present in the systems [19].
In our preliminary experiment, we compared the growth of leaf lettuce in a recycling AP without N and P fertilizer and HP with complete fertilization and found that lettuce in AP had a similar shoot weight to that in HP. In such a closed system containing 40 L of solution, it is clear that feed alone can support lettuce growth, but it is unknown if fish in AP is mere a mediator for nutrient discharge or provides additional benefits. We hypothesized that feed and microbes can support plants, but the presence of fish provides some beneficial effects in AP in addition to nutrient discharge.
In this study, therefore, we created three closed culture systems, (1) AP: lettuce in catfish-based aquaponics, (2) HP: lettuce in nutrient solution without N and P, and (3) AC: catfish-based aquaculture system without lettuce, and added the same amount of feed containing N and P to all the treatments. Changes in the bacterial flora of the culture solutions were also investigated using 16S rRNA gene sequencing to elucidate the roles of microbes.

2. Materials and Methods

2.1. Plant and Fish Materials

Leaf lettuce (Lactuca sativa var. Crispa) ‘green spun’ and catfish (Silurus asotus) were employed. Lettuce seeds were sewn in a sponge (urethane medium, Living Farm Co. Ltd., Osaka, Japan) and cultivated in 1/1000 liquid fertilizer (HYPONeX® N/P/K = 6:10:5, HYPONeX Japan Corp., Ltd., Osaka, Japan) solution in a natural light glass room (23/20 ˚C) of the environmental control experiment building of Utsunomiya University (36°32′55″ N, 139°54′42″ E). Thirty days after sowing, seedlings were transplanted and hydroponically cultivated. Experiments (Exp.) 1 and 2 were performed from 7 December 2018 to 17 January 2019 and from May 23 to 11 July 2019, respectively.

2.2. Experimental Design and System

AP, HP, and AC systems were installed using a floating raft type system modified from that manufactured by Nippon Aquaponics (Matsudo, Chiba, Japan). These were recirculation systems, in which the solution in the fish tank (45 × 36 × 30 cm; length, width, depth) was pumped into the solution in the cultivation tank for the plant (45 × 36 × 15 cm; length, width, depth) with a pump, and the excess solution was dropped into the fish tank (Figure S1). The solution was 40 L, and air was pumped into the fish tank by the air pump. No filtration device for the solution was equipped.
In Exp. 1, three catfish (11.3 kg/m3) were initially placed in the AP and AC plots, but they fought each other; therefore, the number was reduced to two fish after 1 week and finally to one fish for each plot at 3 weeks after the start of experiment. In Exp. 2, a catfish (3.8 kg/m3) was placed individually in the AP and AC plots. Lettuce plants were transplanted into the holes of the floating raft made of Styrofoam on the cultivation tank. Commercially produced fish food (Hikari Crest Cat, Kyorin Co. Ltd., Himeji, Hyogo, Japan) containing 8% N and 1% P was fed in all plots at 0.5 g per day in Exp. 1 and 1.0 g per day in Exp. 2.
Solutions of all plots were fertilized with 4 milliequivalent (mEq)/L KCl, 4 mEq/L CaCl2·2H₂O, 1 mEq/L MgSO4·7H2O, 0.005 µEq/L MnCl2·4H2O, 0.33 µEq/L H2MoO4·H2O, 24 µEq/L H3BO3, and 25 µEq/L EDTA-Na-Fe (III). The pH of solutions was adjusted to 7 at the start of the experiments using 0.1 N NaOH and H2SO4.

2.3. Measurements of Solution Quality

Solutions in the cultivation tanks were sampled, and pH, EC, NO3⁻, Ca2⁺, K⁺, and NH4+ were measured weekly in Exp. 2 or biweekly in Exp. 1. PO43⁻ was measured biweekly in the both experiments. Portable meters (HORIBA Ltd., Kyoto, Japan) were used for pH (twin pH meter B-212), EC (twin conductivity meter B-173), Ca2⁺, and K⁺ (LAQUA twin series). NO3⁻, NH4+, and PO43⁻ were measured using test strips (Reflectoquant®, Merck, Germany) and a multi-item water quality inspection reflectometer (RQflex® plus10, Merck, Darmstadt, Germany). The detection ranges were 4–9900 mg/L for Ca2⁺ and K⁺, 5–225 mg/L for NO3⁻, 5–120 mg/L for PO43⁻, and 0.2–7 mg/L for NH4+.
The transparency of the solution in each treatment group was measured using a water transparency meter (TO-50, KENIS Ltd., Osaka, Japan). In this system, the transparency was determined by draining until the bottom cross standard was clearly identifiable, and the height of the water layer was read, i.e., the case with a 50 cm view was evaluated as 100%. Water transparency of each solution was measured after 3 and 5 weeks after transplanting (WAT).

2.4. Growth Survey of Lettuce

Sampling was performed every 2 weeks in AP and HP plots, and the number of leaves, maximum leaf length, shoot fresh weight, root fresh weight, dry matter weight, and SPAD value (chlorophyll content) were determined. SPAD value was measured with a SPAD-502 (Konica Minolta, Inc., Tokyo, Japan).
Leaves of lettuce were weighed and dried at 80 °C for three days for N analysis. The N content of lettuce leaves was measured with the modified Dumas method using an NDA 702 Dual Carrier Gas Dumas Nitrogen Analyzer (VELP Scientifica, Usmate, MB, Italy) in Exp. 2. The total N content was determined from the measured N content and the dry weight of leaves.
Data were analyzed with a t-test using software (BellCurve for Excel, Social Survey Research Information Co., Ltd., Tokyo, Japan). If the calculated p-value is below 0.05, then the null hypothesis is rejected in favor of the alternative hypothesis; that is, there is a significant difference between the treatments. The significance level is shown as 0.05, 0.01, or 0.001 in the tables.

2.5. Analysis of Bacterial Flora

Bacterial flora DNA was collected from solutions to identify the characteristics and changes in the plots and during the cultivation period. Solutions of culture tanks were sampled at 5 weeks after transplanting in Exp. 1 and at 2, 4, and 6 weeks in Exp. 2. DNA was extracted from each solution using a kit (Water RNA/DNA Purification Kit (0.22 μm): Norgen Biotek Corp., Thorold, ON, Canada). Metagenome sequencing of 16S rRNA was analyzed using an NGS service (Macrogen Japan Corp., Tokyo, Japan). After performing quality control, qualified samples proceeded to library construction. The library was constructed using a Herculase II Fusion DNA Polymerase Nextera XT Index Kit V2 (Agilent, Santa Clara, CA, USA). The primer pair sequences for the V3 and V4 region of the 16S rRNA gene that create a single amplicon of approximately ~470 bp were used. The 16S metagenomic sequencing was performed using paired 300 bp reads, MiSeq v3 reagents, and an Illumina platform sequencer (MiSeq, Illumina Inc., San Diego, CA, USA). Raw data statistics are presented in Table S1. As 20,000 to 60,000 or more reads were obtained from each sample, 20,000 reads were randomly extracted and analyzed. Sequences were assigned to operational taxonomic units (OTUs) with a cut-off of 0.03 using Mothur [23]. Sequences were assigned to OTUs at 97% sequence identity. The bacterial community structures were analyzed based on principal coordinate analysis (PCoA). Using Mothur, a relaxed neighbor-joining phylogenetic tree was created from representative sequences of OTUs using the clearcut command, and a phylogenetic distance matrix was calculated using the UniFrac-weighted command. PCoA plots were constructed based on the UniFrac distance matrix using the cmdscale function of R package. Percentage eigenvalues to sum of all eigenvalues were shown in the principal coordinate axes. Candidate bacteria were identified from representative sequences of OTUs using NCBI BLAST (http://www.ncbi.nlm.nih.gov/BLAST) (access date: 27 July 2021).

3. Results

3.1. Nutrition of Solutions and Growth of Lettuce Plants

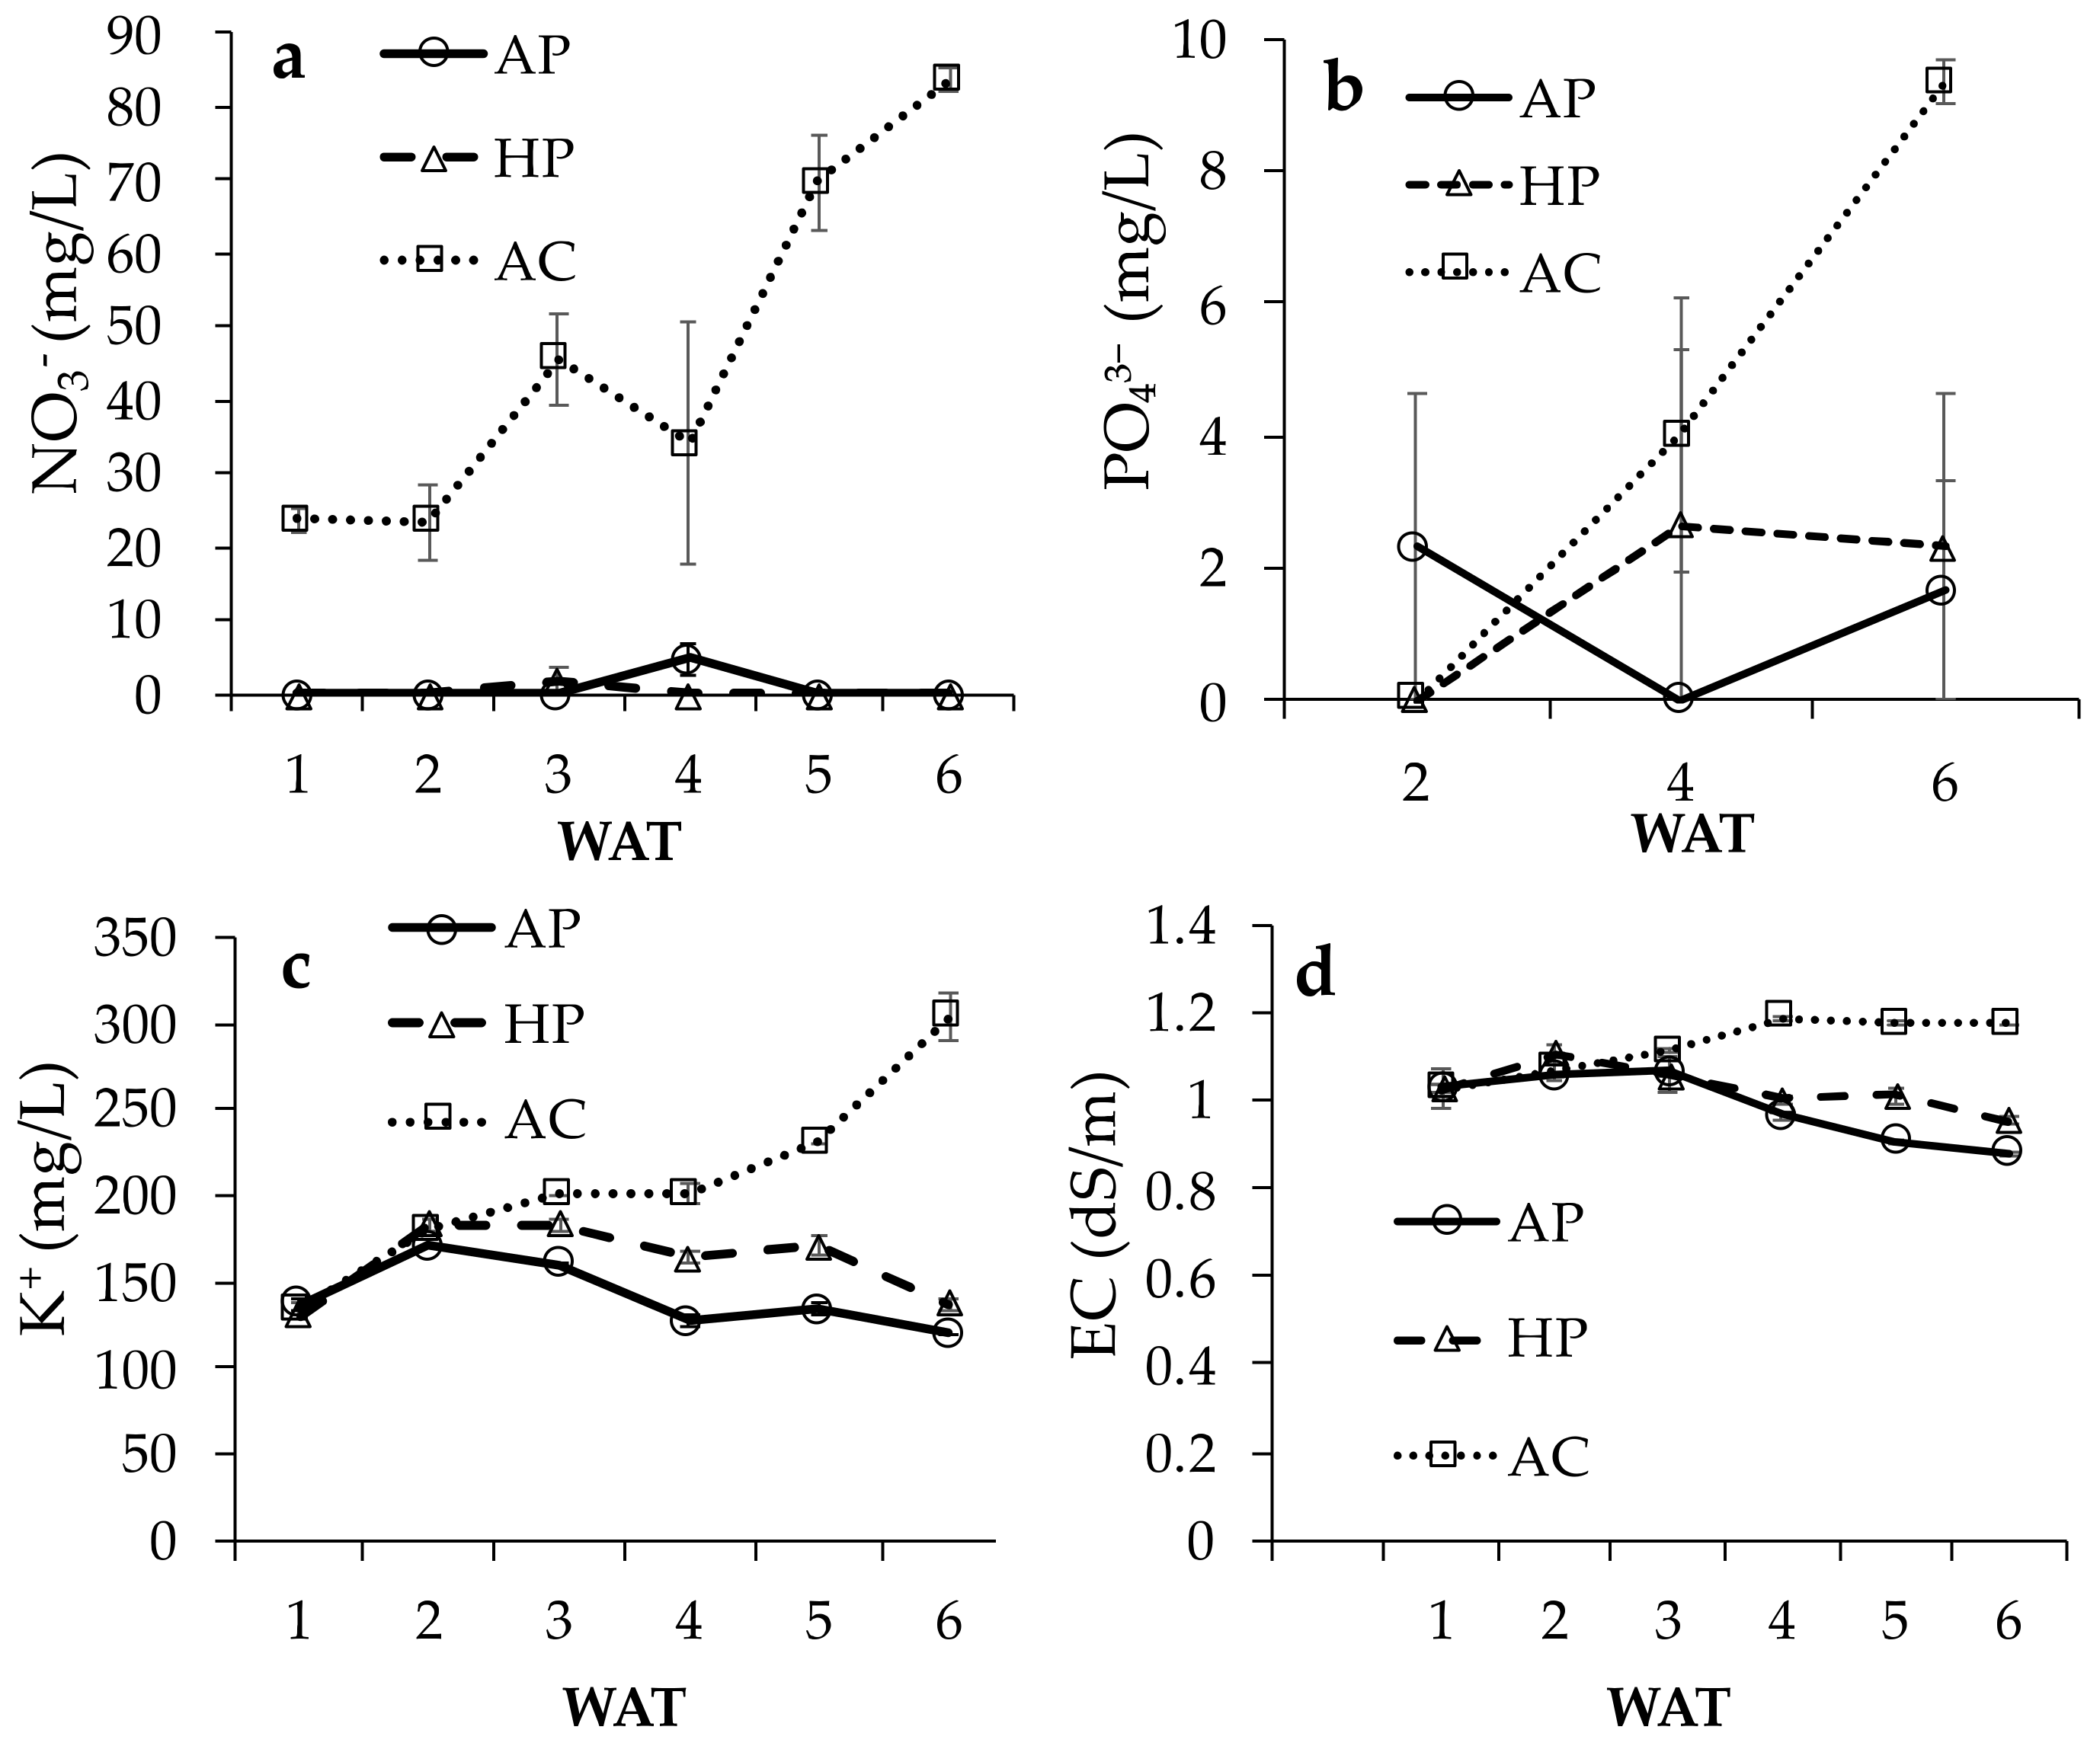
3.1.1. Nutrition and EC of Solutions

In Exp. 1, NO3 increased in AC and AP, and peaks were found at 4 WAT, while it was lower in HP (Figure 1a). PO43− was almost constant at lower than 10 mg/L, close to the measurable limit or below, in all plots (Figure 1b). K⁺ gradually decreased in AP and HP, but it increased at 6 WAT in AC (Figure 1c). EC in AP showed a small peak at 2 WAT and then decreased with the other plots (Figure 1d). pH tended to increase gradually (Figure S2a). The NH4+ level was very low, i.e., ≤0.8 mg/L, throughout the experiments (data not shown). The Ca2⁺ level ranged between 105 and 165 mg/L, and there were no significant differences among the treatments (data not shown).
In Exp. 2, the concentration of NO3 was higher than 20 mg/L in AC, while it remained low in AP and HP (Figure 2a). PO43− was detected at a low level; it increased in AC, but it was faint in AP and HP on all sampling days (Figure 2b). K⁺ gradually increased in AC, but declined at 6 WAT in AP and HP (Figure 2c). EC showed a similar trend to K⁺ (Figure 2d). After 3 and 5 WAT, water transparency was 38% and 47% in HP and 46% and 49% in AC, respectively, while that of AP was 100%. pH tended to be high at around 8 until 3 WAT and then gradually decreased (Figure S2b). NH4+ level was very low, i.e., ≤0.4 mg/L, throughout the experiments (data not shown). Ca2⁺ level gradually increased from 60 to 250 mg/L at 6 WAT, and there were no significant differences among the treatments (data not shown).

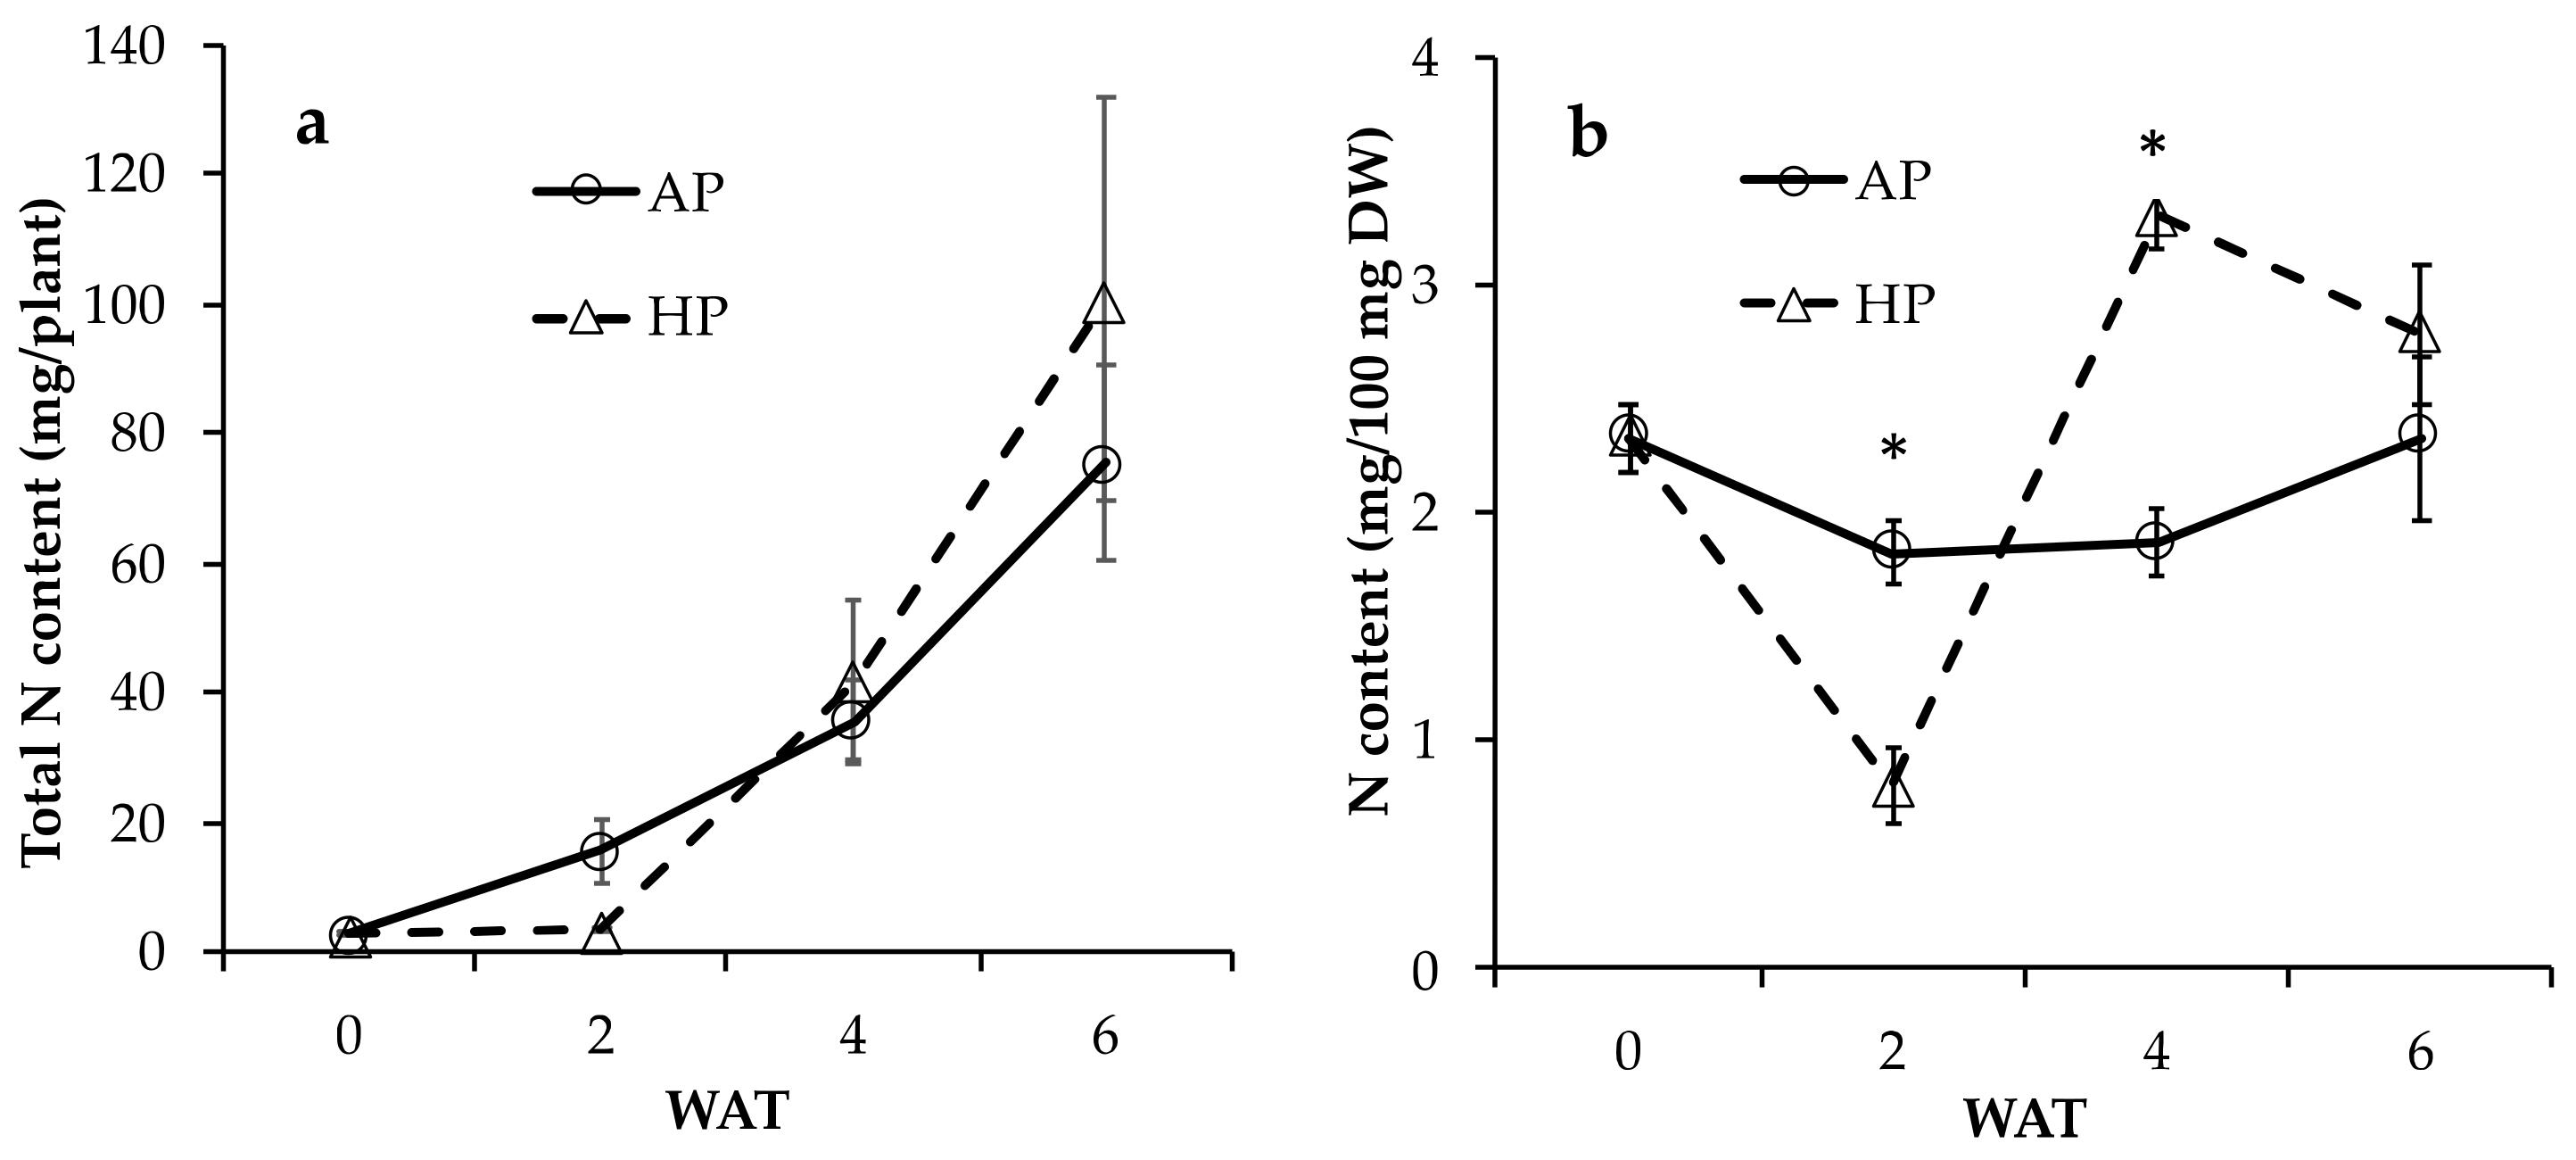
3.1.2. Growth of Lettuce Plants in AC and HP

The growth pattern of lettuce plants was similar in Exp. 1 and 2. In Exp. 1, the growth of lettuce plants in AP was more vigorous than that in HP until 4 WAT, during the early stage of growth, whereas the plant growth in HP caught up with that in AP at 6 WAT, except the maximum length of leaves (Table 1). In Exp. 2, the growth of lettuce plants in AP was significantly more vigorous than that in HP until 2 WAT, whereas that in HP was promoted after 2 WAT, and there was no significant difference between the AP and HP after 4 WAT (Table 2).
SPAD value of leaves was stable in the AP, while that in HP significantly and sharply dropped in 2 WAT and then recovered gradually (Table 1 and Table 2).
Total N content per plant tended to be higher in AP in the early growth stage (Figure 3a). N concentration in plants was stable in AP, while that in HP decreased at 2 WAT and then increased at 4 WAT (Figure 3b).

3.2. Bacterial Flora in Solution

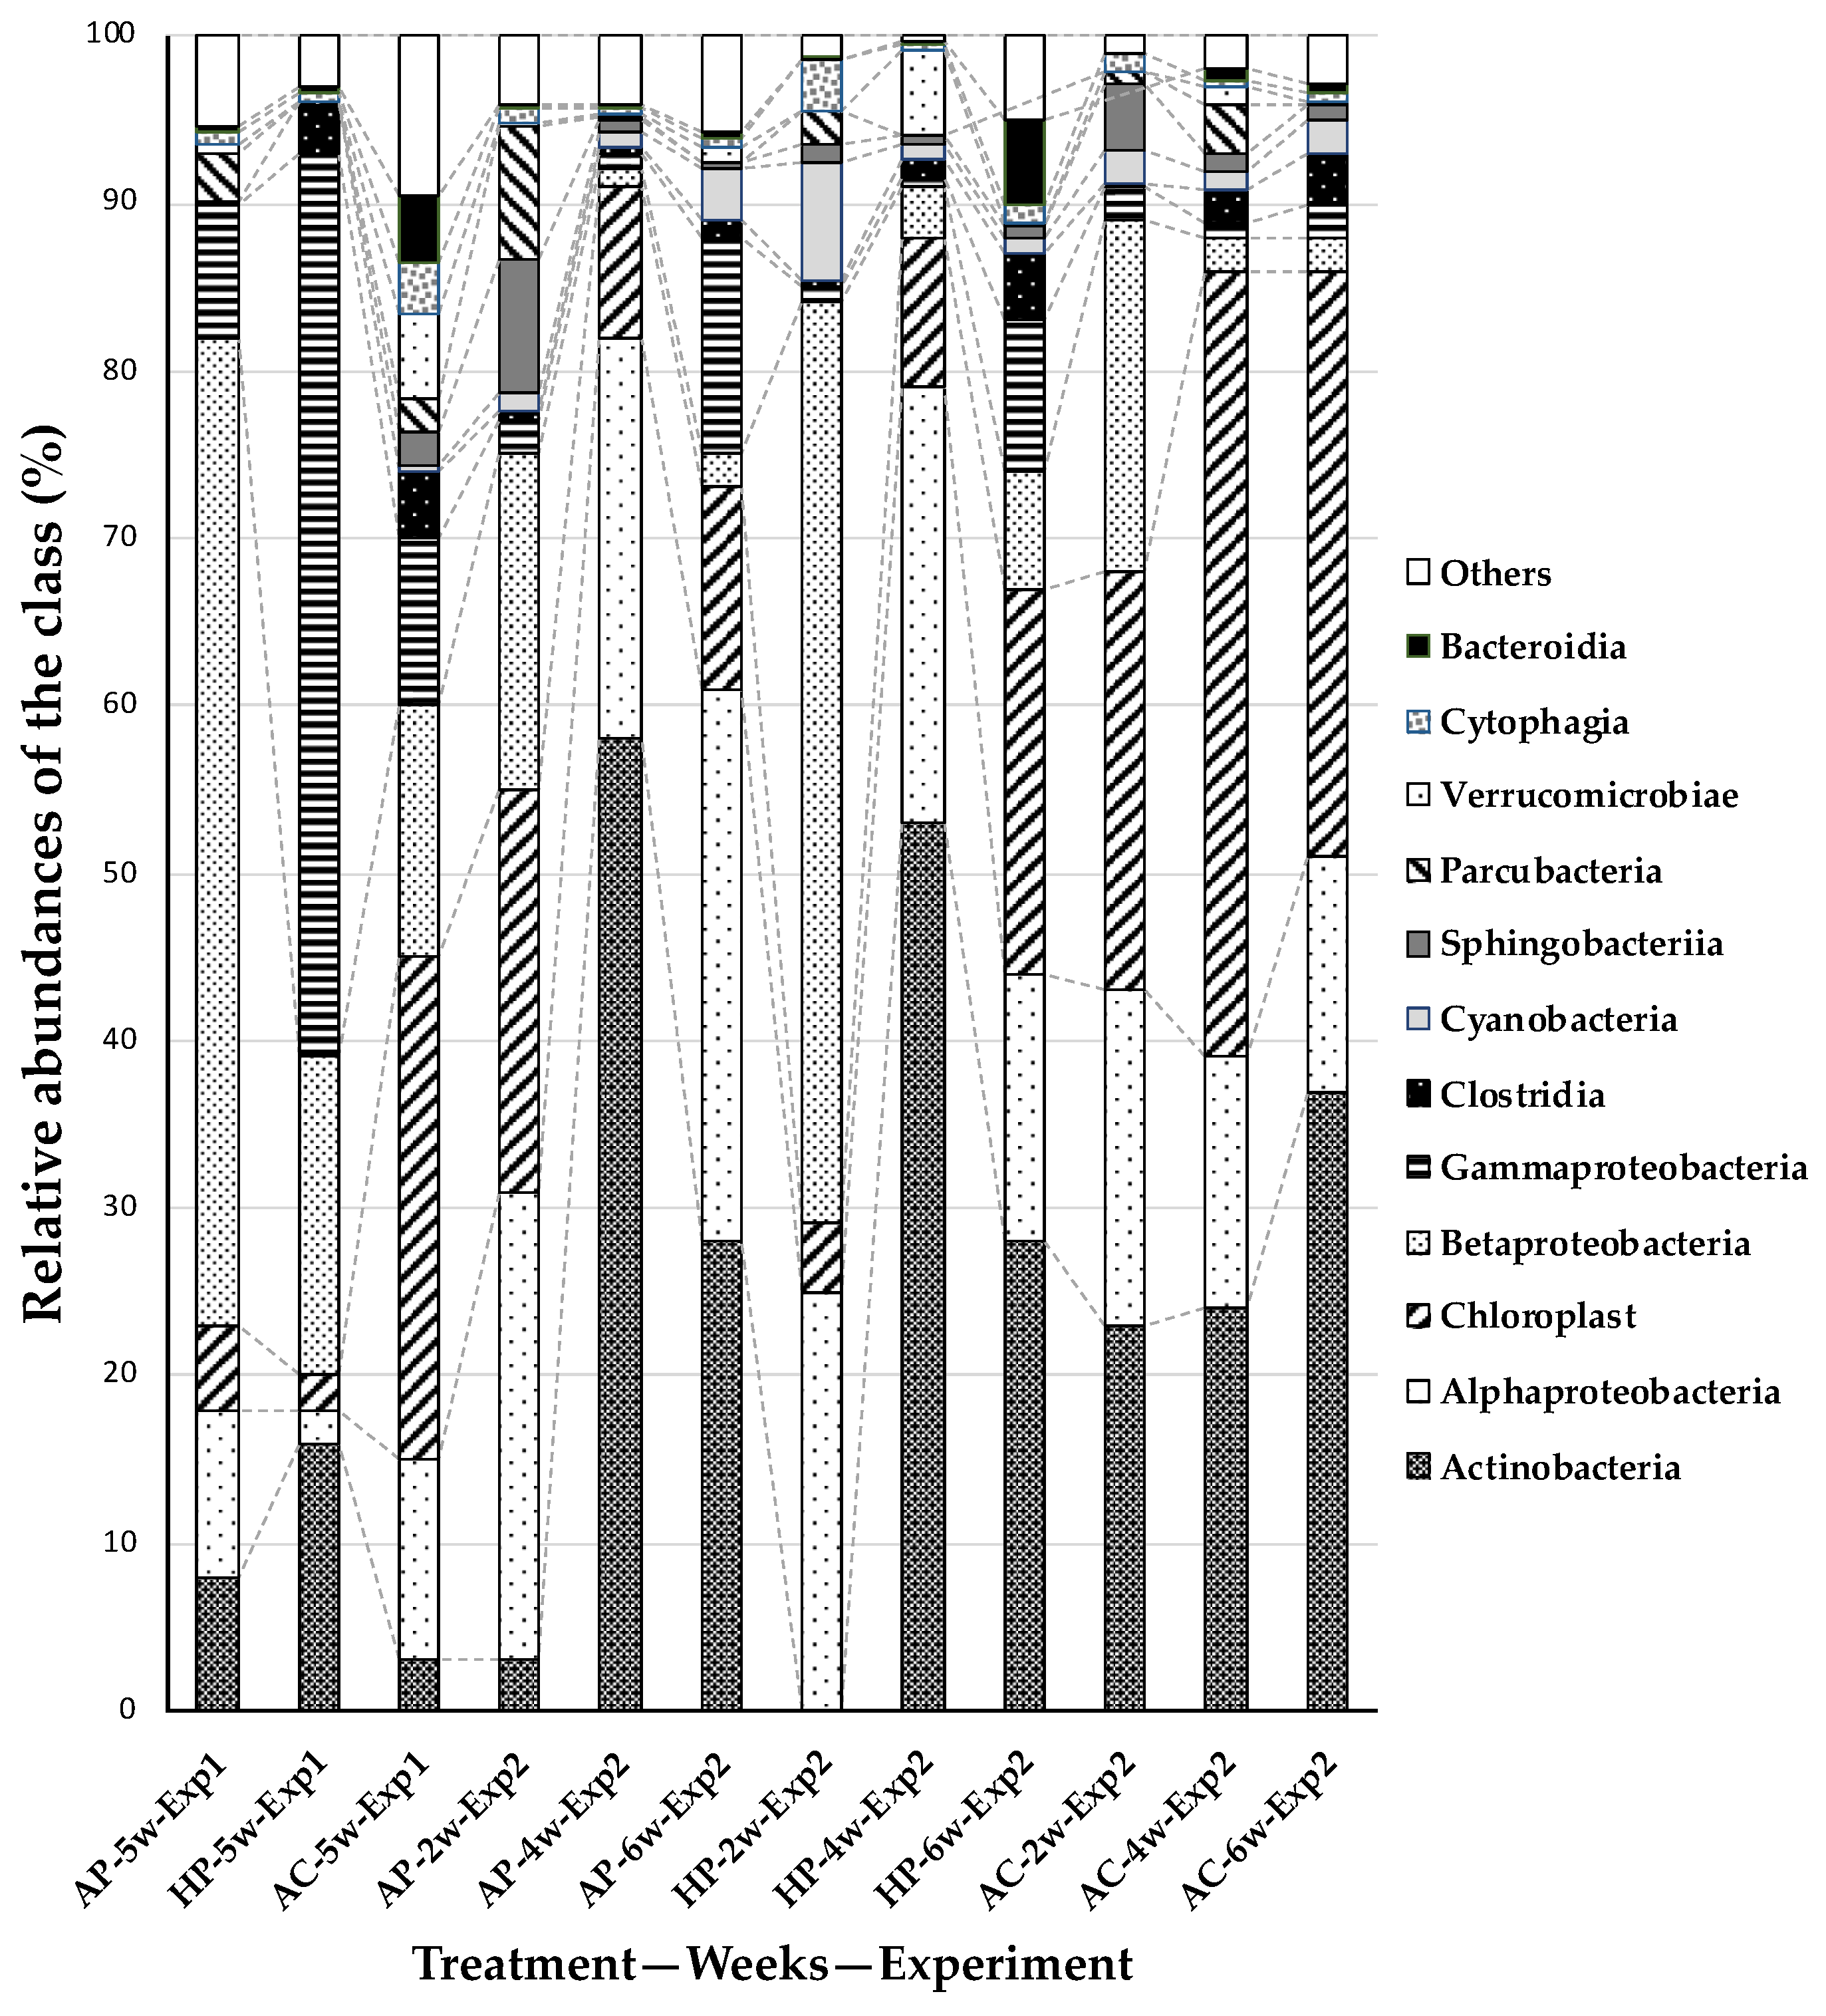
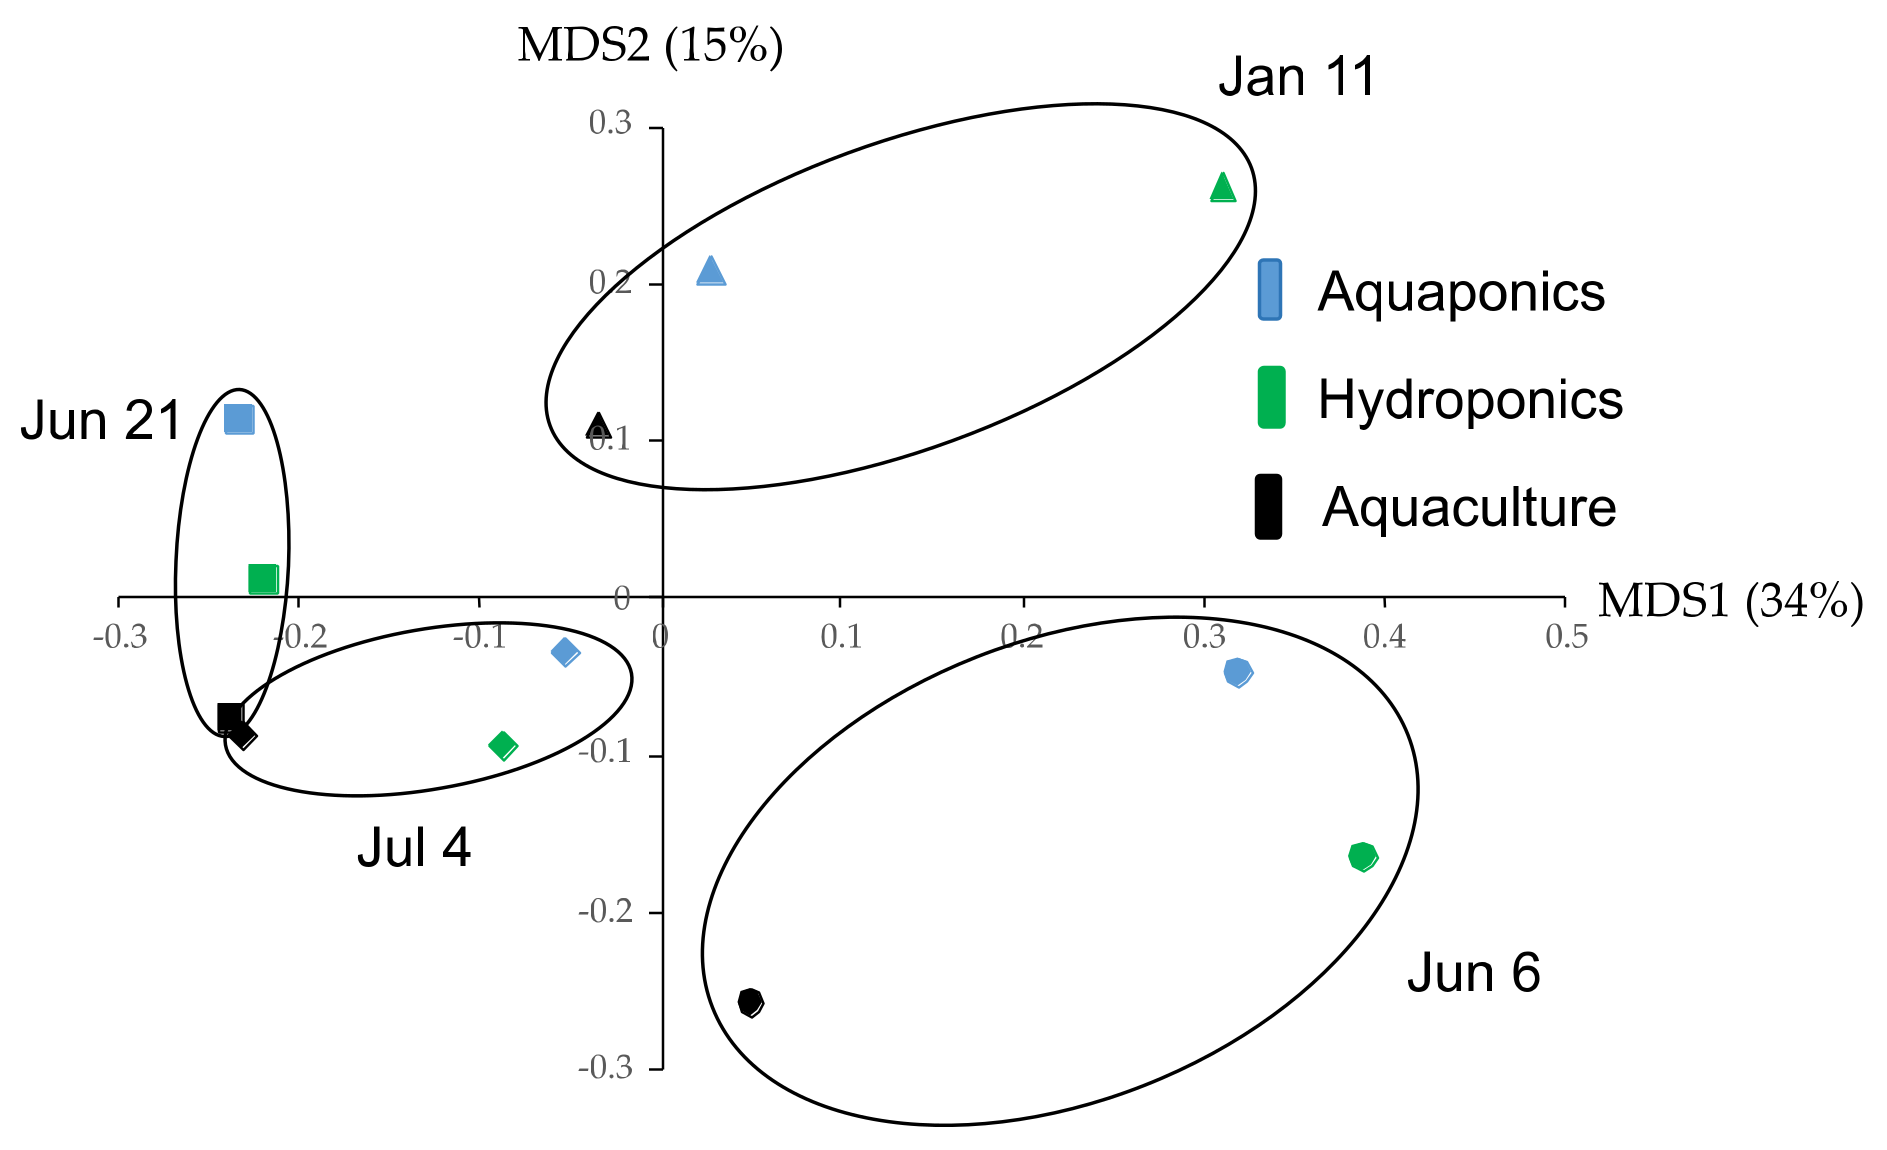
3.2.1. Ratio of Bacteria Class

The investigation into the bacterial flora of each experimental plot showed that the proportions of Actinobacteria and Alphaproteobacteria tended to be higher in Exp. 2 than those in Exp. 1 (Figure 4). The proportion of Gammaproteobacteria tended to increase after 5 and 6 WAT in all plots (Figure 4). In AC plots, chloroplasts showed a higher ratio and occupied more than 30% at 5 WAT in Exp. 1 and at 4 WAT in Exp. 2 (Figure 4).
Principal coordinate analysis using 2177 OTUs in the three plots at 5 WAT of Exp. 1 and 2, 4, and 6 WAT of Exp. 2 showed that the bacteria flora tended to depend on the sampling dates rather than the treatments (Figure 5).

3.2.2. Specific Bacteria OTUs and Existence of Nitrifying Bacteria

Next, we investigated the detail of the top 15 bacteria OTUs (Table S2). OTUs 4 and 5 were shown to be Cyanobacterium. OTUs 6, 7, and 9 were shown to be Alphaproteobacteria, Mycobacterium, and Ancylobacter, respectively (Table S2).
The presence or absence of nitrifying bacteria in each culture medium was also investigated (data not shown). The bacteria belonging to Nitrospira were detected in the three plots, especially in the later period of the AC, i.e., at 5 WAT in Exp. 1 and 6 WAT in Exp. 2. Nitrosomonas was detected only in AC at 5 WAT in Exp. 1 and 6 WAT in Exp. 2. A small number of Nitrobacter were found in all plots. In this experiment, no ammonia-oxidizing archaea (AOA) were detected, except for a case of Woesearchaeota in AC at 5 WAT in Exp. 2.

4. Discussion

AP is considered a sustainable agricultural method advanced by the concepts of minimal usage of water and nutrients compared with traditional agricultural systems [7,24,25,26]. Soilless culture system such as AP can substantially reduce potential pollution of water resources by nitrates and phosphates, while contributing to an appreciable reduction in water and fertilizer consumption [27]. When replacing HP with AP, some resources could be attributed to RAS, which partly reduces the global warming potential for plant production, and water-related environmental impacts can be strongly reduced [28]. We hypothesized that feed alone could support plants, but that fish provide some beneficial effects on plant growth in a small-scale AP system in addition to nutrient discharge. In this study, therefore, we created three closed culture systems, namely AP, HP (without N and P), and AC, and added the same amount of feed containing N and P to all the plots in order to test the hypothesis.
The major source of N input in AP is fish feed, which is excreted by the fish in the form of ammonia N (90%) and used for plant growth [29]. In this study, NH4+ level was very low, with the maximum level at 0.7 mg/L in Exp. 1 and 0.3 mg/L in Exp. 2, which were close to the limit of measurement (data not shown), suggesting that NH4+ was transformed to nitrite and nitrate or lost to the atmosphere via denitrification. In the solution of tanks, NO3 was lower in AP and HP than that in AC (Figure 1 and Figure 2), indicating that lettuce plants used them. As the number of catfish was high in the first 3 weeks in Exp. 1, N emission and NO3 in Exp. 1 tended to be higher than in Exp. 2. In AP, lettuce plants grew vigorously until 2 WAT and contained a constant level of N, while those in HP grew slowly in the early period and then vigorously after 2 WAT, with a late increment of N. These results suggest that catfish helped in faster decomposition of the feed, but in HP, feed can be slowly dissolved and decomposed because of the absence of the fish. In Exp. 2, N content was stable in AP, while it decreased at 2 WAT and then increased at 4 WAT and beyond in HP (Figure 3b), which was associated with the changes of SPAD value of the leaves (Table 2). As SPAD is considered as an index of chlorophyll concentration [30], catfish in AP promoted digestion of proteins in feed and uptake of N into lettuce plant, and thus increased chlorophyll concentration, supporting the vigorous growth of the lettuce plants.
Establishing bacterial ecosystems is essential for optimal functioning of AP, and Proteobacteria and Bacteroidetes are dominant in AP systems at the phylum level [31]. Bacterial flora of the culture solution was investigated using 16S rRNA gene sequencing. At the class level, Actinobacteria, Alphaproteobacteria, Betaproteobacteria, and Gammaproteobacteria were prominent in the solutions (Figure 4), similar to microbial communities in a floating treatment wetlands system [32]. Different bacterial communities were found in each system and changed during the culturing periods. In an AP system using lettuce and Tilapia, Fusobacteria were mainly represented by members of the genus Cetobacterium, a common inhabitant of fish guts [33], and constituted around 75% of the total bacterial community [15]. In this study, however, Fusobacteriia had only 0.07% relative abundance at the class level (Figure 4).
Principal coordinate analysis using 2177 OTUs showed that the bacteria flora depended on sampling dates rather than the treatments (Figure 5). When examining individual top 15 OTUs, OTUs 6, 7, and 9 were shown to be Alphaproteobacteria, Mycobacterium, and Ancylobacter, respectively (Table S2). Bacterial flora in the AP system is reported to be involved in plant growth and disease incidence [8,17]; therefore, it is necessary to carefully verify the presence or absence of pathogenicity of Mycobacterium. Ancylobacter pratisalsi is reported to have plant growth promotion abilities [34] Eck et al. (2019) [20] reported that core microbiomes from the coupled and decoupled AP systems shared more common OTUs than with the AC systems. Daily hours of natural sunlight can be a cause of bacteria flora depending on the sampling date (Figure 5). The average hours of sunlight in a day for the two weeks preceding each sampling date were 8.6 h for 5 w-Exp. 1, 7.1 h for 2 w-Exp. 2, 3.8 h for 4 w-Exp. 2, and 1.9 h for 6 w-Exp. 2. The weather may have affected the microbes in the solutions. However, no nutrients measured in the experiments were found to be associated with changes in bacterial flora. More precise measurements of ammonia and nitrite may reveal an association with bacterial flora in the AP system.
Nitrogen recovery in aquaponic systems relies on close linkage among bacteria, fish, and plants [24]. AOB such as Nitrosococcus, Nitrosospira, and Nitrosomonas and NOB such as Nitrobacter, Nitrospira, Nitrococcus, and Nitrospina can be involved [20,21,22]. According to these reports, both recycling AC and AP systems rely on microbial consortia for maintaining water quality and promoting fish/plant health [19]. Among AOB, only Nitrosomonas was detected in late periods of AC in this study, suggesting that they were not detected owing to a low accumulation of ammonia in AP and HP. Among NOBs, Nitrospira and Nitrobacter were found in all plots. Nitrifying bacteria including Nitrosomonas, Nitrobacter, and Nitrospira are commercially used for initiating nitrogen cycling and promoting plant growth [35,36,37]. These bacteria seemed to play important roles in the tanks of AP and AC.
The increase in chloroplasts (Figure 4) in HP and AC led to a decrease in water transparency, probably because of the increase in algae, but it was suppressed in the AP, indicating that AP can maintain and produce water quality more sustainably than the other two plots. The decrease of water transparency in AC can be caused by the increase in algae as a result of the nutrients discharged from the catfish without plants. In AP, food is digested by catfish and gradually absorbed by lettuce plants, while algae and water-polluting microorganisms increase in HP owing to the slower decomposition of feed. The plants maintain good water quality by absorbing the dissolved nutrients in a recirculating AC system [38]. According to a case study on life cycle assessment, AP produced a 45% lower endpoint environmental impact than HP [39].
As a limitation of this study, we initially placed 11.3 kg/m3 of catfish, and then reduced this to 3.8 kg/m3 in a small-scale tank; however, more than 15 to 20 kg/m3 of catfish should be grown at a large economical scale and considered in the application of large-scale industrial production systems. In this study, the amount of food was limited to 0.5 and 1 g per day, so the supply of N and P from the food to catfish and lettuce was not sufficient. It is likely that the volume of the tank and the amount of food limited the number of catfish. In this study, the appetite of catfish after the start of the experiment was relatively low, probably because of changes in the environment. Catfish fights were also a problem. In order to keep them in a system with a small tank capacity, using microhabitat structures such as a shelter may manage stress and reduce aggressive behavior in young Japanese catfish [40]. It might also be valuable to breed and select calm and non-fighting catfish. Recently, slow-swimming Pacific bluefin tuna was produced by genome editing [41]. Catfish could also be improved by genome editing in the future. As mentioned above, natural sunlight could affect microbe flora and the growth of lettuce plants. Further analysis by eliminating the effects of daylight hours would be required to identify the precise functions of microbes involved in AP.
AP systems that rely solely on fish waste to supply nutrients for plants have reported low levels of P, K, Fe, and Mn [3]. As K is an essential element of plants [42], K⁺ in the solutions gradually declined in AP and HP (Figure 1c and Figure 2c). Therefore, it was considered that K supply was indispensable for sustainable AP production. In this study, the pH of solutions was not maintained at the optimum range, as media pH above 7.0 results in reduced micronutrient and phosphorus solubility [42]. In an AP, N utilization efficiency is influenced by pH, and it reached the maximum of 50.9% at pH 6.0, followed by 47.3% at pH 7.5% and 44.7% at pH 9.0 [43]. Higher pH of the solution, however, decreased emission of nitrous oxide (N2O), the third most-emitted greenhouse gas with global warming potential that is generated from biological nitrification and denitrification processes [43]. As an alternative, connection of two independent recirculating units—a recirculating AC unit for fish production and closed HP for plant production—was proposed to allow the use of fish wastewater as a nutrient supply for plants in HP and the optimization of this system for plant growth using fertilizer supply without negative effects on fish rearing [44].
In conclusion, our hypothesis was proved by the fact that feed alone could support plants in HP, but catfish decomposed the feed faster and resulted in vigorous plant growth at the early stage. NO3 was efficiently absorbed by lettuce plants and maintained at a low level. Especially, AP prevented the pollution of the tank solution compared with HP and AC, suggesting that AP is a more sustainable cultivation system even in a small-scale system. Actinobacteria, Alphaproteobacteria, Betaproteobacteria, and Gammaproteobacteria were the major microbial groups in all solutions.

Supplementary Materials

The following are available online at https://www.mdpi.com/article/10.3390/horticulturae7080222/s1, Figure S1: Image of AP system. Figure S2: pH in the solutions. Table S1: Raw data stats. Table S2: Numbers of the top 15 abundant OTUs.

Author Contributions

Conceptualization, K.Y. and I.M.; methodology, I.M., M.I. and A.I.; investigation, K.T. and Y.K.; resources, M.I.; writing—original draft preparation, K.Y. and I.M.; writing—review and editing, H.-J.K.; funding acquisition, M.I. and K.Y. All authors have read and agreed to the published version of the manuscript.

Funding

This work was supported by JSPS KAKENHI Grant number 17KT0070 (Grant-in-Aid for Scientific Research (B) for Agricultural Resources for the Next Generation).

Institutional Review Board Statement

Not applicable.

Informed Consent Statement

Not applicable.

Data Availability Statement

The sequence data presented in this study are available on request from the corresponding author.

Conflicts of Interest

The authors declare no conflict of interest. The funders had no role in the design of the study; in the collection, analyses, or interpretation of data; in the writing of the manuscript; or in the decision to publish the results.

References

  1. Yep, B.; Zheng, Y. Aquaponic trends and challenges—A review. J. Clean. Prod. 2019, 228, 1586–1599. [Google Scholar] [CrossRef]
  2. Frincu, M.; Dumitrache, C. Study regarding nitrification in experimental aquaponics system. J. Young Sci. 2016, 4, 27–32. [Google Scholar]
  3. Tyson, R.V.; Treadwell, D.D.; Simonne, E.H. Opportunities and Challenges to Sustainability in Aquaponic Systems. HortTechnology 2011, 21, 6–13. [Google Scholar] [CrossRef]
  4. Endut, A.; Lananan, F.; Jusoh, A.; Nik, W.N.W.; Ali, N. Aquaponics recirculation system: A sustainable food source for the future water conserves and resources. Malays. J. Appl. Sci. 2016, 1, 1–12. [Google Scholar]
  5. Hargreaves, J.A. Nitrogen biogeochemistry of aquaculture ponds. Aquaculture 1998, 166, 181–212. [Google Scholar] [CrossRef]
  6. Yang, T.; Kim, H.-J. Characterizing Nutrient Composition and Concentration in Tomato-, Basil-, and Lettuce-Based Aquaponic and Hydroponic Systems. Water 2020, 12, 1259. [Google Scholar] [CrossRef]
  7. Sanchez, F.A.; Vivian-Rogers, V.R.; Urakawa, H. Tilapia recirculating aquaculture systems as a source of plant growth promoting bacteria. Aquac. Res. 2019, 50, 2054–2065. [Google Scholar] [CrossRef]
  8. Rakocy, J.E.; Masser, M.P.; Losordo, T.M. Recirculating Aquaculture Tank Production Systems: Aquaponics-Integrating Fish and Plant Culture; SRAC: Stoneville, MS, USA, 2006. [Google Scholar]
  9. Lennard, W.A.; Leonard, B.V. A comparison of three different hydroponic sub-systems (gravel bed, floating and nutrient film technique) in an aquaponic test system. Aquac. Int. 2006, 14, 539–550. [Google Scholar] [CrossRef]
  10. Sace, C.F.; Fitzsimmons, K.M. Vegetable production in a recirculating aquaponic system using Nile tilapia (Oreochromis niloticus) with and without freshwater prawn (Macrobrachium rosenbergii). Acad. J. Agric. Res. 2013, 1, 236–250. [Google Scholar]
  11. Danaher, J.J.; Shultz, R.C.; Rakocy, J.E.; Bailey, D.S. Alternative Solids Removal for Warm Water Recirculating Raft Aquaponic Systems. J. World Aquac. Soc. 2013, 44, 374–383. [Google Scholar] [CrossRef]
  12. Seawright, D.E.; Stickney, R.R.; Walker, R.B. Nutrient dynamics in integrated aquaculture–hydroponics systems. Aquaculture 1998, 160, 215–237. [Google Scholar] [CrossRef]
  13. Liang, J.-Y.; Chien, Y.-H. Effects of feeding frequency and photoperiod on water quality and crop production in a tilapia–water spinach raft aquaponics system. Int. Biodeterior. Biodegrad. 2013, 85, 693–700. [Google Scholar] [CrossRef]
  14. Bartelme, R.P.; Oyserman, B.O.; Blom, J.E.; Sepulveda-Villet, O.J.; Newton, R.J. Stripping Away the Soil: Plant Growth Promoting Microbiology Opportunities in Aquaponics. Front. Microbiol. 2018, 9, 8. [Google Scholar] [CrossRef] [PubMed] [Green Version]
  15. Schmautz, Z.; Graber, A.; Jaenicke, S.; Goesmann, A.; Junge, R.; Smits, T.H. Microbial diversity in different compartments of an aquaponics system. Arch. Microbiol. 2017, 199, 613–620. [Google Scholar] [CrossRef]
  16. Lee, S.; Lee, J. Beneficial bacteria and fungi in hydroponic systems: Types and characteristics of hydroponic food production methods. Sci. Hortic. 2015, 195, 206–215. [Google Scholar] [CrossRef]
  17. Khalil, S. Growth performance, nutrients and microbial dynamic in aquaponics systems as affected by water temperature. Eur. J. Hortic. Sci. 2018, 83, 388–394. [Google Scholar] [CrossRef]
  18. Hüpeden, J.; Wegen, S.; Off, S.; Lucker, S.; Bedarf, Y.; Daims, H.; Kuhn, C.; Spieck, E. Relative Abundance of Nitrotoga spp. in a Biofilter of a Cold-Freshwater Aquaculture Plant Appears To Be Stimulated by Slightly Acidic pH. Appl. Environ. Microbiol. 2016, 82, 1838–1845. [Google Scholar] [CrossRef] [PubMed] [Green Version]
  19. Bartelme, R.P.; Smith, M.C.; Sepulveda-Villet, O.J.; Newton, R.J. Component microenvironments and system biogeography structure microorganism distributions in recirculating aquaculture and aquaponic systems. mSphere 2019, 4, e00143-19. [Google Scholar] [CrossRef] [Green Version]
  20. Eck, M.; Sare, A.; Massart, S.; Schmautz, Z.; Junge, R.; Smits, T.; Jijakli, M. Exploring Bacterial Communities in Aquaponic Systems. Water 2019, 11, 260. [Google Scholar] [CrossRef] [Green Version]
  21. Itoi, S.; Ebihara, N.; Washio, S.; Sugita, H. Nitrite-oxidizing bacteria, Nitrospira, distribution in the outer layer of the biofilm from filter materials of a recirculating water system for the goldfish Carassius auratus. Aquaculture 2007, 264, 297–308. [Google Scholar] [CrossRef]
  22. Rurangwa, E.; Verdegem, M.C.J. Microorganisms in recirculating aquaculture systems and their management. Rev. Aquac. 2015, 7, 117–130. [Google Scholar] [CrossRef]
  23. Schloss, P.D.; Westcott, S.L.; Ryabin, T.; Hall, J.R.; Hartmann, M.; Hollister, E.B.; Lesniewski, R.A.; Oakley, B.B.; Parks, D.H.; Robinson, C.J.; et al. Introducing mothur: Open-source, platform-independent, community-supported software for describing and comparing microbial communities. Appl. Environ. Microbiol. 2009, 75, 7537–7541. [Google Scholar] [CrossRef] [Green Version]
  24. Wongkiew, S.; Park, M.R.; Chandran, K.; Khanal, S.K. Aquaponic systems for sustainable resource recovery: Linking nitrogen transformations to microbial communities. Environ. Sci. Technol. 2018, 52, 12728–12739. [Google Scholar] [CrossRef]
  25. Espinosa Moya, E.A.; Angel Sahagún, C.A.; Mendoza Carrillo, J.M.; Albertos Alpuche, P.J.; Álvarez-González, C.A.; Martínez-Yáñez, R. Herbaceous plants as part of biological filter for aquaponics system. Aquac. Res. 2016, 47, 1716–1726. [Google Scholar] [CrossRef]
  26. Goddek, S.; Körner, O. A fully integrated simulation model of multi-loop aquaponics: A case study for system sizing in different environments. Agric. Syst. 2019, 171, 143–154. [Google Scholar] [CrossRef]
  27. Gruda, N. Increasing Sustainability of Growing Media Constituents and Stand-Alone Substrates in Soilless Culture Systems. Agronomy 2019, 9, 298. [Google Scholar] [CrossRef] [Green Version]
  28. Körner, O.; Bisbis, M.B.; Baganz, G.F.M.; Baganz, D.; Staaks, G.B.O.; Monsees, H.; Goddek, S.; Keesman, K.J. Environmental impact assessment of local decoupled multi-loop aquaponics in an urban context. J. Clean. Prod. 2021, 313, 127735. [Google Scholar] [CrossRef]
  29. Wongkiew, S.; Hu, Z.; Chandran, K.; Lee, J.W.; Khanal, S.K. Nitrogen transformations in aquaponic systems: A review. Aquac. Eng. 2017, 76, 9–19. [Google Scholar] [CrossRef] [Green Version]
  30. Clavijo-Herrera, J.; van Santen, E.; Gómez, C. Growth, Water-Use Efficiency, Stomatal Conductance, and Nitrogen Uptake of Two Lettuce Cultivars Grown under Different Percentages of Blue and Red Light. Horticulturae 2018, 4, 16. [Google Scholar] [CrossRef] [Green Version]
  31. Kasozi, N.; Abraham, B.; Kaiser, H.; Wilhelmi, B. The complex microbiome in aquaponics: Significance of the bacterial ecosystem. Ann. Microbiol. 2021, 71, 1–13. [Google Scholar] [CrossRef]
  32. Urakawa, H.; Dettmar, D.L.; Thomas, S. The uniqueness and biogeochemical cycling of plant root microbial communities in a floating treatment wetland. Ecol. Eng. 2017, 108, 573–580. [Google Scholar] [CrossRef]
  33. Tsuchiya, C.; Sakata, T.; Sugita, H. Novel ecological niche of Cetobacterium somerae, an anaerobic bacterium in the intestinal tracts of freshwater fish. Lett. Appl. Microbiol. 2008, 46, 43–48. [Google Scholar] [CrossRef]
  34. Suarez, C.; Ratering, S.; Schafer, J.; Schnell, S. Ancylobacter pratisalsi sp. nov. with plant growth promotion abilities from the rhizosphere of Plantago winteri Wirtg. Int. J. Syst. Evol. Microbiol. 2017, 67, 4500–4506. [Google Scholar] [CrossRef] [PubMed]
  35. Day, J.A.; Otwell, A.E.; Diener, C.; Tams, K.E.; Bebout, B.; Detweiler, A.M.; Lee, M.D.; Scott, M.T.; Ta, W.; Ha, M.; et al. Negative plant-microbiome feedback limits productivity in aquaponics. bioRxiv 2019, 709162. [Google Scholar] [CrossRef] [Green Version]
  36. Matsumoto, S.; Ishikawa, D.; Saeki, G.; Aoi, Y.; Tsuneda, S. Microbial population dynamics and community structure during the formation of nitrifying granules to treat ammonia-rich inorganic wastewater. Microbes Environ. 2010, 25, 164–170. [Google Scholar] [CrossRef] [Green Version]
  37. Saijai, S.; Ando, A.; Inukai, R.; Shinohara, M.; Ogawa, J. Analysis of microbial community and nitrogen transition with enriched nitrifying soil microbes for organic hydroponics. Biosci. Biotechnol. Biochem. 2016, 80, 2247–2254. [Google Scholar] [CrossRef] [PubMed] [Green Version]
  38. Gichana, Z.M.; Liti, D.; Waidbacher, H.; Zollitsch, W.; Drexler, S.; Waikibia, J. Waste management in recirculating aquaculture system through bacteria dissimilation and plant assimilation. Aquac. Int. 2018, 26, 1541–1572. [Google Scholar] [CrossRef]
  39. Chen, P.; Zhu, G.; Kim, H.-J.; Brown, P.B.; Huang, J.-Y. Comparative life cycle assessment of aquaponics and hydroponics in the Midwestern United States. J. Clean. Prod. 2020, 275, 122888. [Google Scholar] [CrossRef]
  40. Arsin, N.E.; Estim, A.; Mustafa, S. Behavior and response of Japanese catfish (Silurus asotus) in captivity provided with an artificial microhabitat mosaic. Aquat. Res. 2018, 1, 136–139. [Google Scholar] [CrossRef]
  41. Higuchi, K.; Kazeto, Y.; Ozaki, Y.; Yamaguchi, T.; Shimada, Y.; Ina, Y.; Soma, S.; Sakakura, Y.; Goto, R.; Matsubara, T.; et al. Targeted mutagenesis of the ryanodine receptor by Platinum TALENs causes slow swimming behaviour in Pacific bluefin tuna (Thunnus orientalis). Sci. Rep. 2019, 9, 13871. [Google Scholar] [CrossRef] [Green Version]
  42. Hochmuth, G.J. Fertilizer management for greenhouse vegetables. In Florida Greenhouse Vegetable Production Handbook; Institute of Food and Agricultural Sciences, University of Florida: Gainesville, FL, USA, 2001; Volume 3. [Google Scholar]
  43. Zou, Y.; Hu, Z.; Zhang, J.; Xie, H.; Guimbaud, C.; Fang, Y. Effects of pH on nitrogen transformations in media-based aquaponics. Bioresour. Technol. 2016, 210, 81–87. [Google Scholar] [CrossRef] [PubMed]
  44. Suhl, J.; Dannehl, D.; Kloas, W.; Baganz, D.; Jobs, S.; Scheibe, G.; Schmidt, U. Advanced aquaponics: Evaluation of intensive tomato production in aquaponics vs. conventional hydroponics. Agric. Water Manag. 2016, 178, 335–344. [Google Scholar] [CrossRef]
Figure 1. Changes in NO3, PO43−, K+, and EC (ad) in the solution of aquaponics (AP), hydroponics (HP), and aquaculture (AC) in Exp. 1. Mean ± SE (n = 3). WAT: weeks after transplanting.
Horticulturae 07 00222 g001
Figure 2. Changes in NO3, PO43−, K+, and EC (ad) in the solution of aquaponics (AP), hydroponics (HP), and aquaculture (AC) in Exp. 2. Mean ± SE (n = 3). WAT: weeks after transplanting.
Horticulturae 07 00222 g002
Figure 3. Total nitrogen (a) and nitrogen concentration (b) in leaf of lettuce in aquaponics (AP) and hydroponics (HP) at 0, 2, 4, and 6 weeks after transplant (WAT) in Exp. 2. Mean ± SE (n = 4). * indicates significant difference according to t-test (p < 0.05).
Horticulturae 07 00222 g003
Figure 4. The relative abundance of classes in each sample in Exp. 1 and 2. AP: aquaponics, HP: hydroponics, AC: aquaculture. Classes representing less than 1% of the total reads were categorized under Others including Chlamydiia, Flavobacteriia, Spartobacteria, Negativicutes, Subdivision 3, Planctomycetia, Deltaproteobacteria, Bacilli, Candidatus Saccharibacteria, Caldilineae, Opitutae, Fusobacteriia, Epsilonproteobacteria, Gemmatimonadetes, Erysipelotrichia, Nitrospira, and 22 classes.
Horticulturae 07 00222 g004
Figure 5. Principal coordinate analysis presenting the separation among Exp. 1 (January 11: 5 weeks) and Exp. 2 (June 6: 2 weeks, June 21: 4 weeks, and July 4: 6 weeks). MDS 1 and 2 explain % of the total variability.
Horticulturae 07 00222 g005
Table 1. Growth of lettuce plants in aquaponics (AP) and hydroponics (HP) in Exp. 1.
Treat.Number of LeavesMaximum Length of Leaf (cm)Fresh Weight of Shoots (g)Fresh Weight of Roots (g)SPAD Value
0 weeks after transplanting (WAT)
8.0 ± 0.5 16.5 ± 0.40.46 ± 0.060.025 ± 0.00922.4 ± 2.1
2 WAT
AP10.7 ± 0.312.1 ± 0.39.9 ± 1.72.1 ± 0.427.6 ± 0.3
HP9.0 ± 0.68.4 ± 0.75.2 ± 1.43.3 ± 1.023.3 ± 1.3
T testNS 2**NSNS*
4 WAT
AP15.0 ± 0.026.3 ± 0.479.4 ± 2.614.8 ± 2.030.1 ± 1.1
HP13.3 ± 0.314.9 ± 0.836.6 ± 1.27.9 ± 1.026.4 ± 1.0
T test*********NS
6 WAT
AP16.2 ± 1.729.9 ± 0.988.9 ± 17.011.6 ± 2.928.9 ± 1.0
HP15.8 ± 1.221.5 ± 1.568.0 ± 9.812.9 ± 2.427.1 ± 1.2
T testNS**NSNSNS
1 Mean ± SE (n = 3 or 5). 2 NS, *, **, ***: non-significant, significant at p < 0.05, 0.01, or 0.001 according to t-test.
Table 2. Growth of lettuce plants in aquaponics (AP) and hydroponics (HP) in Exp. 2.
Treat.Number of LeavesMaximum Length of Leaf (cm)Fresh Weight of Shoots (g)Fresh Weight of Roots (g)SPAD Value
0 weeks after transplanting (WAT)
4.5 ± 0.2 17.5 ± 0.61.0 ± 0.20.2 ± 0.025.0 ± 1.8
2 WAT
AP9.8 ± 1.510.7 ± 0.610.5 ± 2.56.6 ± 1.623.9 ± 0.6
HP6.0 ± 0.48.4 ± 0.52.7 ± 0.32.6 ± 0.218.1 ± 0.9
T testNS 2*****
4 WAT
AP14.5 ± 0.915.2 ± 1.129.7 ± 4.019.3 ± 3.524.8 ± 1.4
HP11.3 ± 1.511.5 ± 2.023.2 ± 7.512.7 ± 4.424.4 ± 0.8
T testNSNSNSNSNS
6 WAT
AP21.0 ± 2.416.0 ± 1.556.4 ± 19.828.6 ± 6.126.8 ± 2.1
HP18.3 ± 3.120.8 ± 1.472.1 ± 16.326.8 ± 6.428.0 ± 0.5
T testNSNSNSNSNS
1 Mean ± SE (n = 4 or 6). 2 NS, *, **: non-significant, significant at p < 0.05 or 0.01 according to t-test.
Publisher’s Note: MDPI stays neutral with regard to jurisdictional claims in published maps and institutional affiliations.

