Article

Effect of the Method of Microspore Isolation on the Efficiency of Isolated Microspore Culture In Vitro for Brassicaceae Family

Federal State Budgetary Scientific Institution Federal Scientific Vegetable Center (FSBSI FSVC), Selektsionnaya St., 14, VNIISSOK, Odintsovo Reg., 143072 Moscow, Russia
*
Authors to whom correspondence should be addressed.
Horticulturae 2022, 8(10), 864; https://doi.org/10.3390/horticulturae8100864
Submission received: 23 August 2022 / Revised: 13 September 2022 / Accepted: 19 September 2022 / Published: 22 September 2022
(This article belongs to the Section Propagation and Seeds)

Abstract

:
Isolated microspore culture in vitro (IMC) is an advanced technique for producing doubled haploids. We developed a modified microspore isolation method for the Brassicaceae family, which exceeds the results obtained by a standard microspore isolation method. We found that the new method allows an increase in the percentage of microspores at the embryogenic stage of development in the culture. In the spring rapeseed ‘Ratnik’ culture the percentage of microspores increases from 66.7% to 73%, and in the European radish ‘RBK’ from 34% to 61.9%. Moreover, the new method of microspore isolation made it possible to expand the range of linear bud sizes (from 3.5–4.0 to 3.0–4.5 mm for spring rapeseed ‘Ratnik’) suitable for IMC technology. In addition, the new method of microspore isolation reduced the debris in the preparation of spring rapeseed ‘Ratnik’ and European radish ‘RBK’ by 2.4 and 15 times, respectively. The best results were shown on Sareptian mustard No. 72, where the yield of embryoids increased by 7.5 times. Remarkably, the new method of microspore isolation allowed us to obtain the first embryoids of red cabbage No. 428, whereas no embryoids were obtained using the standard method of microspore isolation. In summary, the new method of microspore isolation allows an increase in the efficiency of IMC technology for Brassicaceae family crops.

1. Introduction

The family Brassicaceae Burnett includes a large number of important agricultural and horticultural crops. For F1 hybrids, homozygous lines are used as parental lines. Breeding homozygous parental lines using traditional plant-breeding methods is difficult because Brassicaceae family crops are cross-pollinated.
Haploid technologies can effectively speed up the breeding process, increase biodiversity through gametoclonal variability, and facilitate selection of plants with recessive and selectionally valuable traits [1,2,3,4]. The current advanced biotechnological method is the production of doubled haploids in isolated microspore culture in vitro (IMC). The IMC technique is more efficient than anther and unpollinated ovule culture in vitro, and because no somatic cells are present in the microspore culture, there is no need for an additional step of molecular testing of the obtained plants for homozygosity [5,6]. So, this technique is preferable to the cultures for which it was developed.
After the first report by Lichter [7] on the successful isolation of Brassica napus microspores, research in this area has progressed considerably and expanded to other crops. However, IMC technology is not universal and even within well-developed genera it shows genotype-specificity, not to mention that for many plants obtaining doubled haploids using IMC technology remains impossible or inefficient. Therefore, IMC technology should be further improved.
In vitro culture of microspores is a multi-stage complex technology, and a huge number of factors influence its efficiency [6,8]. One of the most important factors is the stage of microspore development. Numerous studies have shown that microspores at the late unicellular vacuolized stage and pollen at the early bicellular stage (for convenience, we will refer to both these stages as microspores) can change their developmental pathway from gametophytic to sporophytic [8]. Since only these microspore stages are capable of embryogenesis, microspores at other developmental stages die during cultivation and have a toxic effect on the cell culture [9]. In view of this, not only the presence of microspores at responsive stages of embryogenesis, but also a minimal number of microspores at other stages, are important in cell culture [10]. The uneven maturation of microspores in the anthers of buds is expressed in different degrees in different cultures, and for such cultures where the unevenness of microspore development is significant, it can play a decisive role in the success of IMC technology [11]. It also leads to a narrowing of the suitable bud size range, which technically complicates the technology [12,13]. There are a number of studies that have attempted to separate only developmental stages responsive to embryogenesis from microspore suspension, but these modifications are difficult to apply in practice and require expensive reagents, limiting their use in extensive practice [14,15,16].
In addition to dead microspores, organic components of the cell content of protoplasts and destroyed fragments of somatic cells of anthers and bud tissues that get into the culture can have a toxic effect on the cell culture [5,9]. This inevitably occurs due to mechanical effects on bud tissues during isolation of microspores. In standard protocols for obtaining doubled haploids through in vitro microspore culture, isolation of microspores occurs by breaking buds immersed in nutrient medium: in magnetic stirrer boxes [13]; by compressing buds with a rotary motion in test tubes using a piston (syringe) [17]; by grinding buds with a pestle in a mortar [18]; by crushing buds with a glass rod in a test tube [19]; or by crushing buds in a blender [20].
We propose to modify the stage of isolation of microspores from buds of Brassicaceae so that in vitro culture microspores are preferentially introduced/injected at the stage of development optimal for embryogenesis and to minimize the presence of foreign particles. In the present study, for the first time, we evaluated how standard methods of microspore isolation affect the efficiency of IMC technology and compared them with the new method of isolation in Brassicaceae cultures.

2. Materials and Methods

2.1. Materials

Two cultivars of spring rape (Brassica napus var. napus), one cultivar type of European radish (Raphanus sativus L. subsp. sativus convar. radicula), two cultivars of mustard (Brassica juncea (L.) Czern.), two cultivars of red cabbage (Brassica oleracea var. capitata f. rubra), and two cultivars of white head cabbage (Brassica oleracea var. capitata.) were grown in 2020–2021 all year round in a chamber with artificial climate in FSBSI FSVC Moscow District, Russia (Table 1).

2.2. Growing Donor Plants

Donor plants were grown in 0.6 to 7.5 L pots (transplanted as the plants grew), filled with a mixture of peat, vermiculite and sand (6:1:1), in an artificial climate chamber under a 16 h photoperiod with used lamps, Horturion HPS, 600 W 220 V E40 (Osram, Slovenia), a light intensity of 65 μmol m−2s−1 and 19 °C constant temperature.
When the plants were at the 2–3 leaf stage, they were started on watering three times a week with 0.1 g·L−1 liquid fertilizer (N-13%, P2O5-5%, K2O-25%, MgO-2%, S-8%, Fe (EDTA)-0.054%, Zn (EDTA)-0.014%, Cu (EDTA)-0.01%, Mn (EDTA)-0.042%, Mo-0.004%, B-0.02%).

2.3. Isolated Microspore Culture (IMC)

2.3.1. Cytological Analysis of the Microspores in Buds of Different Sizes

Before selecting buds for IMC, a reconnaissance cytological analysis of the microspores in buds of different sizes was carried out. Differential staining was used to visualize the microspores [21] and an Axio Imager A2 microscope (Carl Zeiss Microscopy GmbH, Jena, Germany). The bud length corresponding to the maximum relative concentration of microspores at the late uninucleated vacuolized stage of development and the early binucleated pollen stage was selected for inoculation, and smaller and larger buds relative to the optimum were used in the study.

2.3.2. Surface Sterilization of Buds

The buds were surface sterilized for 30 s in 70% ethanol, followed by 15 min in 50% aqueous solution of a commercially available whitewash with Tween-20 added (1 drop per 100 mL). The buds were rinsed three times for 10 min in sterile distilled water.

2.3.3. Microspore Isolation Stage

Microscopes from sterilized buds were isolated in three different ways. The isolations in different ways were variants of experiments, that is, one variant of the experiment was a standard protocol with one of the following methods of isolation (standard method No. 1, standard method No. 2, new method No. 3):
Standard method No. 1—pestle grinding: sterile buds are immersed in a mortar with NLN-13 nutrient medium and ground with a sterile pestle [18].
Standard method No. 2—Magnetic stirrer: Sterile buds are dipped into sterile beakers with magnets and NLN-13 medium [7]. The beakers are placed on the magnetic stirrer for a short time. It is necessary for the magnet to break the integrity of the buds so that the microspores can enter the suspension [13].
New method No. 3—cutting: Sterile buds are cut into two parts with a scalpel, the cut is made crosswise in the middle of the bud. The halves of the buds are submerged into sterile round-bottomed tubes with NLN-13 medium. The tubes with buds are shaken on a Mini-Centrifuge/Vortex FV-2400 Micro-Spin (Biosan, Riga, Latvia) for 1 to 30 s.

2.3.4. Filtration and Washing of the Microspore Suspension

After obtaining the microspore suspension, it was filtered through a 40 micron nylon filter and centrifuged for 5 min in an Eppendorf 5804R (Eppendorf, Hamburg, Germany) at 130 g. The supernatant was then drained, and the liquid was brought back to its original volume with NLN-13; this washing procedure was repeated twice more. All further procedures were performed according to the standard methodology developed in the Laboratory of Biotechnology (Federal State Budgetary Scientific Institution Federal Scientific Vegetable Center (FSBSI FSVC)) for Brassicaceae microspore culture [22].

2.4. Data Visualisation

A Primo Vert inverted microscope (Carl Zeiss Microscopy GmbH, Jena, Germany), a Stemi 508 stereomicroscope and an Axiocam 305 color camera (Carl Zeiss Microscopy GmbH, Jena, Germany), were used to visualize the live culture.

2.5. Experiment Series

2.5.1. Assessment of the Qualitative Composition of the Microspore Population and the Foreign Matter Content in the Preparation According to the Three Methods of Microspore Isolation

The first series of experiments included the cultivar of spring rapeseed ‘Ratnik’ as a model crop and a cultivar of European radish ‘RBK’ (pink-red with white tip) as the least responsive to embryogenesis in the Brassicaceae family. Experiments were carried out in 2020–2022. Two independent trials were set up in triplicate. Buds of 2.5–3.0 mm, 3.0–3.5 mm, 3.5–4.0 mm and 4.0–4.5 mm were used for spring rapeseed; buds of 2.0–2.5 mm, 2.5–3.0 mm, 3.0–3.5 mm, 3.5–4.0 mm and 4.0–4.5 mm were used for European radish.
Inoculation was carried out according to the standard protocol with a variation of the microspore isolation step. Isolation was performed in three ways (Methods No. 1, 2, and 3 see Section 2.3.3). The qualitative composition of the microspore population (relative content of different developmental stages) in the preparation and the content of foreign debris was assessed immediately after the microspores were introduced into the culture. Petri dishes were inspected using a Primo Vert, Zeiss microscope (Carl Zeiss Microscopy GmbH, Jena, Germany), with completely randomized six-fold photo fixation of each test variant on an Axiocam 305 color (Carl Zeiss Microscopy GmbH, Jena, Germany). Data analysis was carried out using data obtained from photographs. Objects on the photos were counted in ScopePhoto 3.1 software.
Debris was assessed by the visible particles on photographs of preparation. The qualitative composition of the microspore population was assessed by direct counting of microspores at different stages of development on photographs of preparation, focusing on their area size and shape.

2.5.2. Evaluation of the Effectiveness of the IMC Technology Depending on the Two Methods of Microspore Isolation

The goal of all research on IMC technology is to increase its efficiency. Therefore, in the second series of experiments we evaluated the main parameter that is important for practical applications—embryoids yield depending on the method of microspore isolation. For this series of experiments, we chose microspore isolation method No. 2 and No. 3 (see Section 2.3.3), which showed the best results according to the first series of experiments.
The experiments were performed in triplicate in 3 independent trials in different bud sizes on the cultivars listed in Table 1. Estimation of the embryoids yield depending on the two methods of microspore isolation was performed by counting the number of embryoids on day 30 of cultivation.

2.6. Statistical Analysis

At the first series of experiments, clogging of the preparation by debris was estimated as the ratio of debris particles pcs. to the number of microspores in the culture pcs. in each photo in each experiment variant. Statistical analysis was performed using Statistica software. The data were analyzed using the Levene test (to check for homogeneity of variance), and then were subjected to analysis of variance (two-way ANOVA, factors: isolation method*bud size) followed by comparison of group means (Duncan’s multiple range test (MRT)) at a probability level of 0.05 (p). The contribution of the influence of isolation method factor, kidney size factor, and their interaction on clogging of the preparation by debris were visualized using Microsoft Excel for Windows for Mac.
For ease of analysis, the qualitative composition of the population of microspores in the preparation, the stages of microspore development were divided into three groups of fractions. The developmental stages most responsive to embryogenesis, the late single-nucleated vacuolized stage and the early double-nucleated stage, were allocated to the second fractional group. The first fraction included all stages of microspore development corresponding to earlier microspore development (before the single-nucleated non-vacuolized stage of development), while the third fraction included microspores at a later stage of development (after the early dual-nucleated stage of development) compared to the second fraction.
The qualitative composition of the population of microspores in the preparation was evaluated by the percentage ratio of different fractions of microspores in each photo of each replicate in each experiment variant, then graphs were plotted using the average values of the data obtained within one experiment variant. Statistical analysis was performed using Statistica software. The data were analyzed using the Levene test (to check for homogeneity of variance), and then were subjected to analysis of variance (two-way ANOVA, factors: isolation method*bud size) followed by comparison of group means (MRT) at a probability level of 0.05 (p). Microsoft Excel for Windows for Mac was used to calculate the data and plot the graphs.
For statistical processing of the second series of experiments, we used the Statistica software. The efficiency of the IMC technology was evaluated by the number of embryoid yields depending on the method of microspore isolation and bud size using a two-way ANOVA statistical analysis, the Levene test and MRT test at p ≤ 0.05. The contribution of the influence of the isolation method factor, kidney size factor, and their interaction on the embryoid yield were visualized using Microsoft Excel for Windows for Mac.

3. Results

3.1. Assessment of the Qualitative Composition of the Microspore Population and the Foreign Matter Content in the Preparation, Depending on the Three Methods of Microspore Isolation

3.1.1. Assessing the Debris of the Preparation with Impurities

Figure 1 shows images of preparations of spring rapeseed ‘Ratnik’ and European radish ‘RBK’ with methods of isolation No. 2 and No. 3, where we can see that in addition to microspores in the preparation there is visible foreign debris.
The results of the assessment of debris contamination of the preparation are presented in Table 2.
It was shown that the preparation was most contaminated by pestle rubbing (method No. 1); the debris ratio of spring rapeseed ‘Ratnik’was 3.26–9.01, the debris ratio of European radish ‘RBK’ was 12.06–40.47. When using a magnetic stirrer (method No. 2), the preparation showed intermediate values of the degree of debris; the debris factor of spring rapeseed ‘Ratnik’ was 1.27–3.12, the debris factor of European radish ‘RBK’ was 3.72–11.45. When the buds were cut (method No. 3) with a scalpel, the preparation was the cleanest; the debris factor of spring rapeseed ‘Ratnik’ was 0.56–1.59, the debris factor of European radish ‘RBK’ was 0.28–0.59. The difference in the clogging of preparations by debris was a significant difference depending on the method of microspore isolation, size of buds and their interaction, while the contribution of the influence of these factors on the debris contamination of preparations was different. The method of microspore isolation had the greatest effect on the contamination of the preparation by debris (68% and 64% for spring rapeseed ‘Ratnik’ and European radish ‘RBK’, respectively).

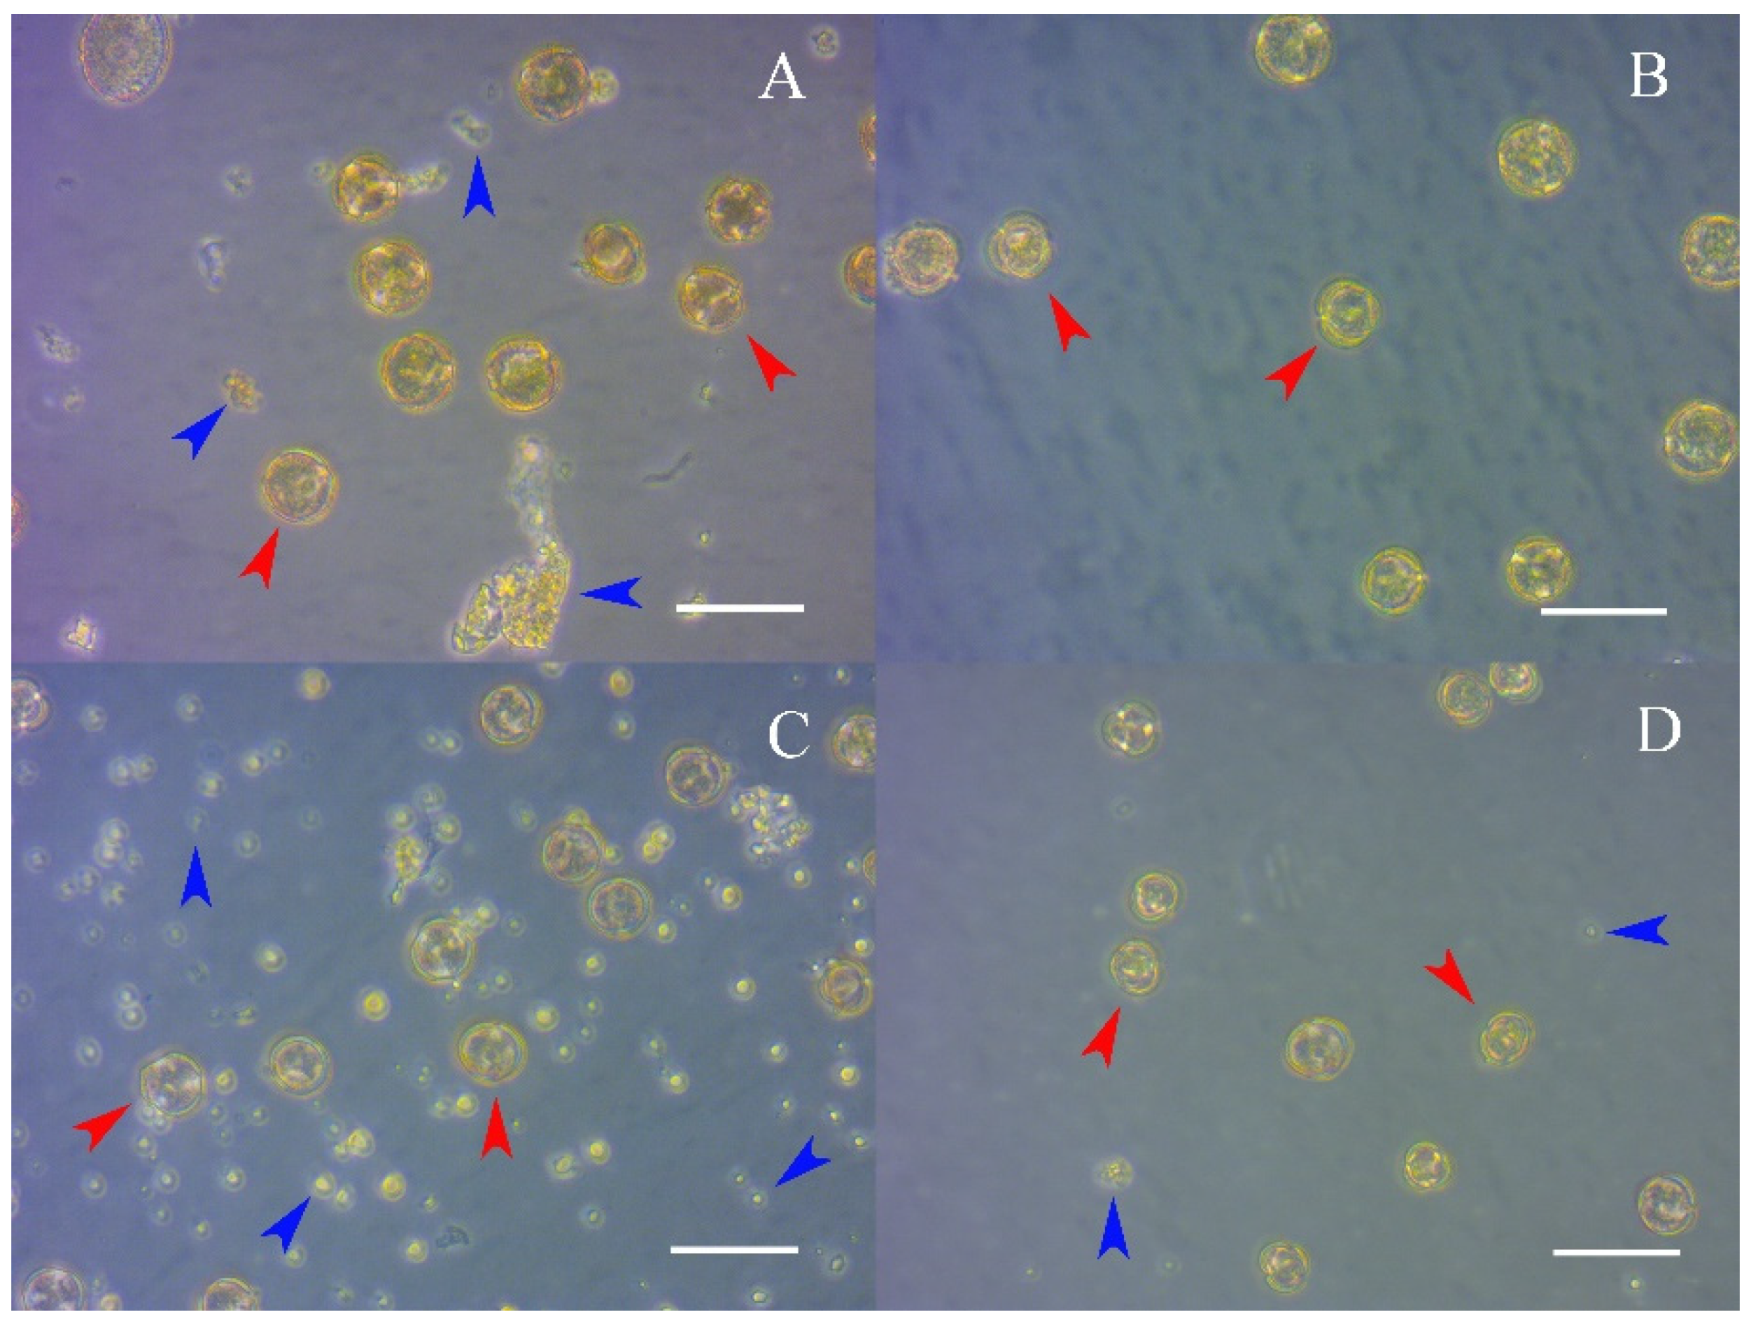
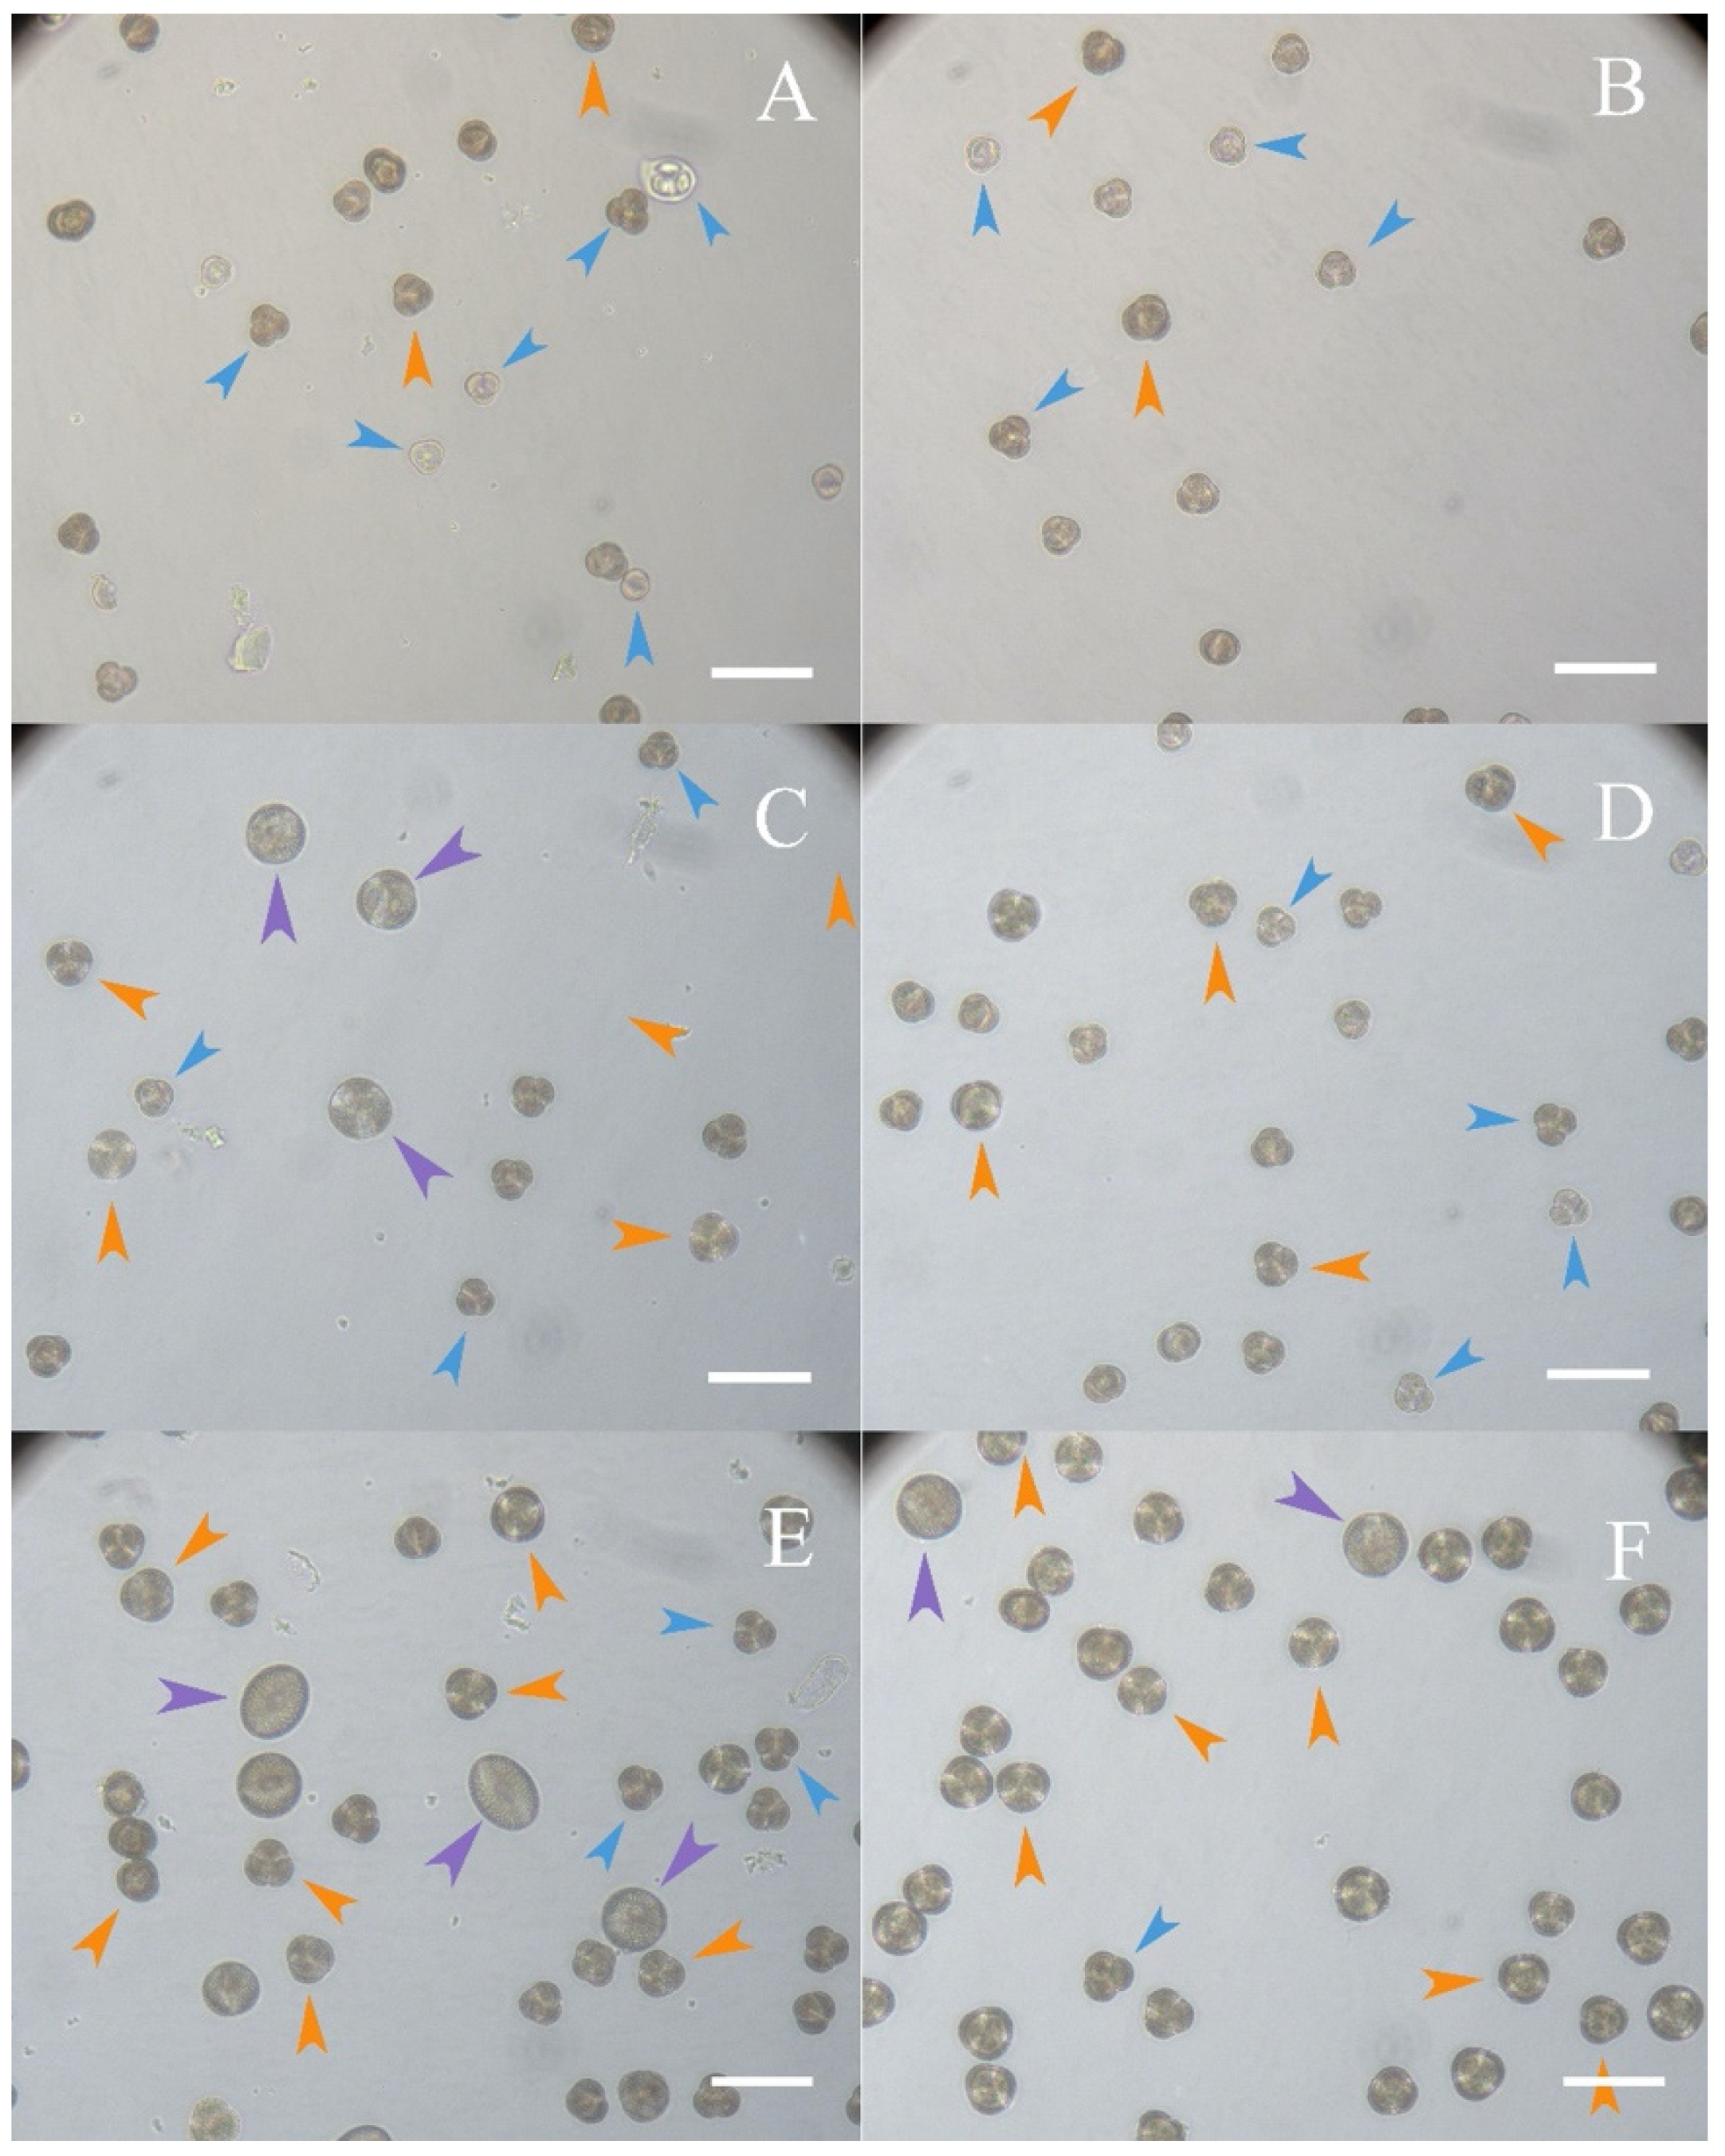
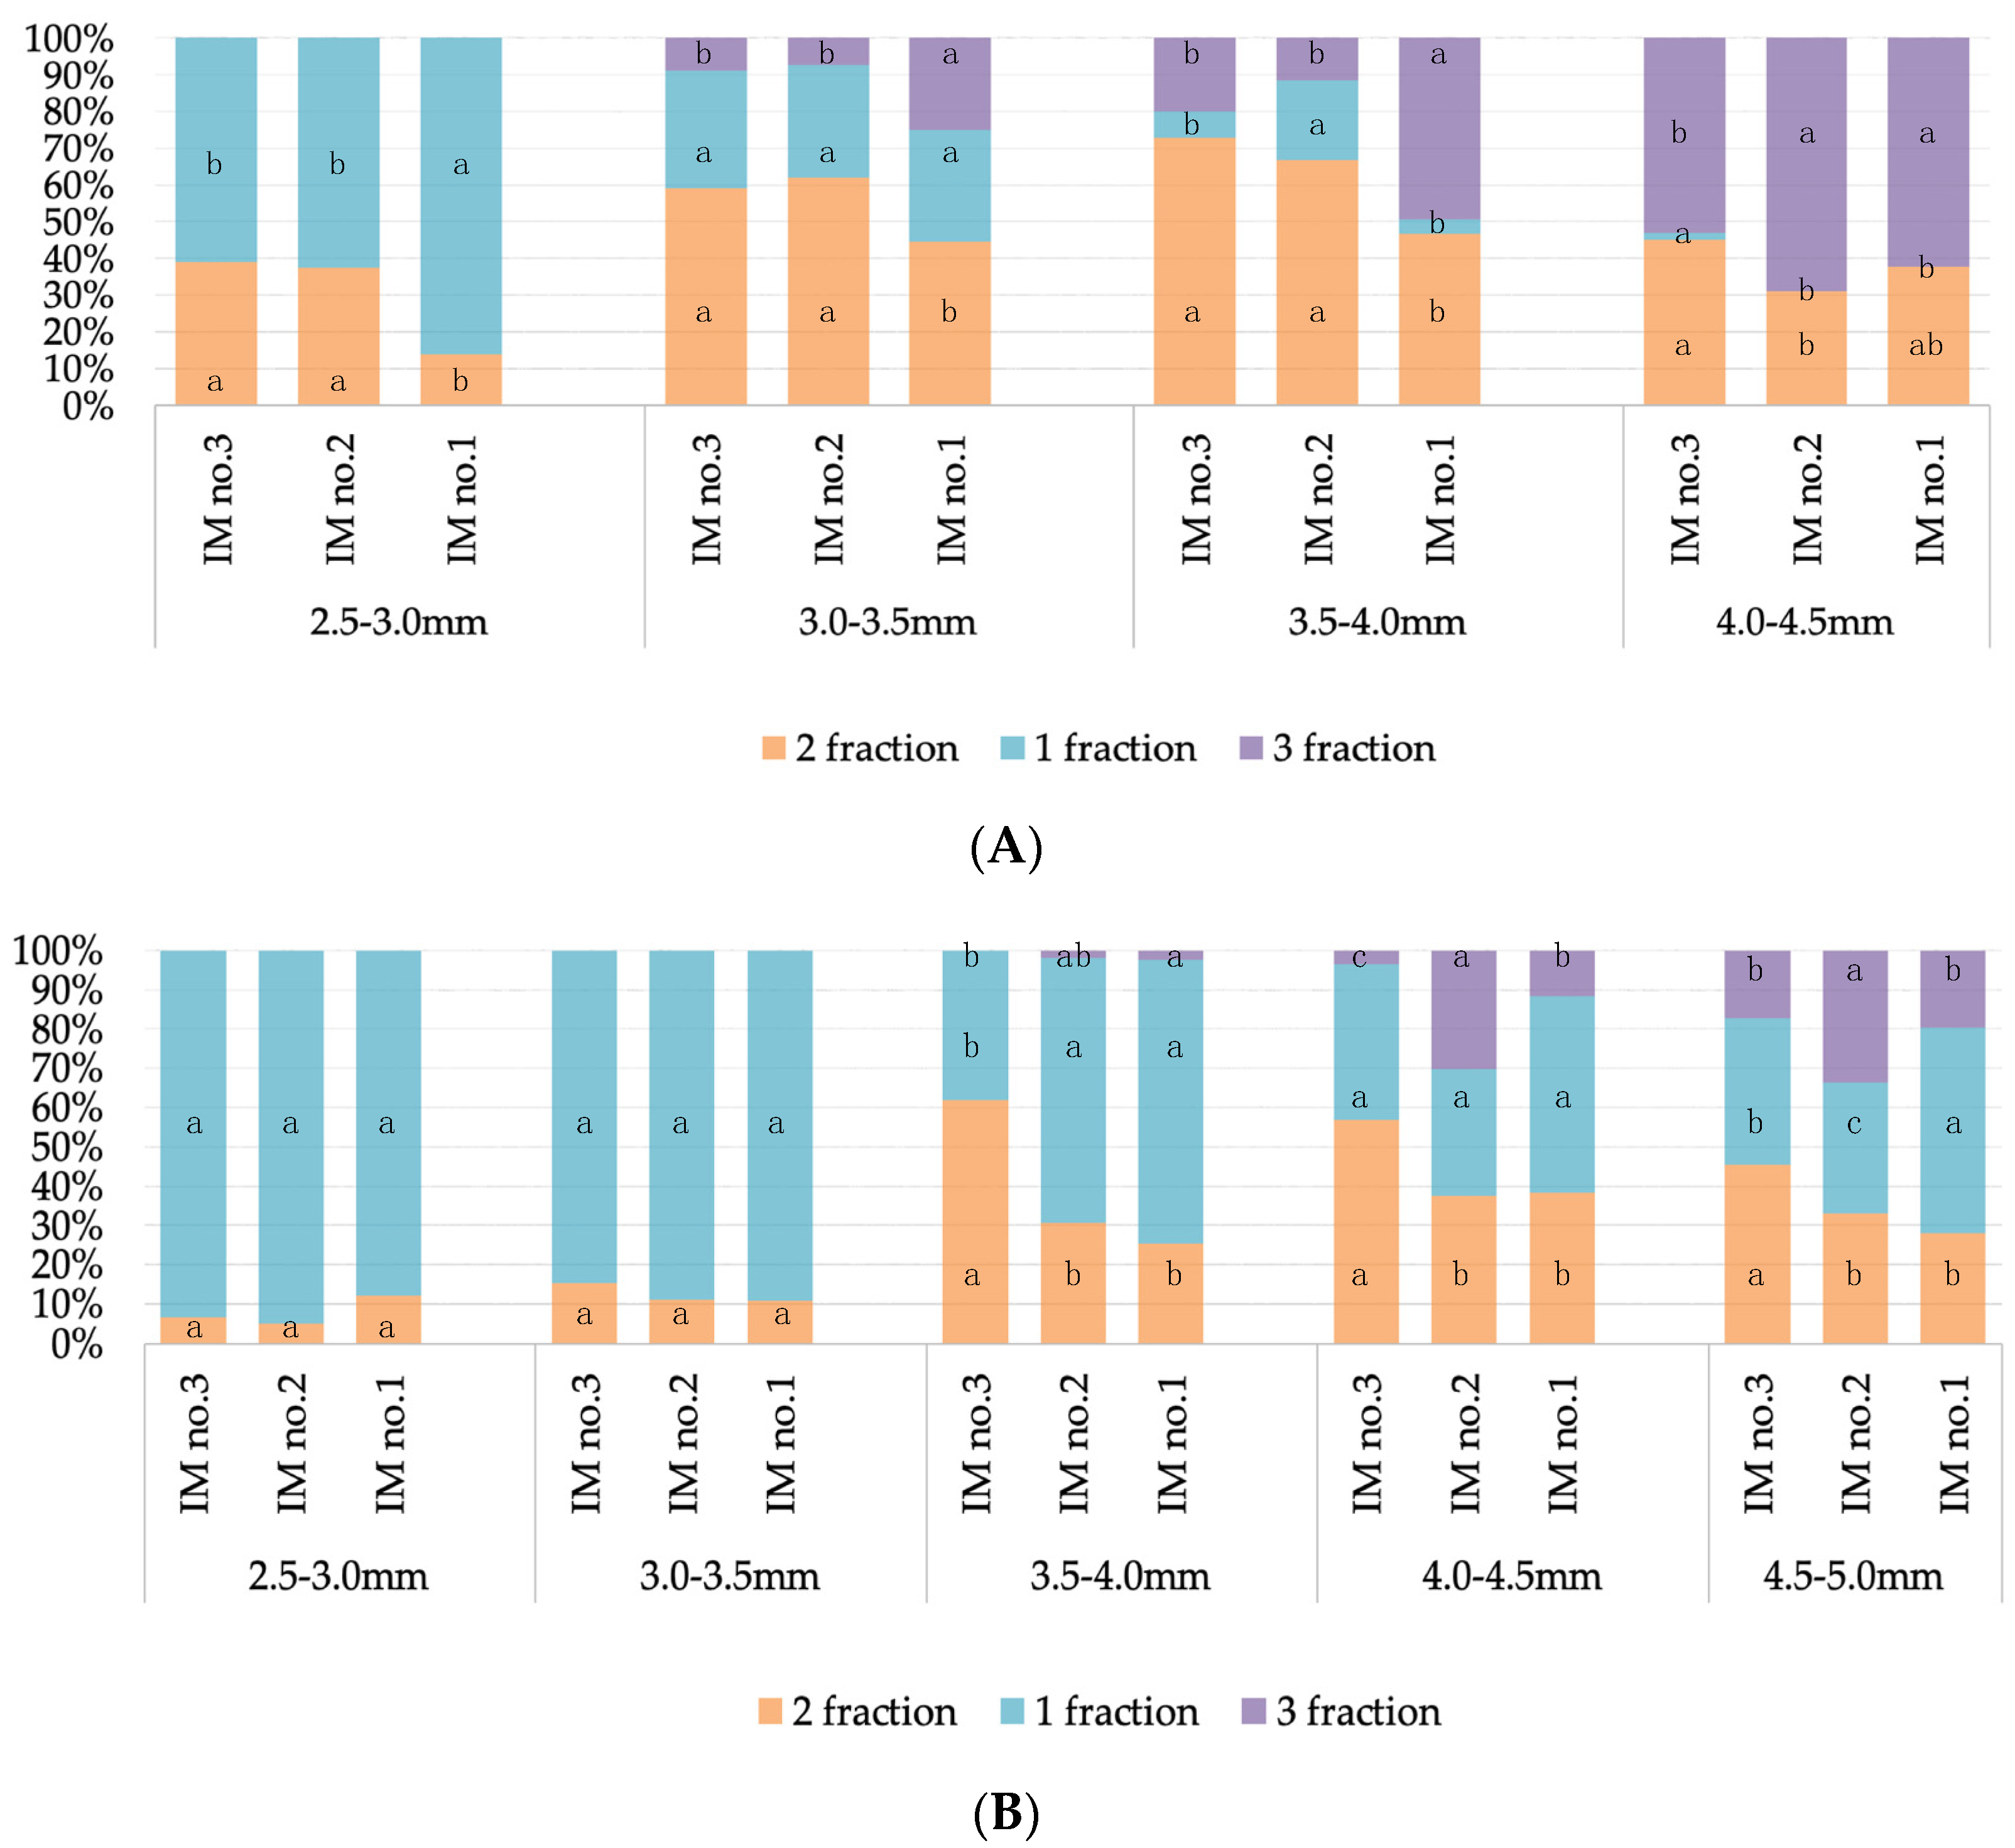
3.1.2. Assessment of the Qualitative Composition of the Microspore Population in the Preparation

Figure 2 shows images of a preparation of Sareptian mustard ‘Sudarushka’ at isolations 2 and 3 and bud sizes 2.5–2.9 mm; 2.9–3.3 mm; 3.3–3.7 mm. which shows how we evaluated microspores at different stages of development and included them in different fraction groups.
It was shown that the percentage of different stages of microspore development in the preparation differed depending on the method of microspore isolation and bud size (Figure 3A,B).
Thus, the relative concentration of microspores of the second fraction in spring rapeseed ‘Ratnik’ reached a maximum at bud size of 3.5–4.0 mm and was 73% for isolation method No. 3, 66.7% for isolation method No. 2 and 46.7% for isolation method No. 1. In general, in spring rape the concentrations of the second fraction were significantly higher in bud sizes 3.0–4.0 mm in all variants of the experiment, but the percentage of the second fraction was significantly lower in isolation method No. 1 than in other variants. Thus, for spring rape the worst isolation method is method No. 1. In addition, in contrast to the method of isolation No. 3 in the variant of experiments with isolation No. 1 and No. 2 in the size of buds 4.0–4.5 mm, the concentration of the second fraction microspores did not exceed 40%, which, together with the level of debris may be a decisive factor in the effectiveness of IMC technology.
The relative concentration of microspores of the second fraction in radish European ‘RBK’ reached a maximum of 61.9%—with a bud size of 3.0–3.5 mm in method of isolation No. 3, 34% at the bud size of 3.5–4.0 mm in method of isolation No. 2 and 38.2% at the bud size of 3.5–4.0 mm in method of isolation No. 1. In the European radish crop, the third method of isolation significantly increased the concentration of the second fraction compared with the other variants of the experiment. Moreover, the concentration of the second fraction in the third isolation method was higher in the 3.0–4.5 mm bud range than in all bud sizes in isolation methods No. 1 and No. 2. Thus, for European radish the third method of isolation was the best (Figure 3B).

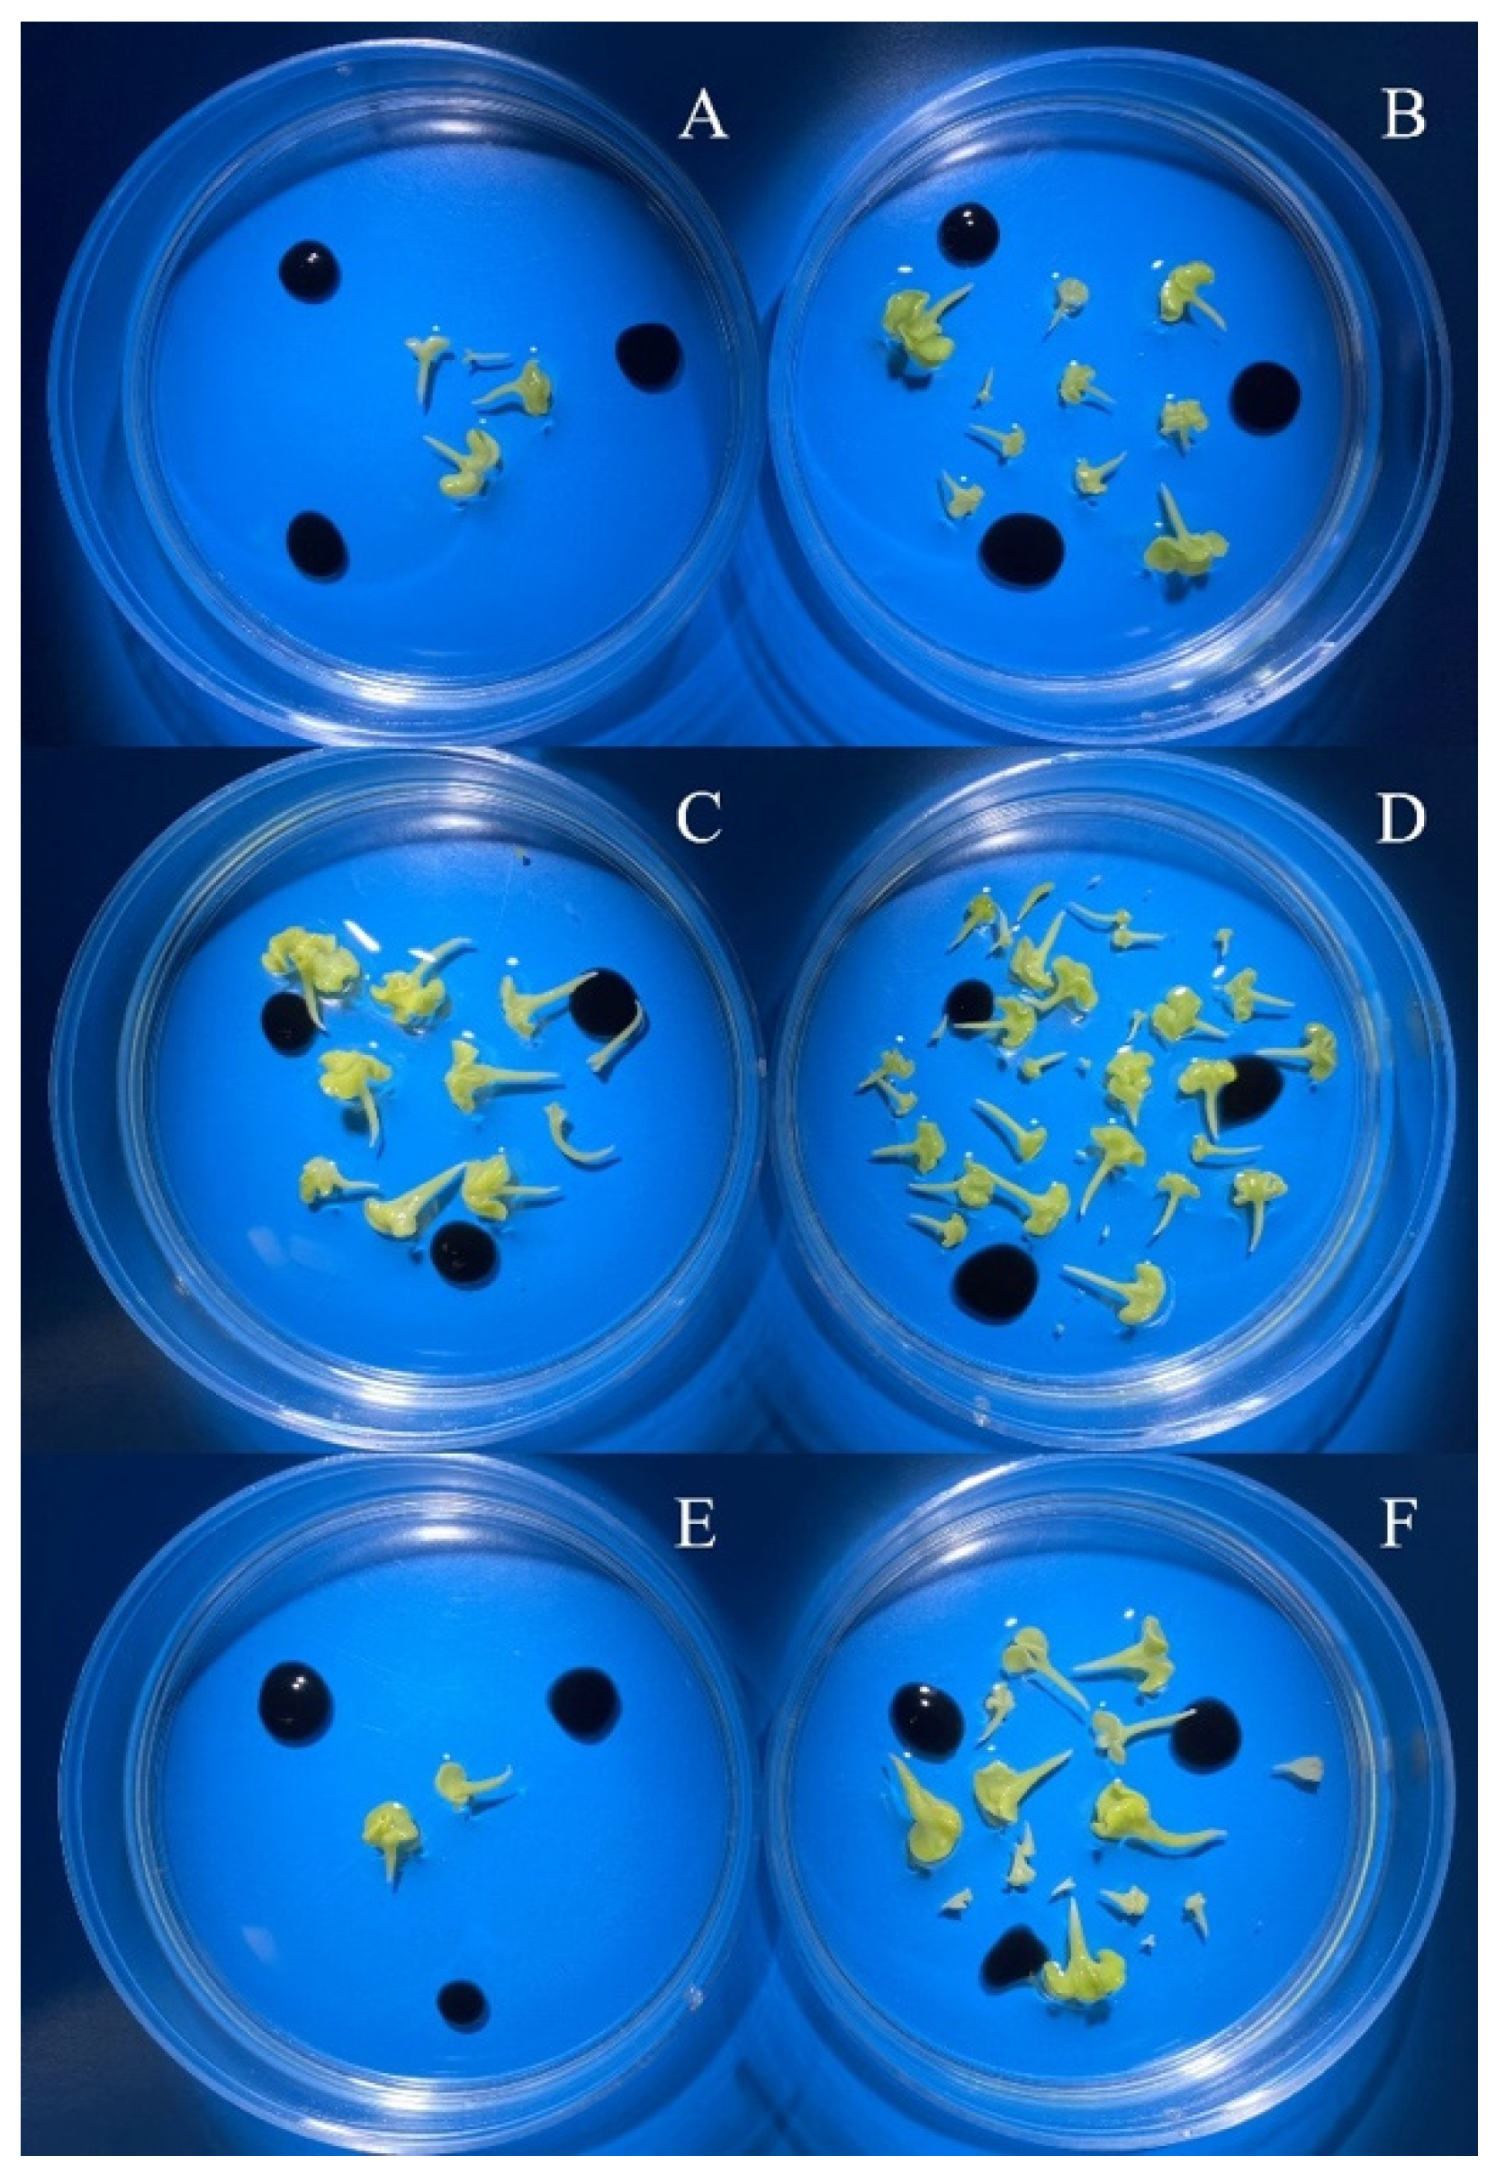
3.2. Evaluation of the Effectiveness of IMC Technology Depending on the Two Methods of Microspore Isolation

In evaluating the effectiveness of the technology depending on the method of microspore isolation, it was shown that for spring rape from the cultivar ‘Ratnik’ the embryoid yield was significantly increased with microspore isolation method 3, compared to the variant with isolation method 2 (Figure 4; Table 3).
With the third method of isolation, the yield of embryoids was 522.7 ± 67.1 pieces of embryoids per Petri dish, against 295 ± 34 pieces of embryoids per Petri dish with method No. 2. In isolation method No. 3 yield of embryoids was observed with bud sizes in the range of 3.0–4.5 mm, while in method No. 2 embryoids were obtained only in bud sizes of 3.0–3.5 mm. The contribution of the influence of the isolation method factor, kidney size factor, and their interaction on the embryoid yield of spring rapeseed ‘Ratnik’ was 31%, 56% and 12%, respectively (Figure S1).
For spring rapeseed ‘Hurma’, differences between embryoid yields for isolation methods No. 2 and No. 3 were also significant (Table 3).
Bud sizes 2.0–3.0 mm yield was comparable between isolation methods, while bud sizes 3.0–3.5 mm yielded on average 2.3 times more embryoids with isolation method 3 than with isolation method 2. The contribution of the influence of the isolation method factor, kidney size factor, and their interaction on the embryoid yield of spring rapeseed ‘Ratnik’ was 4%, 91% and 4%, respectively (Figure S1).
The European radish cultivar ‘RBK’, among others, showed sensitivity to the method of isolation (Table 3).
The embryoids yield per Petri dish increased about 2.6 times with isolation method No. 3 (7 ± 2.6) compared to isolation method No. 2 (2.7 ± 1.41). Interestingly, the best yields were shifted towards the smaller bud size of 3.0–3.5 mm for isolation method 3 compared to the best bud size of 3.5–4.0 mm for isolation method 2. The contribution of the influence of the isolation method factor, kidney size factor, and their interaction on the embryoid yield of European radish ‘RBK’ was 23%, 17% and 26%, respectively (Figure S1).
The yield of Sareptian mustard ‘Sudarushka’ embryoids in the best bud size of 2.9–3.3 mm differed significantly depending on the method of isolation, and increased with method of isolation No. 3 an average of 1.4 times (22.7 ± 6.2) compared with method of isolation No. 2 (15.7 ± 6.4) (Figure 5; Table 3).
Yields from the third isolation method did not vary as much in bud size compared to embryoid yields from the second isolation method. The contribution of the influence of the isolation method factor, kidney size factor, and their interaction on the embryoid yield of Sareptian mustard ‘Sudarushka’ was 26%, 57% and 8%, respectively (Figure S1).
Sareptian mustard breeding accession No. 72 showed very significant differences in embryoid yield depending on the method of isolation (Table 3).
The yield of embryoids in the best size of buds, 2.5–3.0 mm, differed 7.5-fold depending on the method of isolation (22.67 ± 4.1—isolation No. 3; 3 ± 1.5—isolation No. 2). Isolation No. 3 extended the range of bud sizes where embryoids were obtained. Thus, no embryoids were obtained in bud size 3.0–3.5 mm in the second isolation, while the third isolation yielded 9.7 ± 0.6 pieces of embryoids per Petri dish. The contribution of the influence of the isolation method factor, kidney size factor, and their interaction on the embryoid yield of Sareptian mustard breeding accession No. 72 was 62%, 22% and 10%, respectively (Figure S1).
In the experiment with red cabbage breeding accession No. 428, no embryoids were obtained in isolation method No. 2, whereas in the isolation method No. 3, embryoids were obtained in the bud size range of 3.5–4.5 mm (Figure 6; Table 3).
The yield of embryoids at the optimum bud size of 4.0–4.5 mm from the third isolation method was 16 ± 1.4 embryoids per Petri dish. The contribution of the influence of the isolation method factor, kidney size factor, and their interaction on the embryoid yield of red cabbage breeding accession No. 428 was 47%, 26% and 26%, respectively (Figure S1).
In red cabbage breeding accession No. 439, the yield at the optimum size of buds 4.0–4.5 mm was 31.3 ± 4.1 pieces of embryoids per Petri dish from isolation method No. 3, which was three times higher than the yield from isolation method No. 2 (10.3 ± 1.4 pieces of embryoids per Petri dish) (Table 3).
In 3.5–4.0 mm buds, the embryoid yield was higher in the second method of isolation (1.7 ± 0.5 pc embryoids per Petri dish) than in the third method of isolation (0.33 ± 0.2 pc embryoids per Petri dish). However, no embryoids were obtained in 4.5–5.0 mm buds with the second method of isolation, whereas with the third method of isolation the yield was 6 ± 2.3 pcs of embryoids per Petri dish. The contribution of the influence of the isolation method factor, kidney size factor, and their interaction on the embryoid yield of red cabbage breeding accession No. 439 was 15%, 65% and 18%, respectively (Figure S1).
White cabbage of the cultivar ‘Parus’ also showed significant differences in yield depending on the method of isolation (Figure 7; Table 3).
Isolation method No. 3 was better than isolation method No. 2. At the optimum bud size of 5.0–5.5 mm, the yield was 2.6 times higher with the third isolation (23 ± 2-isolation No. 3; 8.7 ± 0.6-isolation No. 2). Buds of size 5.5–6.0 mm produced embryoids only with the third method of isolation. The contribution of the influence of the isolation method factor, kidney size factor, and their interaction on the embryoid yield of ‘Parus’ white cabbage was 26%, 57% and 8%, respectively (Figure S1).

4. Discussion

Many articles have been devoted to the importance of the qualitative composition of the microspore population in the preparation for IMC technology. As early as 1998, Kott et al. [10] noted the effect of microspore population composition on embryoid yield, showing that a genotype with more uniform microspore development produced significantly higher yields. Indeed, in those genotypes with irregular microspore development due to the continuous presence of diverse microspore development stages in buds, the relative concentration of microspores at the responsive stage of development is always reduced and thus the potential toxic load due to dead microspores is also increased. This problem is often one of the main inhibitory factors of embryogenesis [11], which was also confirmed in our study—an increase in the concentration of responsive microspores in European radish ‘RBK’ and spring rapeseed ‘Ratnik’ preparation, had a positive effect on embryoid yields.
In addition to the qualitative composition of the microspores, much attention in the literature has been paid to the toxic effects of culture as it inhibits embryoid development. Not only dead microspores can have a toxic effect [9] but also any foreign impurities. For example, as early as 1990, Aslam et al. [5] wrote about the negative effect of anther walls on microspore embryogenesis. The anther tissues can enter the culture not only by their direct immersion in the preparation, but also in the process of microspore isolation, where there is an active mechanical impact on the bud tissues and along with this on the anthers, where they are destroyed and the particles of destroyed cells get into the preparation. In our study, we assessed the degree of debris of the culture by visible impurities that entered the preparation due to the mechanical action of isolation on the buds. During culturing, foreign particles are lumped together into clumps, which are visible to the naked eye and appear as dark gray dots. In addition, foreign particles often envelop microspores and developing embryoids, which inhibits embryoid development to the point of death. Contaminated preparations have been shown to have lower embryoid yields and more abnormal embryoids than ‘clean’ preparations.
It was also shown that the degree of debris of the preparation depended on the method of microspore isolation. Thus, in the first series of experiments it was determined that method of isolation of microspores No. 1—grinding buds with a pestle in a mortar—was the worst in terms of purity of the preparation, which can be attributed to the roughest mechanical impact on bud tissue compared to other methods of isolation. Preparations in isolation methods No. 2 and 3 were not as contaminated, so they were included in the second series of experiments. However, in addition to differences in the purity of the preparation at different microspore isolations, differences in the qualitative composition of the microspore population were also observed.
As a result of experiments aimed at comparison of isolation methods No. 2 and No. 3, it was shown that in spring rapeseed cultivar ‘Ratnik’ at the best bud size of 3.5–4.0 mm, isolation No. 3 decreased the preparation impurity index by 2.4 times and increased the relative concentration of microspores at the responsive development stage towards embryogenesis by 6.3% in comparison with isolation method No. 2. Changing these two parameters (purity of the preparation and qualitative composition of the population of microspores) increased the yield of embryoids by 1.8 times with method of isolation No. 3 in comparison with method of isolation No. 2. The culture of European radish ‘RBK’ with method of isolation No. 3 was about 15 times purer than the preparation prepared using the second method of isolation. The proportion of microspores at the responsive embryogenesis stage of development was increased by 27.9% using the new isolation method compared to the second isolation method. This is especially important for crops such as European radish, as it is characterized by a high irregularity of microspore development in buds. Taken together, the improvement in the parameters of purity of the preparation and the content of susceptible microspores in the culture resulted in a 2.6-fold increase in the yield of radish European ‘RBK’ embryoids compared with method of isolation No. 3. In this case, this is a very significant effect because European radish has a very low embryoid yield in general and even a small increase in yield is important for practical breeding. The other cultivars and crops (Table 1) on which the second series of experiments were carried out also showed improved embryoid yield in isolation method No. 3 compared with isolation method No. 2. Additionally, for red cabbage No. 428, where the use of the standard protocol did not lead to a positive result, the new method of microspore isolation enabled the first embryoids to be obtained.
We believe that the effect of increasing the purity of the preparation using the third method of isolation is provided by reducing the mechanical effect on the bud tissues compared with the methods of isolation No. 1 and No. 2. This reduces destruction of somatic cells and bud tissues, anthers, and penetration of their elements into the preparation. The relative content of microspores at the susceptible embryogenesis stage of development increases since in the new method of isolation, anthers are not crushed and retain their structure, which most likely plays the role of a ‘sieve’ and larger in size fractions of microspores (tetrads and mature anthers) are retained in the anther tissues. In addition to increasing the concentration of responsive microspores, the ‘sieve’ of anther structures allows a prolongation of the range of suitable linear bud sizes, which in turn is a critical factor in the performance of the technology for some crops. Taken together, this suggests that the method of microspore isolation No. 3 can increase the efficiency of the technology of obtaining doubled haploids in microspore culture in vitro, which was shown in the results of our studies.

5. Conclusions

This study was aimed at finding a way to optimize IMC technology for the Brassicaceae family of crops. As a result of the study, it was shown that the efficiency of the technology can be improved by modifying the method of microspore isolation. We proposed a new method of microspore isolation which involves individually dissecting the buds with a transverse incision of a scalpel, after which the bud halves are dipped into sterile tubes with nutrient medium and shaken on a rotary shaker for 10–60 s, depending on the genotype and culture (to be chosen empirically). Studies have shown that this method of isolation increases the purity of the preparation and the percentage of microspores at the susceptible embryogenesis stage of development in the population compared to standard methods of microspore isolation and has a high proportion of influence on embryoid yields.

Supplementary Materials

The following supporting information can be downloaded at: https://www.mdpi.com/article/10.3390/horticulturae8100864/s1, Table S1: Data from two-way ANOVA analysis of variance of debris contamination of microspore culture preparations depending on the method of microspore isolation, linear size of buds, and genotype on the first day of cultivation; Table S2: Data from two-way ANOVA analysis of variance of ratio of different fractions of microspores in spring rapeseed ‘Ratnik’ and the European radish ‘RBK’ microspore population according to bud size and method of isolation; Figure S1: Data from two-way ANOVA analysis of variance and the contribution of the influence of factors of embryoid yield at day 30 of culture depending on the method of isolation method, linear size of buds, and genotype (The contribution of the influence of factors was calculated as the ratio of the SS of each factor to the total SS).

Author Contributions

E.V.K. made the experiment plan, conducted the experiment, photographed, analyzed data, and wrote the manuscript; E.G.K. analyzed data and corrected the manuscript; E.A.D. supervised and assisted in planning experiments, photographing, analyzing data, and corrected the manuscript. All authors have read and agreed to the published version of the manuscript.

Funding

The reported study was partially funded by the Foundation for supporting Young Scientists (komissarov-foundation.ru).

Institutional Review Board Statement

Not applicable.

Informed Consent Statement

Not applicable.

Conflicts of Interest

The authors declare no conflict of interest.

References

  1. Henderson, C.A.P.; Pauls, K.P. The use of haploidy to develop plants that express several recessive traits using light-seeded canola (Brassica napus) as an example. Theor. Appl. Genet. 1992, 83, 476–479. [Google Scholar] [CrossRef] [PubMed]
  2. Bansal’, V.K.; Thiagarajah’, M.R.; Stringam’, G.R.; Hardin’, R.T. Haploid plantlet screening in the development of blackleg resistant DH lines of Brassica napus. Plant Breed. 1998, 117, 103–106. [Google Scholar] [CrossRef]
  3. Ferrie, A.M.R.; Caswell, K.L. Isolated microspore culture techniques and recent progress for haploid and doubled haploid plant production. Plant Cell Tissue Organ Cult. 2011, 104, 301–309. [Google Scholar] [CrossRef]
  4. Behla, R.; Hirani, A.H.; Zelmer, C.D.; Yu, F.; Fernando, W.G.D.; McVetty, P.; Li, G. Identification of common QTL for resistance to Sclerotinia sclerotiorum in three doubled haploid populations of Brassica napus (L.). Euphytica 2017, 213, 260. [Google Scholar] [CrossRef]
  5. Aslam, F.N.; Macdonald, M.V.; Loudon, P.; Ingram, D.S. Rapid-cycling Brassica Species: Inbreeding and selection of B. campestris for anther culture ability. Ann. Bot. 1990, 65, 557–566. [Google Scholar] [CrossRef]
  6. Dunwell, J.M. Haploids in flowering plants: Origins and exploitation. Plant Biotechnol. J. 2010, 8, 377–424. [Google Scholar] [CrossRef] [PubMed]
  7. Lichter, R. Induction of Haploid Plants from Isolated Pollen of Brassica napus. Z. Pflanzenphysiol. 1982, 105, 427–434. [Google Scholar] [CrossRef]
  8. Dong, Y.Q.; Gao, Y.H.; Zhao, T.; Ren, G.Q.; Liu, Y.L.; Guan, B.; Jin, R.X.; Gao, F.; Zhang, Y.L.; Tan, X.F.; et al. Influencing factors and physiochemical changes of embryogenesis through in vitro isolated microspore culture in Brassica species. Biologia 2021, 76, 2629–2654. [Google Scholar] [CrossRef]
  9. Kott, L.S.; Polsoni, L.; Ellis, B.; Beversdorf, W.D. Autotoxicity in isolated microspore cultures of Brassica napus. Can. J. Bot. 1988, 66, 1665–1670. [Google Scholar] [CrossRef]
  10. Kott, L.S.; Polsoni, L.; Beversdorf, W.D. Cytological aspects of isolated microspore culture of Brassica napus. Can. J. Bot. 1988, 66, 1658–1664. [Google Scholar] [CrossRef]
  11. Kozar, E.V.; Domblides, E.A.; Soldatenko, A.V. Factors affecting DH plants in vitro production from microspores of European radish. Vavilovskii Zhurnal Genet. Sel. 2020, 24, 31–39. [Google Scholar] [CrossRef] [PubMed]
  12. Bhatia, R.; Dey, S.S.; Parkash, C.; Sharma, K.; Sood, S.; Kumar, R. Modification of important factors for efficient microspore embryogenesis and doubled haploid production in field grown white cabbage (Brassica oleracea var. Capitata L.) genotypes in India. Sci. Hortic. 2018, 233, 178–187. [Google Scholar] [CrossRef]
  13. Kozar, E.; Domblides, E. Protocol of European Radish (Raphanus sativus L.) Microspore Culture for Doubled Haploid Plant Production. In When the Menorah Fades; Academic Studies Press: Boston, MA, USA, 2021; Volume 2288, pp. 217–232. ISBN 9781071613351. [Google Scholar]
  14. Takahata, Y.; Komatsu, H.; Kaizuma, N. Microspore culture of radish (Raphanus sativus L.): Influence of genotype and culture conditions on embryogenesis. Plant Cell Rep. 1996, 16, 163–166. [Google Scholar] [CrossRef] [PubMed]
  15. Bhowmik, P.; Dirpaul, J.; Polowick, P.; Ferrie, A.M.R. A high throughput Brassica napus microspore culture system: Influence of percoll gradient separation and bud selection on embryogenesis. Plant Cell Tissue Organ Cult. 2011, 106, 359–362. [Google Scholar] [CrossRef]
  16. Dupl’Áková, N.; Dobrev, P.I.; Renák, D.; Honys, D. Rapid separation of Arabidopsis male gametophyte developmental stages using a Percoll gradient. Nat. Protoc. 2016, 11, 1817–1832. [Google Scholar] [CrossRef] [PubMed]
  17. Corral-Martínez, P.; Camacho-Fernández, C.; Mir, R.; Seguí-Simarro, J.M. Doubled Haploid Production in High- and Low-Response Genotypes of Rapeseed (Brassica napus) Through Isolated Microspore Culture. Methods Mol. Biol. 2021, 2289, 129–144. [Google Scholar]
  18. Chun, C.; Park, H.; Na, H. Microspore-derived embryo formation in radish (Raphanus sativus L.) according to nutritional and environmental conditions. Hortic. Environ. Biotechnol. 2011, 52, 530–535. [Google Scholar] [CrossRef]
  19. Smýkalová, I.; Větrovcová, M.; Klíma, M.; Macháčková, I.; Griga, M. Efficiency of Microspore Culture for Doubled Haploid Production in the Breeding Project “Czech Winter Rape”. Czech J. Genet. Plant Breed. 2018, 42, 58–71. [Google Scholar] [CrossRef]
  20. Babbar, S.B.; Agarwal, P.K.; Sahay, S.; Bhojwani, S.S. Isolated microspore culture of Brassica: An experimental tool for developmental studies and crop improvement. Indian J. Biotechnol. 2004, 3, 185–202. [Google Scholar]
  21. Alexander, M.P. Differential staining of aborted and nonaborted pollen. Biotech. Histochem. 1969, 44, 117–122. [Google Scholar] [CrossRef] [PubMed]
  22. Domblides, E.; Shmykova, N.; Shumilina, D.; Zayachkovskaya, T.; Mineykina, A.; Kozar, E.; Ahramenko, V.; Shevchenko, L.; Kan, L.; Bondareva, L.; et al. A Technology for Obtaining Doubled Haploids in Microspore Cultures of the Brassicaceae Family (Guidelines); VNIISSOK: Moscow, Russia, 2016; ISBN 9785901695715. [Google Scholar]
Figure 1. Preparations of spring radish ‘Ratnik’ (A,B) and European radish ‘RBK’ (C,D) under different isolation methods on the first day of cultivation. (A,C)—isolation method No. 2; (B,D)—isolation method No. 3. Red arrows are microspores; blue arrows are extrinsic grafts. Scale bars = 50 µm.
Horticulturae 08 00864 g001
Figure 2. Preparations of mustard ‘Sudarushka’ on day 1 of cultivation with different methods of isolation and sizes of buds. (A,C,E)—microspore isolation number 2; (B,D,F)—microspore isolation number 3; (A,B)—bud size 2.5–2.9 mm; (C,D)—bud size 2.9–3.3 mm; (E,F)—bud size 3.3–3.7 mm; blue arrows—microspore fraction No. 1; orange arrows—microspore fraction No. 2; lilac arrows—microspore fraction No. 3. Scale bars = 50 µm.
Horticulturae 08 00864 g002
Figure 3. (A) Ratio of different fractions of microspores in a population of spring rapeseed ‘Ratnik’ microspores according to bud size and method of isolation: 1 fraction—very early developmental stages; 2 fraction—optimal developmental stages for embryogenesis induction; 3 fraction—late developmental stages. IM—isolation method. Diagram ranges with the same letter (comparison of the fraction percentage in the population of microspores within the same fraction (same color) and the same bud size) are not significantly different with 95% probability according to the Duncan multiple range test (MRT). Data from two-way analysis of variance (ANOVA) and the contribution of the influence of factors are presented in Table S2. (B) Ratio of different fractions of microspores in the European radish ‘RBK’ microspore population according to bud size and method of isolation: 1 fraction—very early developmental stages; 2 fraction—optimum developmental stages for embryogenesis induction; 3 fraction—late developmental stages. IM—isolation method. Diagram ranges with the same letter (comparison of the fraction percentage in the population of microspores within the same fraction (same color) and the same bud size) are not significantly different with 95% probability according to the Duncan multiple range test (MRT). Data from two-way analysis of variance (ANOVA) and the contribution of the influence of factors are presented in Table S2.
Horticulturae 08 00864 g003
Figure 4. Yield of spring rapeseed embryoids ‘Ratnik’ at day 30 of culture depending on the method of isolation and linear size of buds. (A,C,E)—microspore isolation No. 2; (B,D,F)—microspore isolation No. 3; (A,B)—bud size 3.0–3.5 mm; (C,D)—bud size 3.5–4.0 mm; (E,F)—bud size 4.0–4.5 mm.
Horticulturae 08 00864 g004
Figure 5. Yield of Sareptian mustard ‘Sudarushka’ embryoids at day 25 of culture depending on the method of isolation and linear size of buds. (A,C,E)—microspore isolation No. 2; (B,D,F)—microspore isolation No. 3; (A,B)—bud size 2.5–2.9 mm; (C,D)—bud size 2.9–3.3 mm; (E,F)—bud size 3.3–3.7 mm.
Horticulturae 08 00864 g005
Figure 6. Yield of red cabbage embryoids breeding accession No. 428 at day 30 of culture as a function of isolation method and linear bud size. (A,C,E)—microspore isolation No. 2; (B,D,F)—microspore isolation No. 3; (A,B)—bud size 3.5–4.0 mm; (C,D)—bud size 4.0–4.5 mm; (E,F)—bud size 4.5–5.0 mm.
Horticulturae 08 00864 g006
Figure 7. Yield of white cabbage ‘Parus’ embryoids at day 30 of culture depending on method of isolation and linear size of buds. (A,C,E,G)—microspore isolation No. 2; (B,D,F,H)—microspore isolation No. 3; (A,B)—bud size 4.0–4.5 mm; (C,D)—bud size 4.5–5.0 mm; (E,F)—bud size 5.0–5.5 mm; (G,H)—bud size 5.5–6.0 mm.
Horticulturae 08 00864 g007
Table 1. Accessions of the Brassicaceae family used in the study.
SpeciesAccession NameAccession TypeSource
Spring rape (Brassica napus var. napus)RatnikcultivarVNIIMK
Hurmabreeding accessionAstra
European radish (Raphanus sativus L. subsp. sativus convar. radicula)RBK
(pink-red with white tip)
cultivarFSBSI FSVC
Sarepta Mustard (Brássica júncea (L.) Czern)Sudarushkabreeding accessionFSBSI FSVC
72breeding accessionFSBSI FSVC
Red cabbage (B. oleracea L. convar. capitata (L.) Alef. var. capitata (L.) f. rubra (L.) Thell.)428breeding accessionFSBSI FSVC
439breeding accessionFSBSI FSVC
White head cabbage (B. oleracea L. convar. capitata L. Alef. var. capitata (L.) f. alba DC.)ParuscultivarFSBSI FSVC
Note: VNIIMK—Federal State Budgetary Scientific Institution “Federal scientific center” vs. “Pustovoit All-Russian Research Institute of Oil Crops”, Russia; Astra—LLC Astra Breeding Company, Russia; FSBSI FSVC—Federal State Budgetary Scientific Institution Federal Scientific Vegetable Center, Russia.
Table 2. Debris contamination of microspore culture preparations depending on the method of microspore isolation, linear size of buds, and genotype on the first day of cultivation.
GenotypeBud Size, mmRatio of Debris Particles Per Pc to Microspores Per Pc in the PreparationTwo-Way ANOVA Factors/The Contribution of the Influence 5, %
Isolation Method No. 3Isolation Method No. 2Isolation Method No. 1
spring rapeseed ‘Ratnik’2.5–3.01.59 1 a 3/B 43.12 a/B9.01 a/Abud size *** 2/18%
isolation method ***/68%
bud size x isolation method ***/10%
random factors/4%
3.0–3.51.56 a/C3.09 a/B8.36 a/A
3.5–4.01.21 a/C2.92 a/B5.33 b/A
4.0–4.50.56 a/C1.27 b/B3.26 c/A
European radish ‘RBK’2.0–2.50.59 a/B11.45 a/A13.60 b/Abud size ***/9%
isolation method ***/64%
bud size x isolation method ***/25%
random factors/2%
2.5–3.00.28 a/C3.95 c/B16.31 b/A
3.0–3.50.38 a/C6.40 bc/B40.47 a/A
3.5–4.00.46 a/B3.72 c/B35.33 a/A
4.0–4.50.52 a/C8.30 ab/B12.06 b/A
1 Values in the table are mean; 2 ***: significant at the 0.1% probability level, ns: non-significant. Values with the same 3 lowercase letter in columns (comparison between all bud sizes within the same isolation method and genotype) and 4 capital letter in rows (comparison between all isolation methods within the same bud size and genotype) are not significantly different with 95% probability according to Duncan’s multiple range test (MRT). 5 The contribution of the influence of factors was calculated as the ratio of the SS of each factor to the total SS. Data from two-way analysis of variance (ANOVA) are presented in Table S1.
Table 3. Embryoid yield at day 30 of culture depending on the method of isolation method, linear size of buds, and genotype.
GenotypeBud Size, mmIsolation Method No. 2 Embryoids Pcs/
Petri Dish
Isolation Method No. 3 Embryoids Pcs/
Petri Dish
Two-Way ANOVA Factors
spring rapeseed ‘Ratnik’3.0–3.50.0 1 b 3/B 4378.0 b/Abud size *** 2
isolation method ***
bud size x isolation method ***
3.5–4.0295.0 a/B522.7 a/A
4.0–4.50.0 b/B37.3 c/A
spring rapeseed ‘Hurma’2.0–2.51099.5 b/A1177.5 b/Abud size ***
isolation method **
bud size x isolation method *
2.5–3.01304.5 a/A1311.5 a/A
3.0–3.5268.7 c/B627.0 c/A
European radish ‘RBK’3.0–3.50.3 a/B7.0 a/Abud size ns
isolation method **
bud size x isolation method **
3.5–4.02.7 a/A3.3 ab/A
4.0–4.50.7 a/A1.3 b/A
Sareptian mustard
‘Sudarushka’
2.5–2.96.3 b/B16.0 ab/Abud size **
isolation method **
bud size x isolation method ns
2.9–3.315.7 a/A22.7 a/A
3.3–3.71.7 b/B11.3 b/A
Sareptian mustard breeding accession No. 722.0–2.51.0 b/B9.0 b/Abud size ***
isolation method ***
bud size x isolation method **
2.5–3.03.0 a/B22.7 a/A
3.0–3.50.0 b/B9.7 b/A
red cabbage breeding accession No. 4283.5–4.00.0 -/B11.0 b/Abud size ***
isolation method ***
bud size x isolation method ***
4.0–4.50.0 -/B16.0 a/A
4.5–5.00.0 -/-0.0 -/-
red cabbage breeding accession No. 4393.5–4.01.7 b/A0.3 c/Bbud size ***
isolation method ***
bud size x isolation method ***
4.0–4.510.3 a/B31.3 a/A
4.5–5.00.0 b/B6.0 b/A
white cabbage ‘Parus’4.0–4.52.3 b/A5.7 bc/abud size ***
isolation method ***
bud size x isolation method ***
4.5–5.07.0 a/A10.0 b/A
5.0–5.58.7 a/B23.0 a/A
5.5–6.00.0 b/B2.0 c/A
1 Values in the table are mean; 2 *, **and ***: significant at the 5%, 1% and 0.1% probability levels, respectively, ns: non-significant. Values with the same 3 lowercase letter in columns (comparison between all bud sizes within the same isolation method and genotype) and 4 capital letter in rows (comparison between all isolation methods within the same bud size and genotype) are not significantly different with 95% probability according to Duncan’s multiple range test (MRT). Data from two-way analysis of variance (ANOVA) and the contribution of the influence of factors are presented in Figure S1.
Publisher’s Note: MDPI stays neutral with regard to jurisdictional claims in published maps and institutional affiliations.

