Article

Multivariate Discrimination of Some Grapevine Cultivars under Drought Stress in Iran

by
Somayyeh Fahim
1,
Alireza Ghanbari
1,*,
Amir Mohammad Naji
2,
Ali Akbar Shokohian
1,
Hasan Maleki Lajayer
1,
Gholamreza Gohari
3,4,* and
Christophe Hano
5,*
1
Department of Horticultural Science, Faculty of Agriculture and Natural Resources, University of Mohaghegh Ardabili, Ardabil 5619911367, Iran
2
Department of Agronomy and Plant Breeding, Faculty of Agriculture, Shahed University, Tehran 3319118651, Iran
3
Department of Horticultural Sciences, Faculty of Agriculture, University of Maragheh, Maragheh 5518779842, Iran
4
Department of Agricultural Sciences, Biotechnology and Food Science, Cyprus University of Technology, Limassol 3603, Cyprus
5
Laboratoire de Biologie des Ligneux et des Grandes Cultures, INRAE USC1328, Campus Eure et Loir, Orleans University, 28000 Chartres, France
*
Authors to whom correspondence should be addressed.
Horticulturae 2022, 8(10), 871; https://doi.org/10.3390/horticulturae8100871
Submission received: 25 July 2022 / Revised: 18 September 2022 / Accepted: 20 September 2022 / Published: 22 September 2022
(This article belongs to the Special Issue Nutrition, Phytochemistry, Bioactivity of Fresh-Consumed Vegetables)

Abstract

:
Grapevine is one of the most important economic crops in horticulture, and drought stress is one of the most significant threatening factors in the world. Therefore, the identification and investigation of cultivars under drought stress are the basic steps and important goals in grapevine-breeding programs. In the present study, the 17 parameters of 14 grapevine cultivars under drought stress were first scaled. Based on the initial information, we divided the 14 grape cultivars according to their resistance to drought stress into four groups: tolerant, semi-tolerant, semi-sensitive, and sensitive. Then, the utilization of multivariate techniques comprising principal component analysis (PCA), along with quadratic discriminant analysis (QDA), were utilized to choose the most substantial and accountable traits for the four groups’ discrimination. For the QDA, the 17 parameters were arranged into four sets. The discrimination for all parameters showed 96% correct classification. The first set includes shoot length (Shoot L), shoot number (Shoot N), leaf area (Leaf A), relative water content (RWC), and chlorophyll a (Chl a) parameters that showed 71.5% correct classification. The second set includes chlorophyll b (Chl b), chlorophyll total, peroxidase (POX), and superoxide dismutase (Sod) parameters that had 75% correct classification. Electrolyte leakage (EL), malondialdehyde (MDA), proline, catalase (CAT), and ascorbate peroxidase (APX) parameters were in the third set and had 87% correct discrimination. The best discrimination was obtained by the combination of the first and third set, including the Shoot L, Shoot N, Leaf A, RWC, Chl a, EL, MDA, proline, CAT, and APX with 100% correct discrimination.

Graphical Abstract

1. Introduction

Water shortage transpires when plant-water requirements cannot be effusively supplied due to insufficient rainfall and a reduced groundwater level, or water retention from soil particles. In this case, the level of transpired water exceeds the water absorbed by the roots [1]. Plants use different strategies due to water stress, and they create a series of morphoanatomical, physiological, and biochemical adjustments to reserve their hydric status [2]. Under stress conditions, the decrease in photosynthetic rate may be due to biochemical limitations triggered via water scarcity, such as reducing photosynthetic pigments, particularly chlorophylls, and a decline in the water prospects and comparative leaves’ water content [3].
The major factor in plants that increases during drought stress is the production of reactive oxygen species (ROS) in the organs, such as chloroplasts, mitochondria, and peroxisomes [4]. High ROS production due to drought stress leads to the peroxidation of cell membrane lipids and the degradation of enzyme proteins [5]. Malondialdehyde (MDA) is one of the final products due to the destruction of the cell membrane and is responsible for cell membrane damage [6]. Research has shown that proline, as a low molecular weight osmolyte during drought stress, is activated to regulate cell osmosis between the cytoplasm and the vacuole to detoxify the ROS, protect the membrane, and stabilize antioxidant enzymes [7,8]. Some defense mechanisms, comprising enzymatic antioxidants, are activated to manage the intracellular ROS concentration during drought stress. These antioxidant enzymes include catalase (CAT), superoxide dismutase (SOD), and glutathione synthesizes cycle enzymes, such as guaiacol peroxidase and ascorbate peroxidase (APX) [9].
Economically, grapevine (Vitis vinifera) is one of the most essential fruit products in the world [10], used in more than 90 countries for the production of wine, fruit juices, table grapes, etc. [11]. Chemometrics is an interdisciplinary science that utilizes computational, statistical, and numerical techniques to excerpt information from chemical systems through mathematical modeling. Today’s discriminant analysis (DA) and principal component analysis (PCA) chemometrics application allows the inspection and categorization of overall data from dissimilar samples. DA is meticulously associated with PCA as both techniques look for linear combination of variables that superlatively define the data. These strategies have been utilized by numerous scholars to investigate countless food and agricultural merchandise groups, and to decrease the range of dimensions in a statistics collection without dropping information. DA attempts to model differences among dissimilar statistics classes. This approach is one of the best-observed modelling approaches that has been broadly utilized for linear discriminant analysis. This scheme’s basis is to define a linear discrepancy role that takes the ratio of variance between classes, and halves the variance ratio within classes. Consequently, measuring the entire sample’s mechanisms to comprehend whether the sample is within the describe group or range is mostly unnecessary. Instead, the use of trends or correlations amongst potential qualitative traits using multivariate statistical analysis is utilized [12]. Iran is one of the leading countries in the world in terms of grape production. Recently, the problem of water shortage has become a serious threat to the production of grapes in Iran. Therefore, we must seek appropriate solutions to deal with the stress. Whereas several response variations beneath the salinity stress in dissimilar grape cultivars have been considered, the misdirected evaluation has been the most liable of these reactions underneath drought stress for cultivar-type discrimination. Hence, this study intended to quantify 17 traits (comprising antioxidant activity, physicochemical, and biochemical properties) underneath drought stress in 14 diverse grape cultivars (comprising native, and non-native), and to conglomerate the measured reactions’ role using multivariate statistical analysis for cultivar-type discrimination in the four groups.

2. Materials and Methods

2.1. Plant Materials

This research was carried out during the years of 2019 to 2022. First, winter cuttings of 14 cultivars of Iranian native grapes (Table 1) were collected from the Meshkinshahr Horticultural Research Station and transferred to the greenhouse (under standard conditions and a temperature of 25 ± 5 °C) at the Faculty of Agriculture and Natural Resources of the University of Mohaghegh Ardabili. After rooting, the cuttings were transferred to pots containing 7 kg of fine sand, leaf mold, and garden soil with a ratio of 1:1:1.
The plants were irrigated at field capacity until full establishment (for three months). The experiment was performed as a completely randomized factorial design in three replications with two samples, and irrigation factors at four levels of 100 (control), 75, 50, and 25% water requirement. Four pots with a similar weight were utterly saturated to determine the FC. After the gravity water was excluded entirely, the pot’s weight represented the total weight of dry soil, pot weight, and water weight in the field capacity. After obtaining the weight of soil moisture in the field capacity (0.37) to determine the amount of water required for each treatment, the following method was conducted.
ω = W w     W s     = W W S W S
ω = percentage of soil moisture, Ww = Initial weight, Ws = dry weight
γ   d =   γ   t 1 + ω
γd = unit weight of dry soil volume, γt = unit weight of wet soil volume
Then, the amount of water required for each treatment was calculated with the following formula:
γ d × F C 100 ,   75 ,   50   a n d   25 %   ω
During the drought stress treatment (for two months), the pots were weighed every two days, and the water required for each pot was provided.

2.2. Growth Parameters

A leaf area meter (AM 300 Bio Scientific Ltd., Hoddesdon, UK) was used to measure the leaf area. A ruler was used to measure the length of the main branch, and the leaf number was counted.

2.3. Relative Water Content

Relative leaf-water content was measured according to the method of Yamasaki and Dillenburg [13]. First, the fresh leaf sample of 0.5 g (Wf) was weighed and then placed in distilled H2O. The sample was weighed for a second time at the end of this period (Ws). They were placed in bags in the oven to dry completely (Wd) and at the end, the content of the comparative leaf water was formulated from the subsequent equation.
R W C = W f W d W s W d × 100

2.4. Photosynthetic Pigments

Photosynthetic pigments were measured according to Lichtenthaler’s [14] method. In accordance with this method, the fresh leaf was ground with a mortar and pestle, and then added to 4 mL of acetone 80% and centrifuged. The supernatant absorbance was recorded at 470, 665, and 652 nm. The concentration of Photosynthetic pigments was determined by the equation below:
Chlorophyll   a   ( µ g / mL ) = 16.72   A 665 9.16 A 652 × v w
Chlorophyll   b   ( µ g / mL ) = 36.92 A 652 16.54   A 665 × v w
Chlorophyll   a / b   ( µ g / mL ) = C h l o r o p h y l l   a / C h l o r o p h y l l   b

2.5. Electrolyte Leakage

To determine electrolyte leakage, fresh discs were sampled from each pot. The samples were washed three times with deionized water and placed in laboratory tubes, and deionized water was added to them. The tubes were placed at a constant temperature of 25 °C. After 12 h, the initial electrical conductivity of the environment (EC1) was measured using an EC meter (Milwaukee Mi 306 model). Then, the samples were boiled at 100 °C for 20 min to kill the tissues and release all electrolytes completely [15].
E l   % = E C 1 / E C 2 100

2.6. Lipid Peroxidation and Malondialdehyde Concentration

Heath and Packer’s method was used to measure MDA. For this purpose, leaf tissue was ground with liquid nitrogen, then added to a phosphate buffer. One ml of 20% trichloroacetic acid (TCA) solution, containing 0.5% thiobarbituric acid (TBA), was added to 1 mL of the supernatant solution, and the mixture was exposed to a temperature of 95 °C at 30 min. Then, the mixture was immediately cooled. The supernatant absorbance was read at 532 and 600 nm [16].

2.7. Proline Content

Leaf tissue was ground with liquid nitrogen, and 10% sulfosalicylic acid was added to it. The mixture was filtered, then the filtered solution was added to the ninhydrin reagent and acetic acid and incubated for 1 h at 100 °C. Then, toluene was added to the mixture and vortexed. The light absorption of the supernatant red solution was read at 520 nm with a Genway 6705 spectrophotometer (Genway Biotech, San Diego, CA, USA) [17].

2.8. Soluble Sugar Total Content

The antron reagent method was used to measure the amount of soluble sugar. 0.2 g of fresh leaf tissue was ground and about 4 mL of 80% (v/v) ethanol was added to it and centrifuged. The supernatant was mixed with the antron reagent and placed at 100 °C for 10 min. The reaction was completed by rapid cooling in ice, and the adsorption was read at 620 nm by a spectrophotometer. Glucose was used as the standard, and a standard curve with 11 standard concentrations (0–100 g) of glucose was prepared [18].

2.9. Antioxidant Enzyme Activity Assay

About 0.5 g of fresh leaves were completely turned into powder with liquid nitrogen and were vortexed by adding 1.5 mL of extraction buffer, before being centrifuged. The supernatant was centrifuged again. The supernatant was transferred to the −80 °C freezer until use [19]. The extract was used to assay the peroxidase, superoxide dismutase, ascorbate peroxidase, catalase enzymes, and protein by the decomposition of hydrogen peroxide into water and oxygen by a spectrophotometer at a wavelength of 240 nm for one minute by Chance and Mahle’s method [20], with slight changes. The enzymatic reaction rate was recorded as changes in OD/min [21]. The Giannopolitis and Ries technique measured the enzyme activity, which was based on the inhibition of superoxide dismutase enzyme reduction in nitro-blue tetrazolium (NBT). The absorbance was read at 560 nm [22]. Ascorbate enzyme activity was assayed by Nakano and Asada’s method, with slight changes, by measuring the oxidation of ascorbate by a spectrophotometer at 290 nm for 3 min [23].
A total 2.5 mL of Bradford 1X solution mixed with 100 μL of leaf extract. Then, the absorbance was read at 595 nm with a spectrophotometer. In the leaf, tissues used the standard bovine serum albumin (BSA) protein to measure the concentration of soluble protein [24].

2.10. Statistical Analysis

For the statistical analysis, based on the initial information and according to Table 1, we placed 14 cultivars of grapevine genotypes into four groups and performed the discrimination based on these four groups. PCA was utilized to smear a discrimination process monitored by quadratic discriminant analysis (QDA) for distinguished genotypes. PCA was conducted to decrease the original data dimensions to a lesser figure of component groups by observing the liaison amid the parameters’ measurements, using 95% confidence. QDA was conducted to create the discrimination model associated with the grapevine genotypes’ biochemical and physiological reactions to salinity stress. The multivariate statistical analysis, comprising PCA and QDA, was conducted with JMP® Pro software version 14.3.0 (SAS Institute, Cary, NC, USA).

3. Results

3.1. Response of Grapevine Cultivars to Drought Stress

Physiological and biochemical factors from the study of 14 grape cultivars under four levels of drought stress are shown in Figure 1. That, the trend in shoot N and shoot L, leaf A, and RWC factors decreases by increasing drought stress. Additionally, the increasing trend in biochemical data is clearly shown in Figure 1. The total carbohydrate and proline content in 10 grape cultivars meaningfully increased during drought stress, and three cultivars stood at the top of the trend. Due to the importance of the evaluation of antioxidant enzymes in studies of drought stress, the increasing trend in catalase, peroxidase, ascorbate, superoxide, and peroxidase dismutase enzymes are well demonstrated in Figure 1.

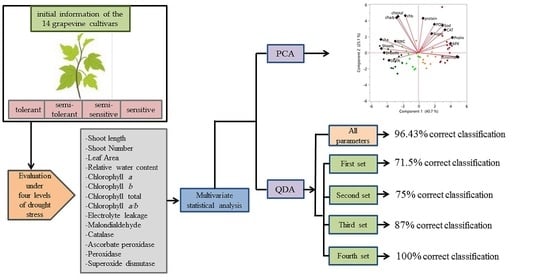
3.2. Principal Components Analysis

PCA is a multivariate procedure that offers an extracting structure technique from a variance–covariance or association amongst dependent variables. It substitutes a new variable called a factor for the group of innovator qualities that are related to each other.
The determination of the number of principal components by data group can be expected from the principal components (PCs) analysis.
The first three PCs generated from this analysis that showed eigenvalues > 1 [25] accounted for 94.4% of the total variance in the data group. The first three PCs’ eigenvalues were 6.91, 4.26, and 1.20 (Figure 2a).
Table 2 indicates that the factor loads represent the connections between the PC and the trait measurements. Loads with an absolute value greater than 0.435 have a sturdy influence (Table 2). PCA could recognize the features that generate the primary dissimilarity amongst samples. The primary key module vindicated 40.7% and the subsequent 25.1% of the total variance share. The grapevine cultivar’s projections under four levels of water stress with the two principal components (PC) were imaged (Figure 2). An apparent separation of drought treatments was shown by PC1, so by increasing drought stress from normal conditions to severe drought stress, the score of the grapevine cultivar changed from negative to positive values. Water-availability reduction changes biochemical properties, such as EL, MDA, proline, CAT, and APX, and has a significant influence on the discrimination of grapevine cultivars under drought stress. EL, MDA, proline, CAT, and APX are variables in the first component with positive coefficients, and Shoot L, Shoot N, Leaf A, RWC, and Chl a, with positive coefficients had a significant outcome on group variables. In the second component, Chl b, Chl total, protein, POX, and Sod with positive coefficients had a significant effect on variable grouping. Sugar with positive coefficients had the greatest effect in the variables of the third component group.

3.3. Discriminant Analysis

The QDA converted our traits group into several canonical components, and our default tests for components make our cultivars into four groups: tolerant, semi-tolerant, semi-sensitive, and sensitive. The likelihood and entropy R square factor show every canonical power for the cultivar’s discrimination. The possible factor (−2log likelihood) was utilized to designate each canonical statistical significance. The closer the likelihood was to zero and the entropy R square value was to 100 was indicative of a better discriminant.
Figure 3 shows the result of quadratic discriminant analysis for all measured traits (all traits are in the training set). Another studied trait and the type of response to drought stress was prioritized. Based on drought response, grapevine cultivars were divided into four sets. Discrimination analysis was conducted based on each set.

3.3.1. First Set

The discrimination of the four groups of grapevine cultivars was conducted based on their Shoot L, Shoot N, Leaf A, RWC, and Chl a reactions to drought stress. Figure 4 shows the three-dimensional (3D) common diagram of the first three normal values acquired with QDA. The first canonical variance correspondence was 59%, the second canonical variance was 27%, and the third canonical variance was 13%: the initial three canonical variances explained 99% of the total variance.
The first and second canonical values showed a substantial influence on discrimination. The possible first, second, and third canonicals ratios were 0.63, 0.82, and 0.93, respectively, which indicated that the initial canonical value had a greater obligation to the cultivars’ classification than the others. These reactions, as utilized PCs for discrimination, had a 71% accurate categorization through QDA using a −2Log possible factor equivalent to 64. The four groups discriminated by Shoot L, Shoot N, Leaf A, RWC, and Chl a had 17 misclassifications (16 misclassifications) (Table 3).

3.3.2. Second Set

The discrimination of the four groups of grapevine cultivars was established on their Chl b, Chl total, POX, and Sod reactions to drought stress. Figure 5 demonstrates a three-dimensional (3D) canonical diagram of the first three common values acquired with QDA.
The variance corresponding to canonical values 1, 2, and 3 was 85%, 13%, and 0.4%, respectively. The first three canonical values clarified 99% of the overall variance of the three canonical values; only the first canonical value had a substantial influence on discrimination. The possible three canonical ratios were equal to 0.48, 0.87, and 0.99, respectively, showing that the first canonical value had the maximum impact on grape cultivar discrimination (Table 3). These reactions, as utilized PCs for discrimination, had a 75% accurate categorization through QDA using a −2Log probable feature equivalent to 106.4. The four groups discriminated by Chl b, Chl total, POX, and Sod had 25% or 14 misclassifications (Table 3).

3.3.3. Third Set

In this set, EL, MDA, proline, CAT, and APX responses to drought stress were used to discriminate the four groups of grape cultivars. Figure 6 displays a three-dimensional (3D) canonical diagram of the first three canonical values acquired with QDA. The first three cones accounted for 100% of the total variance, and the variances corresponding to the first, second, and third canonical values were 79%, 14%, and 5.8%, respectively. The first canonical value, with a likelihood ratio of 0.4, had a substantial effect on classification and had the highest responsibility; two other canonical values had an insignificant effect on the classification of grape cultivars. The accurate categorization was 87%, and the −2Log probable feature was 54.67. The QDA by EL, MDA, proline, CAT, and APX responses for the discrimination of four groups of grape cultivars had 18 misclassifications (23.21%) (Table 3).

3.3.4. Fourth Set

The fourth set was obtained from a combination of traits in sets one and three, including, the Shoot L, Shoot N, Leaf A, RWC, Chl a, EL, MDA, proline, CAT, and APX responses of the four groups of grape cultivars under different water-supply regimes, and utilized for discrimination by QDA. Figure 7 indicates the 3D canonical schematic of the first three canonicals.
The three canonical values clarified a total variance of 100%: the variance conforming to canonical values one, two, and three were 64%, 21%, and 13%, respectively. The first canonical value had a substantial influence on the cultivars’ classification. Conversely, the first, second, and third canonical value had a probable ratio equivalent to 0.24, 0.55, and 0.79, respectively. The most significant impact on discrimination was made by the first canonical value. These retorts, as utilized PCs for discrimination, had a 100% accurate categorization through QDA using a −2Log probable factor identical to 2.73. The Shoot L, Shoot N, Leaf A, RWC, Chl a, EL, MDA, proline, CAT, and APX responses used for discrimination had no misclassifications (Table 3).

4. Discussion

The preliminary results of this research showed that the drought stress decreased the relative water content and photosynthetic pigments and increased the electrolyte leakage of the cell membrane due to the damage to it, causing more production of proline, malondialdehyde, protein, and antioxidant enzymes. Therefore, under drought stress, cultivar increases the accumulation of adaptive osmolytes, such as proline, antioxidant enzymes and proteins, regulates intracellular osmosis, maintains cellular turgor, and reduces damage to cell membranes, and prevents enzyme degradation (Figure 1). According to the results of Garashiligh and Tukilgan cultivars, the most drought-tolerant cultivars, as well as Aghshiligh, Kechi Amjaie and Copake Bogan cultivars, are drought-sensitive cultivars, and it is recommended that further molecular and biochemical analyses be performed on these cultivars. For molecular and breeding research on grapes in arid regions, it is recommended that these resistant cultivars are considered and used in future research.
Examining four sets of traits for the discrimination of grapevine cultivars showed that in the first set (Shoot L, Shoot N, Leaf A, RWfC, and Chl a), the second set (Chl b, Chl total, POX, and Sod), and the third set (EL, MDA, proline, CAT, APX) there are an element of grapevine growth, and that physiological and biochemical parameters cannot discriminate well. The fourth set, in the combined first and second sets, showed a clear discrimination of grapevine cultivar with 100 correct classifications. In the studies of Rezazad Bari in 21 grapevine rootstocks under salinity stress, the best discrimination was shown by the fourth set with 100% correct discrimination, including chlorophyll a, and chlorophyll b, total protein content, total carbohydrate content, proline, and glycine-betaine characteristics [26].
The results showed that with the increase in the level of drought stress in 14 studied grape cultivars, plant growth parameters decreased significantly. By reducing the leaf area, the sunlight absorption level and the plant photosynthetic level is reduced, finally leading to a reduction in dry matter and plant yield. Leaf relative water content (RWC) is a vital water status indicator in plants: drought stress troubles the equilibrium amid the H2O supply to the leaf tissue and transpiration rate, and the leaves’ comparative water content is reduced [27]. It has been found that the relative water content of leaves shows a good correlation with drought resistance and osmotic stresses in plants [28]. Tsegay, in 2014, identified that under stress conditions in the grapevine, drought-tolerant plants have a high-water potential by various mechanisms, such as an increased water uptake and a reduced water loss and maintenance of turgor, primarily by osmotic adjustment, activation of respiration, and accumulation of osmolytes and proteins [29].
There was a positive correlation between Shoot L, Shoot N, Leaf A, RWC, and Chl a in the first set that displayed a decrease in the volume of RWC under the impact of stress conditions, which can decrease Shoot L, Shoot N, Leaf A, and Chl a.
Drought stress and water deficit decreased photosynthetic activity, leaf chlorophyll synthesis, and chlorophyll a/b proportion in soybeans [30]. Recent study outcomes showed a reduction in chlorophyll a/b content. Drought stress also caused a decrease in the photochemical efficiency of photosystem II, a change in stomatal movement, a decrease in the abundance of Calvin cycle proteins, and a disruption in the plants’ water status, which led to a weakening in plant production [31]. In addition, drought stress causes damage to enzymes associated with photosynthesis and result in a loss of photosynthetic pigment content [32]. The decrease in photosynthetic pigment content due to drought stress in grapes cv. has been investigated by Romeiko [33]. The results showed that increasing drought stress to 25%, the amount of chlorophyll a, chlorophyll b, and chlorophyll a/b in the leaves of all studied cultivars was significantly reduced.
One of the most critical parameters for identifying plants with high resistance to drought stress is electrolyte leakage [34]. By increasing drought stress, ion leakage in all grape cultivars is increased significantly. Drought-stress disruption of the cell membranes and inactivation of ion pumps located in cell membranes leads to an increase in the rate of electrolyte leakage [35]. Similar findings have been obtained from the role of stress in electrolyte leakage on wine grape cultivars, [35], fig [36], kiwifruit [37], spinach, and lettuce in vitro [34]. In addition, cell membrane integrity during drought stress is a sign of the control mechanism in the tolerance of desiccation, so cultivars such as Garashiligh, and Tukilgan, which have higher membrane stability, are more resistant to dehydration stress.
Excessive ROS stages are intensified due to severe drought stress on the plant’s capacity to scavenge, and due to lipid peroxidation (LP) in biological membranes [38]. In the present study, drought stress significantly affected the physiological processes of the cell and increased MDA content due to increased lipid peroxidation and cell membrane damage. This finding is consistent with the studies for oats (Avena spp. L) [39], and apple trees (Malus spp. Mill.) [40] under drought.
During drought stress, proline is activated as a cellular osmotic regulator between the cytoplasm and the vacuole, and by detoxifying ROS, it protects the membrane and establishes membrane antioxidant enzymes [41]. Proline content increases significantly during drought stress in leaves of different grape rootstocks, such as Rasha [26], 110 Richter [41], and Narinc grape leaves [35]. Ous’s findings are consistent with the findings of Kamangar and Haddad, reporting that proline content in the leaves of the Vitis vinifera grapevine increased in response to drought stress [42].
With the increase in drought stress in the studied cultivars, the amount of total soluble sugar increased. In most of the studied cultivars, a significant increase was observed in total soluble sugar of up to 50%. No significant change was observed at 25% field capacity, which may be due to high stress and reduced photosynthetic activity in plant products.
Statistical analysis showed that, with the decrease in irrigation level, antioxidant enzymes, such as CAT and SOD, and glutathione-ascorbate cycle enzymes, such as POD and APX, increased to protect against the effects of ROS (such as superoxide, hydrogen peroxide, and singlet oxygen). An excessive production of reactive oxygen species in drought stress leads to the peroxidation of cell membrane lipids and the degradation of enzyme proteins and nucleic acids [5]. The primary mechanisms of drought resistance are the ROS elimination through enzymatic as well as non-enzymatic methods, comprising stress protein expression, and cell membrane stability [4]. The CAT enzyme in peroxisomes and APX enzymes scavenged the resulting hydrogen peroxide [33]. In this study, a significant increase in catalase activity was observed in the stressed leaves of the control plant. The high increase in ascorbate peroxidase indicated that this enzyme is responsible for protecting chloroplasts, enhancing electron flow under stress, and is the main product of AOS activity [43]. Wang reported that APX is an essential enzyme for H2O2 elimination. Additionally, the results showed that, with the increase in stress levels, the amount of peroxidase and ascorbate peroxidase enzymes increases significantly [44]. Increasing drought stress levels, the activity of antioxidant enzymes called superoxide dismutase, ascorbate peroxidase, catalase, and guaiacol peroxidase increases in cv. Romeiko [33] and ascorbate peroxidase, catalase, and superoxide dismutase increases in cv. Tempranillo [45]. In this study, antioxidant enzymes (CAT, SOD, POD, and APX) content increased in 14 grape cultivars, increasing the level of drought stress to 25% FC; these results are consistent with, Kamangar and Haddad [43] and Mirzaee [46].
Drought stress can also modify the volume and leaf protein conformation, resulting in alterations in soluble proteins and structural proteins [47]. In our study, with increasing drought stress, more proteins were observed in resistant cultivars. Several studies have shown that, under drought stress, some proteins, such as aquaporins, dehydrins, MYB proteins, and mitogen-activated protein kinases, are transcribed in grapevines, and play a significant role in plant protection under stress, which are copied differently depending on the cultivar [48].

5. Conclusions

In summary, we found statistically significant associations between compatible osmolytes, antioxidant enzymes, proteins, and drought tolerance after analyzing 14 grapevine genotypes. Catalase and superoxide dismutase and glutathione-ascorbate cycle enzymes, such as peroxidase and ascorbate peroxidase, increased to protect against the effects of reactive oxygen species. We conclude that physiological traits alone could not do the separation of the grapevine cultivars well, and biochemical traits should be studied along with physiological traits. Using multivariate statistical analysis and incorporating physiological and biochemical properties of grapevine cultivars under drought stress, our results imply that discrimination of four groups of grapevine cultivars leads to the conclusion that Garashiligh and Tukilgan are the most drought-tolerant cultivars, whereas Aghshiligh, Kechi Amjaie, and Copake Bogan are drought-sensitive ones. The information obtained in our study can be helpful to farmers in selecting grapevine cultivars suitable for local environmental conditions, as well as for grapevine breeders.

Author Contributions

Conceptualization, A.G., G.G. and C.H.; methodology, S.F. and A.M.N.; Data analysis, A.G., H.M.L. and A.A.S.; writing—original draft preparation, S.F. and G.G.; writing—review and editing, S.F., A.G., G.G. and C.H.; supervision and funding acquisition, A.G. and C.H. All authors have read and agreed to the published version of the manuscript.

Funding

This research received no external funding.

Data Availability Statement

The data that support the findings of this study are available from the corresponding author upon reasonable request.

Acknowledgments

We are grateful to department of Horticulture sciences, University of Mohaghegh Ardabili for providing laboratory facilities and financial assistance. All experiments were performed in the Horticultural Laboratory of University of Mohaghegh Ardabili, without external financial support.

Conflicts of Interest

The authors declare that they have no conflict of interest.

References

  1. Salehi-Lisar, S.Y.; Bakhshayeshan-Agdam, H. Drought stress in plants: Causes, consequences, and tolerance. In Drought Stress Tolerance in Plants; Springer: Cham, Switzerland, 2016. [Google Scholar]
  2. Pinheiro, C.; Chaves, M.M. Photosynthesis and drought: Can we make metabolic connections from available data? J. Exp. Bot. 2011, 62, 869–882. [Google Scholar] [CrossRef]
  3. Lawlor, D.W.; Cornic, G. Photosynthetic carbon assimilation and associated metabolism in relation to water deficits in higher plants. Plant Cell Environ. 2002, 25, 275–294. [Google Scholar] [CrossRef]
  4. Farooq, M.; Wahid, A.; Kobayashi, N.; Fujita, D. Plant drought stress: Effects, mechanisms, and management. Agron. Sustain. Dev. 2009, 29, 185–212. [Google Scholar] [CrossRef]
  5. Li, X.; Jiang, H.; Liu, F.; Cai, J.; Dai, T.; Cao, W.; Jiang, D. Induction of chilling tolerance in wheat during germination by pre-soaking seed with nitric oxide and gibberellin. Plant Growth Regul. 2013, 71, 31–40. [Google Scholar] [CrossRef]
  6. Bhattacharjee, S.; Mukherjee, A.K. Salt stress-induced cytosolute accumulation, antioxidant response, and membrane deterioration in three rice cultivars during early germination. Seed Sci. Technol. 2002, 30, 279–287. [Google Scholar]
  7. Chaves, M.M.; Zarrouk, O.; Francisco, R.; Costa, M.J.; Santos, T.; Regalado, P.A.; Rodrigues, L.M.; Lopes, M.C. Grapevine under deficit irrigation: Hints from physiological and molecular data. Ann. Appl. Biol. 2010, 105, 661–676. [Google Scholar] [CrossRef]
  8. Suklje, K.; Antalick, G.; Coetzee, Z.; Schmidtke, L.; Cesnik, H.B.; Brandt, J.; du Toit, W.; Lisjak, K.; Deloire, A. Effect of leaf removal and ultraviolet radiation on the composition and sensory perception of Vitis vinifera L. cv. Sauvignon Blanc wine. Aust. J. Grape Wine Res. 2014, 20, 223–233. [Google Scholar] [CrossRef]
  9. Mittler, R. Oxidative stress, antioxidants, and stress tolerance. Trends Plant Sci. 2002, 7, 405–410. [Google Scholar] [CrossRef]
  10. Alston, J.M.; Sambucci, O. Grapes in the World Economy. In The Grape Genome. Compendium of Plant Genomes; Cantu, D., Walker, M., Eds.; Springer: Cham, Switzerland, 2019. [Google Scholar]
  11. FAO-OIV Focus. Table and Dried Grapes; Food and Agriculture Organization of the United Nations: Rome, Italy, 2016. [Google Scholar]
  12. Amiry, S.; Esmaiili, M.; Alizadeh, M. Classification of adulterated honeys by multivariate analysis. Food Chem. 2017, 224, 390–397. [Google Scholar] [CrossRef]
  13. Yamasaki, S.; Dillenburg, L.R. Measurements of leaf relative water content in Araucaria Angustifolia. Braz. J. Plant Physiol. 1999, 11, 69–75. [Google Scholar]
  14. Lichtenthaler, H.K. Chlorophylls and carotenoids. In Pigments of Photosynthetic Biomembranes; Wilchek, M., Bayer, E.A., Eds.; Methods in Enzymology; Academic Press: Cambridge, UK, 1987; Volume 148, pp. 350–382. [Google Scholar] [CrossRef]
  15. Gohari, G.; Zareei, E.; Rostami, H.; Panahirad, S.; Kulak, M.; Farhadi, H.; Amini, M.; del Carmen Martinez-Ballesta, M.; Fotopoulos, V. Protective effects of cerium oxide nanoparticles in grapevine (Vitis vinifera L.) cv. Flame Seedless under salt stress conditions. Ecotoxicol. Environ. Saf. 2021, 220, 112402. [Google Scholar] [CrossRef]
  16. Heath, R.L.; Packer, L. Photoperoxidation in isolated chloroplasts. Kinetics and stoichiometry of fatty acid penoxidation. Arch. Biochemical. Biophys. 1968, 125, 189–198. [Google Scholar] [CrossRef]
  17. Bates, L.S.; Woldren, R.P.; Teare, I.D. Rapid determination of free proline for water-stress studies. Plant Soil. 1973, 39, 205–207. [Google Scholar] [CrossRef]
  18. Watanabe, S.; Kojima, K.; Ide, Y. Effects of saline and osmotic stress on proline and sugar accumulation in Populus euphratica in vitro. Plant Cell Tissue Organ Cult. 2000, 63, 199. [Google Scholar] [CrossRef]
  19. Beauchamp, C.; Fridovich, I. Superoxide dismutase: Improved assays and an assay applicable to acrylamide gels. Anal. Biochem. 1971, 44, 276–287. [Google Scholar] [CrossRef]
  20. Chance, B.; Maehly, A.C. Assay of Catalase and Peroxidases. Method Enzymol. 1955, 11, 764–775. [Google Scholar] [CrossRef]
  21. In, B.C.; Motomura, S.; Inamoto, K.; Doi, M.; Mori, G. Multivariate analysis of relations between preharvest environmental factors, postharvest morphological and physiological factors, and vase life of cut Asami Redroses. J. Jpn. Soc. Hortic. Sci. 2007, 76, 66–72. [Google Scholar] [CrossRef]
  22. Giannopolitis, C.N.; Reis, S.K. Superoxide dismutase I. Occurrence in higher plants. Plant Physiol. 1997, 59, 309–314. [Google Scholar] [CrossRef]
  23. Nakano, Y.; Asada, K. Hydrogen peroxide is scavenged by ascorbate-specific peroxidase in spinach chloroplasts. Plant Cell Physiol. 1981, 22, 867–880. [Google Scholar] [CrossRef]
  24. Bradford, M.M. A rapid and sensitive method for the quantitation of microgram quantities of protein utilizing the principle of protein-dye binding. Sci. Direct. 1976, 72, 248–254. [Google Scholar] [CrossRef]
  25. Massart, D.L.; Vandeginste, B.G.M.; Deming, S.N.; Michotte, Y.; Kaufman, L. Principal components and factor analysis. In Chemometrics: A Textbook; Elsevier: Amsterdam, The Netherlands, 1988; pp. 339–369. [Google Scholar]
  26. Bari, L.R.; Ghanbari, A.; Darvishzadeh, R.; Giglou, M.T.; Baneh, H.D. Discernment of grape rootstocks base on their response to salt stress using selected characteristics in combination with chemometric tools. Food Chem. 2021, 365, 130–408. [Google Scholar] [CrossRef]
  27. Deka, D.; Singh, A.K.; Singh, A.K. Effect of Drought Stress on Crop Plants with Special Reference to Drought Avoidance and Tolerance Mechanisms: A Review. Int. J. Curr. Microbiol. Appl. Sci. 2018, 7, 2703–2721. [Google Scholar] [CrossRef]
  28. Colom, M.R.; Vazzana, C. Photosynthesis and PSII functionality of drought-resistant and drought-sensitive weeping lovegrass plants. Environ. Exp. Bot. 2003, 49, 135–144. [Google Scholar] [CrossRef]
  29. Tsegay, D.; Amsalem, D.; Almeida, M.; Crandles, M. Responses of grapevine rootstocks to drought stress. Int. J. Plant Physiol. Biochem. 2014, 6, 1–6. [Google Scholar] [CrossRef]
  30. Du, Y.; Zhao, Q.; Chen, L.; Yao, X.; Zhang, W.; Zhang, B.; Xie, F. Effect of drought stress on sugar metabolism in leaves and roots of soybean seedlings. Plant Physiol. Biochem. 2020, 146, 1–12. [Google Scholar] [CrossRef]
  31. Xiang, D.-B.; Peng, L.-X.; Zhao, J.-L.; Zou, L.; Zhao, G.; Song, C. Effect of drought stress on yield, chlorophyll contents, and photosynthesis in Tartary buckwheat (Fagopyrum tataricum). J. Food Agric. Environ. 2013, 11, 1358–1363. [Google Scholar] [CrossRef]
  32. Brito, C.; Dinis, L.-T.; Moutinho-Pereira, J.; Correia, C.M. Drought stress effects and olive tree acclimation under a changing climate. Plants 2019, 8, 232. [Google Scholar] [CrossRef]
  33. Doupis, G.; Chartzoulakis, K.; Patakas, A. Differences in antioxidant mechanisms in grapevines subjected to drought and enhanced UVB radiation. Emir. J. Food Agric. 2012, 24, 607–613. [Google Scholar] [CrossRef]
  34. Hniličková, H.; Hnilička, F.; Orsák, M.; Hejnák, V. Effect of salt stress on growth, electrolyte leakage, Na+ and K+ content in selected plant species. Plant Soil Environ. 2018, 62, 314–320. [Google Scholar] [CrossRef]
  35. Altinci, N.T.; Cangil, R. Drought Tolerance of Some Wine Grape Cultivars under In Vitro Conditions. J. Agric. Fac. Gaziosmanpasa Univ. 2019, 36, 145–151. [Google Scholar] [CrossRef]
  36. Karimi, S.; Hojati, S.; Eshghi, S.; Moghaddam, R.N.; Jandoust, S. Magnetic exposure improves the tolerance of Figure ‘Sabz’ explants to drought stress induced in vitro. Sci. Hortic. 2012, 137, 95–99. [Google Scholar] [CrossRef]
  37. Savee, R.; Adillon, J. Comparison between plant water relations of in vitro plants and rooted cuttings of kiwifruit. Acta Hortic. 1990, 282, 53–57. [Google Scholar] [CrossRef]
  38. Labudda, M. Lipid peroxidation is a biochemical marker for oxidative stress during drought. An effective tool for plant breeding. E-Wydawnictwo 2013, 1–12. [Google Scholar]
  39. Harish, C.; Baig Pandey, M.J.; Chandra, A.; Bhatt, R.K. Drought stress-induced changes in lipid peroxidation and antioxidant system in genus Avena. J. Environ. Biol. 2010, 31, 435–440. [Google Scholar]
  40. Wang, S.; Liang, D.; Li, C.; Hao, Y.; Ma, F.; Shu, H. Influence of drought stress on the cellular ultrastructure and antioxidant system in leaves of drought-tolerant and drought-sensitive apple rootstocks. Plant Physiol. Biochem. 2012, 51, 81–89. [Google Scholar] [CrossRef]
  41. Prochozkova, D.; Jan, S.; Abd-Allah, E.F.; Ahmad, P. Water stress in grapevine (Vitis vinifera L.). In Water Stress and Crop Plants: A Sustainable Approach, 1st ed.; Ahmad, P., Ed.; John Wiley & Sons, Ltd: Hoboken, NJ, USA, 2016; Volume 2. [Google Scholar]
  42. Kamangar, A.; Haddad, R. Effect of Water Stress and Sodium Silicate on Antioxidative Response in Different Grapevine (Vitis vinifera L.) Cultivars. J. Agr. Sci. Technol. 2016, 18, 1859–1870. [Google Scholar]
  43. Asada, K. The water–cycle in chloroplasts: Scavenging of active oxygens and dissipation of excess photons. Annu. Rev. Plant Biol. 1999, 50, 601–639. [Google Scholar] [CrossRef]
  44. Wang, R.; Liu, S.; Zhou, F.; Ding, C. Exogenous ascorbic acid and glutathione alleviate oxidative stress induced by salt stress in the of Oryza sativa L. Z. Für Nat. C 2014, 69, 226–236. [Google Scholar] [CrossRef]
  45. Salazar-Parra, C.; Aguirreolea, J.; Sanchez-Daz, M.; Irigoyen, J.J.; Morales, J. Climate change (elevated CO2, elevated temperature and moderate drought) triggers the antioxidant enzymes’ response of grapevine cv. Tempranillo, avoiding oxidative damage. Physiol. Plant 2012, 144, 99–110. [Google Scholar] [CrossRef]
  46. Mirzaee, M.; Moieni, A.; Ghanati, F. Effects of drought stress on the lipid peroxidation and antioxidant enzyme activities in two Canola (Brassica napus L.) Cultivars. J. Agri. Sci. Technol. 2013, 15, 593–602. [Google Scholar]
  47. Suseela, V.; Tharayil, N.; Xing, B.; Dukes, J.S. Warming and drought differentially influence the production and resorption of elemental and metabolic nitrogen pools in Quercus rubra. Glob. Change Biol. 2015, 21, 4177–4195. [Google Scholar] [CrossRef]
  48. Corso, M.; Bonghi, C. Grapevine rootstock effects on abiotic stress tolerance. Plant Sci. Today 2014, 1, 108–113. [Google Scholar] [CrossRef]
Figure 1. Response of grapevine cultivars to different water shortage regimes. On the x-axis, from one to four, respectively: 100 (control), 75, 50, and 25% of water requirement. Shoot length (Shoot L), shoot number (Shoot N), leaf area (Leaf A), relative water content (RWC), chlorophyll a (Chl a), chlorophyll b (Chl b), chlorophyll total (Chl total), chlorophyll a/b (Chl a/b), electrolyte leakage (EL), malondialdehyde (MDA), catalase (CAT), ascorbate peroxidase (APX), peroxidase (POX), and superoxide dismutase (Sod). Red (tolerant cultivars), green (semi-tolerant), blue (semi-sensitive), and orange (sensitive).
Horticulturae 08 00871 g001
Figure 2. The biplot of PCA results for 17 characteristics of 14 grapevine cultivars under different levels of water stress (green (control), pale green (25% FC), pale red (50% FC), red (75%)).
Horticulturae 08 00871 g002
Figure 3. The 3D canonical plot of QDA results in discrimination of four groups based on the discrimination of all parameters, including the Shoot L, Shoot N, Leaf A, RWC, Chl a, Chl b, Chl a/b, Chl total, EL, MDA, proline, sugar, protein, CAT, APX, POX, and Sod. Groups were determined with different colors (green for tolerant, pale green for semi-tolerant, pale red for semi-susceptible, and red for susceptible).
Horticulturae 08 00871 g003
Figure 4. The 3D canonical plot of QDA results in discrimination of four groups based on the first set of characteristics, including Shoot L, Shoot N, Leaf A, RWC, and Ch a.
Horticulturae 08 00871 g004
Figure 5. The 3D canonical plot of QDA results in the discrimination of four groups based on the two sets of characteristics, including Chl b, Chl total, POX, and Sod.
Horticulturae 08 00871 g005
Figure 6. The 3D canonical plot of QDA results in discrimination of four groups based on the three sets of characteristics, including the EL, MDA, proline, CAT, and APX.
Horticulturae 08 00871 g006
Figure 7. The 3D canonical plot of QDA results for discrimination of four groups based on the Combination 1 and 3 sets of characteristics, including the Shoot L, Shoot N, Leaf A, RWC, Chl a, EL, MDA, proline, CAT, and APX.
Horticulturae 08 00871 g007
Table 1. Name, characteristics, and grouping of grapevine cultivars used in the present research.
SymbolGenotypeType of UseFirmnessSkin ColorBerry ShapeRipeningSeed
1GarashilighGrape juiceSoftDark blueRoundMediumSeeded
1TukilganGrape juiceSoftLight yellowOval shapedMediumSeeded
1Sahebi SoftRedOval shapedLateSeeded
2RasmiFresh useFirmYellow-greenRoundLateSeeded
2AldaragGrape juiceSoftYellow-greenOval shapedLateSeeded
2ShahaniFresh use, grape juiceMediumDark blueRoundMediumSeeded
2Seirak pustehFresh use, grape juiceMediumYellow-greenRoundLateSeeded
2KhaliliFresh use, raisinsMediumyellowOval shapedEarlySeeded
3Copake BoganGrape juiceMediumYellow-greenOvateLateSeeded
3NorasFresh useMediumYellow-greenOvateEarlySeeded
3Kechi AmjaieFresh use, Grape juiceSoftYellowOblongLateSeeded
4AghshilighGrape juiceSoftYellow-greenRoundLateSeeded
4Keshmeshi TabriziGrape juiceMediumYellow-greenOval shapedEarlySeeded
4KeshmeshiFresh use, raisinsMediumYellowEllipticMediumSeedless
Note: 1, 2, 3, 4 include tolerant, semi-tolerant, semi-sensitive, and sensitive cultivars, respectively (based on physiological and biochemical studies).
Table 2. Principal component factor loadings for 17 traits measured.
PC1PC2PC3
Shoot L−0.830.090.16
Shoot N−0.770.0010.09
Leaf A−0.66−0.170.32
RWC−0.520.250.004
Chl a−0.840.30−0.01
Chl b−0.290.84−0.37
Chl a/b−0.450.82−0.27
Chl total−0.490.79−0.31
EL0.90−0.09−0.06
MDA0.88−0.08−0.10
Proline0.770.34−0.06
Sugar0.300.430.46
Protein0.110.780.30
CAT0.600.520.11
APX0.730.21−0.42
POX0.360.640.38
Sod0.550.620.28
Loadings with an absolute value greater than 0.453 are shown in bold type.
Table 3. Number and present age of misclassification, entropy RSquare and likelihood ratio for each set of traits used for classification of grapevine cultivars.
SourceCountNumber MisclassifiedPercent MisclassifiedEntropy RSquare−2LogLikelihood
All parameters5623.50.9014.5
First set561628.50.5764.7
Second set561017.80.4583.5
Third set561323.20.6454.6
Fourth set5600.00.982.7
Publisher’s Note: MDPI stays neutral with regard to jurisdictional claims in published maps and institutional affiliations.

