Article

Late Ripening Apple Production Benefits from High Shading and Water Limitation under Exclusion Netting

by
Alexandra Boini
1,
Gianmarco Bortolotti
1,
Giulio Demetrio Perulli
1,
Melissa Venturi
1,
Alessandro Bonora
1,
Luigi Manfrini
1,* and
Luca Corelli-Grappadelli
2
1
Department of Agricultural and Food Sciences (DISTAL), University of Bologna, Viale G. Fanin 44, 40127 Bologna, Italy
2
Interdepartmental Center for Agri-Food Industrial Research (CIRI-Agroalimentare), University of Bologna, Via Quinto Bucci 336, 47521 Cesena, Italy
*
Author to whom correspondence should be addressed.
Horticulturae 2022, 8(10), 884; https://doi.org/10.3390/horticulturae8100884
Submission received: 19 July 2022 / Revised: 29 August 2022 / Accepted: 22 September 2022 / Published: 27 September 2022
(This article belongs to the Special Issue Precision Management of Fruit Trees)

Abstract

:
In highly solar irradiated areas, apple production can face challenges due to high evaporative water demands. Shading can be used to lower irrigation requirements and make apple growing more sustainable. In this trial, a white exclusion net (40% shading) integrated with rain protection was compared with a regular anti-hail black net (20% shading), on Rosy Glow apple. Crop physiology, yield and quality parameters were monitored during two consecutive years, under conditions of full and restricted irrigation. Since Et0 under the two cover systems was different, their respective 100% irrigation replacement was different; both covers also received a restricted irrigation treatment (70% replacement of Et0). Tree physiology (midday stem water potential, leaf gas exchanges, seasonal fruit growth) was not affected, neither by less light nor by less water. Moreover, marketable yield, fruit color and soluble solid content were improved under the more shaded environment, even when the irrigation volume was limited. These results are encouraging, as an overall 50% of water was saved (ca. 190 mm tree−1 per year), compared to the control irrigation treatment, under a classic anti-hail system (ca. 370 mm tree−1 per year).

1. Introduction

Fruit growing, and agriculture in general, is facing serious, varied challenges, attributable to climate change. An example of one of these challenges is the constant exceptionally high temperatures during spring and summer 2022, in the Mediterranean basin. Inevitable increases in reference evapotranspiration (Et0) and crop evapotranspiration (Etc) are expected and are starting to be observed [1,2]; therefore, mitigation strategies need to be implemented in production protocols. Aiming at sustainable production methods is the main goal for future food related processes. To improve orchard sustainability, improving water use for irrigation is a must. Plant water uptake is dictated by evaporative demand, due to high leaf-to-air vapor pressure deficit (VPD) and transpiratory losses allowing for leaf cooling along with CO2 uptake, where the main driver of the process is solar radiation. Decreasing solar radiation interception, in areas characterized by both high light and air temperatures, is thus a solution that growers should take into consideration. In Italy, orchards are commonly fitted with anti-hail netting systems, and lately, rain proof systems have been implemented in these structures to avoid fruit wetting and subsequent cracking in cherries, but with potential benefits for other crops, for example preventing fungal diseases. The shading of these systems goes from 10% (regular anti-hail nets) to nearly 50% (with rain shelter).
Shading has long been known to be a promising strategy for maintaining low crop water requirements [3,4,5,6,7], lowering irrigation restitution volumes [8,9]. Many studies have focused on apples, considered a suitable candidate for trials involving shading nets. The recent introduction of commercial solutions that enclose the entire orchard, known as “exclusion netting”, has been tested for pest management purposes [10,11,12,13,14,15,16,17,18] in France, Italy and Croatia. More recently, this system was tested on apple physiology, on the early ripening Gala [9]. The results of these works are encouraging in boosting sustainability for apple growing. Firstly, there are positive outputs that this mechanical barrier generates when related to pest control. Secondly, 40% shading with a white exclusion system is not detrimental to tree physiological performances and most importantly to marketable yield and final fruit quality [9].
The following study aims to demonstrate how medium-strong shading application can be beneficial and increase sustainability by lowering apple water requirements. This study focused on a late ripening apple variety, as to further demonstrate the feasibility of light management even if prolonged until the autumn period.

2. Materials and Methods

2.1. Study Site

The trial took place at the experimental farm of Bologna University (Italy, 44°30′ N; 10°36′ E, 27 m elevation), in a Pink Lady (Rosy Glow) apple orchard grafted on Pajam 2, during the years 2020 and 2021. The orchard was planted in 2014 on a silty clay loam soil consisting of 10 rows (50 trees in each row). Trees were spaced 1 × 3.3 m (3030 tree ha−1), with a north–south orientation, trained as slender spindle. Since its installation, the management of the orchard followed integrated pest management (IPM) protocols, and trees were watered as needed. The orchard was covered with regular anti-hail net (A) (20% shading, as stated by the manufacturer; Valente srl, Campodarsego, PD, Italy), deployed at the beginning of the season (20 days after full bloom) and withdrawn after harvest.
Full bloom dates were recorded in early April, for both years: 1 April 2020 and 5 April 2021.

2.2. Net Treatments, Weather, and Irrigation

In May 2020, the orchard was divided into two sectors (5 rows each): one remained under the A net, considered as control, while the other was covered with a white exclusion netting system (E) (Keep in touch®), which enclosed the entire sector of the orchard (including the headspaces for turning). E net was integrated with a white rain-proof cover placed over each row (1 m on both East and West sides), as a protection against rain; hence, the overall shading percentage of the exclusion net treatment was stated to be around 50%. Both nets had an English-turn weaving system and were of the same material (polymethyl methacrylate) with different wefts: A net was around 10 × 5 mm, while E net was approximately 3 × 4 mm. The rain-proof double layer of the E net was characterized by extremely dense links (<1 mm). The set-up was maintained in 2021.
In each orchard sector and outside the orchard, weather parameters were registered on an hourly basis (air temperature (°C), relative humidity (%), rain (mm), solar radiation (W m2)), with dedicated weather stations (Davis Instruments GroWeather 24 Hr Fan, Cabled, Metric 6825CM, Davis, CA, USA). Solar radiation was converted in photosynthetic active radiation (PAR), following calculations from Dye, 2004 [19].
For each net treatment (A, E), two different irrigations were applied for two years. A 100% restitution irrigation, based on Et0, was computed following the Hargreaves–Samani equation [20], using weather data from the weather stations, installed below the nets. Having two different shading properties, the two coverings generated different microclimates; hence, Et0 was different in the two orchard sectors. Once Et0 and control irrigation for the two nets were calculated, a second irrigation treatment was applied, at 70% of reference Et0. In total, there were 4 irrigation treatments, named as follows:
-
A100: anti-hail net control irrigation (100% Et0 under the anti-hail net);
-
A70: anti-hail net restricted irrigation (70% Et0 under the anti-hail net);
-
E70: exclusion net control irrigation (100% Et0 under the exclusion net);
-
E50: exclusion net restricted irrigation (70% Et0 under the exclusion net).
The numbers following the net treatments’ capital letters represent the absolute percentages of applied water, using A100 as the main reference. Thus, E50 received 50% of the irrigation volumes applied to A100. Total irrigation for each treatment and year is reported in Table 1.
The irrigation treatments were arranged in all 5 rows of each sector. Only the 3 central rows were used for measurements (lateral rows were excluded from the trial, serving as guard), as a split plot complete randomized design, repeated 3 times each, with 8 trees for each repetition; in each repetition, 2 trees were marked and were tested for physiological parameters, along the season. In total, 6 trees were monitored for each treatment (Figure 1).
An ad hoc automated drip irrigation system was installed, where emitters were distanced 0.5 m with a flow rate of 2.0 L per hour. The IRRIFRAME-utilized platform communicated via a “web-API” (application programming interface) and sent information to the irrigation controller. This unit controlled 3 sectors, corresponding to control irrigation, 70% and 50%. Since flow rate was the same, irrigation treatments were managed with different lengths of application that corrected the Et0 volume based on the treatment previously described. Rain events that occurred the previous day were considered when calculating Et0 of the current one.

2.3. Midday Stem Water Potential and Leaf Gas Exchanges

During the two-year experiment, midday plant water status (stem water potential (Ψs)), midday leaf gas exchanges (leaf photosynthesis (An) and stomatal conductance (gs)) were measured once per month simultaneously, at solar noon (±30 min) within one hour time, on cloudless days. Measurements began from the onset of irrigation treatments until harvest.
Following Turner and Long [21], Ψs was measured with a Scholander pressure chamber (Model 3005, Soil Moisture Equipment Corp., Santa Barbara, CA, USA); at least 1 h prior to measurements, a leaf close to the trunk was enclosed in a black plastic envelope, covered with aluminum foil. Leaf gas exchanges were performed with a portable infra-red gas analyzer (LI-COR 6400, Lincoln, NE, USA), connected to a leaf fluorometer chamber, which had a LED light source. This allowed us to set the right photosynthetically active radiation (PAR) for each net treatment.
Measurements were performed according to Boini et al. [9], on the following dates: 12 June, 16 July, 30 July, 20 August, 8 October, in 2020; 26 May, 30 June, 3 August, 3 September, 14 October, in 2021.

2.4. Fruit Growth

During both years, fruit diameter was traced on the 6 selected trees in each treatment (8 fruit tree−1 in 2020 and 4 fruit tree−1 in 2021). Fruit were calibrated along the season, until harvest, to track absolute growth rate (AGR). This was possible by converting the diameter to fresh weight with the following equation:
Fresh weight = 0.0006 × Diameter2.924
The equation has a regression coefficient (R2) of 0.99 and was derived from fruit diameter and weight data of about 300 fruits from several Pink Lady apple orchards in the growing area.

2.5. Yield Determinants and Fruit Quality

Fruit were harvested for all treatments on 30 October 2020 and on 28 October 2021. For each treatment, all 6 trees were harvested, plus an extra 3 in 2021 (in order to avoid possible variability intra-treatment). Crop load (fruit tree−1) and total yield (kg tree−1) were first determined, and then for each tree, all fruit were calibrated with a digital caliper (Mitutoyo, Kanagawa, Japan) attached to an external memory (www.hkconsulting.it, accessed on 15 July 2022), as to obtain marketable yield (considering fruit above 65 mm diameter) (kg tree−1). This procedure allowed us to obtain the weight of each single fruit, applying Equation (1).
On the same harvest dates, representative fruit (18 in 2020 and 20 in 2021, for each replication) were selected for quality parameters evaluation, which included: individual fruit coloration (percentage of red-colored surface from visual observation), followed by individual fruit peel color (color coordinates, taken with a Konica Minolta (Tokyo, Japan) on exposed and non-exposed fruit sides). Further analyses included individual fruit flesh firmness (determined with a PCE-PTR 200 penetrometer (PCE Instruments, Meschede, Germany), using an 11 mm diameter tip after removing the fruit peel from opposite sides (exposed and non-exposed to the sun) and calculating the mean value of the two outputs); and soluble solid content (refractive index of the juice (°Brix) for each fruit, measured with a HI 96,811 digital refractometer (Hanna, Woonsocket, RI, USA)).

2.6. Statistical Analysis

Values of PAR (only hours from 9:00 to 18:00) for the external, anti-hail and exclusion nets, during the trial, were subjected to analysis of variance (ANOVA) to characterize the environmental shade conditions of each experimental year. Within each year, ANOVA was used to seek differences in crop load; if differences were found between treatments, crop load was used as a covariate for further analyses of covariance to separate the effect of treatments in each variable. The results were then expressed as the least square (LS) means, and p values were considered significant when <0.05. However, if the effect of crop load was not significant, simple ANOVAs and linear contrasts followed. A Student–Newman–Keuls (SNK) test was used to separate means. For each year, linear contrasts were performed to compare possible differences between:
-
Irrigation treatments, under the anti-hail net (A100 A70);
-
Irrigation treatments, under the exclusion net (E70 E50);
-
The same amount of irrigation, under different net treatments (A70 E70);
-
Control irrigation treatments, under different net treatments (A100 E70).
These analyses were performed for the mean seasonal value of Ψs, An, gs and fruit AGR, for total and marketable yield, average marketable fruit weight and fruit quality traits. Class size distribution differences were tested by a correspondence multivariate analysis, followed by a cluster analysis, with a Chi-square test [20,22].

3. Results

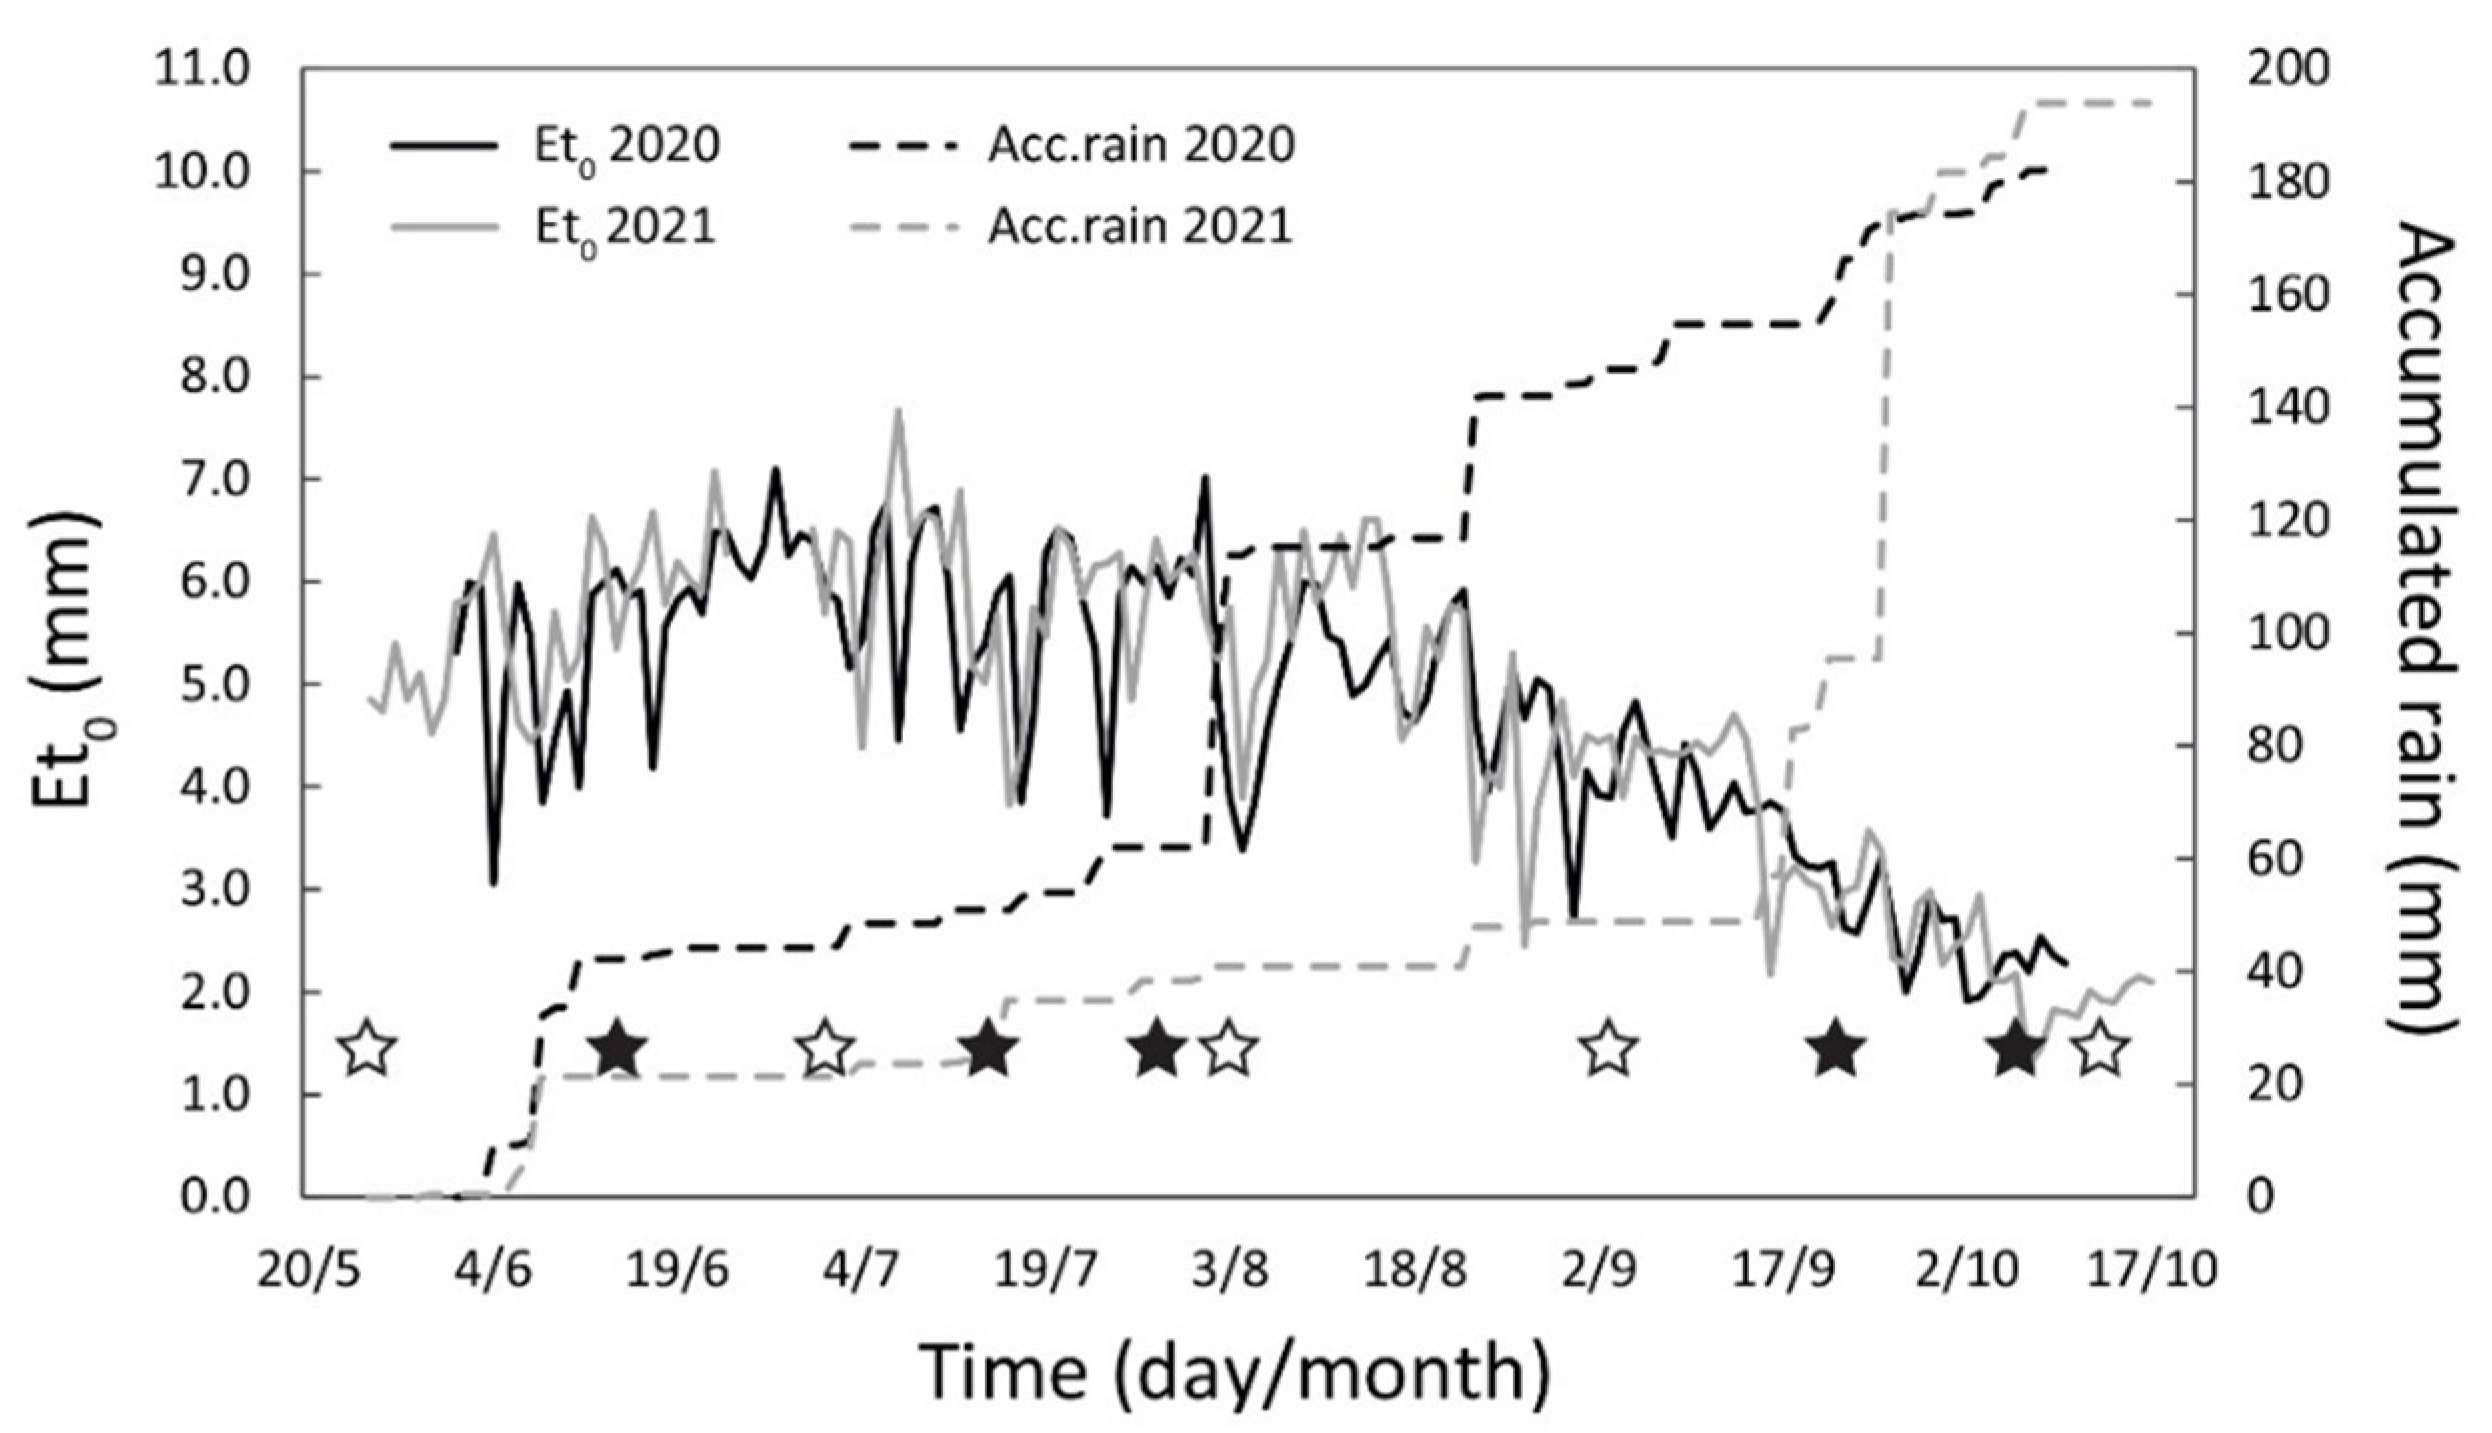
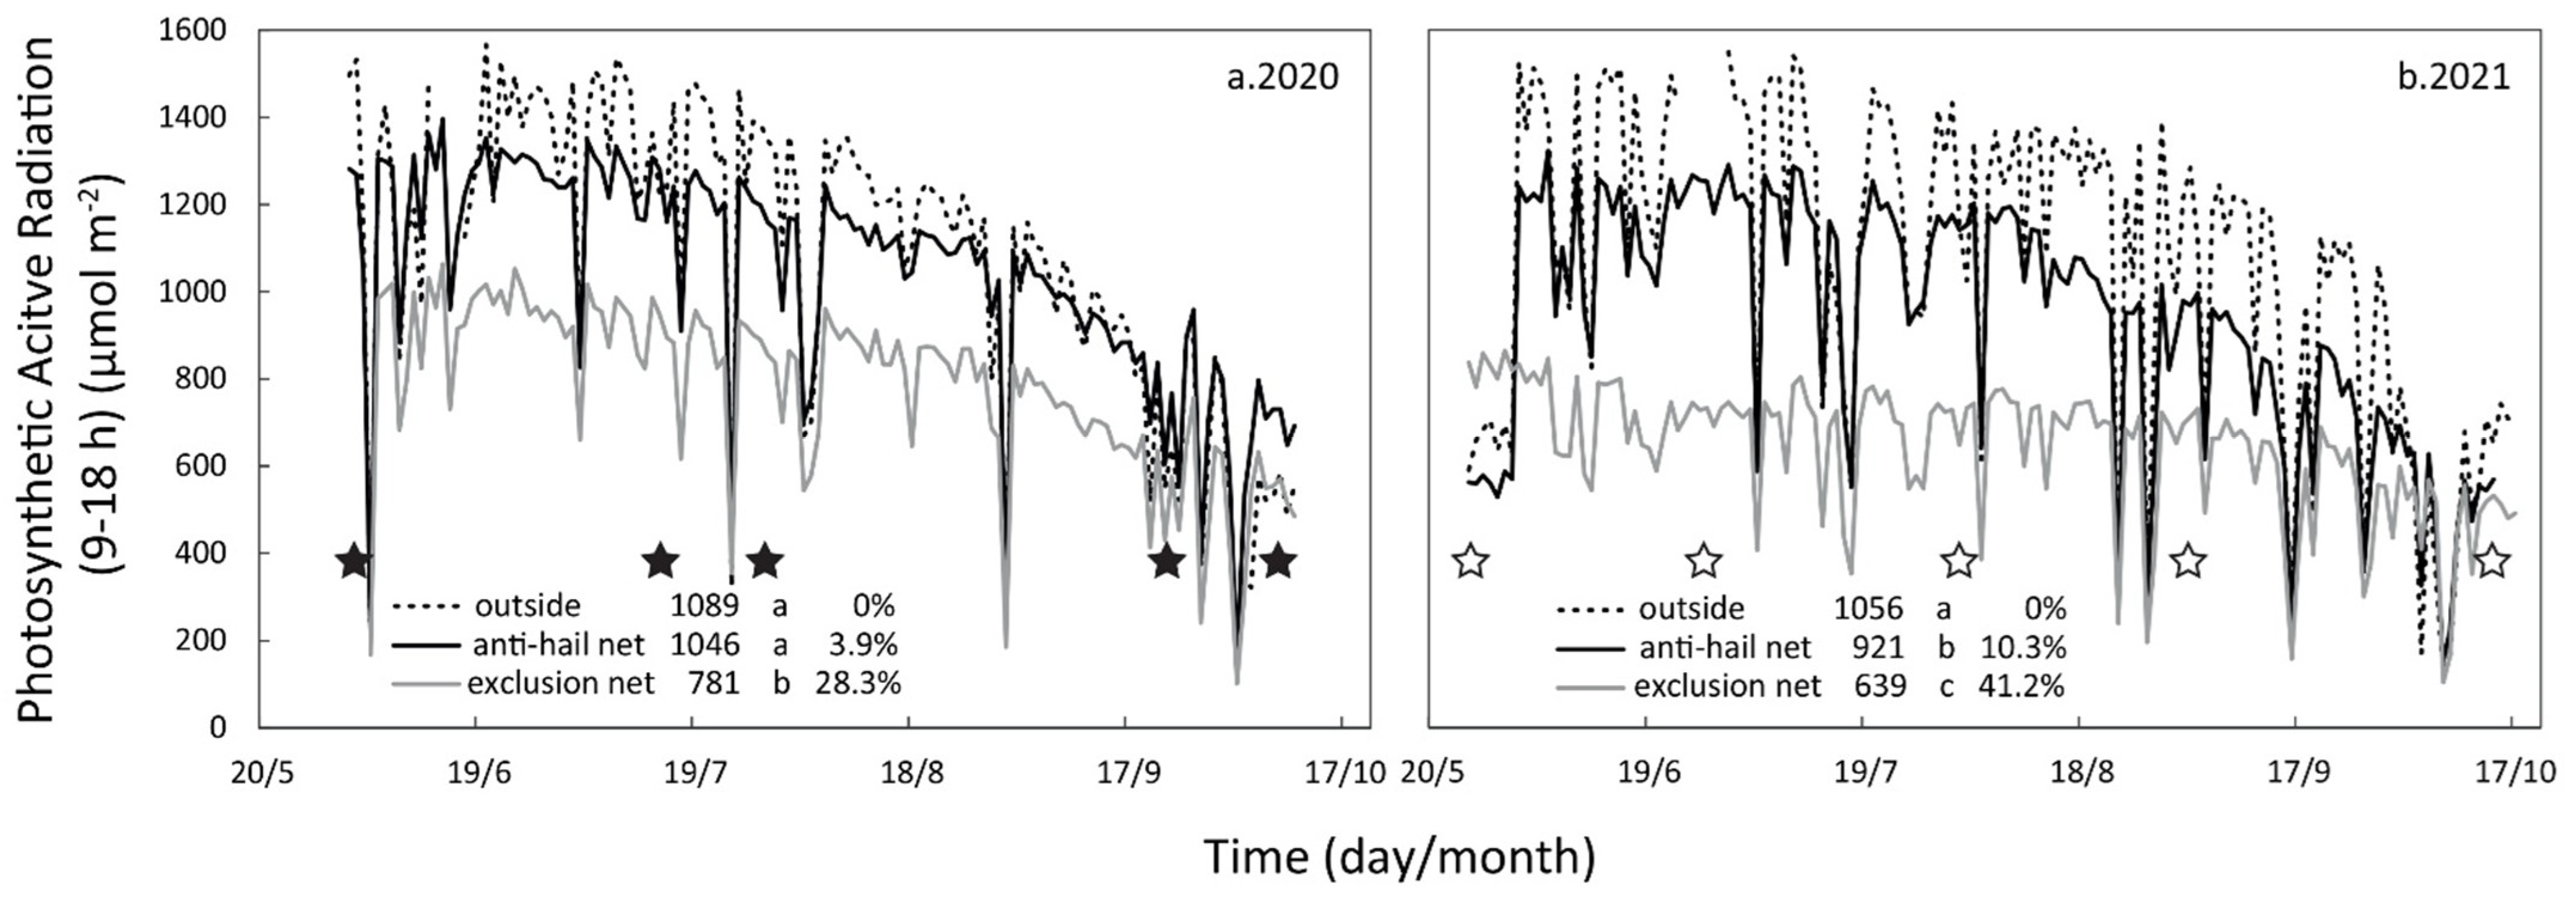
3.1. Weather, Net Treatments and Irrigation

Et0 outside the nets was similar between the two growing seasons (4.9 mm), even though rainfall events were more regular in 2020 than in 2021 (Figure 2).
Shading was different under the net treatments, although PAR between 9–18 h showed values different from those declared (Figure 3). The anti-hail net shaded around 4–10% and was significantly similar to the reference external radiation in 2020. The exclusion net shaded around 30–40%, being significantly lower during both years.

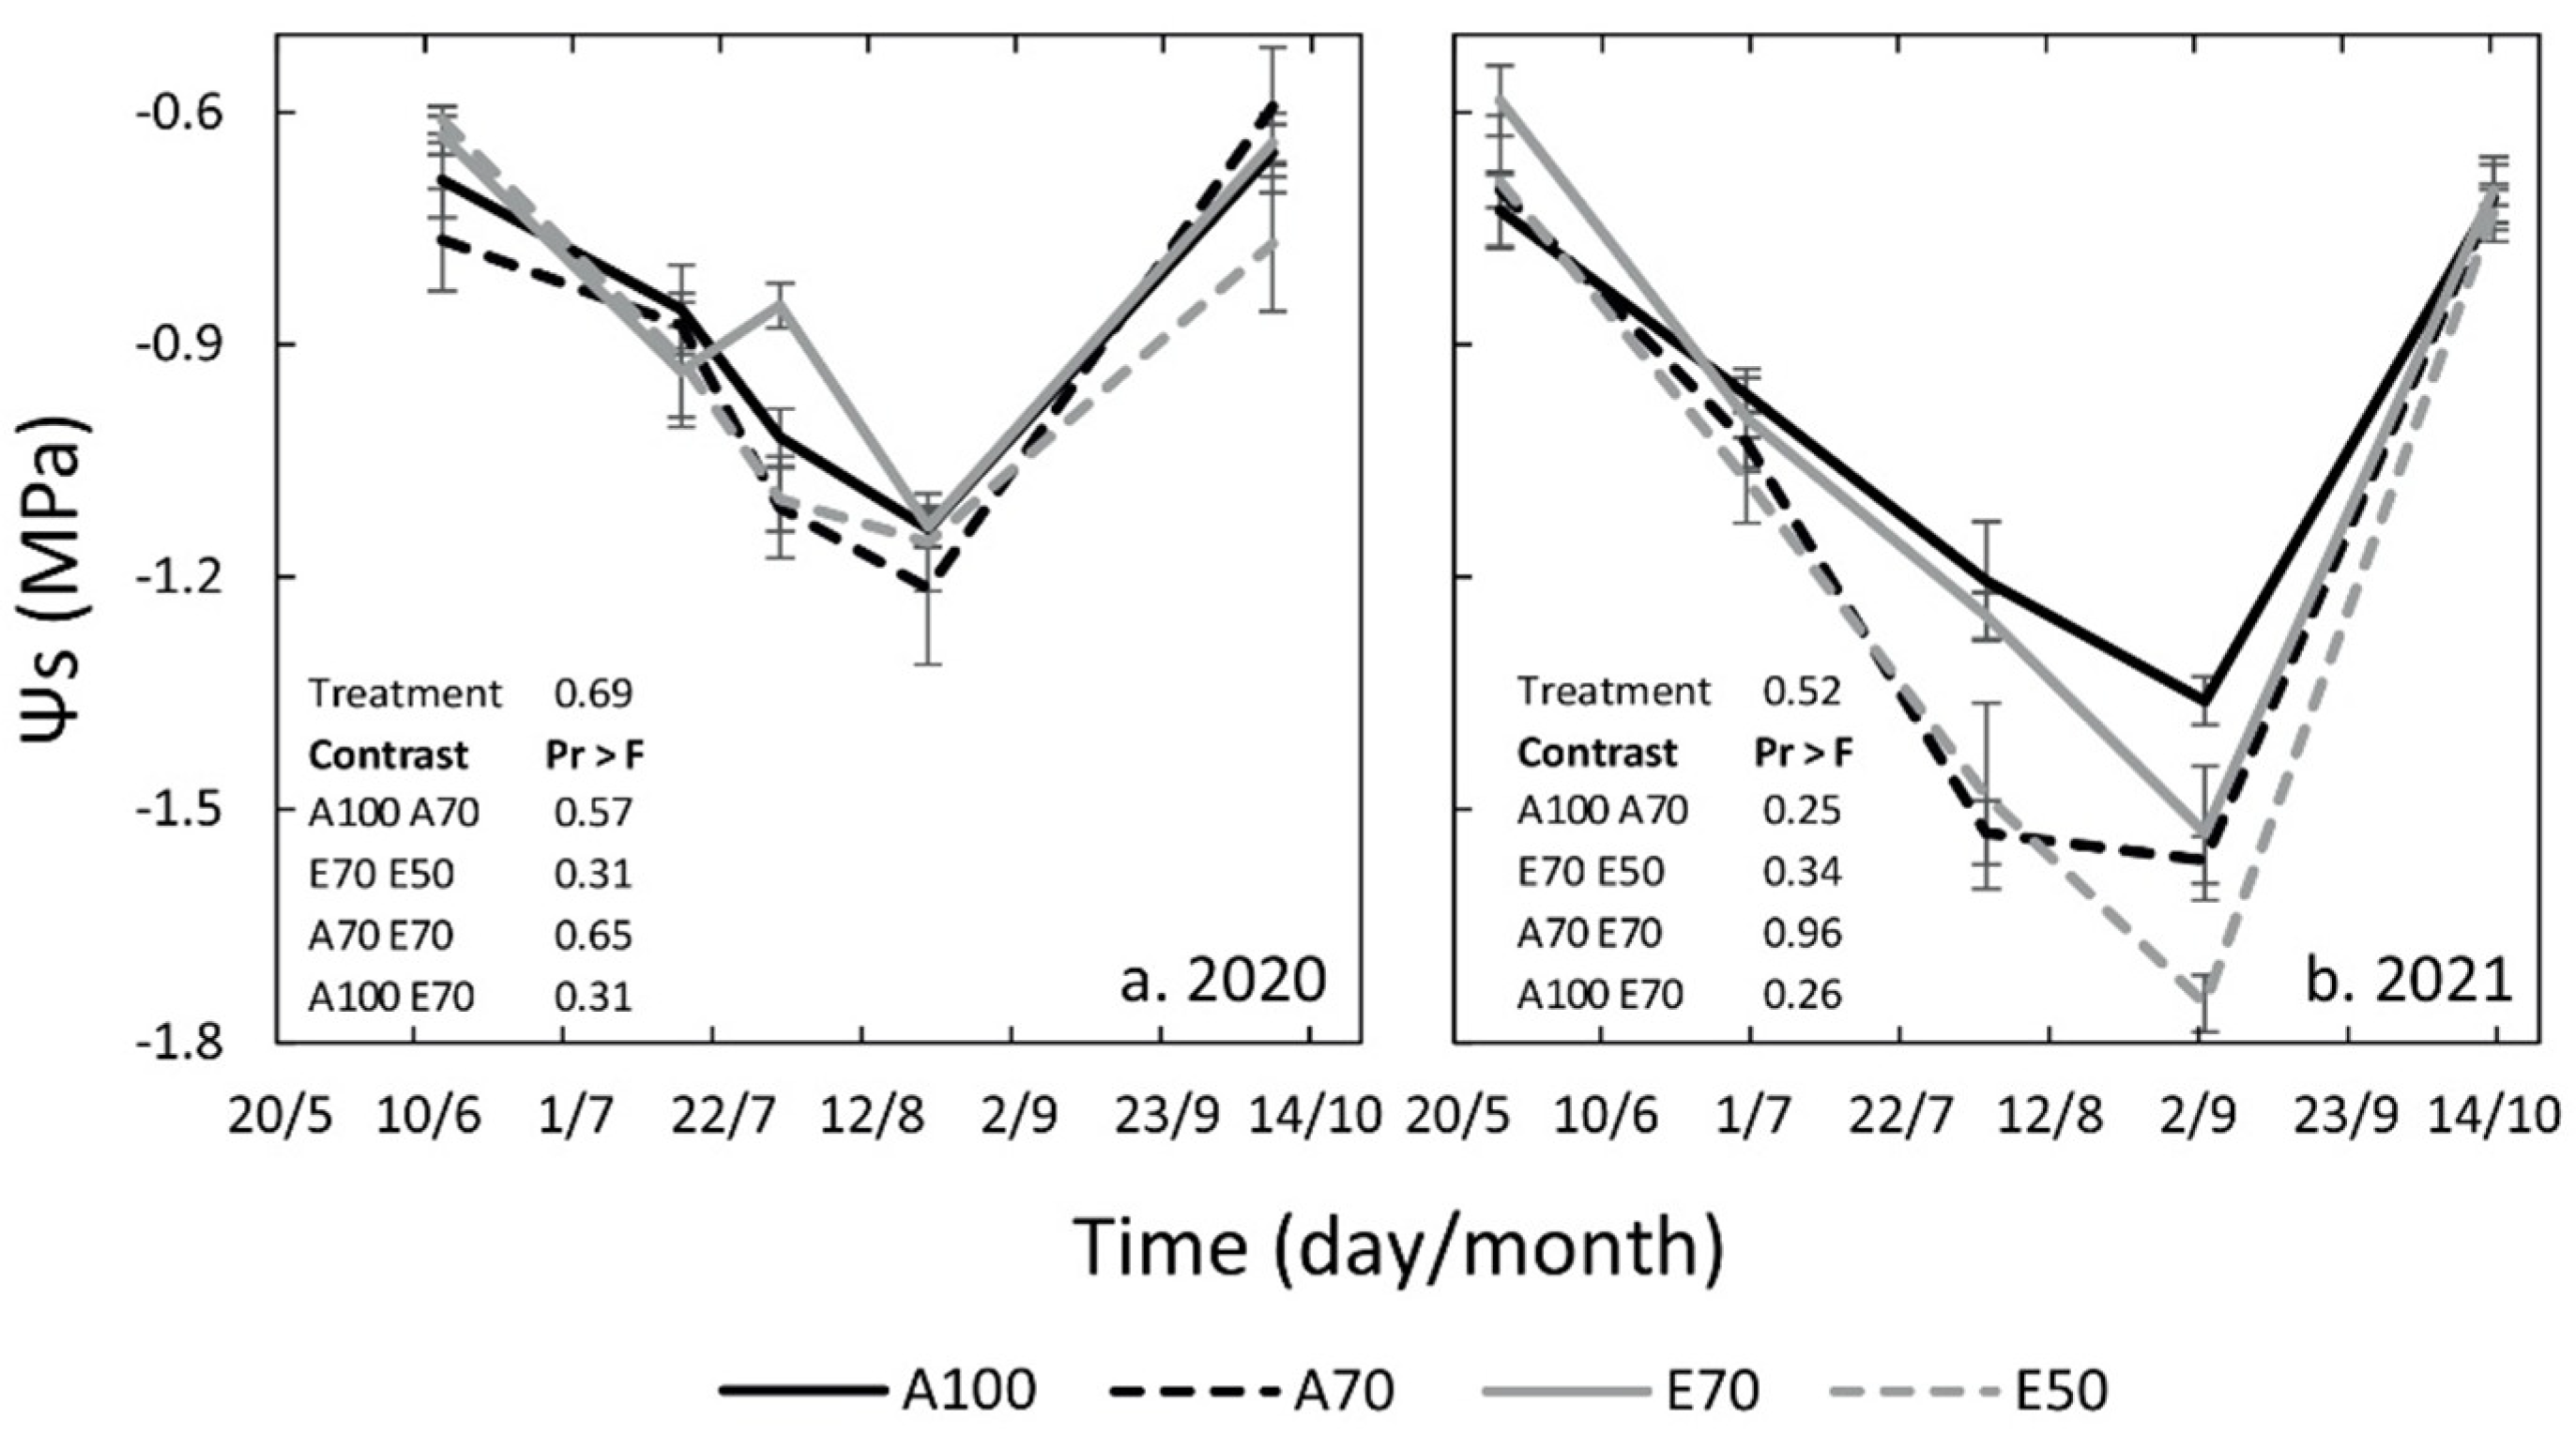
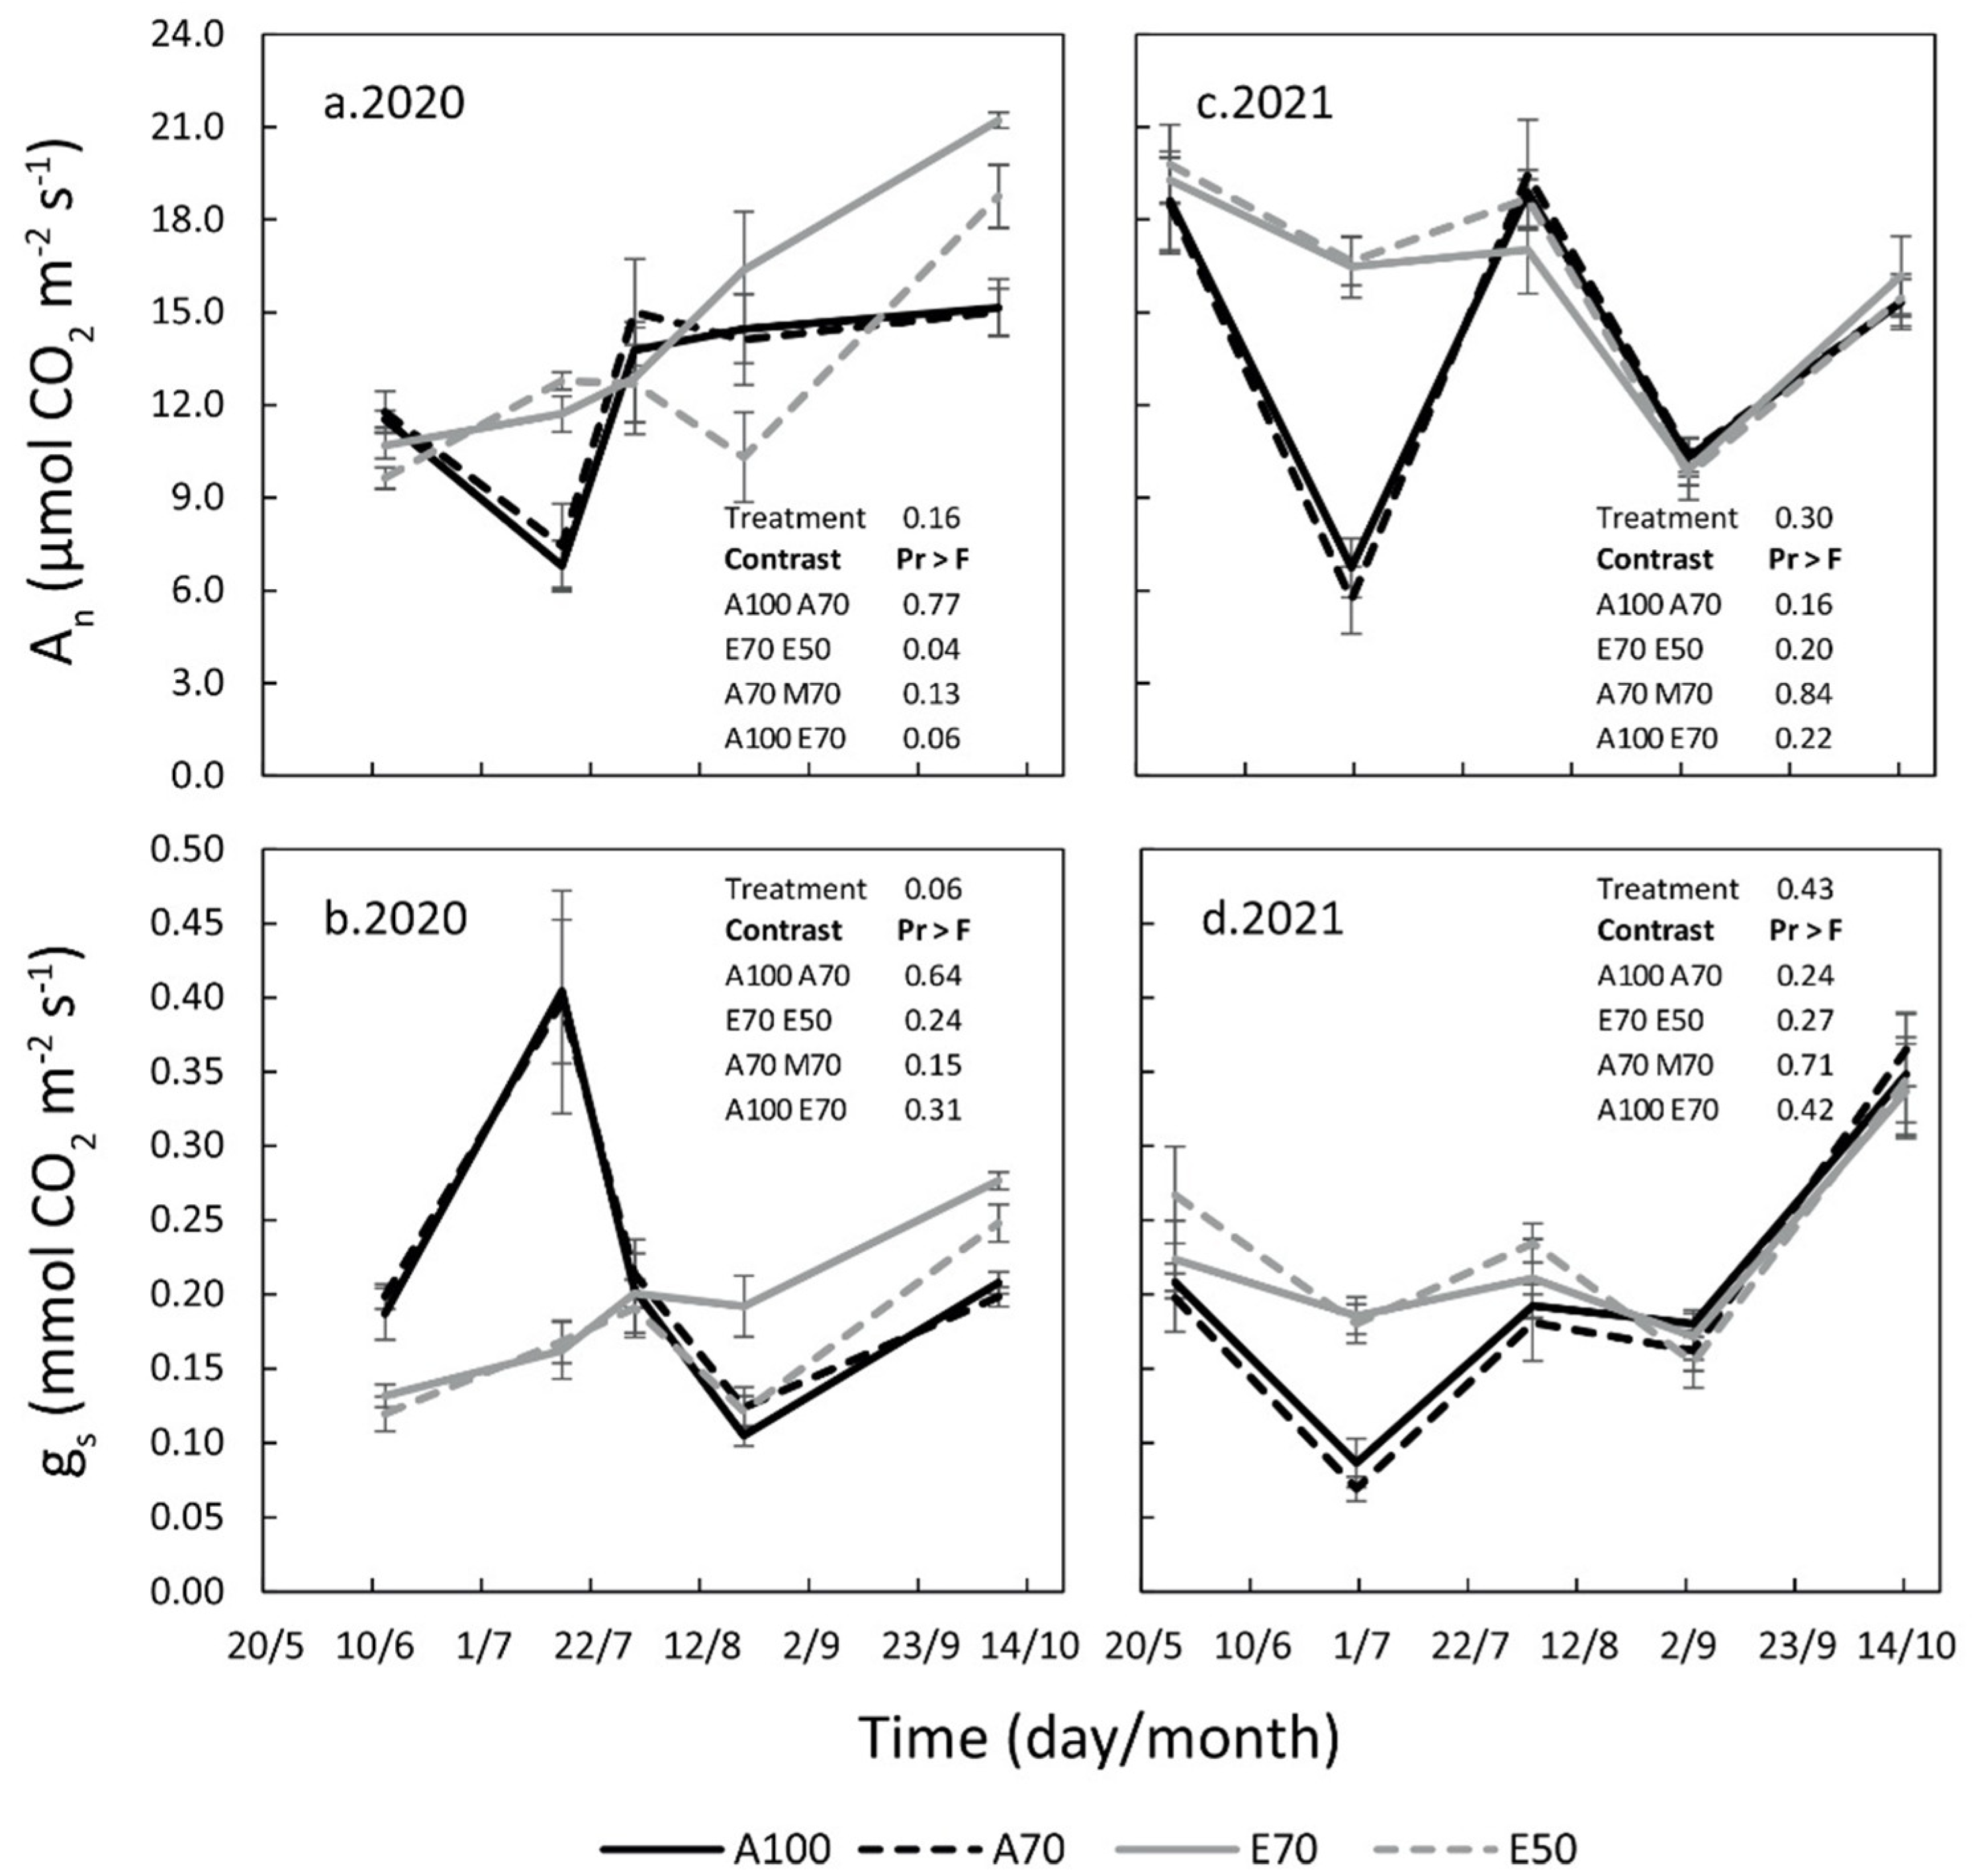
3.2. Midday Stem Water Potential and Leaf Gas Exchanges
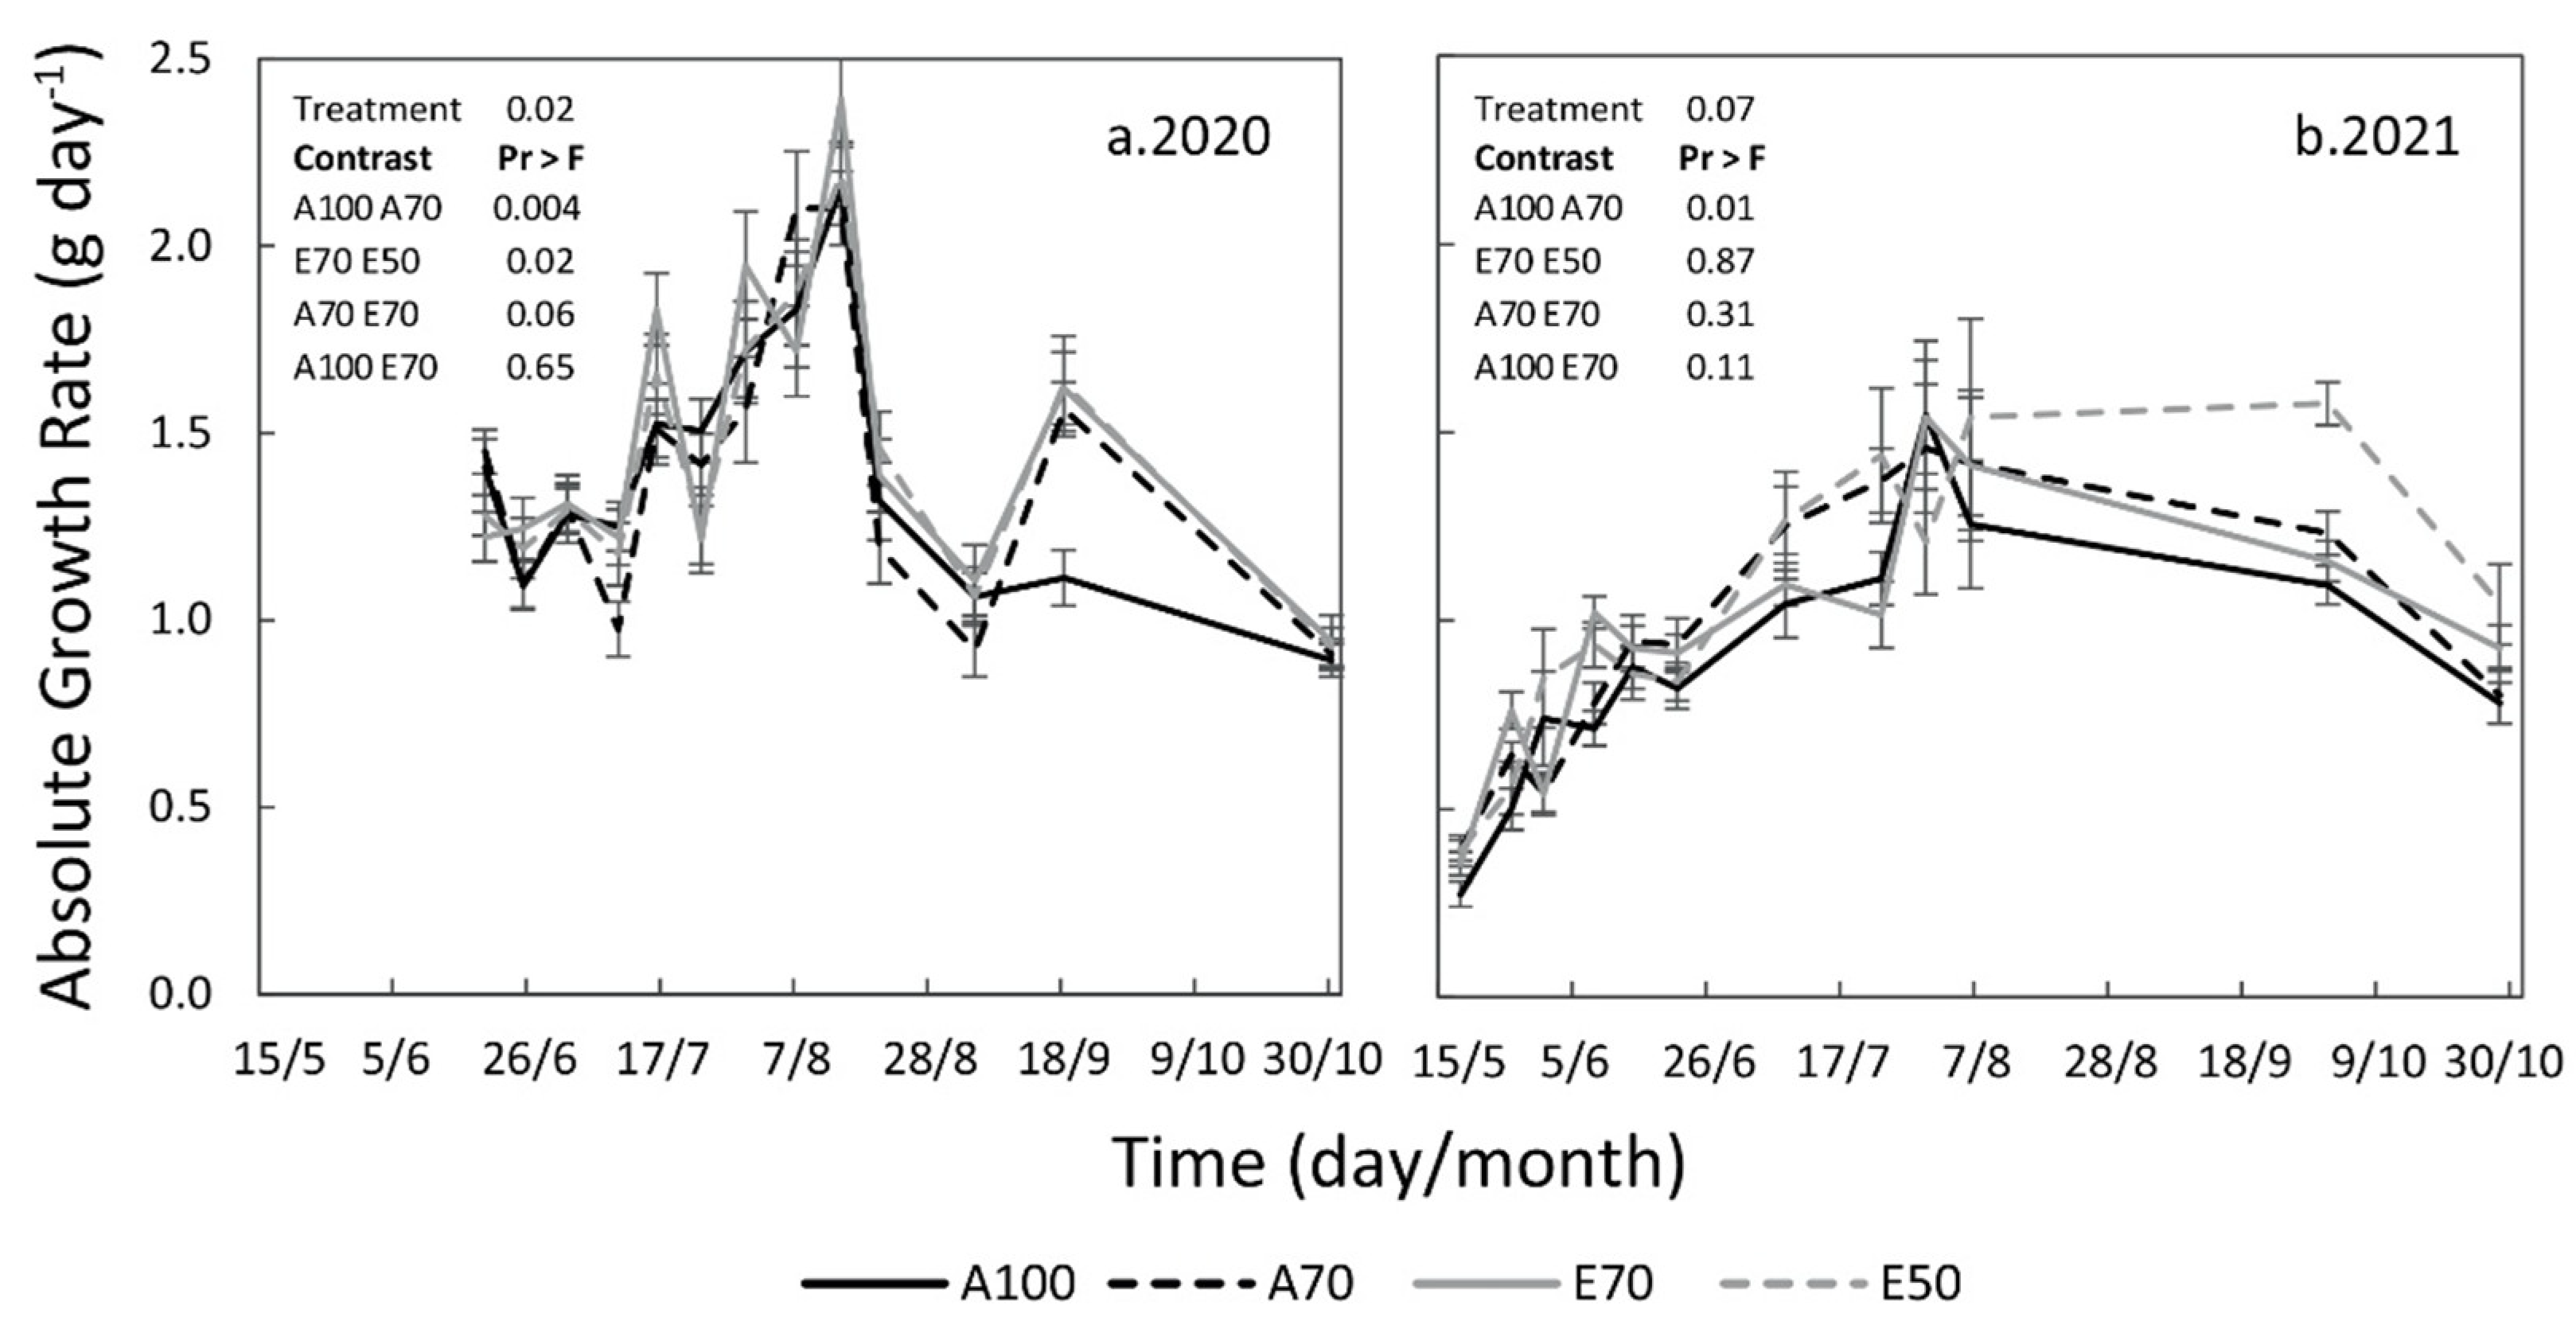
For both years, seasonal plant water status (Ψs) did not differ among treatments, thus not appearing to be influenced by shading, nor by water restrictions. Only the restricted irrigation treatments (A70 and E50) tended to reach lower values in 2021 (Figure 4b).
Similar trends could be seen for midday leaf gas exchanges (Figure 5), except between E70 and E50, in 2020 (Figure 5b).

3.3. Fruit Growth

Fruit growth reached its peak at the beginning of July in both years, although in 2020, daily AGR values were higher (around 2.5 g day−1, Figure 6a) than in 2021 (around 1.5 g day−1, Figure 6b). The effect of treatments was more pronounced in 2020, where irrigation restriction plays a bigger role, than in 2021.

3.4. Yield Determinants and Fruit Quality

In both years, late frosts reduced fruit numbers on all trees, although the reduction was more pronounced in 2020 (Table 2). Crop load was the same among treatments in 2020, whereas they were different in 2021 (Table 2), where A net had a lower number of fruit tree−1. Between the two years, 2020 had a lower crop load, more than half compared to 2021. In 2021, crop load did not significantly affect the seasonal growth of fruit (p = 0.58).
Total yield in year 2020 was not affected by net, nor by irrigation treatments, whereas higher shading in 2021 generated differences between E70 and A trees (Table 3). For marketable yield, no differences were detected in both years. The average marketable fruit weight had a similar trend in the two growing seasons: E70 appeared to have significantly larger fruit (Table 3), even in 2021, when crop load was significantly higher under the exclusion net (Table 2).
Size class distribution followed a normal distribution in both growing seasons (Figure 7), revealing no difference between the four treatments. However, 2021 had a higher presence of the lower sizes, 70–75 and 65–70 mm (Figure 7b).
Fruit quality presented similar trends between years for most of the parameters, although only some results differed significantly (Table 4). In 2020, only soluble solid content and fruit flesh firmness were influenced by both net and irrigation treatments, where E treatments gave higher values for both parameters: E50 fruit tended to be especially sweeter (nearly 1° Brix difference) and firmer (0.5 kg cm−2 higher), compared to fruit picked under the A net. Peel and visual color were different among treatments only in 2021, where lower °Hue values were found (51–58 °Hue) in fruit harvested under the E net versus those of A net (58 °Hue) (Table 4), revealing more red tones.

4. Discussion

Decreasing crop evapotranspiration coefficients is the main target for lowering irrigation volumes. Since solar energy and heat are the main drivers impacting Et0 and Etc, shading orchards with netting systems can be a first step toward sustainable fruit production. Apple orchards grown in areas that normally have peaks of above 1800 µmol m−2 s−1 PAR require protection from these excessive amounts of solar energy. As apple is known to reach the saturation point between 800 and 1200 µmol m−2 PAR [23,24], growers of areas where high sun intensities occur could consider installing shading nets in their orchards. Plant water status would not be affected, as the results show in Figure 4, where the E trees had the same Ψs, even with limited irrigation replacement and a heavier crop load (Table 2). As tree water status and light are known to influence leaf gas exchanges [5,8,25,26], there may be consequences on final production [27,28,29]. However, neither An nor gs were negatively affected by higher shading, nor by water limitations under the E netting system (Figure 5). Fruit AGR did not seem to be influenced by higher shading intensity (Figure 6); however, final production was different. In particular, marketable fruit weight was significantly higher for E70 treatment during both years (up to 10 g, Table 3), indicating a beneficial effect of less incoming light, regardless of the significantly higher crop load recorded in 2021 (Table 2). Results from previous studies [8,11,26] are in line with those reported here.
Shading and water restriction tended to be beneficial for quality parameters (Table 4). Peel and visual color values showed more red fruit for E treatments; red coloration was promoted probably because of the scattering of light in the canopy caused by the white covering materials, influencing anthocyanin synthesis [30]. SSC and fruit flesh firmness tended to be both higher for E50 fruit, the treatment that generally received less water (ca. 190 mm, during each year, Table 1). Again, such outputs are confirmed from previous studies focusing on the benefits of regulated deficit irrigation on apple [23,31,32,33] and other fruit crops [34,35,36,37].
Shading may not always be considered as a positive factor in improving fruit quality; thus, the mesh color of the covers is of paramount importance [7]. Since white and pearl nets are widely known to diffuse light [38], this scattering property may justify why E trees did not significantly differ from A trees (Figure 5), along with the same plant water status. A more homogenous light environment might have improved overall leaf efficiency, even in the less exposed parts of the canopy and even with lower water restitutions (Figure 3 and Figure 4). This hypothetical improvement led to higher final fruit weight (Table 3), with better or unaffected final fruit quality (Table 4). Applying this strategy while using netting of different color may not work and may give contrasting results.
Areas facing increases in heat waves and water limitations have been sites for previous works on apple [8,26,39]. The results all confirm that shading is a powerful solution for mitigating the consequences of climate change. High light intensities will inevitably lead to defensive plant mechanisms, such photoprotection processes [40,41], which are effective in repairing damage to the photosynthetic apparatus, although at the expense of newly synthesized carbohydrates [42,43,44], potentially to the disadvantage of the fruit. This may be another explanation for lower fruit weight under the A net (Table 3), whose trees experienced more than 1200 µmol m−2 PAR during half of each growing season (Figure 3), exceeding the saturation point [23,24].
It may be advisable to consider white exclusion netting in the set up for late ripening apple orchards in Mediterranean or hot and dry locations. Combining the right shading amount with the appropriate mesh color and related scattering property will probably lead to a more efficient and performative apple orchard, even if the variety is late ripening.

5. Conclusions

Nets shading at 40% did not alter apple tree physiological performances, even when irrigation was limited. An overall decrease of 50% water for irrigation purposes did not compromise yields nor fruit quality; on the contrary, it improved it. Apple growers could benefit from the installation of white, or pearl, exclusion netting, along with rain shelters, however, lowering scattering incoming light. This strategy should be tested on different fruit crops to understand whether the concept is applicable to a wider range of species, even with different kinds of fruit growth.

Author Contributions

Conceptualization, L.C.-G.; methodology, L.C.-G. and L.M.; validation, A.B. (Alexandra Boini), L.M., and L.C.-G.; formal analysis, A.B. (Alexandra Boini); investigation, A.B. (Alexandra Boini), G.B., G.D.P., M.V., A.B. (Alessandro Bonora), L.M., and L.C.-G.; resources, L.C.-G.; data curation, A.B. (Alexandra Boini); writing—original draft preparation, A.B. (Alexandra Boini); writing—review and editing, A.B. (Alexandra Boini), L.M., and L.C.-G.; visualization, A.B. (Alexandra Boini); supervision, A.B. (Alexandra Boini) and L.C.-G.; project administration, A.B. (Alexandra Boini) and G.B.; funding acquisition, L.C.-G. All authors have read and agreed to the published version of the manuscript.

Funding

This research was funded by the Emilia–Romagna Region POR-FESR programs 2014/2020, project S3O—Smart, Specialized, Sustainable Orchard, funding number PG/2018/629448.

Acknowledgments

The authors thank: Winet and CER (Canale Emiliano Romagnolo) for providing meteorological weather stations; Romagna impianti for the installation of the white exclusion netting system.

Conflicts of Interest

The authors declare no conflict of interest.

References

  1. Stagge, J.H.; Kingston, D.G.; Tallaksen, L.M.; Hannah, D.M. Observed drought indices show increasing divergence across Europe. Sci. Rep. 2017, 7, 14045. [Google Scholar] [CrossRef] [PubMed]
  2. Nistor, M.-M.; Satyanaga, A.; Dezsi, Ş.; Haidu, I. European Grid Dataset of Actual Evapotranspiration, Water Availability and Effective Precipitation. Atmosphere 2022, 13, 772. [Google Scholar] [CrossRef]
  3. Girona, J.; Behboudian, M.H.; Mata, M.; Del Campo, J.; Marsal, J. Effect of hail nets on the microclimate, irrigation requirements, tree growth, and fruit yield of peach orchards in Catalonia (Spain). J. Hortic. Sci. Biotechnol. 2012, 87, 545–550. [Google Scholar] [CrossRef]
  4. Boini, A.; Lopez, G.; Morandi, B.; Manfrini, L.; Corelli-Grappadelli, L. Testing the Effect of Different Light Environments and Water Shortage on Apple Physiological Parameters and Yield, Proceedings of the XI International Symposium on Integrating Canopy, Rootstock and Environmental Physiology in Orchard Systems, Bologna, Italy, 28 August 2016; Corelli Grappadelli, L., Ed.; ISHS: Leuven, Belgium, 2018; pp. 397–403. [Google Scholar] [CrossRef]
  5. Boini, A.; Bresilla, K.; Perulli, G.D.; Manfrini, L.; Corelli Grappadelli, L.; Morandi, B. Photoselective nets impact apple sap flow and fruit growth. Agric. Water Manag. 2019, 226, 105738. [Google Scholar] [CrossRef]
  6. Lopez, G.; Boini, A.; Manfrini, L.; Torres-Ruiz, J.M.; Pierpaoli, E.; Zibordi, M.; Losciale, P.; Morandi, B.; Corelli-Grappadelli, L. Effect of shading and water stress on light interception, physiology and yield of apple trees. Agric. Water Manag. 2018, 210, 140–148. [Google Scholar] [CrossRef]
  7. Brito, C.; Rodrigues, M.Â.; Pinto, L.; Gonçalves, A.; Silva, E.; Martins, S.; Rocha, L.; Pavia, I.; Arrobas, M.; Ribeiro, A.C.; et al. Grey and Black Anti-Hail Nets Ameliorated Apple (Malus × domestica Borkh. cv. Golden Delicious) Physiology under Mediterranean Climate. Plants 2021, 10, 2578. [Google Scholar] [CrossRef]
  8. Nicolás, E.; Barradas, V.; Ortuño, M.; Navarro, A.; Torrecillas, A.; Alarcón, J. Environmental and stomatal control of transpiration, canopy conductance and decoupling coefficient in young lemon trees under shading net. Environ. Exp. Bot. 2008, 63, 200–206. [Google Scholar] [CrossRef]
  9. Boini, A.; Bortolotti, G.; Perulli, G.D.; Venturi, M.; Bonora, A.; Manfrini, L.; Corelli-Grappadelli, L. Gala apple production benefits from high shading levels and water limitation, under exclusion netting. Sci. Hortic 2022, (in press). [Google Scholar]
  10. Romet, L.; Severac, G.; Warlop, F. Overview of ALT’CARPO Concept and Its Development in France, Proceedings of the 14th International Conference on Cultivation Technique and Phytopathological Problems in Organic Fruit-Growing, Hohenheim, Germany, 22–24 February 2010; Fördergemeinschaft, Ökologischer Obstbau, E.V.: Weinsberg, Germany, 2010; pp. 176–182. [Google Scholar]
  11. Sauphanor, B.; Severac, G.; Maugin, S.; Toubon, J.F.; Capowiez, Y. Exclusion netting may alter reproduction of the codling moth (Cydia pomonella) and prevent associated fruit damage to apple orchards. Agric. For. Entomol. 2012, 14, 399–407. [Google Scholar] [CrossRef]
  12. Chouinard, G.; Veilleux, J.; Pelletier, F.; Larose, M.; Philion, V.; Cormier, D. Impact of exclusion netting row covers on arthropod presence and crop damage to ‘Honeycrisp’ apple trees in North America: A five-year study. Crop Prot. 2017, 98, 248–254. [Google Scholar] [CrossRef]
  13. Candian, V.; Pansa, M.G.; Briano, R.; Peano, C.; Tedeschi, R.; Tavella, L. Exclusion nets: A promising tool to prevent Halyomorpha halys from damaging nectarines and apples in NW Italy. Bull. Insectol. 2018, 71, 21–30. [Google Scholar]
  14. Candian, V.; Pansa, M.G.; Santoro, K.; Spadaro, D.; Tavella, L.; Tedeschi, R. Photoselective exclusion netting in apple orchards: Effectiveness against pests and impact on beneficial arthropods, fungal diseases and fruit quality. Pest Manag. Sci. 2020, 76, 179–187. [Google Scholar] [CrossRef] [PubMed]
  15. Pajač Živković, I.; Kos, T.; Lemic, D.; Cvitkovic, J.; Jemric, T.; Fruk, M.; Barić, B. Exclusion nets influence on the abundance of ground beetles (Coleoptera: Carabidae) in apple orchards. Appl. Ecol. Environ. Res. 2018, 16, 3517–3528. [Google Scholar] [CrossRef]
  16. Pajač Živković, I.; Lemic, D.; Samu, F.; Kos, T.; Barić, B. Spider communities affected by exclusion nets. Appl. Ecol. Environ. Res. 2019, 17, 879–887. [Google Scholar] [CrossRef]
  17. Marshall, A.T.; Beers, E.H. Efficacy and nontarget effects of net exclusion enclosures on apple pest management. J. Econ. Entomol. 2021, 114, 1681–1689. [Google Scholar] [CrossRef] [PubMed]
  18. Marshall, A.T.; Beers, E.H. Exclusion netting affects apple arthropod communities. Biol. Control 2022, 165, 104805. [Google Scholar] [CrossRef]
  19. Dye, D.G. Spectral composition and quanta-to-energy ratio of diffuse photosynthetically active radiation under diverse cloud conditions. J. Geophys. Res. D Atmos. 2004, 109, 1–12. [Google Scholar] [CrossRef]
  20. Hargreaves, G.H.; Samani, Z.A. Reference Crop Evapotranspiration from Temperature. Appl. Eng. Agric. 1985, 1, 96–99. [Google Scholar] [CrossRef]
  21. Turner, N.C.; Long, M.J. Errors arising from rapid water loss in the measurement of leaf water potential by the pressure chamber technique. Aust. J. Plant Physiol. 1980, 7, 527–537. [Google Scholar] [CrossRef]
  22. Greenacre, M. Correspondence Analysis in Practice, 2nd ed.; Chapman and Hall/: London, UK, 2017; p. 113. [Google Scholar] [CrossRef]
  23. Cheng, L.; Fuchigami, L.H.; Breen, P.J. Light absorption and partitioning in relation to Nitrogen content in “Fuji” apple leaves. J. Am. Hort. Sci. 2000, 125, 581–587. [Google Scholar] [CrossRef] [Green Version]
  24. Cheng, L.; Fuchigami, L.H.; Breen, P.J. The relationship between photosystem II efficiency and quantum yield for CO2 assimilation is not affected by nitrogen content in apple leaves. J. Exp. Bot. 2001, 52, 1865–1872. [Google Scholar] [CrossRef]
  25. Boini, A.; Manfrini, L.; Bortolotti, G.; Corelli-Grappadelli, L.; Morandi, B. Monitoring fruit daily growth indicates the onset of mild drought stress in apple. Sci. Hortic. 2019, 256, 108520. [Google Scholar] [CrossRef]
  26. Boini, A.; Manfrini, L.; Morandi, B.; Corelli Grappadelli, L.; Predieri, S.; Daniele, G.M.; López, G. High Levels of Shading as A Sustainable Application for Mitigating Drought, in Modern Apple Production. Agronomy 2021, 11, 422. [Google Scholar] [CrossRef]
  27. Giuliani, R.; Magnanini, E.; Corelli Grappadelli, L. Whole canopy gas exchanges and light interception of three peach training systems. Acta Hortic. 1998, 465, 309–318. [Google Scholar] [CrossRef]
  28. Rosati, A.; DeJong, T.M. Estimating photosynthetic radiation use efficiency using incident light and photosynthesis of individual leaves. Ann. Bot. 2003, 91, 869–877. [Google Scholar] [CrossRef]
  29. Naor, A.; Girona, J. Apple. In Crop Yield Response to Water, FAO Irrigation and Drainage Paper 66; Steduto, P., Hsiao, T.C., Eds.; Food and Agriculture Organization of the United Nations: Rome, Italy, 2012; pp. 332–345. [Google Scholar]
  30. Serra, S.; Borghi, S.; Mupambi, G.; Camargo-Alvarez, H.; Layne, D.; Schmidt, T.; Kalcsits, L.; Musacchi, S. Photoselective Protective Netting Improves “Honeycrisp” Fruit Quality. Plants 2020, 9, 1708. [Google Scholar] [CrossRef]
  31. Leib, B.G.; Caspari, H.W.; Redulla, C.A.; Andrews, P.K.; Jabro, J.J. Partial root zone drying and deficit irrigation on ‘Fuji’ apples in semi-arid climate. Irrig. Sci. 2006, 24, 85–99. [Google Scholar] [CrossRef]
  32. Atay, E.; Hucbourg, B.; Drevet, A.; Lauri, P.E. Investigating effects of over-irrigation and deficit irrigation on yield and fruit quality in pink ladytm “rosy glow” apple. Acta Sci. Pol. Hortorum Cultus 2017, 16, 45–51. [Google Scholar] [CrossRef]
  33. Mpelasoka, B.S.; Behboudian, M.H.; Mills, T.M. Effects of deficit irrigation on fruit maturity and quality of ‘Braeburn’ apple. Sci. Hortic. 2001, 90, 279–290. [Google Scholar] [CrossRef]
  34. Venturi, M.; Manfrini, L.; Perulli, G.D.; Boini, A.; Bresilla, K.; Corelli Grappadelli, L.; Morandi, B. Deficit Irrigation as a Tool to Optimize Fruit Quality in Abbé Fetél Pear. Agronomy 2021, 11, 1141. [Google Scholar] [CrossRef]
  35. Lopez, G.; Behboudian, M.H.; Vallverdu, X.; Mata, M.; Girona, J.; Marsal, J. Mitigation of severe water stress by fruit thinning in ‘O’Henry’ peach: Implications for fruit quality. Sci. Hortic. 2010, 125, 294–300. [Google Scholar] [CrossRef]
  36. Naor, A.; Peres, M.; Greenblat, Y.; Gal, Y.; Ben Arie, R. Effects of pre-harvest irrigation regime and crop level on yield, fruit size distribution and fruit quality of field-grown ‘Black Amber’ Japanese plum. J. Hortic. Sci. Biotechnol. 2004, 79, 281–288. [Google Scholar] [CrossRef]
  37. Ramos, D.E.; Weinbaum, S.A.; Shackel, K.A.; Schwankle, L.J.; Mitcham, E.J.; Mitchell, F.G.; Snyder, R.G.; Mayer, G.; McGourt, G. Influence of Tree Water Status and Canopy Position on Fruit Size and Quality of Bartlett Pears, Proceedings of the VI International Symposium on Pear Growing, Medford, OR, USA, 12 July 1993; Sugar, D., Ed.; ISHS: Leuven, Belgium, 1994; pp. 192–200. [Google Scholar] [CrossRef]
  38. Shahak, Y. Photo-Selective Netting for Improved Performance of Horticultural Crops. A Review of Ornamental and Vegetable Studies Carried Out in Israel, Proceedings of the XXVII International Horticultural Congress-IHC2006: International Symposium on Cultivation and Utilization of Asian, Sub-Tropical, and Underutilized Horticultural Crops, Seoul, Korea, 13 August 2006; Oh, D.-G., Ed.; ISHS: Leuven, Belgium, 2008; pp. 161–168. [Google Scholar] [CrossRef]
  39. Kalcsits, L.; Musacchi, S.; Layne, D.R.; Schmidt, T.; Mupambi, G.; Serra, S.; Mendoza, M.; Asteggiano, L.; Jarolmasjed, S.; Sankaran, S.; et al. Above and below-ground environmental changes associated with the use of photoselective protective netting to reduce sunburn to apple. Agr. Forest Meteor. 2017, 237, 9–17. [Google Scholar] [CrossRef]
  40. Demmig-Adams, B.; Adams, W.W., III. Photoprotection and other responses of plants to high light stress. Annu. Rev. Plant Physiol. Plant Mol. Biol. 1992, 43, 599–626. [Google Scholar] [CrossRef]
  41. Ruban, A.V. Nonphotochemical chlorophyll fluorescence quenching: Mechanism and effectiveness in protecting plants from photodamage. Plant Physiol. 2016, 170, 1903–1916. [Google Scholar] [CrossRef]
  42. Foyer, C.H.; Harbison, J. Oxygen metabolism and the regulation of photosynthetic electron transport. In Causes of Photooxidative Stress and Amelioration of Defense Systems in Plants, 1st ed.; Foyer, C., Mullineux, C.W., Eds.; CRC Press: Boca Raton, FL, USA, 1994; pp. 1–42. [Google Scholar]
  43. Murata, N.; Nishiyama, Y. ATP is a driving force in the repair of photosystem II during photoinhibition. Plant Cell Environ. 2018, 41, 285–299. [Google Scholar] [CrossRef]
  44. Raven, J.A. The cost of photoinhibition. Physiol. Plant. 2011, 142, 87–104. [Google Scholar] [CrossRef]
Figure 1. Simplified field trial map. Trees not in trial received 100% Et0.
Horticulturae 08 00884 g001
Figure 2. Seasonal patterns of external reference evapotranspiration and accumulated rainfall from the end of May until mid-October for 2020 and 2021 seasons. Midday physiological measurements dates are represented by black (2020) and white (2021) stars.
Horticulturae 08 00884 g002
Figure 3. Seasonal patterns of PAR detected between 9:00 and 18:00 h of the outside reference and of the two net treatments, with average daily values. Different letters represent significant differences at p < 0.05, from the end of May until mid-October, for 2020 (a) and 2021 seasons (b). Percentages reflect the level of shading in the various environments. Stars represent the dates of midday physiological measurements.
Horticulturae 08 00884 g003
Figure 4. Seasonal patterns of midday stem water potential throughout 2020 (a) and 2021 (b), for each treatment, represented by the mean value of four trees. Vertical bars represent standard error values. For each year, the effect of the treatment and linear contrast F values are shown and refer to the mean midday seasonal value of Ψs; values below 0.05 are considered significant.
Horticulturae 08 00884 g004
Figure 5. Seasonal patterns of midday leaf photosynthesis and stomatal conductance, throughout 2020 (a,b) and 2021 (c,d), for each treatment, represented by the mean value of four trees. Vertical bars represent standard error values. For each year, the effect of the treatment and linear contrast F values are shown and refer to the mean midday seasonal value of An or gs; values below 0.05 are considered significant.
Horticulturae 08 00884 g005
Figure 6. Seasonal patterns of fruit absolute growth rate throughout 2020 (a) and 2021 (b), for each treatment. Vertical bars represent standard error values. For each year, the effect of the treatment and linear contrast F values are shown and refer to the mean seasonal value of AGR; values below 0.05 are considered significant.
Horticulturae 08 00884 g006
Figure 7. Size class distribution values for each irrigation treatment of fruit diameters ranging from <65 to >85 mm, in years 2020 (a) and 2021 (b). The absence of letters indicates the absence of differences between treatments.
Horticulturae 08 00884 g007
Table 1. Total irrigation for each year, for each irrigation treatment.
Total Accumulated Irrigation (mm)
Net TreatmentsIrrigation Treatments20202021
Anti-hail netA100358100%389100%
A7028278.7%27270.0%
Exclusion netE7028278.7%27270.0%
E5018551.7%19550.2%
Table 2. Crop load determined at harvest (quantity of fruit per tree). Each value represents the average (+SE) of six and nine trees in 2020 and 2021, respectively. Different letters indicate significant difference at p < 0.05.
Crop Load (Fruit Tree−1)
Irrigation Treatments2020±SE2021±SE
A100379 a957 a
A70549 a897 a
E70598 a13410 b
E504010 a1358 b
Table 3. Total and marketable yields and average marketable fruit weight, measured at harvest, during years 2020 and 2021, followed by standard error and letters, indicating statistical significance at 95% when different, according to a SNK test. For 2021 results, * indicates significantly different crop load among treatments; thus, each value is the LS means of an ANCOVA (mean of nine trees). In the lower part of the table, treatment, crop load and linear contrast F values for each year are shown; values below 0.05 are considered significant. Linear contrasts are not reported where crop load significantly impacted harvest parameters.
Total Yield (kg Tree−1)Marketable Yield (kg Tree−1)Average Marketable Fruit Weight (g Fruit−1)
Treatments2020±SE 2021±SE*2020±SE 2021±SE*2020±SE 2021±SE*
A1006.751.62a18.630.51b6.721.62a16.620.74a1851.93b1681.73b
A709.891.52a18.810.54b9.701.51a16.870.78a1851.72b1642.15b
E707.281.58a20.900.52a7.131.59a17.130.75a1942.27a1761.22a
E507.281.57a19.650.52ab7.091.50a17.510.76a1912.29ab1661.28b
Treatment0.50450.020.52090.0580.0045<0.0001
Crop load-<0.0001-<0.0001-<0.0001
L. contrastsPr > FPr > FPr > FPr > FPr > FPr > F
A100 A700.17-0.19-0.047-
E70 E501.00-0.97-0.003-
A70 E700.26-0.25-0.049-
A100 E700.82-0.87-0.85-
Table 4. Fruit quality traits, during 2020 and 2021, followed by standard error and letters, indicating statistical significance at 95% when different, according to a SNK test. In the lower part of the table, linear contrast F values for each year are shown; values below 0.05 are considered significant.
Peel Color (°Hue)Visual Color (%)
Treatments2020±SE 2021±SE 2020±SE 2021±SE
A10057.71.8a50.91.5ab602a742b
A7057.62.3a54.31.6a613a731b
E7052.11.6a45.81.9b622a791a
E5051.11.6a46.51.8b651a742b
Treatment0.0160.00090.230.01
L. contrastsPr > FPr > FPr > FPr > F
A100 A700.950.070.870.97
E70 E500.710.00040.190.0034
A70 E700.0160.00120.090.61
A100 E700.0140.140.060.63
Soluble solid content (°Brix)Firmness (kg cm−2)
Treatments2020±SE 2021±SE 2020±SE 2021±SE
A10014.140.09c13.620.07a8.760.09b8.190.07A
A7014.310.12bc13.740.08a8.790.07b8.310.09a
E7014.570.12b13.660.08a9.090.13ab8.510.09a
E5015.080.10a14.640.10a9.260.12a9.500.07a
Treatment<0.00010.50.00160.15
L. contrastsPr > FPr > FPr > FPr > F
A100 A700.250.540.880.03
E70 E500.0010.540.260.74
A70 E70<0.00010.130.00170.06
A100 E70<0.00010.370.00110.85
Publisher’s Note: MDPI stays neutral with regard to jurisdictional claims in published maps and institutional affiliations.

