3.1. Effect of Storage Temperature on TSS, pH, Firmness, and Moisture Content
The means comparison of all the physicochemical properties of pineapples, including TSS, pH, firmness, and moisture content, on the storage days for the different pineapple varieties was analysed using Tukey’s test. The values that are represented by different letters within the same column show significant differences between the storage days at different storage temperatures for all physicochemical properties of the fruit. Considering the fact that pineapple is a non-climacteric fruit, the quality changes in the fruit vary and are not uniform. Generally, different pineapple varieties have different unique traits and characteristics. For this reason, pineapples are evaluated based on the physicochemical attributes of different varieties with acceptable flavour and morphological characteristics.
Table 1 shows the changes in TSS values of three different pineapple varieties during 21 days of storage. Based on the results, the TSS values of pineapple varieties (MD2, Josapine, and Morris) ranged from 3.60 to 16.60%. The range of TSS values was significantly higher than those reported by Dolhaji et al. [
7], which ranged from 8.8 to 16.0%, due to the conversion of starch to sugar during the softening process of the fruit. From this current study, Josapine had the highest TSS values on Day 14 (25 °C), which obtained a range of 9.40 to 16.60%. In contrast, MD2 recorded TSS values ranging from 9.40 to 15.60%, followed by Morris (3.60–10.10%), respectively.
It was demonstrated that the TSS values show overlapping between Day 0 and Day 7, whereas a significant difference was found between Day 14 and Day 21 for all pineapple varieties. The trend of TSS values increased gradually from Day 0 until Day 14 and showed a decrease at the end of storage (Day 21) for MD2, Josapine, and Morris, respectively. It was observed that a storage temperature of 25 °C had the highest TSS value compared with the pineapples stored at 5 and 10 °C, except for the Morris variety. The increase in TSS during postharvest storage was related to the storage time as well as the respiration process in the fruits [
23,
24]. The highest TSS values among all storage temperatures were achieved at 25 °C for Josapine (16.60%) and MD2 (15.60%), whereas Morris recorded TSS values of 10.10% at 25 °C. In addition, it can be seen that the TSS values of pineapples were affected by storage temperature and time. Nevertheless, the storage time at which the changes took place varied in terms of storage temperature depending on the chemical and biochemical properties present in pineapple during storage. Monitoring the storage temperature is essential to ensure the optimum conditions for minimising fruit damage and extending the shelf life of the fruit.
The pH values of three different pineapple varieties (MD2, Josapine, and Morris) during storage ranged from 2.40 to 4.10 (
Table 1). These results were significantly lower than those reported by Siti Rashima et al. [
25] who obtained pH values of pineapples ranging from 3.70 to 4.30, which might have been affected by microbial activities during storage. In addition, Padrón-Mederos et al. [
4] found that the pH values decreased considerably during 10 days of storage. Based on the results, all pineapple varieties had the highest pH values recorded on Day 0 (25 °C), which was 4.10 for Josapine, followed by Morris (3.60) and MD2 (3.30), respectively. The pH values of pineapples declined with fruit maturity, in the acidic range of 3.3 to 3.8, which was in line with the presented findings in [
26]. Moreover, it can be observed that storage at a temperature of 5 °C had the lowest pH values compared with the pineapples stored at 10 and 25 °C for the varieties MD2 and Josapine, whereas for the variety Morris, the lowest pH values were obtained at 10 °C. For the storage temperature of 5 °C, the fruit was susceptible to chilling injury which could lead to deterioration of the fruit quality. A gradual decrease in pH values during storage from Day 0 to Day 21 was observed for all pineapple varieties at different storage temperatures. As a result, lower pH values were found at the end of the storage day, which indicated the spoilage of the fruit during the storage period. A similar trend was obtained for all storage temperatures, which is mainly associated with the respiratory metabolic activity of the fruits [
27].
The firmness values of three different pineapple varieties (MD2, Josapine, and Morris) during storage ranged from 0.33 to 2.92 N (
Table 2). Padrón-Mederos et al. [
4] observed a gradual decline in the textural properties of pineapples in cold storage which could be linked to pectin degradation. These results were in accordance with Siow and Lee [
28], who reported the firmness values of pineapples ranging from 0.20 to 3.50 N. Based on the results, Morris had the highest firmness values on Day 0 (10 °C), which was 2.92 N. Among all the pineapple varieties, Morris recorded huge drops in terms of firmness values, especially at 25 °C compared with 5 and 10 °C. In a similar manner, a gradual decrease in firmness values was detected from Day 0 to Day 21, which could imply that the textural characteristics of the fruit decreased as the storage days increased. Similarly, the decrease in the firmness of pineapples was reported along the maturity process in such a way that fruit growth contributed to the accumulation of water content [
12]. This consequence occurred due to the fact that the texture development of the pineapples changed accordingly with the maturation pattern of the fruit after harvest [
29]. The changes in textural properties indicated the corresponding variation in the internal quality attributes of the fruit along with the ripening process. In the current study, the higher firmness values could be an indicator of fruit immaturity at harvest. Mature pineapple will ripen properly with a pleasant flavour and taste, but fruit harvested at the immature stages does not ripen properly and results in poor quality. The composition of pineapple flesh might also vary between different varieties of the fruit. In addition, the harvest maturity and time, fruit variety, and environmental conditions also influence the quality [
30]. Thus, the evaluation of quality attributes of different pineapple varieties is vital to ensure the fruit is within an acceptable quality range.
The moisture content values of three different pineapple varieties (MD2, Josapine, and Morris) during three weeks of storage ranged from 68.87 to 95.26% (
Table 2). The results obtained were comparable with the data reported by Padrón-Mederos et al. [
4] using the Red Spanish variety of pineapple, with moisture content ranging from 84 to 89%. Based on the findings, Josapine had the highest moisture content values on Day 21 (25 °C), which was 95.26%. On the other hand, Morris recorded content values ranging from 68.87 to 92.85%, followed by MD2 (84.93–91.27%), respectively. The results also demonstrated the variation in terms of moisture content for all pineapple varieties, with the exception of Morris stored at 5 °C in which a slight drop was obtained on Day 21 (90.39%). The high moisture content in pineapples in cold storage strongly implies that the fruit might be prone to microbial spoilage arising from the growth of microorganisms [
31]. Thus, it may be inferred that the moisture content of the pineapple varieties was hugely influenced by the storage treatment, which could be an important factor to extend the shelf life and storage of the fruit. It can be noted that despite the fact that no sensory analysis was conducted, the fruits were still edible for up to 21 days when stored at the optimum storage temperature.
3.2. Effect of Storage Temperature on Colour Parameters
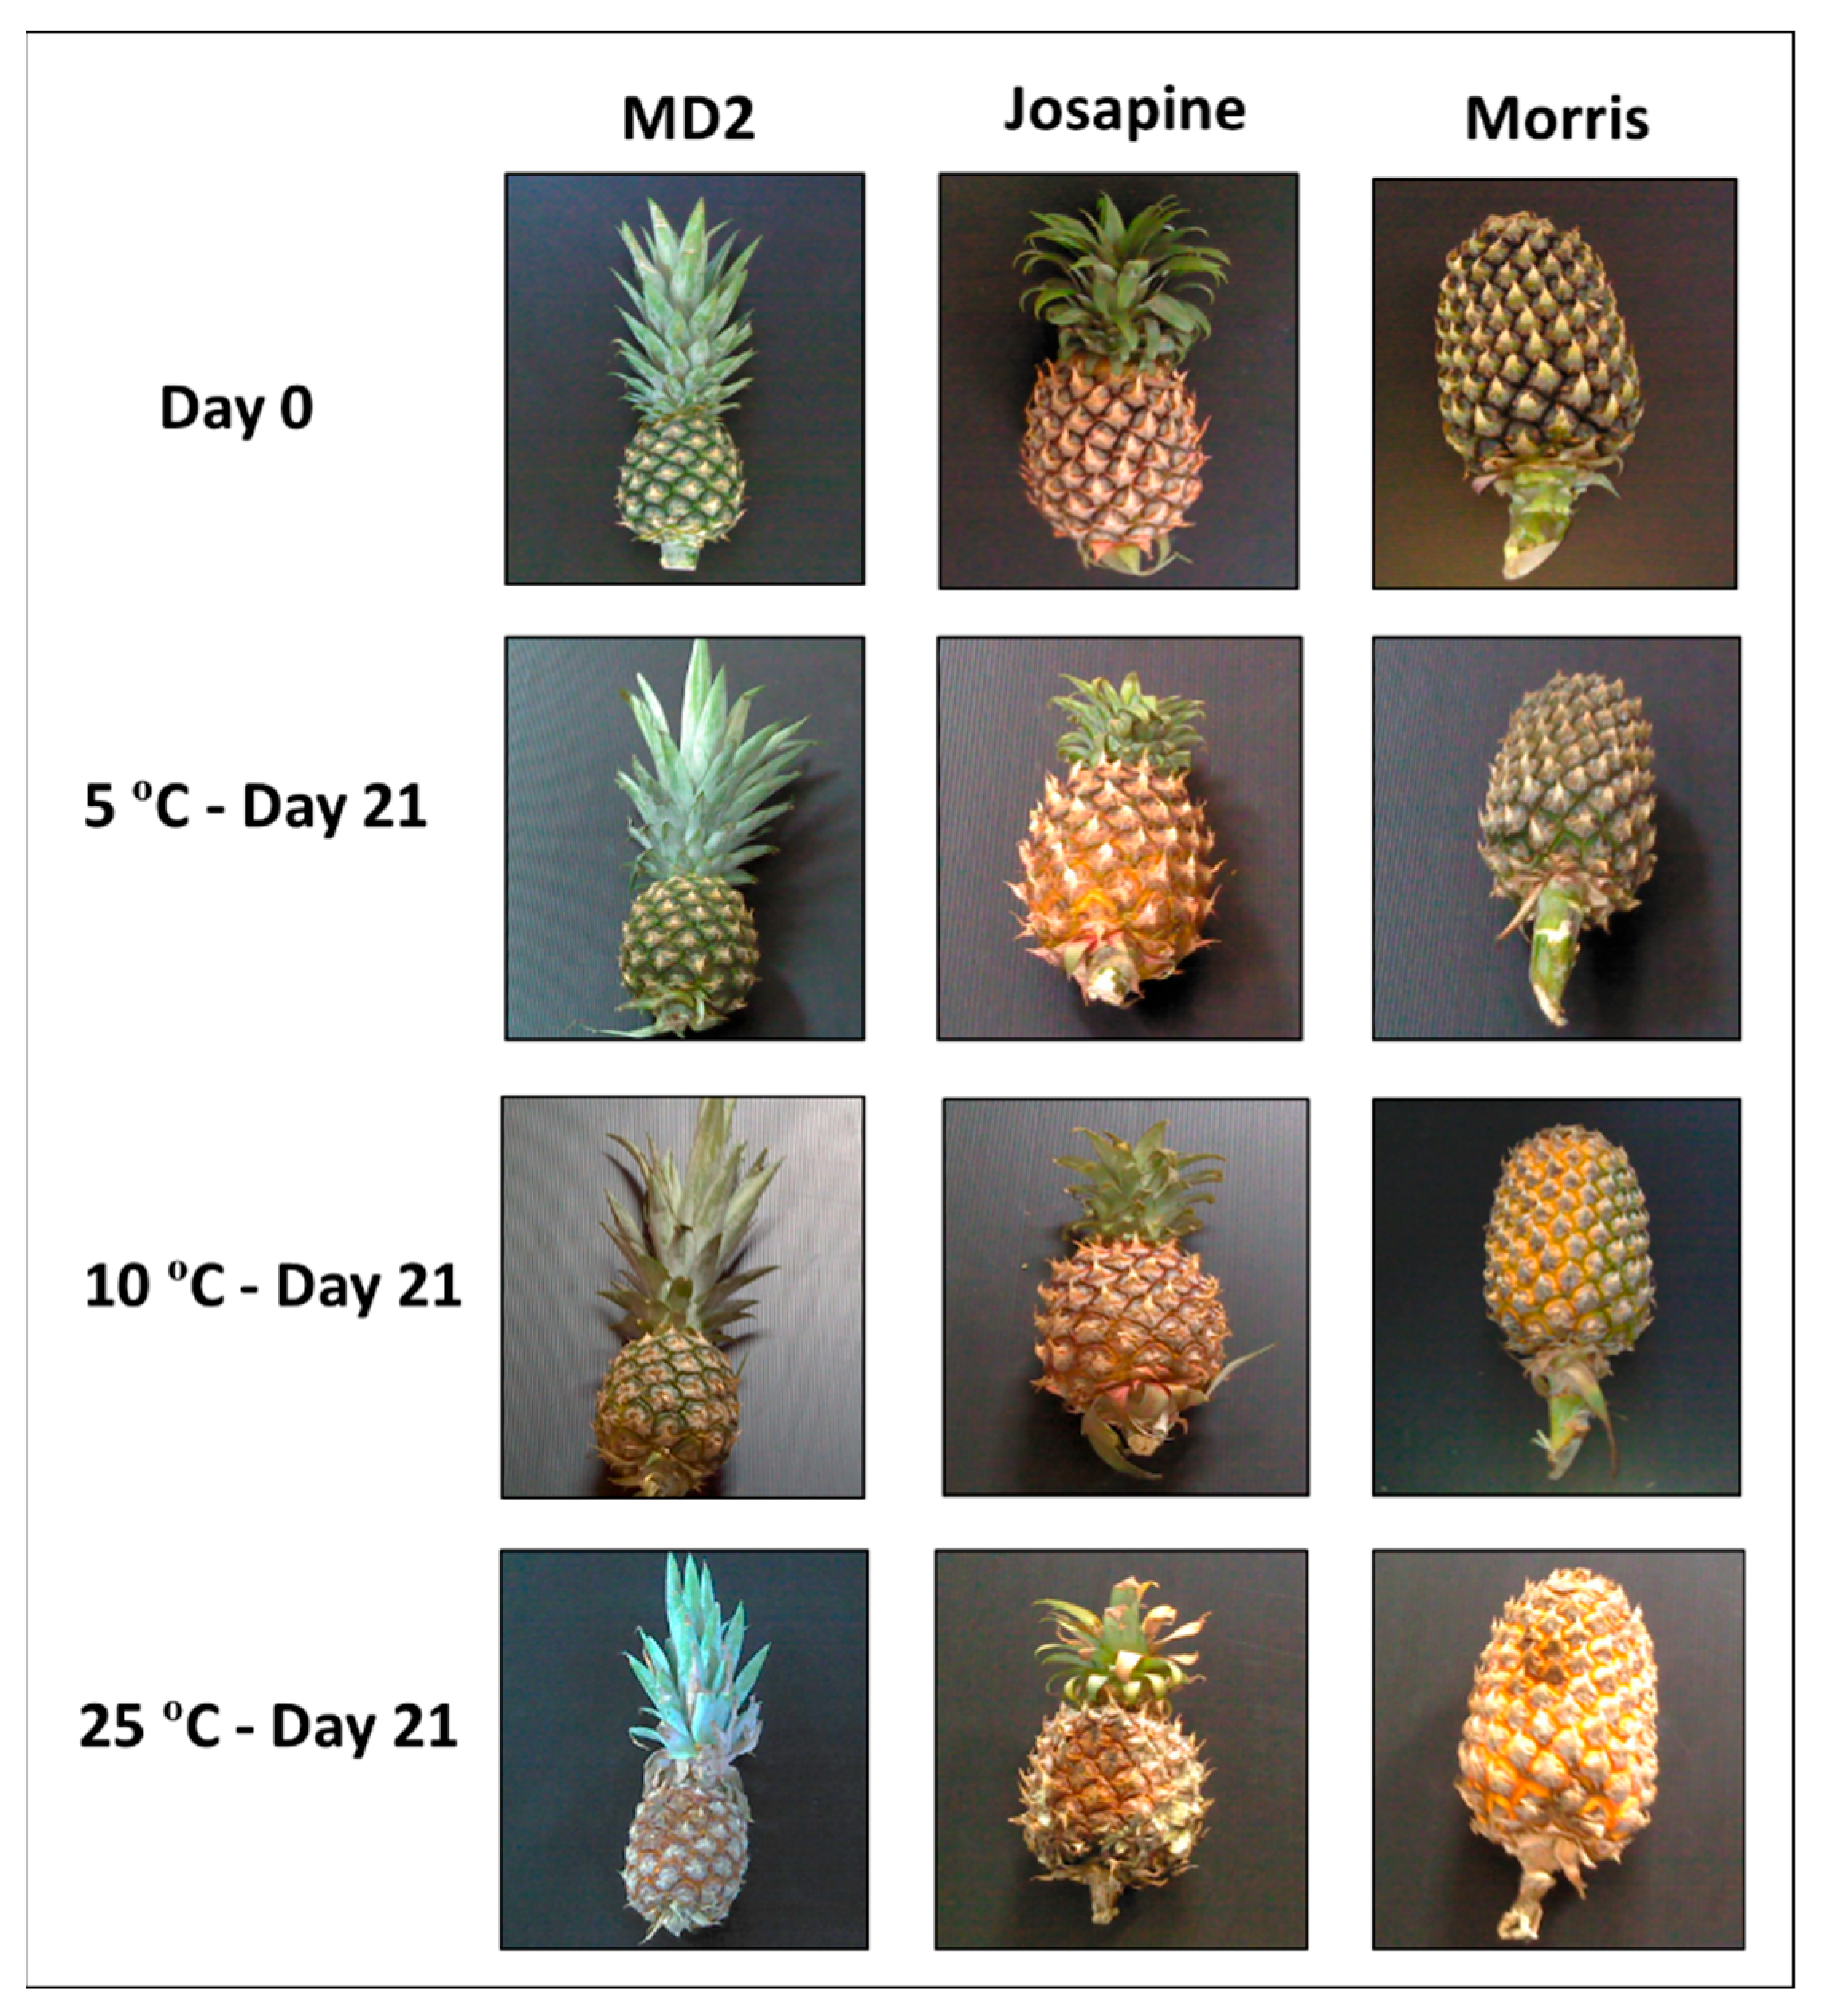
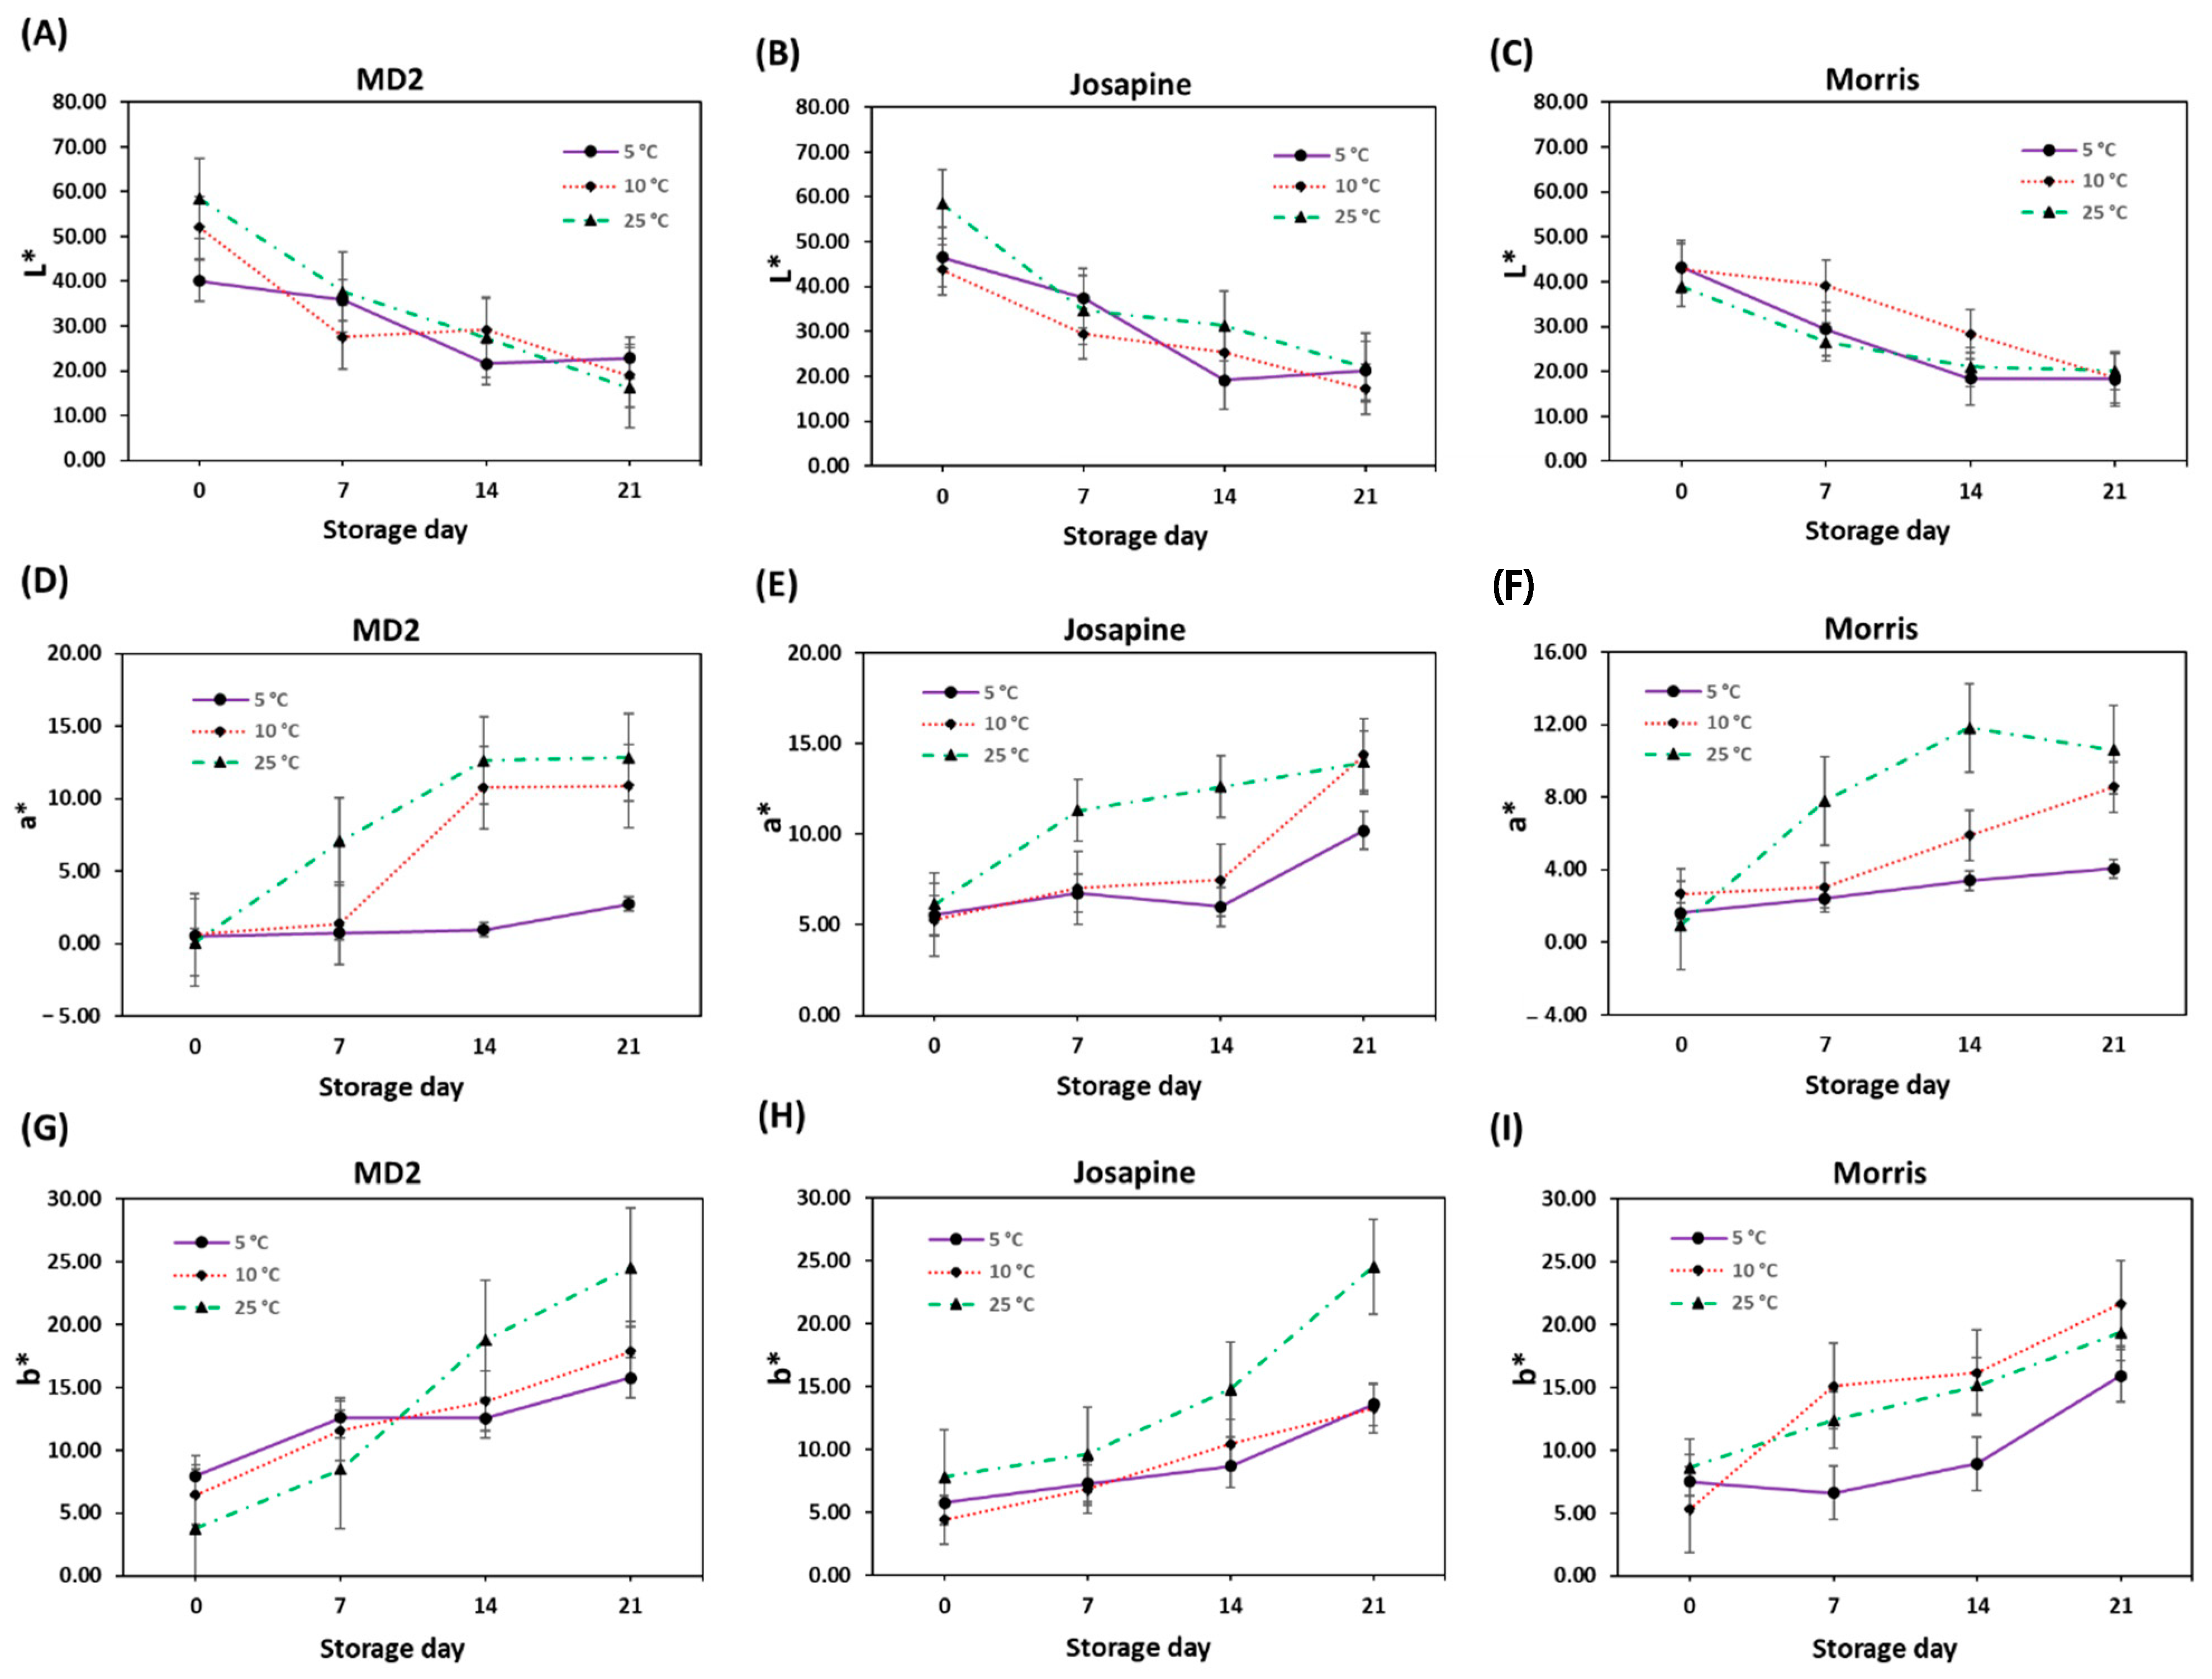
Colour changes in pineapple varieties at different storage temperatures are shown in
Figure 2. In terms of colour changes, the a* and b* values increased significantly, whereas the L* values decreased during storage for all storage temperatures. The flesh colour of pineapple is one of the main indicators for evaluating the freshness of the fruit based on the preference of the consumer. The chemical reaction in perishable fruit occurred during postharvest storage, which leads to variation in colour changes caused by chlorophyll breakdown and fruit pigments [
32]. Based on the findings, it was demonstrated that Josapine and MD2 obtained the highest and similar L* values of 58.39 at 25 °C, followed by Morris (43.28) at 5 °C, respectively. A significant reduction (
p < 0.05) in the L* values over the storage days was observed for all pineapple varieties at different storage temperatures. The differences in the lightness of the flesh colour noticeably denoted that different pineapple varieties possessed distinct characteristics and quality attributes. These findings were in agreement with those for pineapples stored for one week, with L* values that varied from 33.68 to 56.46 and an upward trend for each maturity index [
26]. Temperature and storage time were vital in controlling the colour degradation of pineapples during the storage period with respect to the textural properties of the fruit [
33,
34].
Notably, the increase in a* values was also affected by the fruit softening during storage. Based on the findings, it was revealed that Josapine obtained a* values of 5.27 to 14.37, followed by MD2 (0.08–12.82) and Morris (0.92–11.83), respectively. A significant increase (
p < 0.05) in the a* values over the storage days was observed for all pineapple varieties at different storage temperatures. The storage temperature at 25 °C had the lowest a* values compared with the pineapple samples stored at 5 and 10 °C, except for the Josapine variety. The highest a* value among all storage temperatures was achieved at 10 °C for Josapine (14.37), whereas MD2 and Morris recorded 12.82 and 11.83 at 25 °C, respectively. In this manner, the a* values increased significantly with storage day and temperature. The rise in a* values during storage that was observed could be related to fruit translucency and internal browning under different temperatures [
35]. The a* colour parameter of minimally processed pineapples showed a similar trend, indicating the brownish colour scheme was noticeable in fruit flesh after 8 days of storage [
27].
Considering the effect of storage temperature on the b* values, an increasing pattern (
p < 0.05) was demonstrated across the storage days for all pineapple varieties. Based on the findings, it was revealed that Josapine obtained the b* values of 4.40 to 25.54, followed by MD2 (3.76–24.54) and Morris (5.27–21.65). The storage temperature of 10 °C had the lowest b* values compared with the pineapple samples stored at 5 and 25 °C, except for the MD2 variety. After 14 days of storage, the b* values gradually increased, indicating that the pineapples changed to a darker colour and induced luminosity loss. The b* parameter discolouration was generated by internal bruising and physiological disorders, which include enzymatic browning in the fruits [
36]. Identically, the increase in b* colour values for pineapples with the taste and texture of the fruit flesh was evaluated, indicating that unripe fruit possessed a sour flavour and firm texture, whereas overripe fruit denoted a soft texture and tangy flavour [
25]. Therefore, the variation in terms of L*, a*, and b* colour parameters of different pineapple varieties in relation to different storage treatments could provide robust information which is beneficial for monitoring the functional and quality attributes of the fruit.
3.3. Kinetics of Quality Changes in Pineapples
The kinetics of physicochemical changes in pineapples, including TSS, pH, moisture content, firmness, and colour (L*, a*, and b*), were evaluated in order to calculate the change rate of these parameters. The reaction order estimation achieved from fitting the zero and first-order kinetic models for TSS, pH, firmness, and moisture content of different pineapple varieties is shown in
Table 3. The reaction order of quality changes in pineapple varieties was determined according to the R
2 and RMSE as a function of storage days at three different storage temperatures. Based on the findings, the physicochemical properties fitted better with the first-order kinetic models, with R
2 values from 0.893 to 0.992 and RMSE values of 0.032–3.959, respectively. Meanwhile, the zero-order kinetic models obtained R
2 values from 0.872 to 0.988 and RMSE values from 0.038 to 3.648. It can be noted that the R
2 values were slightly lower for the zero-order kinetic models compared with the first-order kinetic models. The findings signified that the changes in the physicochemical properties of pineapples demonstrated relatively good performance and fitted to first-order kinetics based on the evaluation of R
2 and RMSE values. Niu et al. [
16] developed kinetic models to evaluate the shelf life prediction of mushrooms (
Flammulina velutipes) based on sensory evaluations and microbial infection at three different temperatures (4, 15, and 25 °C).
The reaction order estimation achieved from fitting the zero- and first-order kinetic models for the colour parameters of pineapple varieties is shown in
Table 4. Most of the colour parameters (L*, a*, and b*) had a tendency to demonstrate a high degradation of colour with storage day and temperature, implying high activation energy during storage [
37]. The first-order reaction model is commonly used in many existing studies and successfully applied to monitor quality changes in various food products [
38,
39]. In addition, the values for rate constants fluctuated for all the physicochemical properties at 5, 10, and 25 °C, which specified that the quality changes occurred rapidly in pineapples in the chilling injury condition in comparison with the storage temperatures. The fluctuation in the rate constant values indicated the model precisely accounted for the changes in physicochemical properties over storage temperatures.
The kinetic parameters of physicochemical properties of different pineapple varieties during storage obtained by the Arrhenius model are shown in
Table 5. The activation energies (E
a) ranged from 34.793 to 36.896 kJ/mol and k
ref ranged from 0.094 to 1.929 day
−1. A kinetic study was described using the rate constant and R
2 values to evaluate the quality changes and shelf life of frozen spinach, including vitamin C, chlorophyll contents, colour properties, texture, as well as sensory characteristics [
40]. Apart from that, the applicability of the thermal inactivation of mangosteen was tested using Arrhenius kinetic and Weibull models in order to predict polyphenol oxidase inactivation and colour evaluation of fruit at temperatures from 60 to 100 °C [
41]. The prediction of quality parameters of tomatoes was investigated in order to prolong the shelf life up to 30 days using a temperature of 10 °C [
42]. Likewise, supporting findings have been reported which showed that the kinetic constants increased with the rise in temperature from 5 °C to 35 °C for the shelf life estimation of yoghurt during a storage period of 25 days [
10]. The changes in fruit quality during storage, including chemical, physical, and physicochemical properties, could have an effect on the kinetics.
3.4. Determination of Shelf Life
The high values of R
2 indicated that the quality indices have strong temperature dependencies, which can be used as a key indicator in developing shelf life prediction [
43]. Firmness and moisture content were selected as the quality indicator for pineapple, signifying that those parameters were suitable to estimate the shelf life of pineapples. In an effort to determine the expressions that could predict the shelf life of pineapples in regard to the changes in firmness and moisture content, the predicted variable time was calculated with respect to the storage temperature. For this reason, the shelf life was assessed as the number of days until the quality changes showed deterioration of the fruit and induced the symptoms of spoilage. It is noteworthy to mention that the robustness of the kinetic models relied on the feasibility to estimate the shelf life of the fruit with the maximum recommended values [
44]. The shelf life prediction of pineapples at different temperatures was obtained by combining the first-order kinetic model with the Arrhenius equation as shown in Equation (5). The shelf life of pineapples was determined by a threshold value of the physicochemical properties of the fruit. Nevertheless, there were no specific threshold values for firmness and moisture content due to the variation in threshold values under different storage conditions [
39].
where
tSL is the predicted shelf life of pineapples (days),
Ct is the limiting value of physicochemical properties,
Co is the initial value of physicochemical properties,
kref is the reaction rate at reference temperature (day
−1) of each physicochemical property,
Ea is the activation energy (kJ/mol) of each physicochemical property, and
T is the absolute temperature (K).
Table 6 shows the shelf life prediction of pineapples using a regression equation according to first-order kinetics at three different storage temperatures. The variation in firmness and moisture content demonstrated that the storage temperatures implied a huge influence on these physicochemical properties of pineapples. The shelf life prediction for MD2 at 5 °C was 31.57 days and 33.58 days based on the firmness and moisture content of the fruit. The shelf life prediction at 10 °C was 39.52 days and 38.76 days in relation to the firmness and moisture content, respectively. Meanwhile, the shelf life prediction observed at 25 °C was 26.52 days and 28.41 days based on firmness and moisture content, respectively. For Josapine, the longest shelf life was 27.77 (firmness) and 29.26 days (moisture content), both recorded at 10 °C. Among all the varieties, Morris had the highest predicted shelf life based on firmness (34.12 days) and moisture content (32.96 days) at 10 °C, respectively. Specifically, a linear model described well the changes in shelf life in terms of firmness and moisture content, achieving an R
2 value greater than 0.82 for all pineapple varieties.
It can be noted that the samples stored at 10 °C had the longest shelf life, followed by the samples stored at 5 and 25 °C. In this study, the shelf life prediction models for pineapples were established based on the key quality indicators that could provide a theoretical basis for real-time monitoring of quality parameter changes in pineapples. In view of monitoring the quality and safety of fruits, the shelf life prediction was determined according to the different storage temperatures [
45]. In this sense, it could be concluded that the prediction model is an alternative approach to determine the shelf life of pineapples as well as to provide consumers with information regarding the storage conditions of fruit supply. It becomes apparent that it is essential to determine the specific factors for shelf life estimation considering that the decision generates different possible outcomes.


