Article

A Type I and a Type II Metacaspase Are Differentially Regulated during Corolla Development and in Response to Abiotic and Biotic Stresses in Petunia × hybrida

Department of Horticulture and Crop Science, The Ohio State University, CFAES Wooster Campus, Wooster, OH 44691, USA
*
Author to whom correspondence should be addressed.
Horticulturae 2022, 8(12), 1151; https://doi.org/10.3390/horticulturae8121151
Submission received: 29 September 2022 / Revised: 1 December 2022 / Accepted: 2 December 2022 / Published: 6 December 2022
(This article belongs to the Section Floriculture, Nursery and Landscape, and Turf)

Abstract

:
Metacaspases are structural homologs of the metazoan caspases that are found in plants, fungi, and protozoans. They are cysteine proteases that function during programmed cell death, stress, and cell proliferation. A putative metacaspase designated PhMC2 was cloned from Petunia × hybrida, and sequence alignment and phylogenetic analysis revealed that it encodes a type II metacaspase. PhMC2 cleaved protease substrates with an arginine residue at the P1 site and cysteine (iodoacetamide) and arginal (leupeptin) protease inhibitors nearly abolished this activity. The activity of PhMC2 was highest at pH 8, and the putative catalytic site cysteine residue was required for optimal activity. Quantitative PCR showed that PhMC2 transcripts were detectable in petunia corollas, styles, and ovaries. Expression patterns were not upregulated during petal senescence but were higher at the middle stages of development when flower corollas were fully open but not yet starting to wilt. PhMC1, a type I metacaspase previously identified in petunia, and PhMC2 were differentially regulated in vegetative tissues in response to biotic and abiotic stresses. PhMC2 expression was upregulated to a greater extent than PhMC1 following Botrytis cinerea infection, while PhMC1 was upregulated more by drought, salinity, and low nutrient stress. These results suggest that petunia metacaspases are involved in flower development, senescence, and stress responses.

1. Introduction

Caspases are cysteine-dependent aspartate specific proteases that proteolytically activate substrates involved in initiating and executing programmed cell death (PCD) in animals [1]. Metacaspases are a structurally related family of cysteine proteases in plants, protozoans, and fungi that are also involved in PCD during development and stress responses [2]. Metacaspases contain the conserved catalytic cysteine and histidine dyad that makes up the caspase active site, but they have different substrate specificity, cleaving at lysine or arginine rather than aspartate [2]. All metacaspases contain two caspase-like catalytic domains referred to as p20 (20 kDa) and p10 (10 kDa) [3,4,5,6]. Metacaspases are primarily classified as type I or type II based on their catalytic domain structure and arrangement, although type III metacaspases were more recently reported in phytoplanktonic protists [7,8]. Type I metacaspases have a proline- or glutamine-rich N-terminal prodomain, while the Type II metacaspases have no prodomain and a long linker region between the p20- and p10-like caspase domains. In the type III metacaspase class, the N-terminal domain is p10 rather than p20 as is seen in the arrangement of type I and type II metacaspases [9].
The number of metacaspase genes varies considerably between species, but the Arabidopsis (Arabidopsis thaliana) genome contains three type I and six type II metacaspases [10]. Expression of the type I AtMC1 (AtMCP1b) correlates with Arabidopsis cell death in response to wounding and pathogen infection [11], and expression of the type II AtMC8 is upregulated by oxidative stress [12]. Potato (Solanum tuberosum) and tomato (Solanum lycopersicum), solanaceous plants in the same family as petunia, have a total of eight metacaspases. Both genomes include six type I and only two type II metacaspases [13]. The eight tomato metacaspases have some tissue specificity, and expression of most of the SlMCs is regulated by low temperature, drought, salt, methyl viologen, and ethephon [14]. SlMC2 (type I) and SlMC7 (type II) transcripts are upregulated during fruit ripening and leaf senescence [14]. Promoter analysis of the potato metacaspase genes identified cis-acting elements involved in development, stress, and hormone responsive pathways [15]. Transcript abundance of all the potato metacaspase genes increases from immature leaves to senescing leaves, but SotubMC6 (type I) is the only gene that has senescence-specific expression in leaves. Another type I metacaspase, SotubMC5, has the greatest upregulation in open flowers compared to flower buds, while SotubMC6 is downregulated in open flowers [15]. While differential regulation has been reported in Arabidopsis and other species, the gene specific roles of the type I and type II metacaspases during development or abiotic and biotic stress responses are still not well understood [13].
While the metacaspase family of cysteine proteases does not appear to be responsible for caspase-like activity in plants, there is considerable evidence that they are involved in PCD [10,13]. Expression of either AtMC1 (AtMCP1b, type I) or AtMC5 (AtMCP2b, type II) induces cell death in wild type Saccharomyces cerevisiae (yeast) and complements the yeast metacaspase mutant yca1Δ [5]. These multifunctional proteases are also involved in cell cycle regulation and the clearance of protein aggregates in yeast [16,17]. The identification of cell-death-related substrates for the plant metacapases confirms the functional commonality between caspases and metacaspases [13]. Late Embryo Abundant (LEA) proteins involved in the maturation and cryoprotection of seeds during osmotic stress are cleaved by the Arabidopsis type II metacaspase AtMC9 [18], and the induction of PCD by GRIM REAPER (GRI) also depends on the activity of AtMC9 [19].
Normal plant growth and development, as well as successful adaptation to biotic and abiotic stresses, requires the induction of PCD to remove unneeded cells. The Arabidopsis metacaspase, AtMC1, has a dual function in programmed cell death, positively regulating pathogen-induced cell death in young tissues and negatively regulating senescence in older tissues. Atmc1 mutants exhibit premature leaf senescence, and they cannot restrict cell death following pathogen infection [20]. Petal senescence, like leaf senescence, represents the last developmental stage of a plant organ. The programmed disassembly of the flower petals allows the plant to recycle nutrients to the developing fruit and seeds before the corolla is shed [21,22]. A type I metacaspase in petunia (PhMC1) is upregulated during flower petal senescence and by exogenous ethylene treatment [23]. Downregulating PhMC1 using virus induced gene silencing decreases flower longevity, and the corollas senesce two days earlier than wild type flowers [23]. This manuscript presents the cloning and characterization of a type II (PhMC2) metacaspase from Petunia × hybrida and identifies differential gene expression patterns between PhMC1 and PhMC2 that suggest different roles in flower development and stress responses.

2. Materials and Methods

2.1. Identifying a Type II Metacaspase (PhMC2) from Petunia

A search of the Solanaceae Genomics Network petunia database (http://solgenomics.net/; accessed on 14 April 2006) identified two ESTs (TC2403 and TC3508) encoding a putative type II metacaspase. Primers (F-PhMC2_3 and R-PhMC2_4; Table S1) that spanned the two ESTs were used to clone PhMC2 from petunia corollas by RT-PCR using methods previously described [23]. The full length PhMC2 cDNA was obtained by rapid amplification of cDNA ends (RACE) (SMART RACE kit, Clontech, Mountain View, CA, USA) and sequenced using capillary sequencing (MCIC, Wooster, OH, USA). Multiple amino acid sequence alignment was conducted using Clustal Omega 1.2.4 to generate a neighbor-joining phylogenetic tree and to calculate the percent amino acid identity of type I and type II metacaspases [24,25]. Coding regions and predicted amino acid translations of the petunia metacaspases (PhMC1, GenBank# AFK93070 and PhMC2, AFK93071) were compared to metacaspases from tomato (SlMC1, SGN locus Solyc01g088710; SlMC2, Solyc03g094160; SlMC3, Solyc05g052130; SlMC4, Solyc01g105320; SlMC5, Solyc01g105300; SlMC6, Solyc01g105310; SlMC7, Solyc09g098150; and SlMC8, Solyc10g081300) and Arabidopsis (AtMC1, GeneBank# NP_171719; AtMC2, NP_194241; AtMC3, NP_851262; AtMC4, NP_178052; AtMC5, NP_178051; AtMC6, NP_178050; AtMC7, NP_178049; AtMC8, NP_173092; and AtMC9, NP_196040).

2.2. Expression, Purification, and Activity of Recombinant PhMC2 Proteins

The coding region of PhMC2 was cloned into the expression vector pET28a(+) at the BamHI and XhoI sites. A mutant PhMC2 protein was created in which the cysteine in the catalytic site (C139) was converted into alanine. The mutant protein was created using overlapping PCR techniques [26], and PhMC2C139A was cloned into pET28a(+). Constructs pET28a(+)::PhMC2C139A and pET28a(+)::PhMC2 were transformed into E. coli strain BL21(DE3) pLysS.
A single colony for each construct, including a control that contained the empty pET28a(+) vector, was picked and used to inoculate a 5 mL culture of LB containing kanamycin at 50 mg·mL−1. This was incubated overnight with shaking at 37 °C. Three ml of overnight culture was then inoculated into 50 mL LB kan50 and incubated at 37 °C until the OD600 was 0.6–1.0. Isopropyl β-D-1-thiogalactopyranoside (IPTG) was added to a final concentration of 1 mM, and the cultures were incubated for 3 h at 37 °C to induce expression of the recombinant proteins. Cultures were placed on ice for 5 min, and the cells were harvested by centrifugation at 5000× g for 5 min at 4 °C. The pelleted cells were resuspended in a 0.25 volume of ice cold 20 mM Tris-HCl (pH 8.0) and centrifuged at 5000× g for 5 min.
The polyhistidine-tagged rPhMC2 and rPhMC2C139A proteins were purified using TALON Metal Affinity Resin (BD Biosciences Clontech, Mountain View, CA, USA) and quantified by the Bio-Rad Protein Assay (Bio-Rad, Hercules, CA, USA) as described in Chapin et al. [23]. Purified rPhMC2 (0.1 µg) was added to a 100 µM final concentration of the fluorogenic protease substrate Boc-GRR-AMC (Boc-Gly-Arg-Arg-AMC; Bachem, Torrance, CA, USA) or the fluorogenic caspase substrate Ac-DEVD-AMC (Ac-Asp-Glu-Val-Asp-AMC; Bachem) in 100 µL of reaction buffer to determine the substrate specificity of rPhMC2 and the pH for optimum activity. The reaction buffer contained 150 mM NaCl, 10 mM CaCl2, 10% glycerol (w/v), 0.1% CHAPS, and 10 mM DTT. The pH of the reaction buffer was adjusted with 100 mM glycine for pH 4 and pH 5, 100 mM MES for pH 6, 50 mM HEPES-KOH for pH 7 and pH 8, or 100 mM Tris for pH 9. The cysteine protease inhibitor, iodoacetamide (10 mM; Sigma-Aldrich, St. Louis, MO, USA), or the arginal protease inhibitor, leupeptin (1 µM; Sigma-Aldrich), were added to the reaction to determine if specific inhibitors would reduce the activity of rPhMC2 against Boc-GRR-AMC (pH 8.0). The activity of rPhMC2 was compared to that of the active site mutant rPhMC2C139A using only the fluorogenic protease substrate Boc-GRR-AMC at pH 8.0. All reactions were incubated for 30 min at 30 °C and terminated with 100 µL of stop solution (10% acetic acid in 150 mM sodium acetate).
Enzyme activities of rPhMC2C139A and rPhMC2 were determined as the amount of AMC released from the different fluorogenic substrates using a fluorescence spectrophotometer (DTX880 Multimode Detector, Beckman Coulter Inc., Lane Cove, Austria) at 370 nm excitation and 450 nm emission wavelengths. All enzyme activity assays were performed in triplicate. The data were analyzed using Multimode Analysis Software (V 3.2.0.6, Beckman Coulter Inc., Lane Cove, Austria), and relative enzyme activities were calculated as the percentage of activity in each individual sample compared to the sample with the highest activity. The values of the empty vector control (pET28a(+)) were background subtracted from each sample.

2.3. Plant Materials

Petunia × hybrida ‘Mitchell Diploid’ (MD) and transgenic ‘Mitchell Diploid’ petunias with reduced ethylene sensitivity (35S::etr1-1 line 44568) due to overexpression of the mutated ethylene receptor gene, were started from seed and grown in the greenhouse at The Ohio State University Wooster Campus, unless otherwise noted. The growing environment was set at 24/20 °C (day/night) with a 13 h photoperiod that was supplemented by high pressure sodium and metal halide lights (GLX/GLS e-systems GROW lights, PARSource, Petaluma, CA, USA). Plants were fertilized at each irrigation with 150 mg N·L−1 from Jack’s Professional Petunia FeED 20N-1.3P-15.8K (J.R. Peters, Inc., Allentown, PA, USA).

2.4. Treatments and Tissue Collection

2.4.1. Plant and Flower Tissue

Flowers from wild type MD and etr1-1 transgenic petunias were tagged and emasculated 1 day before flower opening, and corollas were collected from anthesis (flower opening or 0 day) to senescence (9 days for wild type MD and 21 days for etr1-1) to investigate gene expression during the corolla development of unpollinated flowers. MD corollas were collected every day and etr1-1 corollas were collected every three days. Six flowers were included at each collection timepoint. MD styles and ovaries were collected from non-senescing flowers at anthesis, pollinated flowers at 72 h after pollination, and naturally senescing, unpollinated flowers at 8 days after flower opening. A freshly dehisced anther was used to pollinate flowers on the day of flower opening and unpollinated flowers were emasculated to prevent self-pollination. Other plant tissues that were collected for gene expression characterization from only MD petunias included pollen; anthers; stems; roots; and young, green leaves.

2.4.2. Botrytis Inoculations

A local Botrytis cinerea strain was obtained from the USDA ARS Application Technology Research Unit (Wooster, OH). Botrytis was cultured in the dark on acid PDA media at room temperature (22 °C). After the culture had sporulated (~10 days), the conidia were harvested, and petunia leaves were inoculated following the methods of Hoeberichts et al. [27] with minor modifications. Spores were quantified on a hemocytometer and resuspended in inoculation buffer (MS media with vitamins, 10 mM glucose, and 10 mM sodium phosphate buffer pH 6.0) to a final concentration of 1.0 × 10⁶ spores per ml. Spores were pre-incubated in inoculation buffer for 2 h. Petunia leaves from 8-week-old plants were harvested and cut petioles were placed in tubes of water. Leaves were sprayed with the spore suspension until run off. Control leaves were sprayed with inoculation buffer. After inoculation, leaves were allowed to dry for 30 min. Leaves were placed in a humid chamber under 16 h light at room temperature. Leaf samples were collected at 2 days and 5 days after inoculation (dai).

2.4.3. Salinity Stress

Petunia seeds were sown directly into perlite and irrigated with ½ strength Hoagland’s solution. Three weeks after sowing, ½ strength Hoagland’s solution amended with 100 mM NaCl was applied to the seedlings. Seedlings were harvested after 0, 0.5, 1.0, 3.0, 6.0, 12.0, and 24.0 h. Shoots were separated from the roots, and the shoot tissues from five seedlings were pooled for each treatment.

2.4.4. Nutrient Deprivation

Seven-week-old petunia seedlings were transplanted, 3 per pot, into 10 cm pots filled with coarse perlite mixed with hydrated moisture retention granules (Soil Moist, JRM Chemical, Cleveland, OH, USA). Plants were grown hydroponically in a nutrient solution that contained a complete complement of macro and micronutrients (Control), or nutrient solutions that were deficient in nitrogen (-N), phosphorus (-P), or potassium (-K). The recipes for these nutrient solutions were previously published in Quijia Pillajo et al. [28]. Leaves were collected from plants at 4 weeks after the start of the nutrient deprivation treatments.

2.4.5. Drought Stress

Petunia plants were grown in a walk-in growth chamber (Conviron BDW-80; Winnipeg, MB, Canada). Growth chambers were maintained at 20 °C with 16 h lighting provided by high pressure sodium lights with an average photosynthetic photon flux of 218.6 µmoles m2·s−1. All pots were irrigated to container capacity at the beginning of the experiment. Water was then withheld until the entire plant was severely wilted and the water content of the media was around 10%. Media moisture content was monitored with a soil moisture meter (HH1 meter, Theta Probe ML2, Delta-T devices, Cambridge, UK). Twenty-four h after plants showed leaf-wilting symptoms, the pots were irrigated with water with no fertilizer. When the plants returned to full turgidity, water was withheld again. This cycle of water deficit and recovery was repeated a total of three times, and then plants were maintained with regular irrigation until lower leaf senescence was observed at 30 days. Continually irrigated control plants were also included for comparison. Leaf tissue was collected throughout the water deficit stress and recovery cycles from the drought treatment and from the irrigated controls at similar timepoints from 0 to 30 days.

2.5. RNA Extraction and Gene Expression Analysis by Quantitative PCR

All tissues collected for RNA extraction were frozen in liquid nitrogen and stored at −80 °C. Methods for RNA isolation, cDNA synthesis, and quantitative PCR were as previously described [23]. Primers specific to PhMC1 and PhMC2 (PhMC1 RT, PhMC2 RT; Table S1) were designed using IDT Primer Quest. Relative target gene expression was normalized to PhACTIN (Actin2/7, accession CV299322; Table S1) for each cDNA sample. PhACTIN has been shown to serve as an accurate internal reference control in the tissue types and treatments reported in this manuscript [23,28]. Previous experiments utilizing two genes for normalization (PhACTIN and EF1α) in similar qRT-PCR experiments were used to confirm that accurate results are obtained using PhACTIN as the single reference gene for expression normalization. All gene expression analyses involved three to four biological replicates.

2.6. Statistical Analysis

Statistical Analysis System software (SAS 9.3, SAS Institute, Inc., Cary, NC, USA) was used to run the generalized linear mixed model algorithm (Proc GLIMMIX) on the enzyme activity and gene expression data. Least squared means (p ≤ 0.05) was used as the post-hoc test for the model.

3. Results

3.1. Identification of a Type II Metacaspase from Petunia

A sequence homology search of Petunia EST databases initially identified two putative metacaspases. PhMC1 (GenBank Accession# JQ314004) was previously published [23], and PhMC2 is described in this manuscript. PhMC2 (GenBank Accession# JQ314005) included an open reading frame of 1251 bp and encoded a protein with 416 aa and a predicted MW of 45.4 kDa.
Phylogenetic analysis showed that PhMC2 clustered with the type II metacaspases, while PhMC1 clustered with the type I metacaspases (Figure 1). PhMC2 was most homologous to tomato SlMC7 (89.66% amino acid identity) and the Arabidopsis metacaspases AtMC4 (70%) and AtMC5 (68.3%).

3.2. Activity of Recombinant Metacaspases

Enzyme activity assays were performed to identify substrate specificity of the type II metacaspase, PhMC2, from petunia. The relative enzyme activities for all assays are shown as the percentage of activity in the individual samples compared to the sample with the highest activity. Recombinant PhMC2 cleaved the protease substrate Boc-GRR-AMC (Figure 2A). This substrate contains an arginine residue at the P1 position. Activity against Boc-GRR-AMC (GRRase activity) was highest at pH 7 to 9. In contrast, there was little detectable activity against the caspase-specific substrate Ac-DEVD-AMC, which contains an aspartic acid at the P1 position.
The effect of various inhibitors on the activity of rPhMC2 was investigated using the protease substrate Boc-GRR-AMC at pH 8.0 (Figure 2B). Results indicated that iodoacetamide, which is a cysteine protease inhibitor, and leupeptin, which is an arginal protease inhibitor, both resulted in almost complete inhibition (about 99% and 87%, respectively) of GRRase activity. The mutant protein, rPhMC2C139A, was used to determine if the conserved cysteine was required for activity against the GRR substrate. The GRRase activity of PhMC2 was nearly abolished when the catalytic site cysteine was mutated to alanine (Figure 2C).

3.3. PhMC1 and PhMC2 Expression in Corollas from Wild Type and Ethylene Insensitive Petunias

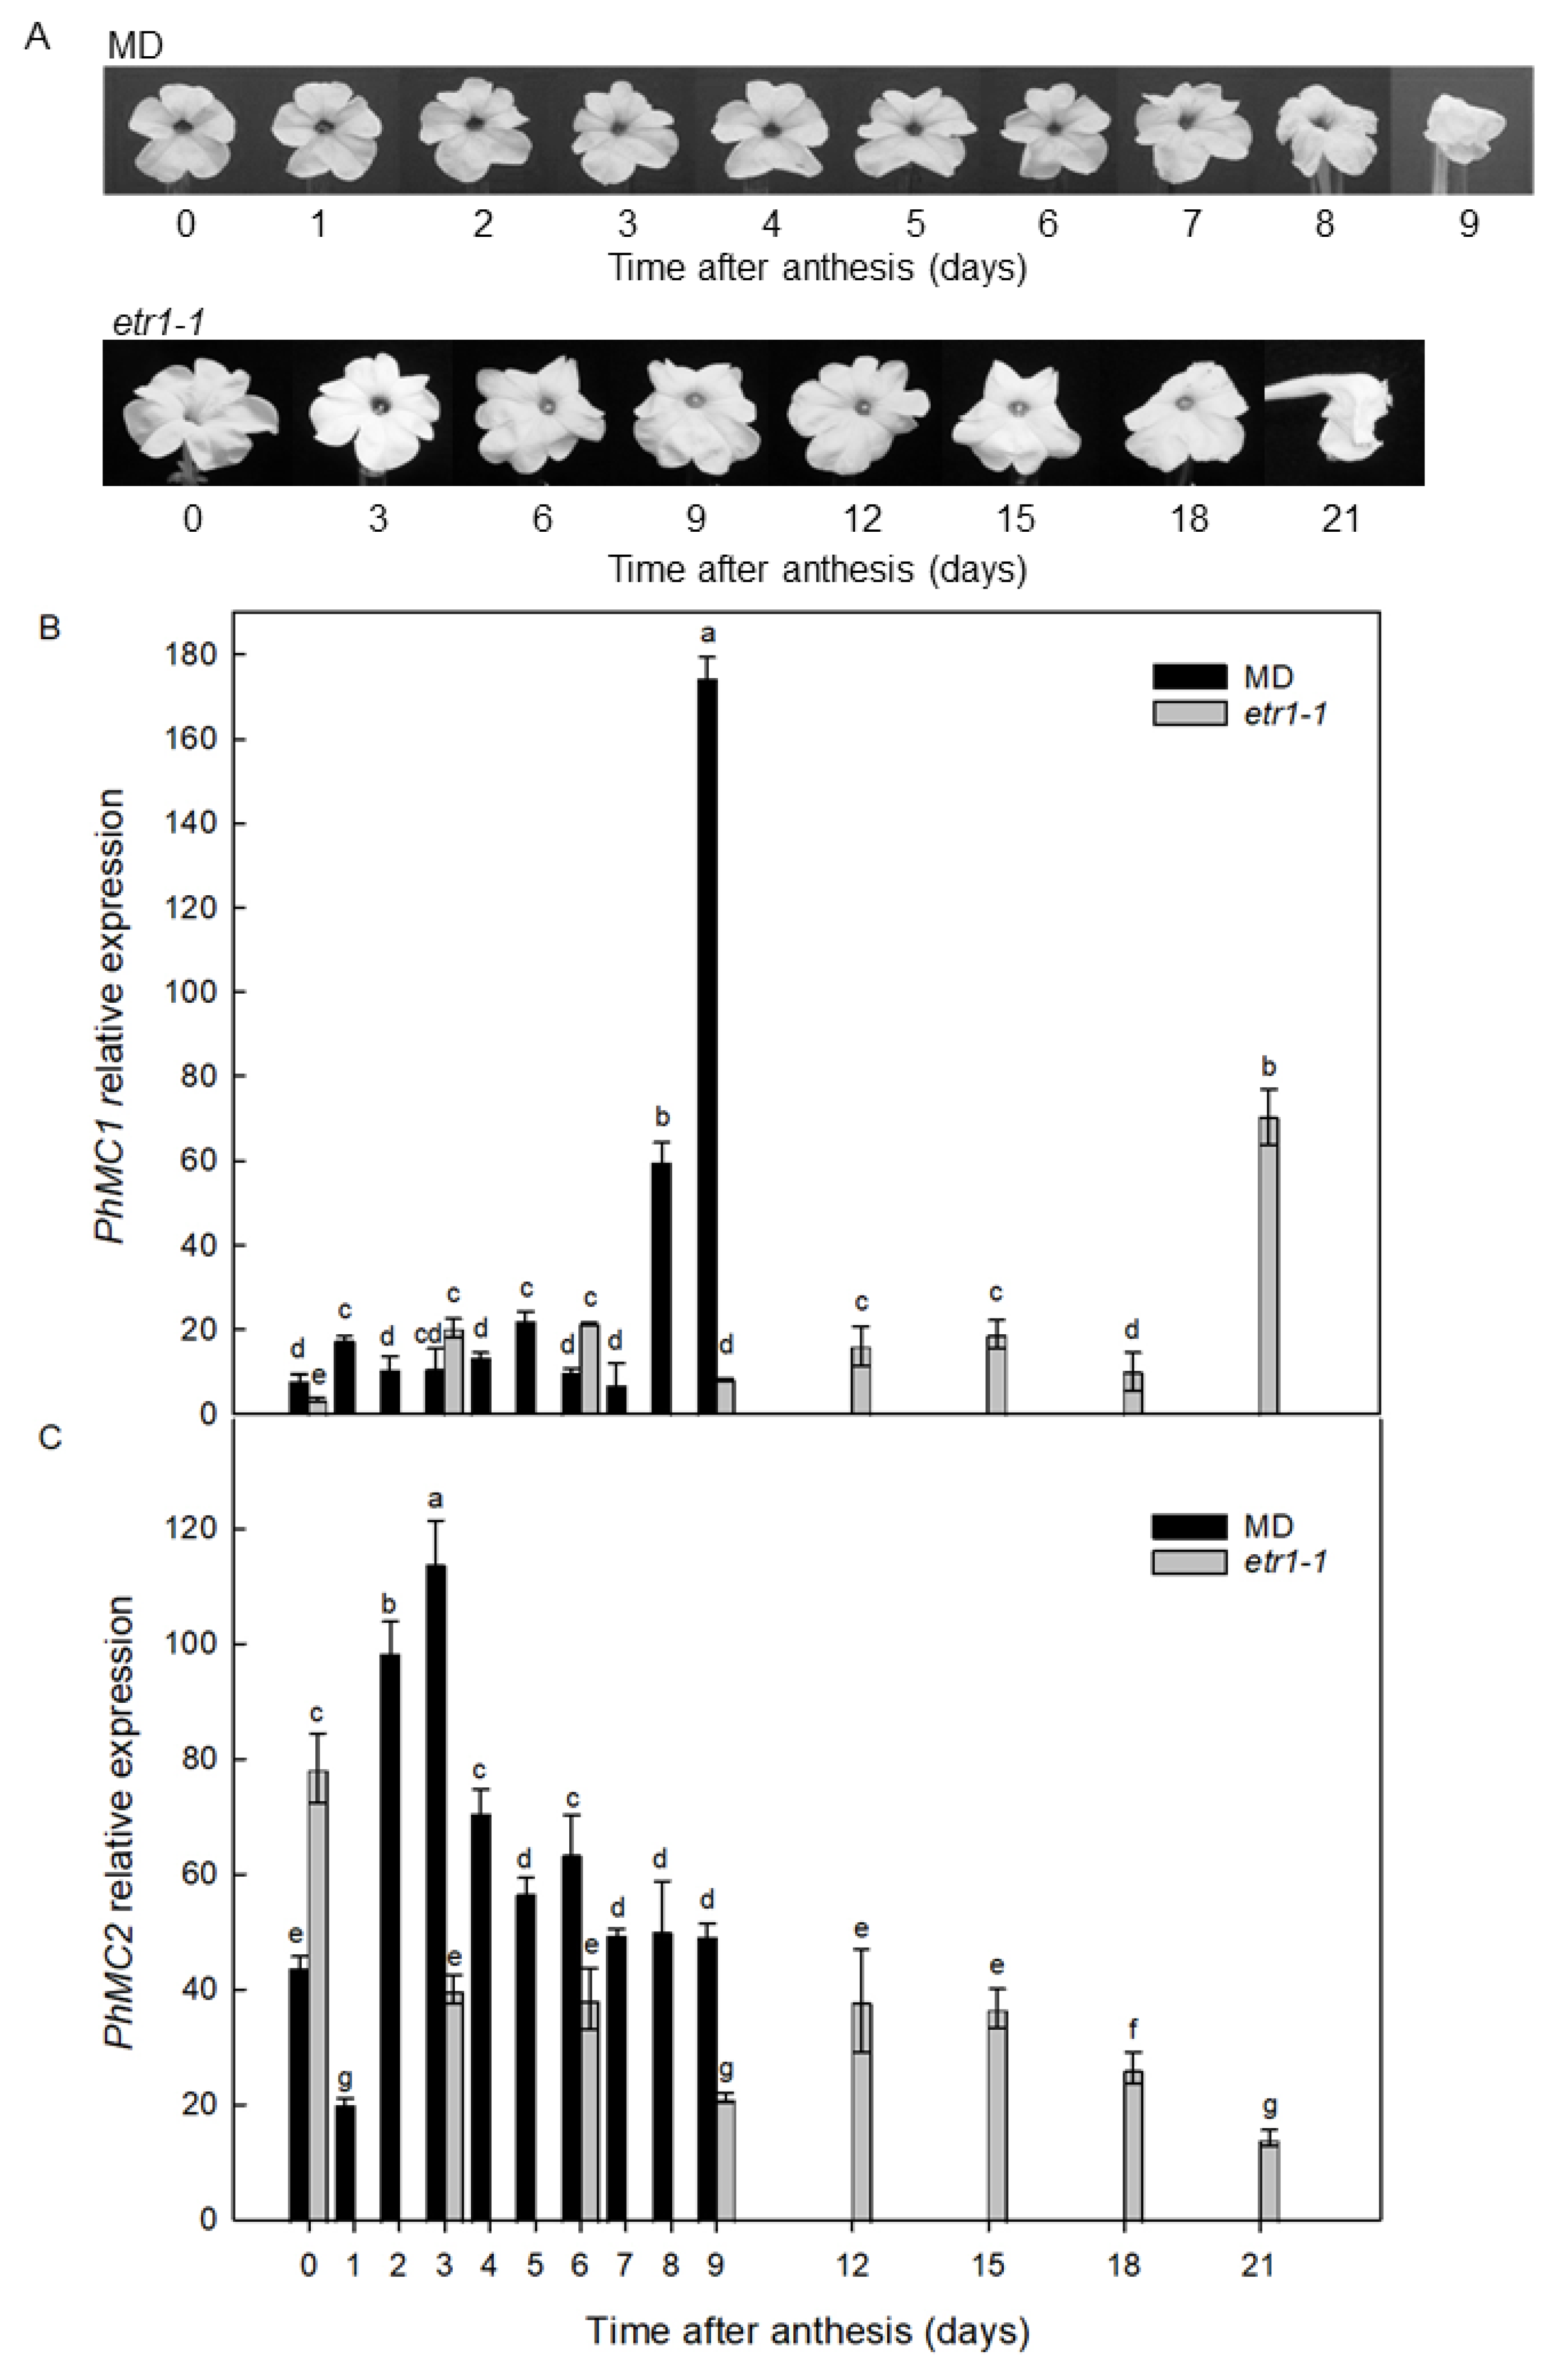
In this experiment, attached MD flowers in the greenhouse started to show visual symptoms of senescence, including corolla inrolling and loss of turgidity, by 8 days after anthesis, and corollas were fully wilted at 9 days (Figure 3A). Transcript abundance of PhMC1 corresponded to corolla senescence, with low levels detected from anthesis (0 days) to 7 days, increases at 8 days, and the greatest abundance at 9 days (Figure 3B). PhMC2 transcripts were highest at the middle stages of flower development (Figure 3C) when corollas were fully open and well before any visual signs of wilting associated with corolla senescence. Under our greenhouse conditions, the longevity of ethylene insensitive 35S::etr1-1 flowers was twice as long as wild type MD flowers (Figure 3A). In etr1-1 corollas, PhMC1 expression was highest at 21 days after anthesis when petals were senescing (Figure 3B). This transcript abundance was 2.5-fold less than that detected in senescing MD corollas at 9 days. In contrast, PhMC2 expression was highest in the corollas of non-senescing flowers on the day of corolla opening (0 days), with moderate levels of expression detected from 3 to 18 days, and the lowest abundance at 21 days when the etr1-1 corollas were wilted (Figure 3C).

3.4. PhMC1 and PhMC2 Expression in Different Tissues

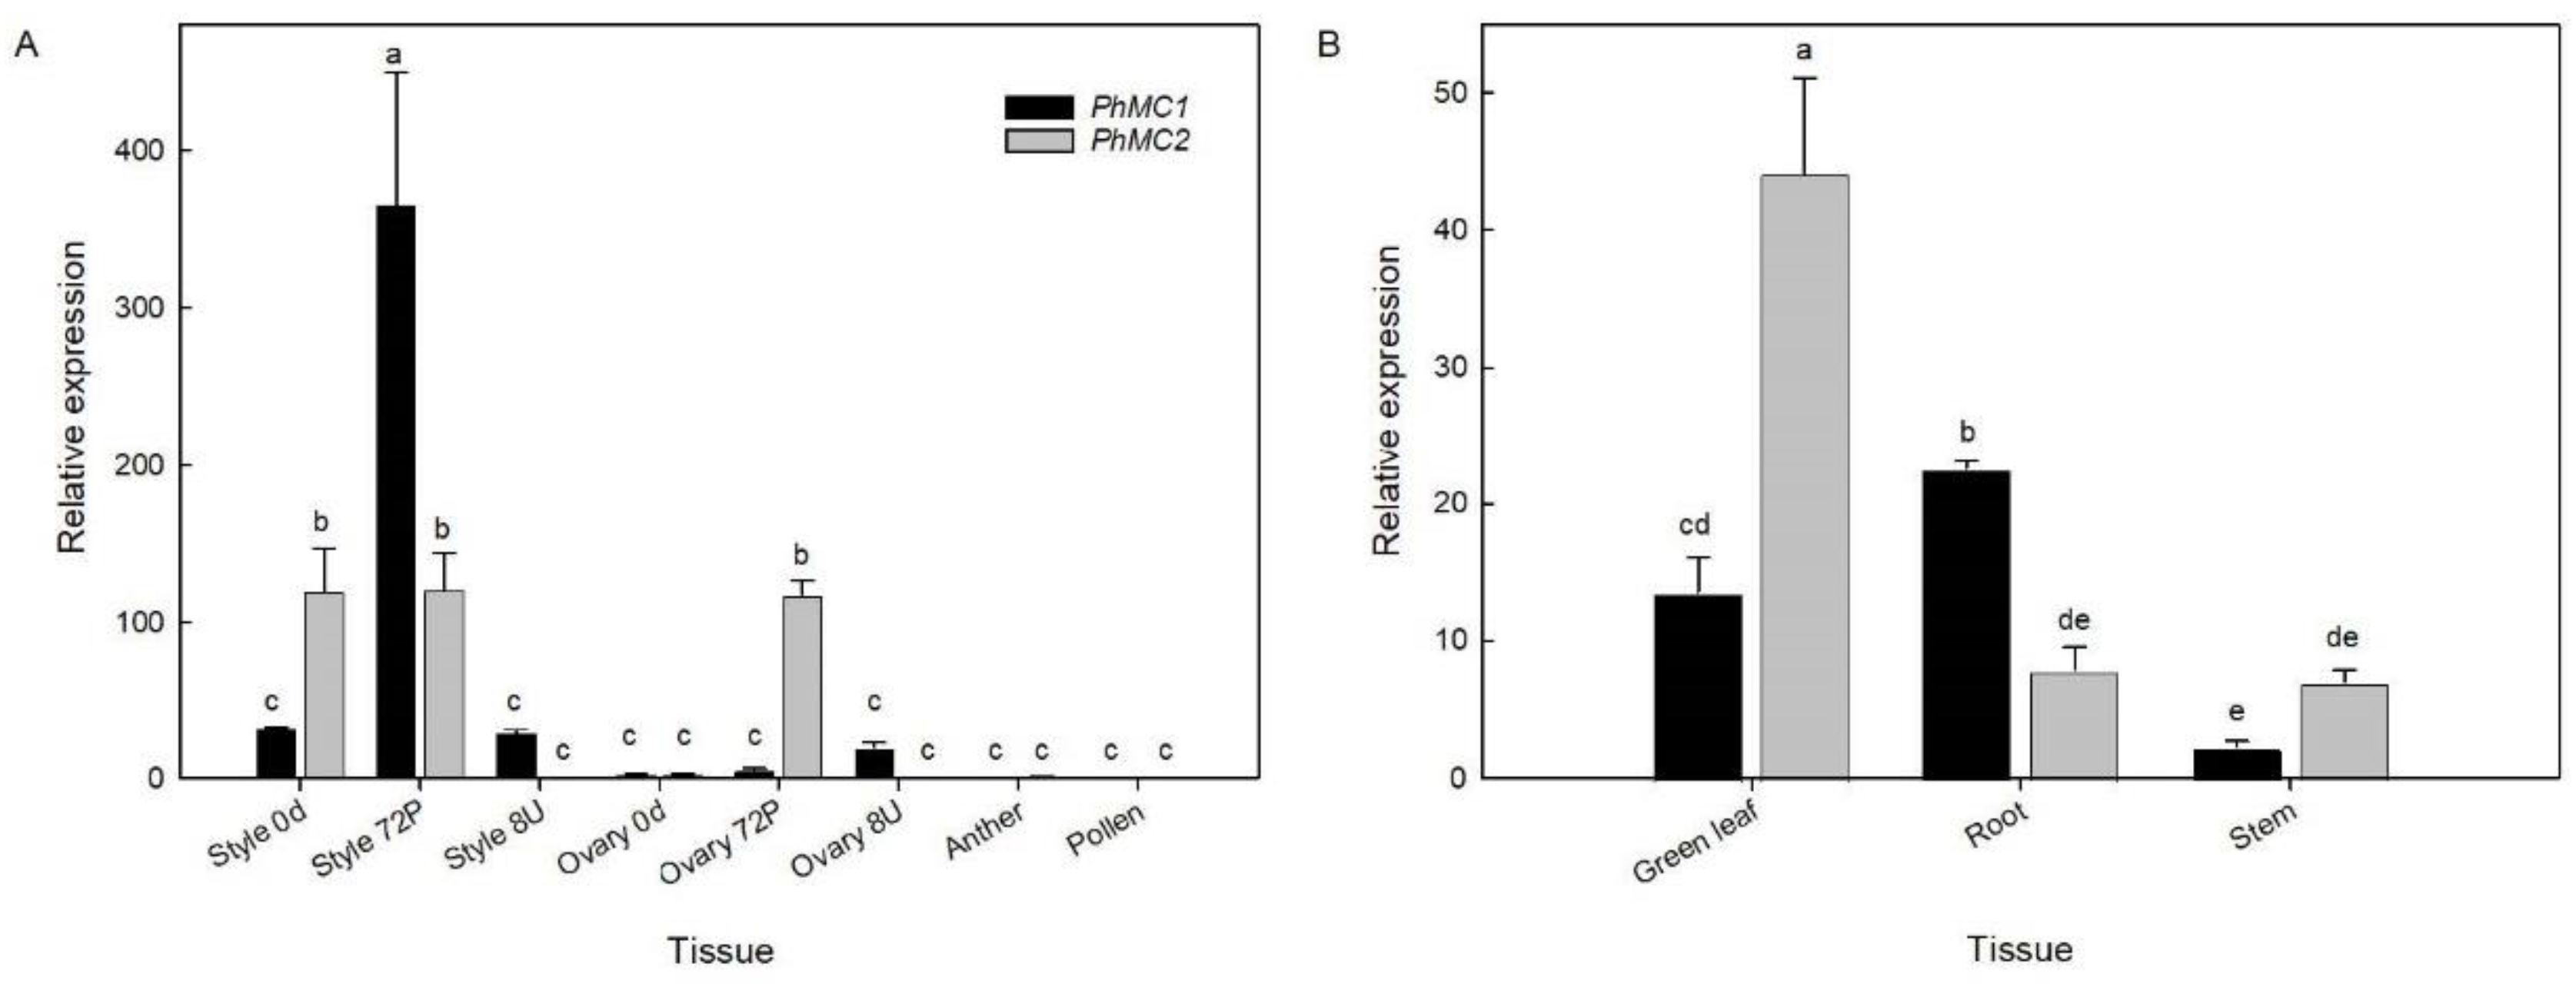
Expression of both PhMC1 and PhMC2 was barely detectable or very low in ovaries from unpollinated flowers at 0 days and 8 days in MD petunias (Figure 4A). Pollination resulted in an increase in the abundance of PhMC2. In styles from unpollinated flowers on the day of flower opening (0 days), expression of PhMC2 was higher than PhMC1. While abundance of PhMC1 was similar in styles from unpollinated senescing flowers (8 days), PhMC2 expression was barely detectable. PhMC1 transcript abundance increased 11-fold in styles from pollinated flowers (72 h) compared to 0 day styles. Both PhMC1 and PhMC2 were barely detectable in anthers and pollen. When investigating tissue specificity in other plant organs, expression of PhMC2 was much higher in young, green leaves compared to roots and stems (Figure 4B). Transcript abundance of PhMC2 was greater than that of PhMC1 in leaves and stems, while PhMC1 transcripts were more abundant than PhMC2 in roots.

3.5. PhMC1 and PhMC2 Expression during Biotic and Abiotic Stress Responses in Petunia

Botrytis cinerea infection upregulated expression of both PhMC1 and PhMC2 in leaves (Figure 5). At 2 days after inoculation (dai), PhMC1 expression had increased by 2.3-fold, while PhMC2 expression increased by 3.1-fold. By 5 dai, expression levels for both PhMC1 and PhMC2 were similar to the mock inoculated (buffer) controls.
PhMC1 was more highly upregulated than PhMC2 by various abiotic stresses. When young seedlings were subjected to high salinity (100 mM NaCl) the expression of PhMC1 in the seedling shoots increased by almost 2-fold after 0.5 h (Figure 6). Transcript abundance remained high from 0.5 to 12 h and decreased at 24 h. In contrast, expression of PhMC2 was only slightly upregulated at the 3, 6, and 12 h time points.
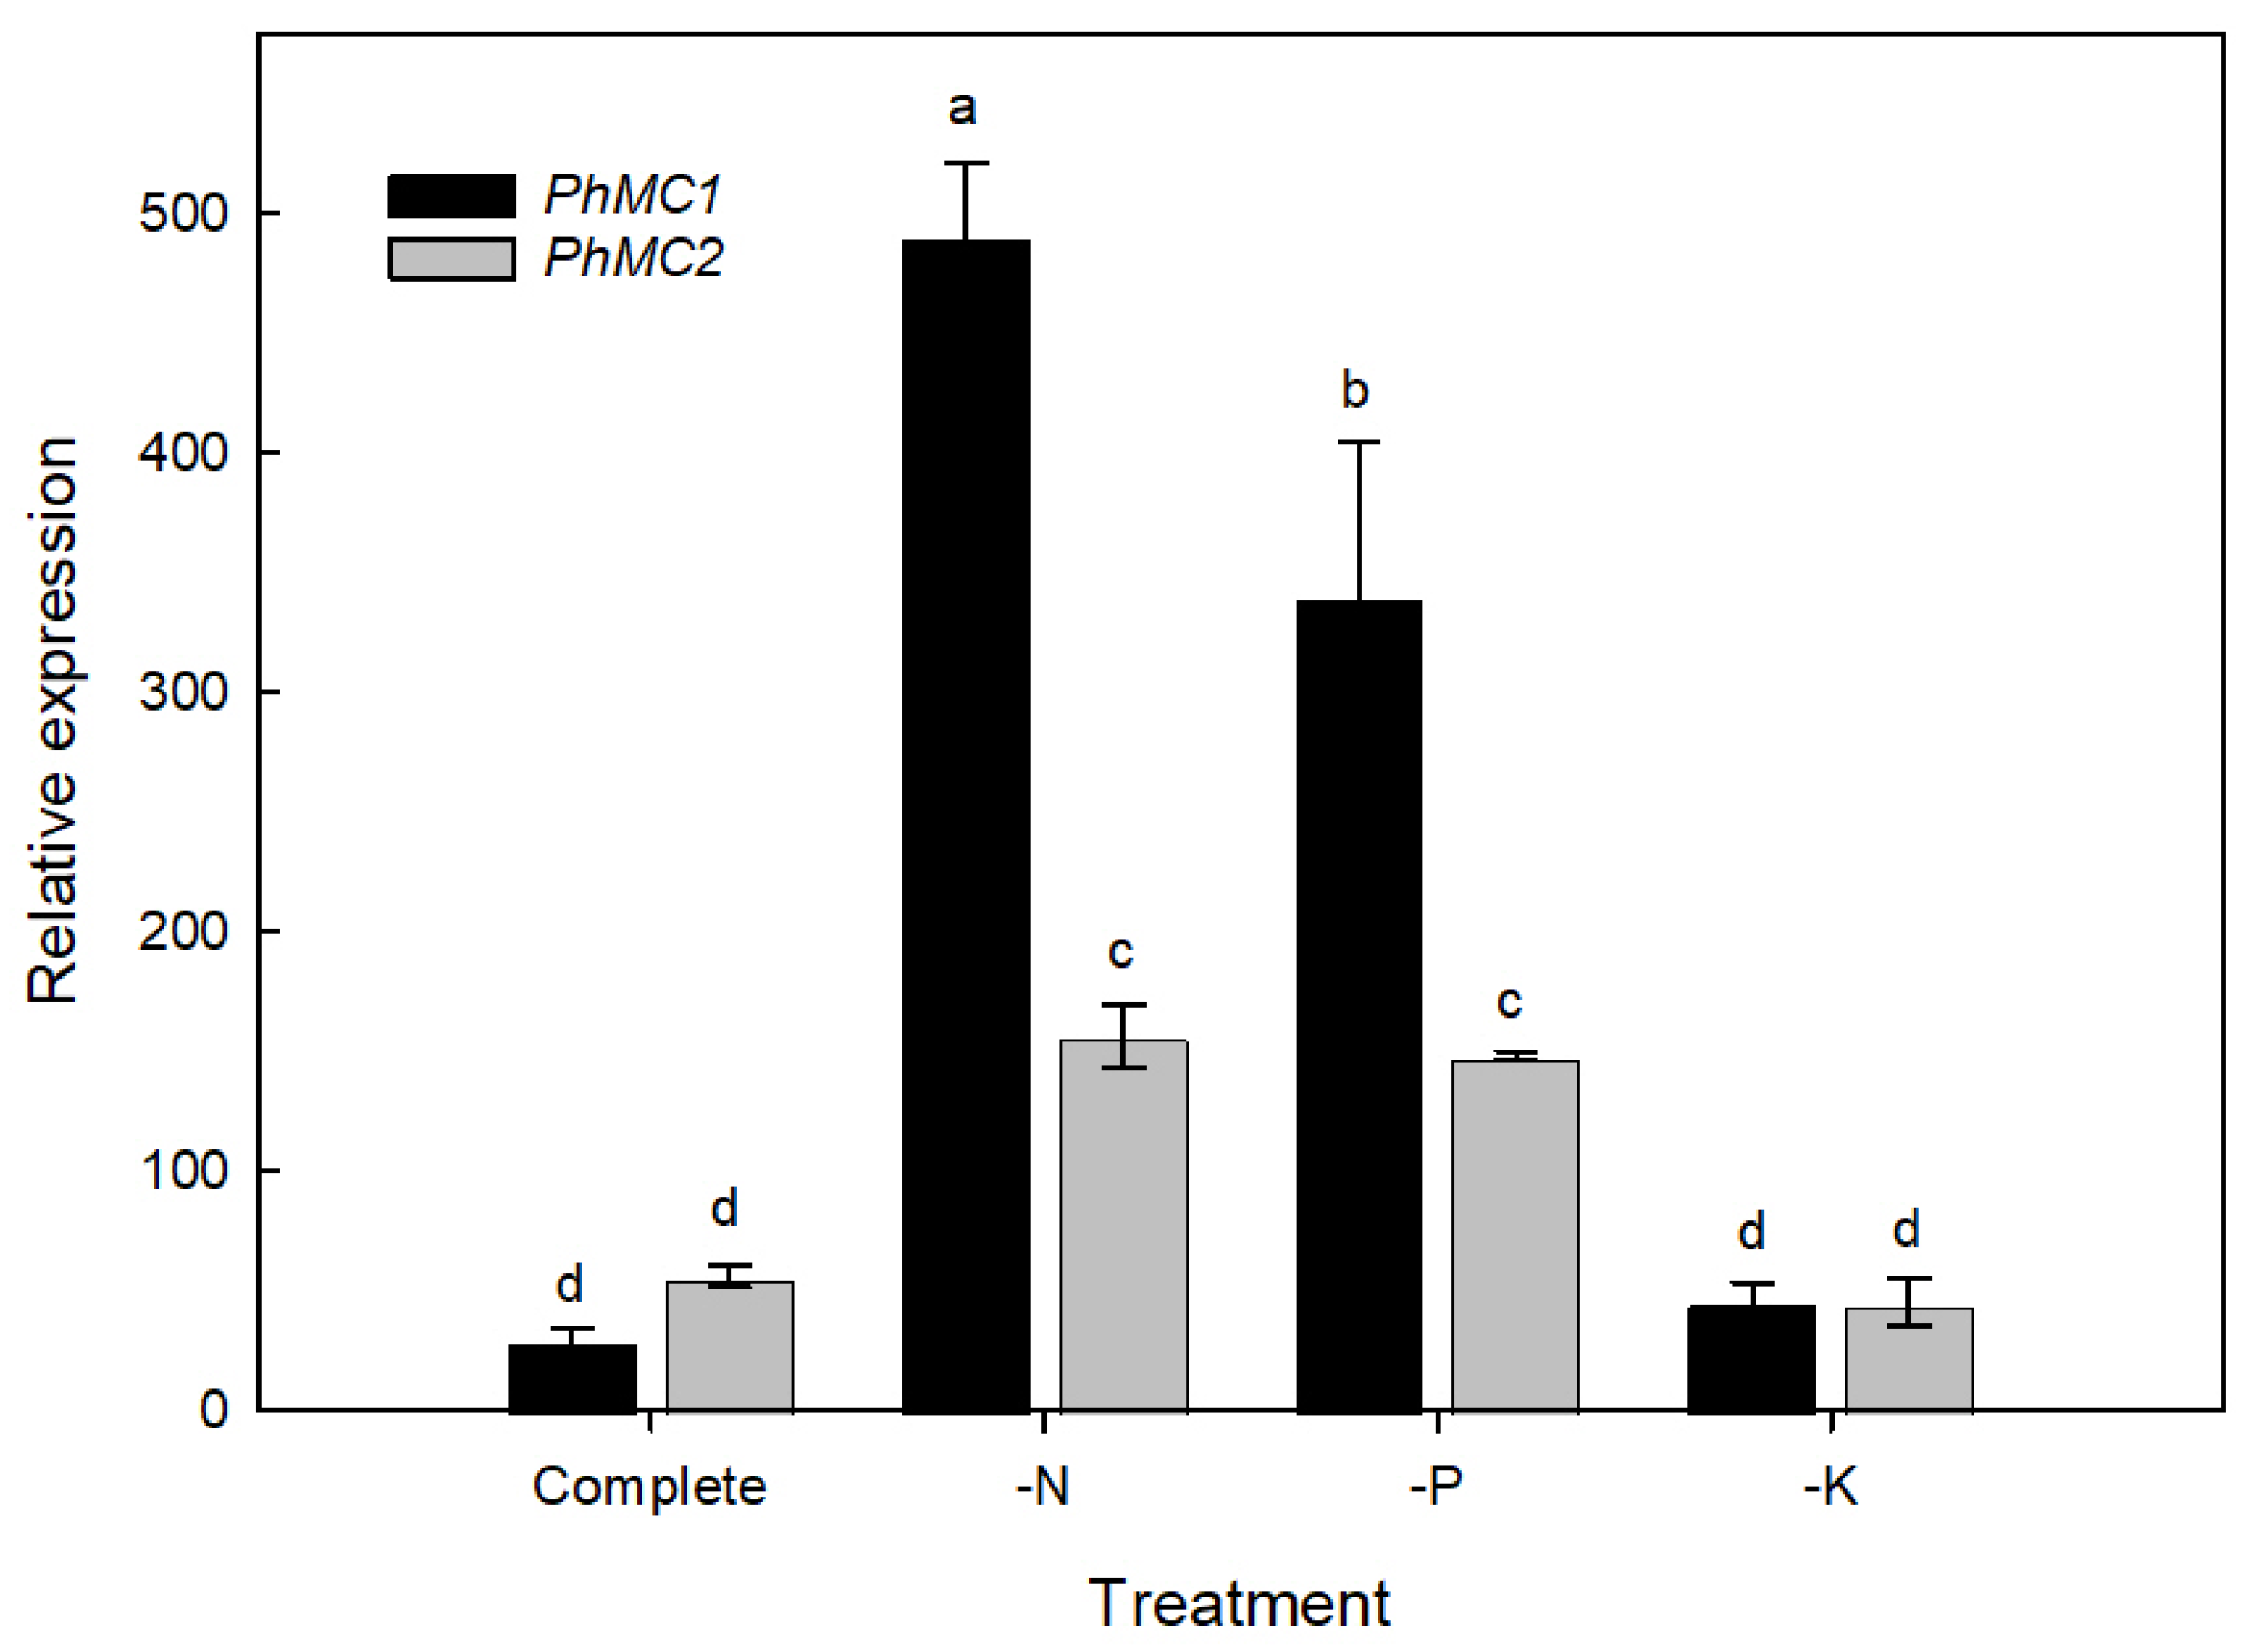
Nutrient deprivation also resulted in the upregulation of PhMC1 and PhMC2 in leaf tissue (Figure 7). After 28 days of nitrogen deprivation (-N), plants were showing visual symptoms of N deficiency with stunted growth and severe leaf chlorosis. Phosphorus deficiency caused stunting and purple coloration on the leaves. In -N plants, PhMC1 expression increased by 16-fold compared to healthy plants that received a complete fertilizer. PhMC2 was also upregulated, but to a lesser degree (<3-fold). P deficiency resulted in an increase in PhMC1 transcript abundance that was not as high as N deficiency, while gene expression of PhMC2 was upregulated to a similar extent in leaves from -N and -P treated plants. Potassium deficiency did not affect gene expression of either PhMC1 or PhMC2.
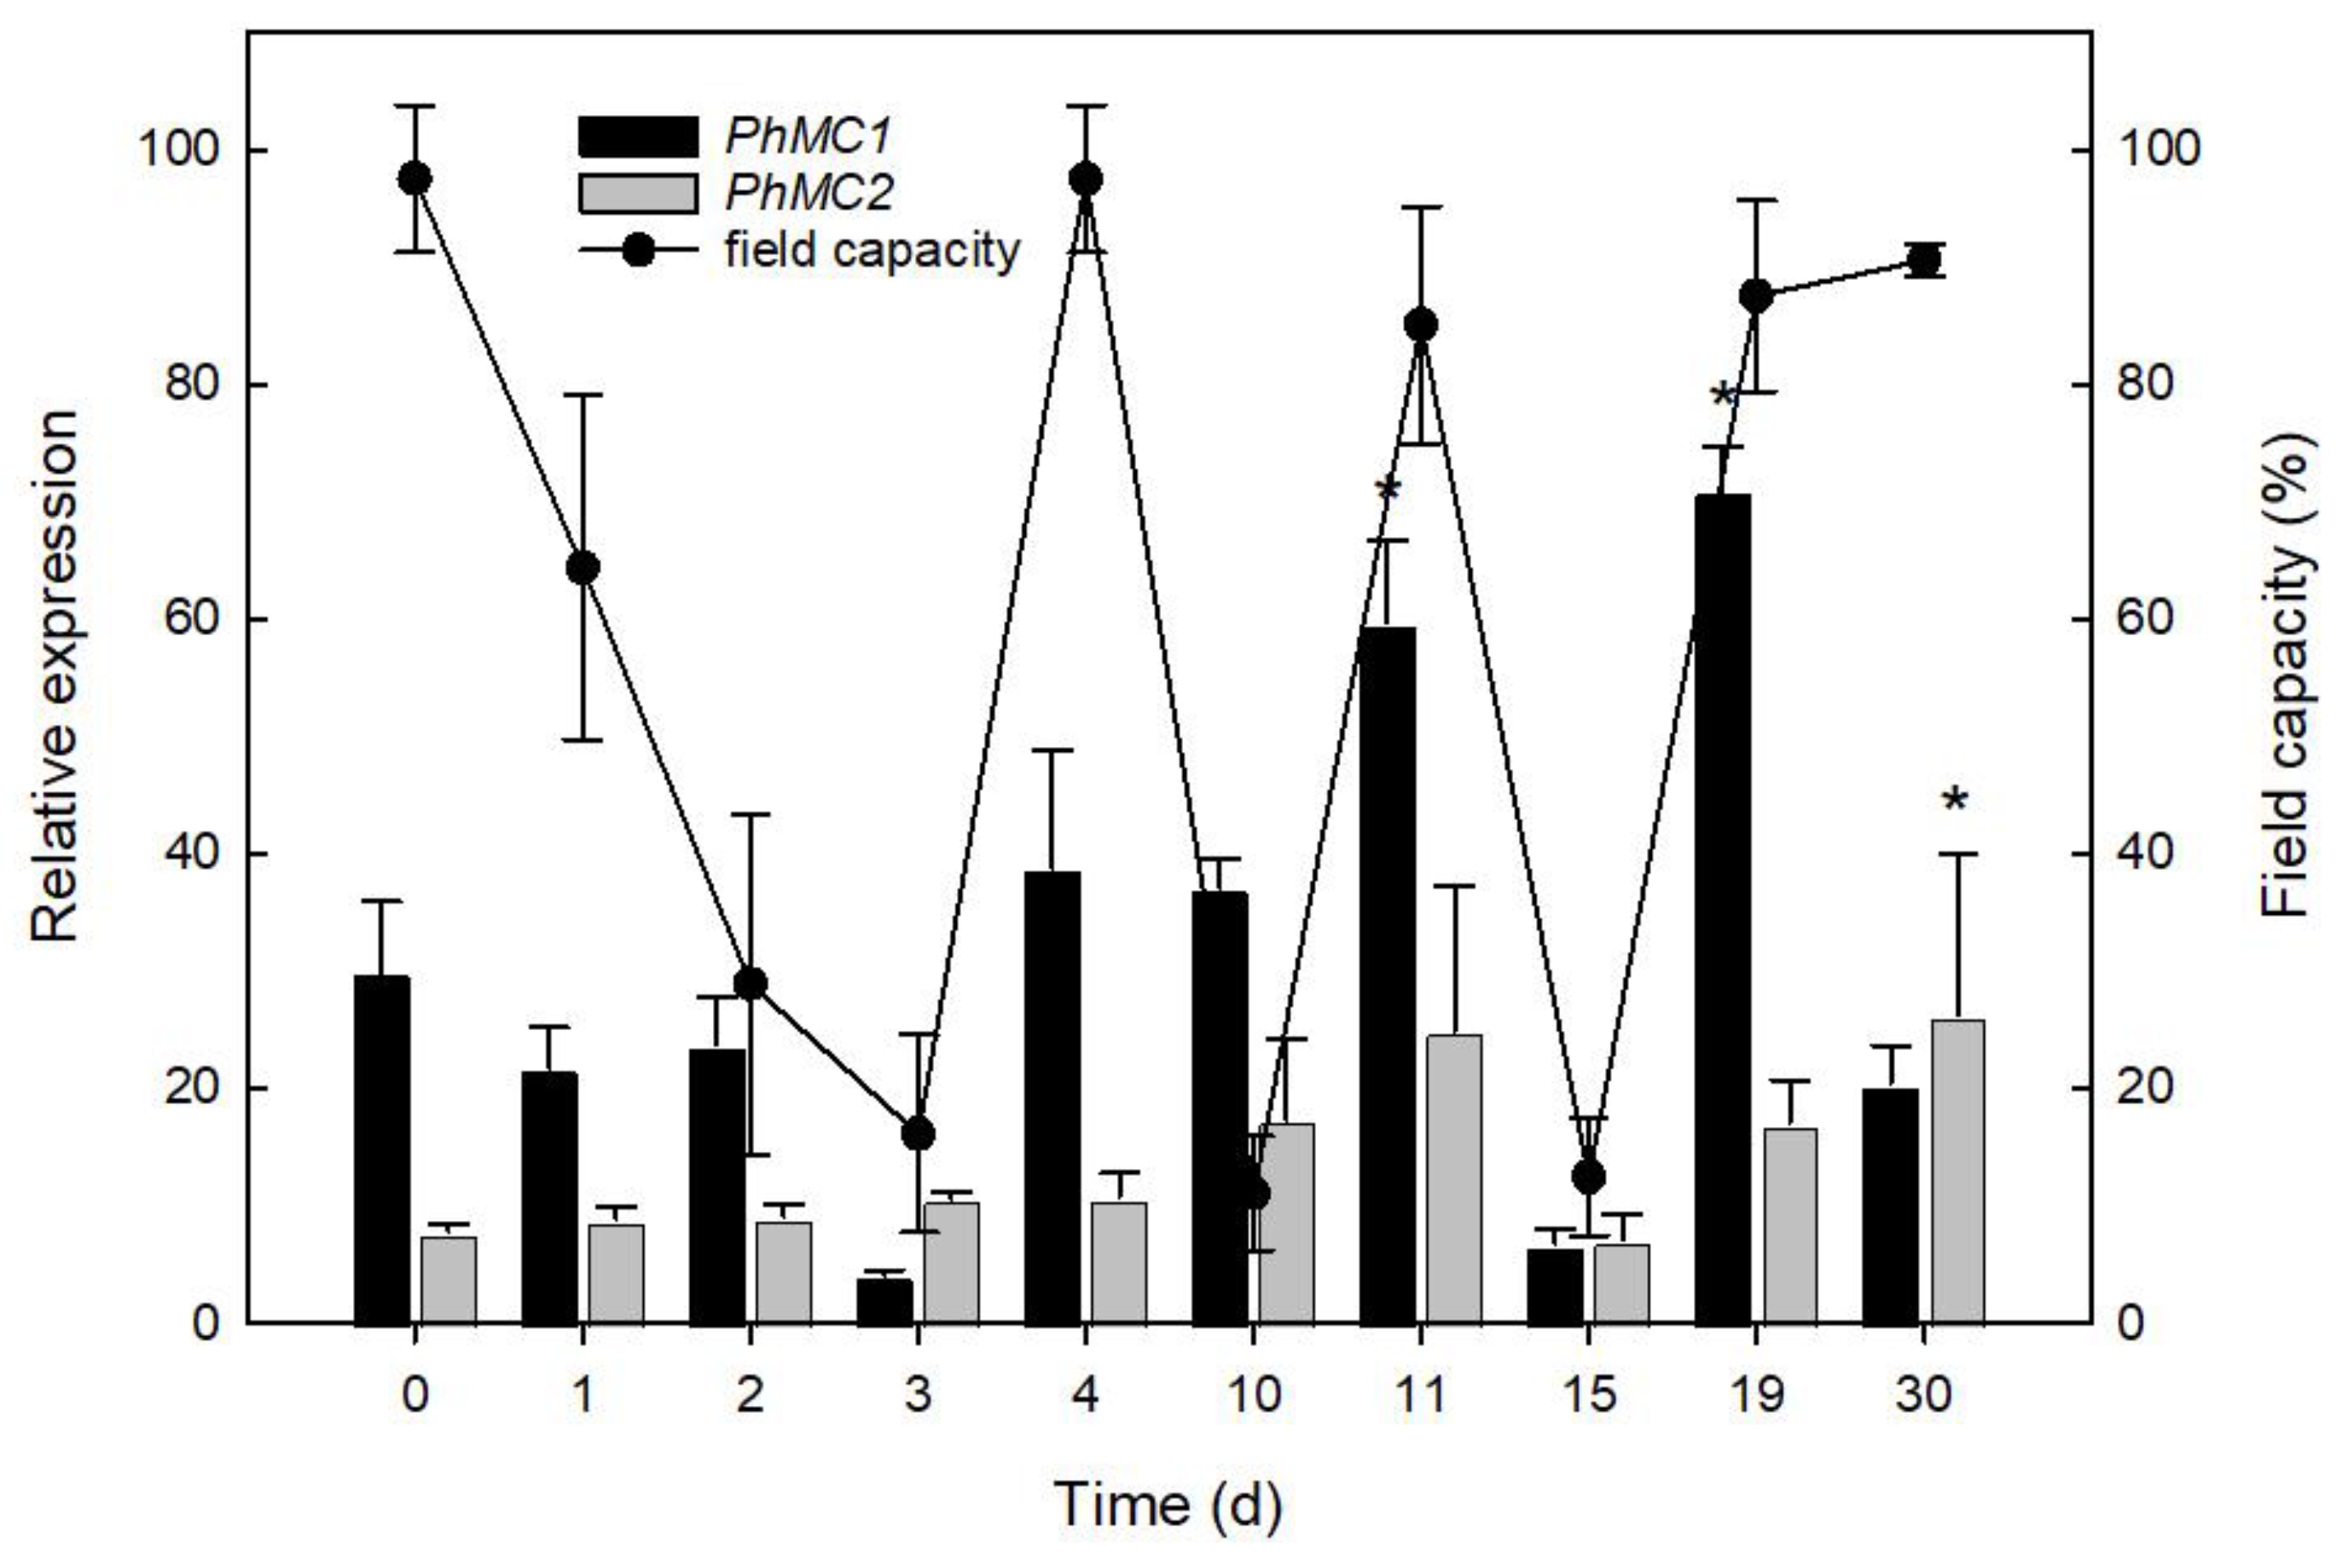
To investigate the effect of drought stress on PhMC1 and PhMC2 expression, flowering petunia plants were subjected to three cycles of water deficit and recovery. During the first dry down period, as the soil moisture content went from around 78% to 10% (from 0 to 3 days), PhMC1 gene expression decreased, while PhMC2 remained the same (Figure 8). After the plants had been fully wilted for one day (day 3), they were irrigated, and soil moisture content increased. On day 4, plants had regained turgidity (i.e., the recovery phase), and PhMC1 transcript levels increased to pre-stress levels. In subsequent recovery phases PhMC1 transcript levels increased, and the highest expression was detected during the third recovery phase (19 days). PhMC2 expression showed little change until the second recovery cycle where transcript levels were increased compared to 0 days. At the end of the experiment (day 30) when leaf yellowing was observed, PhMC2 expression remained higher than 0 days. In contrast, expression of PhMC1 at 30 days was not significantly different than unstressed plants at 0 days (before the drought stress treatment began). Transcript abundance of both PhMC1 and PhMC2 in the leaves of continually irrigated control plants remained unchanged from day 0 to day 30 (data not shown).

4. Discussion

Metacaspases have an important functional role in the regulation and execution of PCD during plant development and during plant responses to biotic and abiotic stresses [13]. Sequence and structural similarities and phylogenetic analyses support the conclusion that PhMC1 [23] and PhMC2 (this paper) encode a type I and a type II metacaspase, respectively. Unlike their animal counterparts, the caspases, which cleave their substrates at an aspartate residue, the metacaspases are cysteine proteases that cleave substrates after lysine or arginine [29]. Plant metacaspases also have the conserved histidine/cysteine catalytic dyad that is found in the caspase p20 domain. In support of their identification as metacaspases, both PhMC1 and PhMC2 had specificity for substrates with an arginine (GRR) rather than an aspartate (DEVD) at the P1 position, and GRRase activity required the catalytic cysteine in the p20 domain (Figure 2 and [23]).
The metacaspases are multifunctional proteins that regulate PCD during development and in response to abiotic and biotic stress [10]. Developmental PCD allows for the maintenance of cellular homeostasis by removing and recycling damaged, aging, or unneeded cellular components [13]. Arabidopsis contains three type I and six type II metacaspases [3], and these genes are differentially regulated throughout the plant [30]. Experiments characterizing metacaspases in tomato (8), rice (8) (Oryza sativa), potato (8) and grape (6) (Vitis vinifera) also identified tissue, organ, and stimulus specific expression patterns [14,15,31,32]. PhMC1 and PhMC2 were cloned from petal tissues, but their expression was not specific to the flower. Both genes were also expressed in vegetative tissues and were induced by both abiotic and biotic stresses.
Quantitative PCR indicated that PhMC1 and PhMC2 were differentially expressed during flower development. PhMC1 was expressed at low basal levels in non-senescing corollas, and maximum expression was detected when corollas were visibly senescent ([23] and this paper Figure 3B). In contrast, PhMC2 transcripts were higher in younger corollas before the visible onset of senescence (Figure 3C). PhMC2 may be involved in cell maintenance and turnover during young tissue development, while PhMC1, which was upregulated by exogenous ethylene treatment, may have a role in cellular degradation at the later stages of senescence that occur concomitant with ethylene production from the corolla [23]. The upregulation of genes involved in senescence signaling occurs early in flower development before the senescence symptoms of wilting, inrolling, or color fading are visualized in the petals [33]. PhMC2 may be involved in regulating early senescence signaling during the aging of unpollinated flowers, and its regulation may be controlled by developmental signals rather than ethylene. Alternatively, PhMC2 may function as a suppressor of cell death in younger flower petals, inhibiting necrosis and allowing for the systematic disassembly and remobilization of nutrients from petals via vacuolar type cell death. The type II metacaspase, PhMC2, may also function during flower petal senescence by cleaving and activating other downstream substrates, including PhMC1, that have a direct role in programmed cell death. Ethylene production within the flower is required for the timely execution of the senescence program in the corollas of many flowers [22]. The role of ethylene in the regulation of PhMC1, but not PhMC2, was supported by the expression patterns observed in the corollas of ethylene insensitive transgenic petunias (Figure 3B and C). In addition, the expression of PhMC2 in corollas was not upregulated by treating flowers with exogenous ethylene (Jones, unpublished). The role of PhMC1 in senescence may be similar to the cellular degradation function of AtMC9. AtMC9 is not involved in the initiation of cell death, but it is part of a postmortem proteolytic cascade that is required for the progression of autolysis during xylem vessel element cell death [34]. Supporting a role for PhMC1 in flower tissue senescence, PhMC1 transcripts were also upregulated at 72 h after pollination in styles, a tissue that senesces shortly after pollination, while it was not upregulated in pollinated ovaries that are growing and developing into a fruit (Figure 4A). The opposite pattern of expression was observed for PhMC2, which was upregulated in pollinated ovaries but not in senescing styles.
Bacterial and fungal pathogen infection has been shown to induce the expression of various metacaspase gene family members in multiple plant species [20,27,30,32,35,36,37,38,39,40]. In petunia, it was the type II metacaspase PhMC2 that was upregulated to the greatest extent following inoculation with the necrotrophic fungi, Botrytis cinerea. Similarly, a type II metacaspase, LeMCA1 (redesignated SlMC7 by Liu et al. [14]), from tomato shows increased expression that correlates with the formation of necrotic lesions on botrytis infected leaves. LeMCA1 is not induced by ethylene treatment of the leaves, suggesting that similar to PhMC2, it is not regulated via ethylene signaling pathways [27]. Suppression of the type II metacaspase CaMC9 from pepper (Capsicum annuum) using virus-induced gene silencing (VIGS) increases disease resistance and suppresses the development of cell death symptoms following inoculation with virulent bacterial pathogens. CaMC9 is expressed in both leaves and flowers and is also not induced by ethylene treatment [37]. In Arabidopsis, AtMC1 and AtMC2 act antagonistically to control pathogen-triggered programmed cell death. The positive regulation of cell death by AtMC1 requires the catalytic cysteine residue, while AtMC2 is a negative regulator of AtMC1 that does not require catalytic activity for cell death suppression [35,36,41].
Various abiotic stresses, including drought (desiccation) and salinity (NaCl) lead to accelerated PCD and the enhanced expression of metacaspase genes [10]. In the shoots of 3-week-old petunia seedlings, treatment with 100 mM NaCl induced PhMC1 expression by 0.5 h with a return to control levels at 24 h (Figure 6). In contrast, PhMC2 showed a slower and lesser upregulation. PhMC1 may be functioning during abiotic stress to induce antioxidant defense pathways that protect plants from oxidative damage and delay or prevent cell death and tissue senescence. Upregulation of the senescence associated cysteine protease PhCP10 in petunia seedlings is observed at 24 h of treatment with 100 mM NaCl when PhMC1 expression has returned to basal levels ([28] and Figure 6). These expression patterns support a role for PhMC1 in plant protection rather than cell death during stress responses in vegetative tissues. A similar seedling experiment in tomato determined that multiple type I and type II metacaspases (SlMC1, SlMC5, SlMC6, SlMC7, and SlMC8) have some level of upregulation in leaves during salinity stress (200 mM NaCl) [14]. In the monocot rice, salt stress downregulates the expression of all OsMC genes in leaves, but it upregulates OsMC1 and OsMC7 in roots [38]. Silencing the salt-responsive metacaspase TaMCA-1d in wheat (Triticum aestivum) enhances seedling sensitivity to salt stress, reducing the activity of superoxide dismutase, peroxidase, and catalase. When exposed to salt stress, the TaMCA-1d- silenced plants had more injury to photosystem II, increased PCD and increased autophagy activity [42].
In tomato, all but one (SlMC3) of the eight metacaspase genes in the genome were upregulated to some extent by drought (desiccation) stress in the leaves of 6-week-old seedlings [14]. The type I metacaspase, SlMC5, had the greatest increase in relative expression at 6 h of drought treatment followed by the type II metacaspase SlMC7 [14]. Differential regulation of metacaspases during drought has been reported for many plant species, but most of these experiments have evaluated desiccation stress in seedlings or young plants [13]. In our experiment, we subjected mature, flowering petunia plants to three cycles of water deficit (Figure 8). During the first dry down, expression of both PhMC1 and PhMC2 were similar to pre-stress levels. It was during the recovery, after irrigation was resumed and during the subsequent dry down cycles that expression of PhMC1 and then PhMC2 increased in leaves. During drought stress in mature leaves, PhMC1 and PhMC2 may be involved in repair and recycling of damaged cell components as part of the pro-survival function of metacaspases. In barley (Hordeum vulgare), it was proposed that silencing MC1 promoted drought tolerance by repressing programmed cell death [43].
There is increasing evidence that metacaspase pathways and autophagy pathways are functioning in parallel to regulate programmed cell death during development and senescence [20]. Autophagy was first discovered as an adaptive mechanism employed by yeast to facilitate the recycling of nutrients for survival during nutrient starvation [44]. Despite this connection, few characterizations of metacaspases have investigated gene expression in plants under nutrient starvation. Both PhMC1 and PhMC2 were upregulated to different extents in leaves when petunias were grown under N and P deficient conditions (Figure 7). These results suggest that both metacaspases are involved in resource recycling during nutrient starvation. In petunia, the autophagy genes PhATG8a and PhATG6 were also upregulated by N and P deficiency [28]. In further support of this interaction, silencing the PhATG6 gene in petunia reduces expression of PhMC1 in senescing corollas [45].
Research in many plant species has shown that both type I and type II metacaspases are involved in both developmentally regulated and stress induced PCD [13,46]. In this study we have reported on a type I and a type II metacaspase from petunia that were upregulated in flowers and leaves during aging and following abiotic and biotic stresses. Based on gene expression patterns, both metacaspases play a role in stress responses and senescence, but metacaspases are also regulated by post-translational modifications, interactions with other proteins, and the presence of ions like Ca2+ [8,10,18]. The expression patterns of PhMC2 during petal development and following botrytis inoculation suggest a protective function, while expression patterns of PhMC1 during petal senescence and following abiotic stress treatments support a role in the execution of programmed cell death. Further insights into the degradome in petunia are needed to elucidate the specific functional role of these individual metacaspases. Metacaspases have an integral role in the lives of plants as they function to balance cell survival and PCD during normal development and in response to environmental stress and pathogen attack. Continued research is needed to precisely harness the pro-survival and cell death function of metacaspases to improve horticulture crop production and quality.

Supplementary Materials

The following supporting information can be downloaded at: https://www.mdpi.com/article/10.3390/horticulturae8121151/s1, Table S1: Primers used for cloning and characterization of metacaspases.

Author Contributions

Conceptualization, L.J.C. and M.L.J.; methodology, L.J.C. and M.L.J.; formal analysis, L.J.C.; investigation, L.J.C.; resources, M.L.J.; writing—original draft preparation, M.L.J.; writing—review and editing, L.J.C.; visualization, L.J.C.; supervision, M.L.J.; project administration, M.L.J.; funding acquisition, M.L.J. All authors have read and agreed to the published version of the manuscript.

Funding

This research was funded by an Ohio Agricultural Research and Development Center (OARDC) SEED Grant, The Ohio State University D.C. Kiplinger Endowment, and the USDA Floriculture and Nursery Research Initiative. Salaries and research support were provided in part by State and Federal funds appropriated to the College of Food, Agricultural, and Environmental Sciences, The Ohio State University.

Data Availability Statement

Sequence data for PhMC2 can be found in the GenBank database Accession# JQ314005.

Acknowledgments

We would like to thank Youyoun Moon (West Virginia University) for his contributions and David Clark (University of Florida) for the 35S::etr1-1 petunia seeds.

Conflicts of Interest

The authors declare no conflict of interest.

References

  1. Fischer, U.; Jänicke, R.U.; Schulze-Osthoff, K. Many Cuts to Ruin: A Comprehensive Update of Caspase Substrates. Cell Death Differ. 2003, 10, 76–100. [Google Scholar] [CrossRef] [Green Version]
  2. Uren, A.; O’Rourke, K.; Aravind, L.; Pisabarro, M.; Seshagiri, S.; Koonin, E.; Dixit, V. Identification of Paracaspases and Metacaspases: Two Ancient Families of Caspase-like Proteins, One of Which Plays a Key Role in MALT Lymphoma. Mol. Cell 2000, 6, 961–967. [Google Scholar] [CrossRef] [PubMed]
  3. Vercammen, D.; van de Cotte, B.; de Jaeger, G.; Eeckhout, D.; Casteels, P.; Vandepoele, K.; Vandenberghe, I.; van Beeumen, J.; Inzé, D.; van Breusegem, F. Type II Metacaspases Atmc4 and Atmc9 of Arabidopsis thaliana Cleave Substrates after Arginine and Lysine. J. Biol. Chem. 2004, 279, 45329–45336. [Google Scholar] [CrossRef] [PubMed] [Green Version]
  4. Bozhkov, P.V.; Suarez, M.F.; Filonova, L.H.; Daniel, G.; Zamyatnin, A.A.; Rodriguez-Nieto, S.; Zhivotovsky, B.; Smertenko, A. Cysteine Protease McII-Pa Executes Programmed Cell Death during Plant Embryogenesis. Proc. Natl. Acad. Sci. USA 2005, 4, 14463–14468. [Google Scholar] [CrossRef] [PubMed] [Green Version]
  5. Watanabe, N.; Lam, E. Two Arabidopsis Metacaspases AtMCP1b and AtMCP2b Are Arginine/Lysine-Specific Cysteine Proteases and Activate Apoptosis-like Cell Death in Yeast. J. Biol. Chem. 2005, 280, 14691–14699. [Google Scholar] [CrossRef] [Green Version]
  6. Vercammen, D.; Belenghi, B.; van de Cotte, B.; Beunens, T.; Gavigan, J.A.; de Rycke, R.; Brackenier, A.; Inzé, D.; Harris, J.L.; van Breusegem, F. Serpin1 of Arabidopsis thaliana is a Suicide Inhibitor for Metacaspase 9. J. Mol. Biol. 2006, 364, 625–636. [Google Scholar] [CrossRef]
  7. Choi, C.J.; Berges, J.A. New Types of Metacaspases in Phytoplankton Reveal Diverse Origins of Cell Death Proteases. Cell Death Dis. 2013, 4, e490. [Google Scholar] [CrossRef] [Green Version]
  8. Klemenčič, M.; Funk, C. Type III Metacaspases: Calcium-Dependent Activity Proposes New Function for the P10 Domain. New Phytol. 2018, 218, 1179–1191. [Google Scholar] [CrossRef] [Green Version]
  9. Huh, S.U. Evolutionary Diversity and Function of Metacaspases in Plants: Similar to but not Caspases. Int. J. Mol. Sci. 2022, 23, 4588. [Google Scholar] [CrossRef]
  10. Tsiatsiani, L.; van Breusegem, F.; Gallois, P.; Zavialov, A.; Lam, E.; Bozhkov, P. Metacaspases. Cell Death Differ. 2011, 18, 1279–1288. [Google Scholar] [CrossRef] [Green Version]
  11. Castillo-Olamendi, L.; Bravo-Garcìa, A.; Morán, J.; Rocha-Sosa, M.; Porta, H. AtMCP1b, a Chloroplast-Localised Metacaspase, Is Induced in Vascular Tissue after Wounding or Pathogen Infection. Funct. Plant Biol. 2007, 34, 1061–1071. [Google Scholar] [CrossRef] [PubMed] [Green Version]
  12. He, R.; Drury, G.E.; Rotari, V.I.; Gordon, A.; Willer, M.; Farzaneh, T.; Woltering, E.J.; Gallois, P. Metacaspase-8 Modulates Programmed Cell Death Induced by Ultraviolet Light and H2O2 in Arabidopsis. J. Biol. Chem. 2008, 283, 774–783. [Google Scholar] [CrossRef] [PubMed] [Green Version]
  13. Basak, S.; Kundu, P. Plant Metacaspases: Decoding Their Dynamics in Development and Disease. Plant Physiol. Biochem. 2022, 180, 50–63. [Google Scholar] [CrossRef] [PubMed]
  14. Liu, H.; Liu, J.; Wei, Y. Identification and Analysis of the Metacaspase Gene Family in Tomato. Biochem. Biophys. Res. Commun. 2016, 479, 523–529. [Google Scholar] [CrossRef] [PubMed]
  15. Dubey, N.; Trivedi, M.; Varsani, S.; Vyas, V.; Farsodia, M.; Singh, S.K. Genome-Wide Characterization, Molecular Evolution and Expression Profiling of the Metacaspases in Potato (Solanum tuberosum L.). Heliyon 2019, 5, 1162. [Google Scholar] [CrossRef] [Green Version]
  16. Lee, R.E.C.; Puente, L.G.; Kærn, M.; Megeney, L.A. A Non-Death Role of the Yeast Metacaspase: Yca1p Alters Cell Cycle Dynamics. PLoS ONE 2008, 3, e2956. [Google Scholar] [CrossRef] [Green Version]
  17. Lee, R.E.C.; Brunette, S.; Puente, L.G.; Megeney, L.A. Metacaspase Yca1 Is Required for Clearance of Insoluble Protein Aggregates. Proc. Natl. Acad. Sci. USA 2010, 107, 13348–13353. [Google Scholar] [CrossRef] [Green Version]
  18. Tsiatsiani, L.; Timmerman, E.; de Bock, P.J.; Vercammen, D.; Stael, S.; van de Cotte, B.; Staes, A.; Goethals, M.; Beunens, T.; van Damme, P.; et al. The Arabidopsis METACASPASE9 Degradome. Plant Cell 2013, 25, 2831–2847. [Google Scholar] [CrossRef] [Green Version]
  19. Wrzaczek, M.; Vainonen, J.P.; Stael, S.; Tsiatsiani, L.; Help-Rinta-Rahko, H.; Gauthier, A.; Kaufholdt, D.; Bollhöner, B.; Lamminmäki, A.; Staes, A.; et al. GRIM REAPER Peptide Binds to Receptor Kinase PRK 5 to Trigger Cell Death in Arabidopsis. EMBO J. 2015, 34, 55–66. [Google Scholar] [CrossRef] [Green Version]
  20. Coll, N.S.; Smidler, A.; Puigvert, M.; Popa, C.; Valls, M.; Dangl, J.L. The Plant Metacaspase AtMC1 in Pathogen-Triggered Programmed Cell Death and Aging: Functional Linkage with Autophagy. Cell Death Differ. 2014, 21, 1399–1408. [Google Scholar] [CrossRef]
  21. Chapin, L.; Jones, M.L. Nutrient Remobilization during Pollination-Induced Corolla Senescence in Petunia. Acta Hortic. 2007, 755. [Google Scholar] [CrossRef]
  22. Jones, M.L.; Stead, A.D.; Clark, D.G. Petunia Flower Senescence. In Petunia: A Model System for Comparative Research; Gerats, T., Strommer, J., Eds.; Springer: New York, NY, USA, 2009; pp. 301–324. [Google Scholar]
  23. Chapin, L.J.; Moon, Y.; Jones, M.L. Downregulating a Type I Metacaspase in Petunia Accelerates Flower Senescence. J. Am. Soc. Hortic. Sci. 2017, 142, 405–414. [Google Scholar] [CrossRef] [Green Version]
  24. Goujon, M.; McWilliam, H.; Li, W.; Valentin, F.; Squizzato, S.; Paern, J.; Lopez, R. A New Bioinformatics Analysis Tools Framework at EMBL-EBI. Nucleic. Acids. Res. 2010, 38, W695–W699. [Google Scholar] [CrossRef] [PubMed]
  25. Sievers, F.; Wilm, A.; Dineen, D.; Gibson, T.J.; Karplus, K.; Li, W.; Lopez, R.; McWilliam, H.; Remmert, M.; Söding, J.; et al. Fast, Scalable Generation of High-Quality Protein Multiple Sequence Alignments Using Clustal Omega. Mol. Syst. Biol. 2011, 7, 539. [Google Scholar] [CrossRef] [PubMed]
  26. Heckman, K.L.; Pease, L.R. Gene Splicing and Mutagenesis by PCR-Driven Overlap Extension. Nat. Protoc. 2007, 2, 924–932. [Google Scholar] [CrossRef]
  27. Hoeberichts, F.A.; Have, A.T.; Woltering, E.J. A Tomato Metacaspase Gene is Upregulated during Programmed Cell Death in Botrytis Cinerea-Infected Leaves. Planta 2003, 217, 517–522. [Google Scholar] [CrossRef]
  28. Quijia Pillajo, J.O.; Chapin, L.J.; Jones, M.L. Senescence and Abiotic Stress Induce Expression of Autophagy-Related Genes in Petunia. J. Am. Soc. Hortic. Sci. 2018, 143, 154–163. [Google Scholar] [CrossRef] [Green Version]
  29. Vercammen, D.; Declercq, W.; Vandenabeele, P.; van Breusegem, F. Are Metacaspases Caspases? J. Cell Biol. 2007, 179, 375–380. [Google Scholar] [CrossRef]
  30. Kwon, S.I.; Hwang, D.J. Expression Analysis of the Metacaspase Gene Family in Arabidopsis. J. Plant Biol. 2013, 56, 391–398. [Google Scholar] [CrossRef]
  31. Zhang, C.; Gong, P.; Wei, R.; Li, S.; Zhang, X.; Yu, Y.; Wang, Y. The Metacaspase Gene Family of Vitis vinifera L.: Characterization and Differential Expression during Ovule Abortion in Stenospermocarpic Seedless Grapes. Gene 2013, 528, 267–276. [Google Scholar] [CrossRef]
  32. Wang, L.; Zhang, H. Genomewide Survey and Characterization of Metacaspase Gene Family in Rice (Oryza sativa). J. Genet. 2014, 93, 93–102. [Google Scholar] [CrossRef] [PubMed]
  33. Broderick, S.R.; Wijeratne, S.; Wijeratn, A.J.; Chapin, L.J.; Meulia, T.; Jones, M.L. RNA-Sequencing Reveals Early, Dynamic Transcriptome Changes in the Corollas of Pollinated Petunias. BMC Plant Biol. 2014, 14, 1–21. [Google Scholar] [CrossRef] [Green Version]
  34. Bollhöner, B.; Zhang, B.; Stael, S.; Denancé, N.; Overmyer, K.; Goffner, D.; van Breusegem, F.; Tuominen, H. Post Mortem Function of AtMC9 in Xylem Vessel Elements. New Phytol. 2013, 200, 498–510. [Google Scholar] [CrossRef] [PubMed]
  35. Coll, N.S.; Vercammen, D.; Smidler, A.; Clover, C.; van Breusegem, F.; Dangl, J.L.; Epple, P. Arabidopsis Type I Metacaspases Control Cell Death. Science 2010, 330, 1393–1397. [Google Scholar] [CrossRef] [PubMed]
  36. Watanabe, N.; Lam, E. Arabidopsis Metacaspase 2d Is a Positive Mediator of Cell Death Induced during Biotic and Abiotic Stresses. Plant J. 2011, 66, 969–982. [Google Scholar] [CrossRef] [PubMed]
  37. Kim, S.M.; Bae, C.; Oh, S.K.; Choi, D. A Pepper (Capsicum annuum L.) Metacaspase 9 (Camc9) Plays a Role in Pathogen-Induced Cell Death in Plants. Mol. Plant Pathol. 2013, 14, 557–566. [Google Scholar] [CrossRef] [PubMed]
  38. Huang, L.; Zhang, H.; Hong, Y.; Liu, S.; Li, D.; Song, F. Stress-Responsive Expression, Subcellular Localization and Protein–Protein Interactions of the Rice Metacaspase Family. Int. J. Mol. Sci. 2015, 16, 16216–16241. [Google Scholar] [CrossRef] [Green Version]
  39. Hao, Y.; Wang, X.; Wang, K.; Li, H.; Duan, X.; Tang, C.; Kang, Z. TaMCA1, a Regulator of Cell Death, Is Important for the Interaction between Wheat and Puccinia striiformis. Sci. Rep. 2016, 6, 26946. [Google Scholar] [CrossRef] [Green Version]
  40. Ma, S.; Shi, H.; Wang, G.F. The Potential Roles of Different Metacaspases in Maize Defense Response. Plant Signal. Behav. 2021, 16, 1906574. [Google Scholar] [CrossRef]
  41. Watanabe, N.; Lam, E. Calcium-Dependent Activation and Autolysis of Arabidopsis Metacaspase 2d. J. Biol. Chem. 2011, 286, 10027–10040. [Google Scholar] [CrossRef]
  42. Yue, J.Y.; Wang, Y.J.; Jiao, J.L.; Wang, W.W.; Wang, H.Z. The Metacaspase TaMCA-Id Negatively Regulates Salt-Induced Programmed Cell Death and Functionally Links with Autophagy in Wheat. Front. Plant Sci. 2022, 13. [Google Scholar] [CrossRef] [PubMed]
  43. Shamloo-Dashtpagerdi, R.; Lindlöf, A.; Aliakbari, M.; Pirasteh-Anosheh, H. Plausible Association between Drought Stress Tolerance of Barley (Hordeum vulgare L.) and Programmed Cell Death via MC1 and TSN1 Genes. Physiol. Plant. 2020, 170, 46–59. [Google Scholar] [CrossRef] [PubMed]
  44. Ohsumi, Y. Historical Landmarks of Autophagy Research. Cell Res. 2014, 24, 9–23. [Google Scholar] [CrossRef] [PubMed] [Green Version]
  45. Lin, Y.; Jones, M.L. Silencing ATG6 and PI3K Accelerates Petal Senescence and Reduces Flower Number and Shoot Biomass in Petunia. Plant Sci. 2021, 302, 110713. [Google Scholar] [CrossRef]
  46. Fagundes, D.; Bohn, B.; Cabreira, C.; Leipelt, F.; Dias, N.; Bodanese-Zanettini, M.H.; Cagliari, A. Caspases in Plants: Metacaspase Gene Family in Plant Stress Responses. Funct. Integr. Genom. 2015, 15, 639–649. [Google Scholar] [CrossRef] [PubMed]
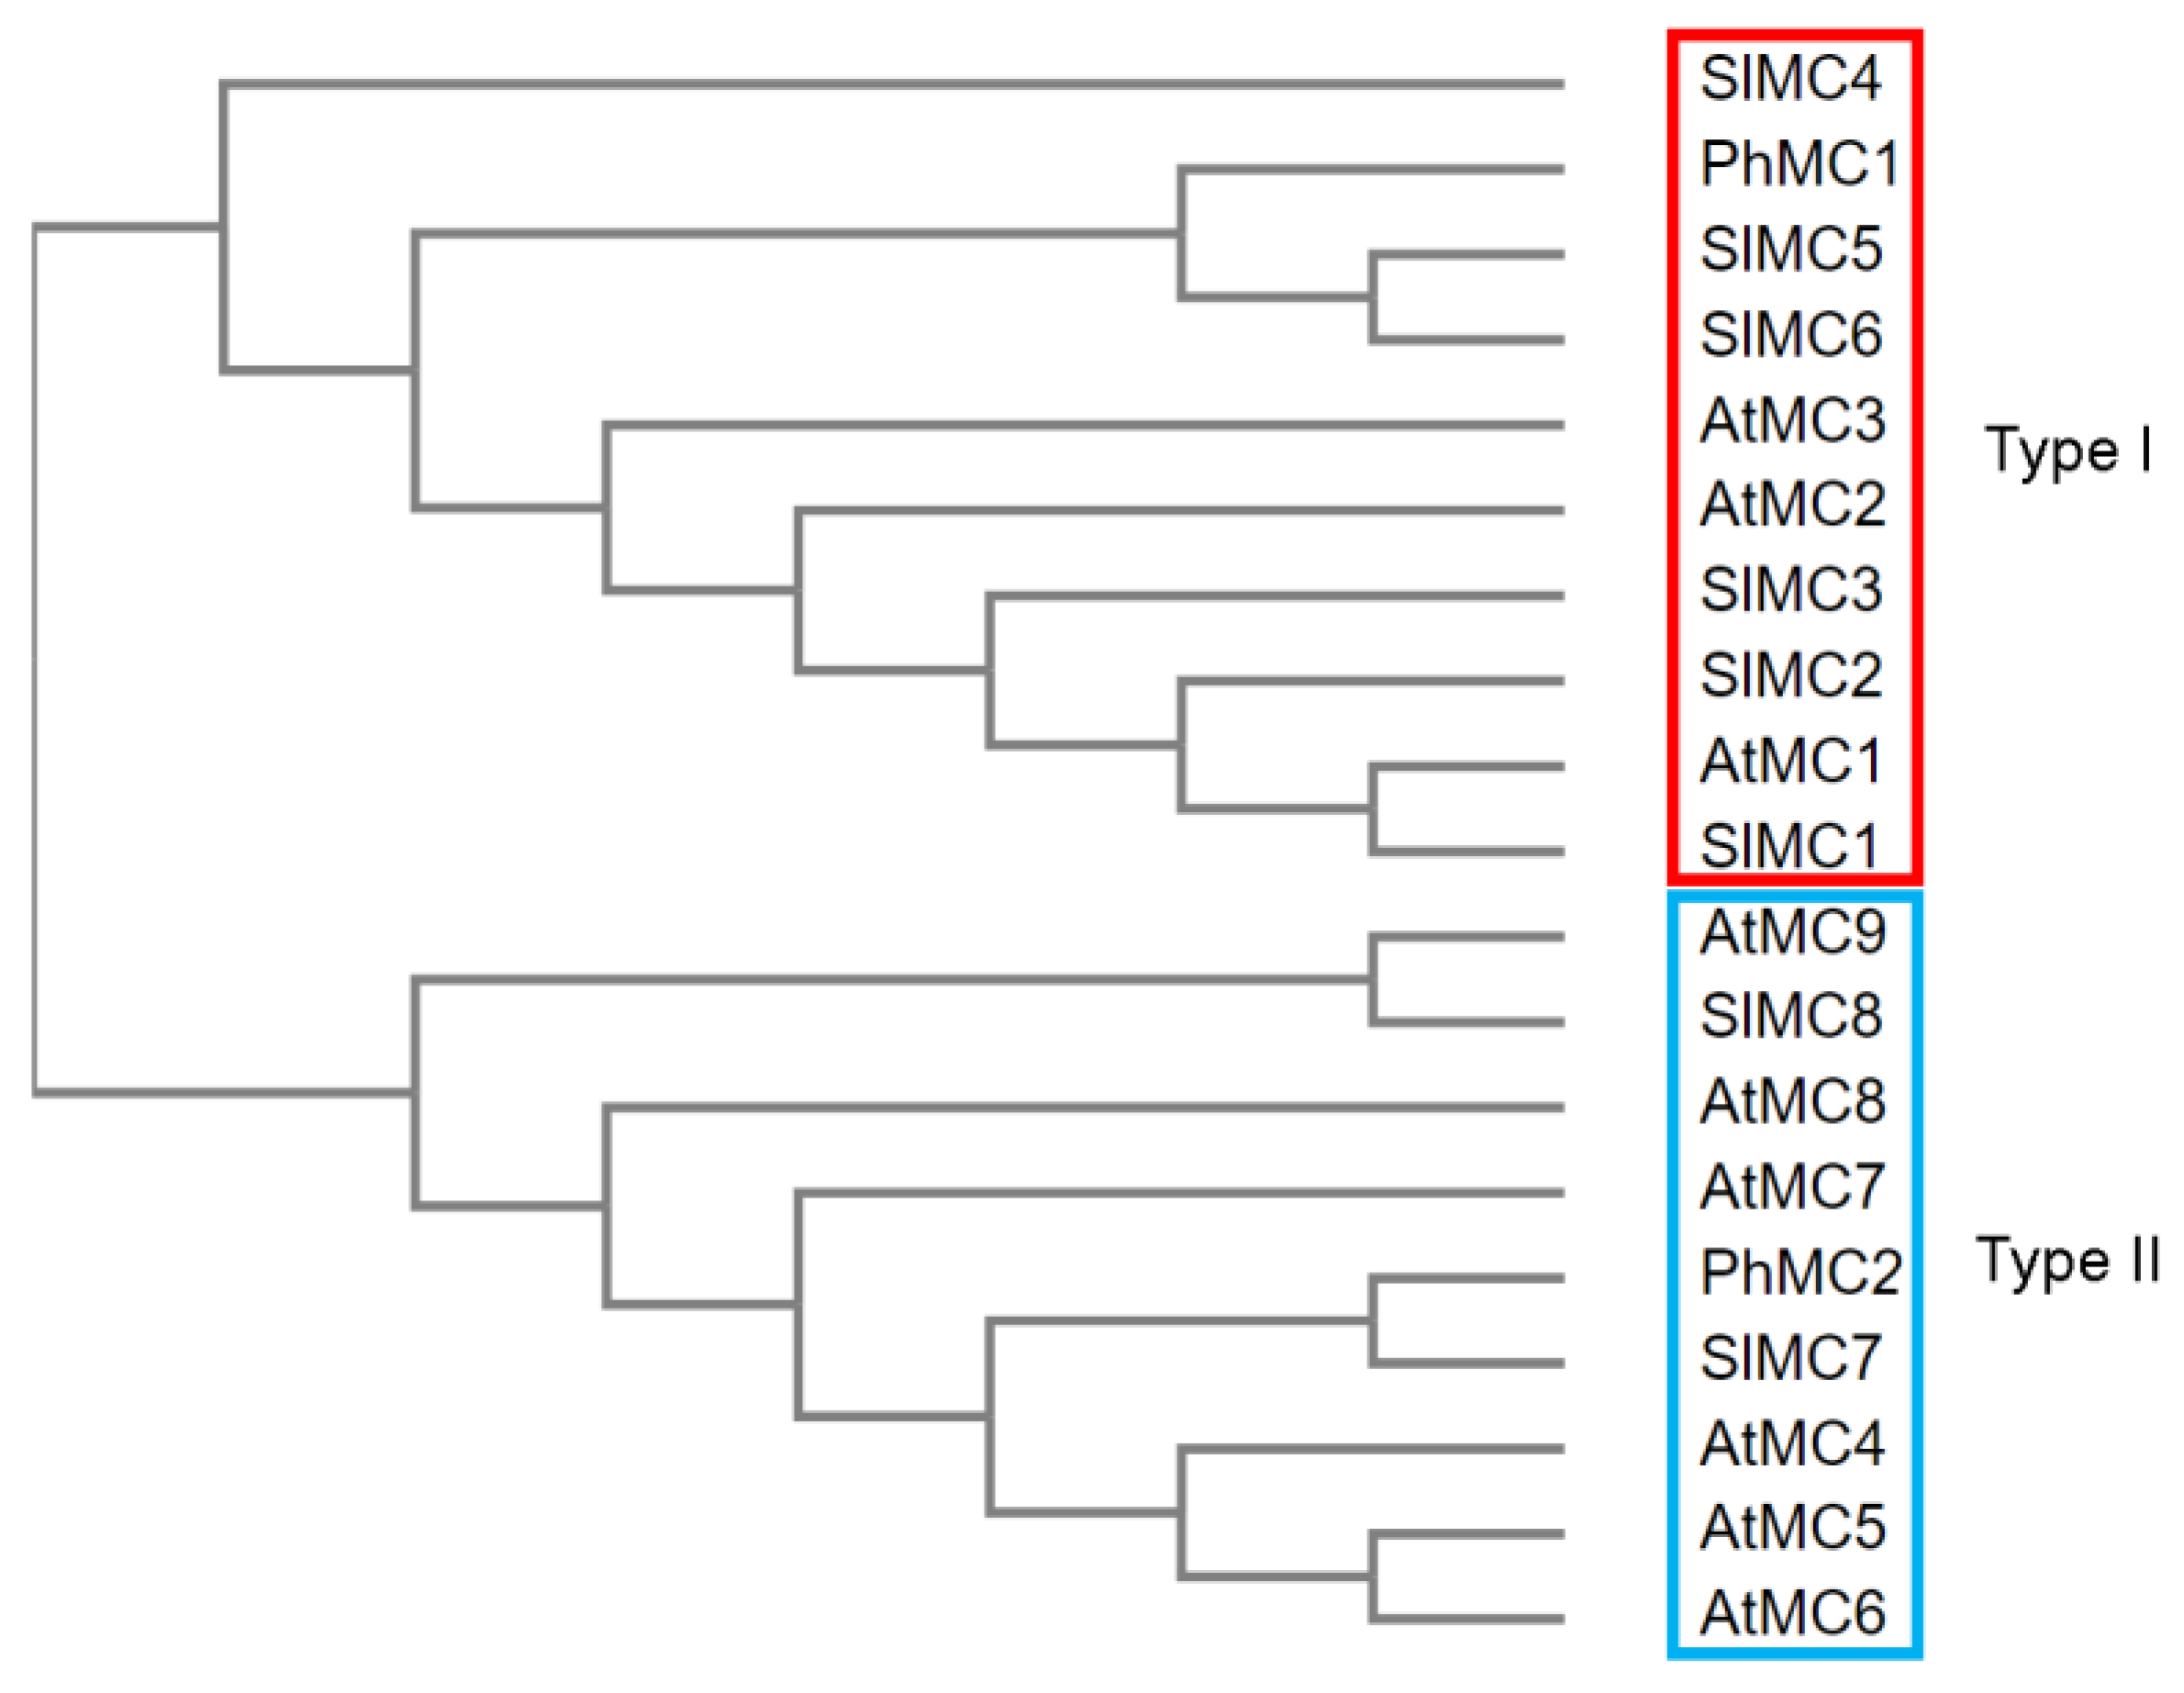
Figure 1. Neighbor-joining phylogenetic tree of type I (red box) and type II metacaspases (blue box). Amino acid sequences or the predicted protein translations are from petunia (PhMC1, GenBank# AFK93070; PhMC2, AFK93071), Arabidopsis (AtMC1, GeneBank# NP_171719; AtMC2, NP_194241; AtMC3, NP_851262; AtMC4, NP_178052; AtMC5, NP_178051; AtMC6, NP_178050; AtMC7, NP_178049; AtMC8, NP_173092; and AtMC9, NP_196040) and tomato (SlMC1, SGN locus name Solyc01g088710; SlMC2, Solyc03g094160, SlMC3, Solyc05g052130; SlMC4, Solyc01g105320; SlMC5, Solyc01g105300; SlMC6, Solyc01g105310; SlMC7, Solyc09g098150; SlMC8, Solyc10g081300).
Horticulturae 08 01151 g001
Figure 2. Enzyme activity of PhMC2. (A) Substrate specificity of rPhMC2 was determined using the fluorogenic protease substrate Boc-GRR-AMC and the fluorogenic caspase substrate Ac-DEVD-AMC at various pH. (B) The activity of rPhMC2 against Boc-GRR-AMC (GRRase activity) at pH 8.0 in the presence of the cysteine protease inhibitor, iodoacetamide, or the arginal protease inhibitor, leupeptin. (C) GRRase activity of rPhMC2 and the mutant metacaspase PhMC2C139A (catalytic cysteine converted to alanine) at pH 8.0. Relative enzyme activity is the percentage of the activity compared to the highest activity. All data are the means of three replicates ± SE (n = 3). Different letters represent statistically significant difference between the means (p ≤ 0.05).
Horticulturae 08 01151 g002
Figure 3. Metacaspase gene expression during corolla development. (A) Petunia × hybrida ‘Mitchell Diploid’ (MD) and ethylene insensitive transgenic petunia (35S::etr1-1 line 44568) flower development from anthesis (0 days) through senescence and corolla wilting. Numbers indicate the days after anthesis or flower opening. Transcript levels (mean ± SD, n = 3) of (B) PhMC1 and (C) PhMC2 in MD and etr1-1 corollas during flower development. Relative mRNA abundance compared to PhACTIN was determined by quantitative PCR. All data are the means of three replicates ± SE (n = 3). Different letters represent statistically significant difference between the means (p ≤ 0.05).
Horticulturae 08 01151 g003
Figure 4. Metacaspase gene expression in floral and vegetative tissues from Petunia × hybrida ‘Mitchell Diploid’ (MD) (A) Relative expression of PhMC1 and PhMC2 in styles and ovaries from unpollinated flowers on the day of anthesis (0 days), from pollinated flowers at 72 h (72 P), and from unpollinated, naturally senescing flowers at 8 days (8 U). Anthers were collected on the day of flower opening and pollen was from freshly dehiscent anthers. (B) Relative expression of PhMC1 and PhMC2 in green leaf, root, and stem tissue. Relative mRNA abundance compared to PhACTIN was determined by quantitative PCR and values represent the mean ± SD, n = 3. Different letters represent statistically significant difference between the means (p ≤ 0.05).
Horticulturae 08 01151 g004
Figure 5. Metacaspase gene expression in petunia leaves after Botrytis cinerea infection. Petunia × hybrida ‘Mitchell Diploid’ detached leaves were inoculated with B. cinerea spores and evaluated at 2 or 5 days after inoculation (dai). Abundance of PhMC1 and PhMC2 transcripts were determined relative to PhACTIN by quantitative PCR. Bars represent mean ± SD (n = 3). Different letters represent statistically significant difference between the means (p ≤ 0.05).
Horticulturae 08 01151 g005
Figure 6. Metacaspase gene expression induced by salinity stress in petunia seedlings. Petunia × hybrida ‘Mitchell Diploid’ seedlings were treated with 100 mM NaCl amended ½ strength Hoagland’s solution for 0, 0.5, 1, 3, 6, 12, or 24 h. Relative mRNA abundance of PhMC1 and PhMC2 was analyzed in seedling shoot tissue by quantitative PCR. Transcript levels are expressed relative to PhACTIN. Bars represent mean ± SD (n = 3). Different letters represent statistically significant difference between the means (p ≤ 0.05).
Horticulturae 08 01151 g006
Figure 7. Metacapase gene expression in petunia leaves following nutrient deprivation. Petunia × hybrida ‘Mitchell Diploid’ plants were grown in nutrient deficient solutions for 4 weeks. Solutions contained either complete nutrients or were deficient in N, P, or K. After 28 days of nutrient stress, leaf tissue was harvested and analyzed for relative mRNA abundance of PhMC1 and PhMC2 by quantitative PCR. Transcripts were expressed relative to PhACTIN. Bars represent mean ± SD, n = 3. Different letters represent statistically significant difference between the means (p ≤ 0.05).
Horticulturae 08 01151 g007
Figure 8. Metacaspase gene expression in petunia leaves during drought stress. Petunia × hybrida ‘Mitchell Diploid’ plants were grown in a growth chamber and water was withheld until plants showed visual signs of wilting. Twenty-four h after wilting was observed, plants were irrigated with clear water until plants recovered and regained turgidity. Water was then withheld from plants again and this cycle was repeated 3 times. After the final wilt-recovery cycle, plants were watered as needed for an additional 10 days. Leaf tissue was collected throughout the wilt-recovery cycles and relative mRNA abundance of PhMC1 and PhMC2 was analyzed by quantitative PCR (left axis). Transcripts are expressed relative to PhACTIN, and bars represent mean ± SD, n = 3. Asterisks (*) indicate a statistically significant difference between the expression level of the sample compared to the initial expression level (time = 0 days; p ≤ 0.05). Soil moisture content was measured throughout the wilt-recovery cycles and is expressed as the field capacity (right-axis). Mean field capacity is plotted (solid circles) and error bars represent SD (n = 40).
Horticulturae 08 01151 g008
Publisher’s Note: MDPI stays neutral with regard to jurisdictional claims in published maps and institutional affiliations.