Article

High Light Intensity from Blue-Red LEDs Enhance Photosynthetic Performance, Plant Growth, and Optical Properties of Red Lettuce in Controlled Environment

by
Giuseppe Carlo Modarelli
1,*,
Roberta Paradiso
1,
Carmen Arena
2,
Stefania De Pascale
1 and
Marie-Christine Van Labeke
3
1
Department of Agricultural Sciences, University of Naples Federico II, 80055 Portici, Italy
2
Department of Biology, University of Naples Federico II, 80126 Naples, Italy
3
Department of Plants and Crops, Faculty of Bioscience Engineering, Ghent University, 9000 Ghent, Belgium
*
Author to whom correspondence should be addressed.
Horticulturae 2022, 8(2), 114; https://doi.org/10.3390/horticulturae8020114
Submission received: 30 December 2021 / Revised: 21 January 2022 / Accepted: 24 January 2022 / Published: 27 January 2022

Abstract

:
Plant factories using artificial light to produce vegetables have high energy costs due to the high demand for electricity for lighting. Compared to conventional light sources, light-emitting diodes (LEDs) offer the possibility of tailoring the light spectrum and regulating light intensity and are more energy-efficient in terms of energy conversion regardless of the levels of lighting intensity. Optimal light intensity and daily light integral (DLI) requirements are key factors for plant growth; however, their values vary among species and varieties. Our experiment aimed to identify the best light intensity to produce lettuce plants in controlled environment. Lettuce plants of the type Batavia cv ‘Blackhawk’ were grown in plastic pots filled with perlite and peat (20:80 v/v) for 33 days in a growth chamber under blue (B, 20%) and red (R, 80%) LED light at a photosynthetic flux density of 130 µmol m−2 s−1 (BR 130, DLI 7.49 mol m−2 d−1), 259 µmol m−2 s−1 (BR 259, DLI 14.92 mol m−2 d−1), and 389 µmol m−2 s−1 (BR 389, DLI 22.41 mol m−2 d−1). Our results showed that increasing light intensity and DLI promotes net photosynthesis, sustains the electron transport rate (ETR), and stimulates the synthesis of anthocyanins and carotenoids, with positive results for plant photoprotection. Furthermore, the decreases in vegetation indexes (photochemical reflectance index (PRI), greenness, and modified chlorophyll absorption in reflectance index (MCARI1)) also indicate changes in photosynthetic pigment content in response to plant acclimation to different DLIs. Among the three light intensities, 389 µmol m−2 s−1 (DLI 22.41 mol m−2 d−1) gave the best results for growing Batavia red lettuce cv ‘Blackhawk’, since it enhances both production and qualitative traits. These results highlight the importance of a proper light intensity to promote plant growth and qualitative traits and to reach high production targets. Hence, preliminary screening of plant performance under different light treatments is recommended to optimise plant response to artificial lighting.

1. Introduction

Climate changes, as well as the increase in urban populations and the need to fulfil the UN Sustainable Development Goals, pose the need to produce more with less, increasing the resilience of food systems [1,2]. Controlled Environment Agriculture (CEA) systems like vertical farming (VF) or plant factories with artificial light (PFAL) are proposed as suitable means to produce food in cities [3,4], with several economic and social benefits [5,6]. Crop production in such systems can reach approximately 80–90% higher water and resource use efficiency compared to open field cultivation, thanks to optimal environment control [7,8]. However, these systems require high energy inputs, especially for lighting, which compromise their overall sustainability.
Light is crucial for many processes of plant life, from photosynthesis to circadian rhythm regulation [9]. In northern countries, it is a common practice for growers to apply light to reach a target Daily Light Integral (DLI) in greenhouses for several species. However, the light spectrum and light intensity can affect leaf pigment composition and leaf spectral absorbance differently in crops. Leaf spectral analysis is a widely used technique for non-destructive monitoring of plant health status and pigment composition [10,11,12]. Excess of light in terms of intensity can be harmful to photosystems and induce plants to synthesise different antioxidant compounds and non-photosynthetic pigments to mitigate the excess of light and reactive oxygen species (ROS) scavenging activity, affecting photochemical functions. On the other side, these compounds are particularly desired by consumers for their beneficial properties. Accordingly, finding the right light combination that is able to boost both production time and quality is of crucial importance.
Lettuce is one of the most widely grown vegetables, particularly appreciated for its qualitative properties, such as low calories, large amounts of fibres, minerals and vitamins, and healthy bioactive compounds [13]. Lettuce’s qualitative profile varies between typologies and cultivars [14,15,16]. In general, green-leaved lettuces are richer in nitrate, calcium, magnesium, and other essential minerals [17,18,19], ascorbic acid, lutein, and β-carotene [20,21]. Instead, red-leaved lettuces show higher contents of anthocyanins, flavonoids, phenolic acids, and other antioxidant compounds [14,19,22,23]. Moreover, at the physiological level, red lettuces show similar or even higher photosynthetic performance than green lettuce due to a higher proportion of light effectively driven to photosynthesis that reduces the demand for energy dissipation and improves water use efficiency [23,24,25,26]. Most of the studies on lettuce that have aimed to identify DLI requirements considered green-leaved lettuce. In general, for green-leaved lettuce cultivars, a DLI of 14–17 mol m−2 d−1 is recommended. Changing light intensity induces several leaf morpho-anatomical changes in the profiles and ratios of pigments. In scattered or full red-leaved lettuce, both chlorophylls, carotenoids, and anthocyanin pigments are present. Under high irradiance, foliar anthocyanin production increases, affecting leaf spectral properties. Anthocyanins are known to absorb mainly the yellow/green and ultraviolet wavelengths and blue wavelengths to a lesser extent.
Anthocyanin-rich leaves are less prone to photoinhibition. Therefore, we hypothesised that under a red/blue light spectrum, the anthocyanin-rich red-leaved lettuce might be able to support higher light intensities and a higher DLI than those recommended in the literature for green-leaved lettuce cultivars [14,25]. Furthermore, we hypothesised that a higher DLI would contribute to higher biomass and an increase of plant nutritional quality. We tested these hypotheses by investigating three light intensity levels, corresponding to three DLIs, using a fixed blue:red ratio of 20:80 over a 16 h photoperiod, on photosynthesis, PSII photochemistry, spectral leaf properties, and biomass of the red-leaved Batavia lettuce ‘Blackhawk’.

2. Materials and Methods

2.1. Plant Material and Growth Conditions

Two-week-old seedlings of a red-leaved Batavia lettuce cv ‘Blackhawk’, at the third-to-fourth leaf stage, were transplanted and grown in Ø 10 cm plastic pots filled with peat:perlite (80:20 v/v) for 33 days in a growth chamber at a day/night temperature of 23/18 °C and RH 70/80%. Plants were fertigated every three days with a half-strength Hoagland nutrient solution, with pH 5.8 and EC 1.2 dS m−1. Fifteen seedlings were randomly assigned to each light treatment.

2.2. Lighting Treatments

Plants were grown under a photoperiod of 16 h, from 06:00 to 22:00, provided by a mixture of blue (B, 20%) and red (R, 80%) LED light (GreenPower LED dynamic module, Signify, Eindhoven, The Netherlands) (Figure 1), provided at a photosynthetic photon flux density at canopy level (PPFD) of 130 µmol m−2 s−1 (BR 130), 259 µmol m−2 s−1 (BR 259), and 389 µmol m−2 s−1 (BR 389), providing a DLI of 7.49, 14.92, and 22.41 mol m−2 d−1, respectively. The light spectral distribution of the different treatments was assessed by a spectrometer (JAZ-ULM-200, Ocean Optics, Dunedin, FL, USA) and converted to μmol m−2 s−1 with Spectrasuite software (Ocean Optics, Dunedin, FL, USA) (Figure 1).

2.3. Gas Exchange and Chlorophyll a Fluorescence

Gas exchange and chlorophyll a fluorescence were measured on fully expanded leaves (one leaf per plant, five plants per lighting treatment), 31 and 30 days after the beginning of lighting treatments, by a portable photosynthesis system Licor 6400 XT (Licor, Lincoln, NE, USA), equipped with the 6400–6440 Leaf Chamber Fluorometer (LCF) (Licor, Lincoln, NE, USA). The LCF blue and red actinic light percentages were 20% and 80% at the respective growth light intensities of 130, 259, 389 μmol m−2 s−1, and the CO2 concentration was fixed at 400 ppm. Light use efficiency (LUE) was calculated as the ratio between the leaf net photosynthesis (Pn) and the incident amount of photons, and intrinsic water use efficiency (WUEint) was calculated as Pn/E by the software operating in the instrument.
On the same leaves used for gas exchange, chlorophyll a fluorescence was measured using a portable fluorometer PAM 2500 (Walz, Effeltrich, Germany). Light intensity response curves were performed 30 days after the beginning of lighting treatments.
Leaves were dark-adapted with a dark leaf clip DLC-8 (Walz, Effeltrich, Germany) for 30 min; then a 0.6 s saturating light pulse (3450 μmol m−2 s−1) was given to obtain Fm and F0 values. The fluorescence light response curves were built by increasing the actinic light from 0 to 2968 μmol m−2 s−1 in eleven steps, applying saturation pulses of 0.6 s at each step to obtain the maximum light-adapted fluorescence (Fm’) and steady-state fluorescence (Fs). The minimal fluorescence after the PSII excitation (F0’) was obtained by turning off the actinic light and applying a far-red pulse of 0.5 s. The PSII maximum photochemical efficiency (Fv/Fm) was calculated as Fv/Fm = (Fm − F0)/Fm. The quantum yield of PSII electron transport (ΦPSII) was calculated as ΦPSII = (Fm’ − Fs)/Fm’, following Genty et al. [27]. The yield of non-regulated quenching (ΦNO) was calculated as F/Fm. Photochemical fluorescence quenching (qP) was calculated as (Fm’ − Fs)/(Fm’ − Fo’), and the non-photochemical quenching was calculated as (Fm/Fm’) − 1 [28]. Based on the fluorescence light response curve, the electron transport rate (ETR) was calculated at each illumination step. The plant response to the increasing light intensity was obtained by fitting each ETR curve according to the model proposed by Platt et al. [29], estimating the maximal electron transport rate (ETRmax), electron transport rate efficiency at low light intensity (α, electron photons −1), and the light saturation point (Ik, µmol photons m−2 s−1), calculated as Ik = ETRmax/α.

2.4. Leaf Optical Properties

Adaxial leaf optical properties and vegetation indexes were measured 30 days from the beginning of the light treatments, on one leaf per plant, in five plants × lighting treatment using a PolyPen RP 400 UVIS (PSI, Photon Systems Instruments, Drasov, Czech Republic) with a spectral response range from 380 nm to 780 nm: leaf absorbance and transmittance were measured as A = log(I0/I) and T = I/I0, where I0 is the reference light intensity and I is the measured light intensity. Normalized difference vegetation index (NDVI) was calculated on leaf reflectance in the near infra-red (RNIR) and the red (RRED) region as NDVI = (RNIR − RRED)/(RNIR + RRED). Modified chlorophyll absorption in reflectance index (MCARI1) was calculated on leaf reflectance (R) at 550, 670, and 790 nm, according to Haboudane [30] as 1.2’(2.5’(R790R670)−1.3’(R790R550)). Greenness index (G) was calculated as the leaf reflectance ratio between 554 and 677 nm as R554/R677. Photochemical reflectance index (PRI) was calculated on the leaf reflectance at 531 and 570 nm as PRI = (R531R570)/(R531 + R570) [31]. Carter index was calculated as the reflectance ratio at 695 and 420 nm Ctr1 = R695/R420, according to Carter [32], anthocyanin and carotenoid reflectance indexes (ARI1, ARI2 and CRI2) were calculated at 550, 510, 700, and 800 nm as ARI1 = 1/R550 − 1/R700, ARI2 = R800’(1/R550 − 1/R700), and CRI2 = 1/R510 − 1/R700, respectively, based on Gitelson and coworkers [33,34].

2.5. Plant Growth

Plant growth was determined at 33 DAT in five plants per lighting treatment at harvest time, measuring the leaf number and total leaf area, root and leaf fresh and dry weight and dry matter content. Leaf area was determined by ImageJ software 1.50i version (Wayne Rasband National Institute of Health, Bethesda, MD, USA) on leaf pictures; dry weight was measured after drying the samples for 48 h at 70 °C; dry matter percentage in leaves and roots was calculated as DM% = (dry weight/fresh weight) × 100.

2.6. Statistical Analysis

The experiment was carried out on a total of 15 plants per light treatment. All measurements reported in this study considered five plant replicates per light treatment. Data were analysed by one-way ANOVA using the SPSS 27 software package (Accessed date 11 November 2021, www.ibm.com/analytics/spss-statistics-software), means were compared with Tukey’s HSD post hoc test (p ≤ 0.05). A heatmap was generated using the Clustvis online tool, and matrix values were normalised as ln (x + 1), with Euclidean distance and complete linkage [35].

3. Results

3.1. Plant Physiological Results

3.1.1. Gas Exchange

Gas exchange in terms of leaf net photosynthesis and leaf transpiration rate increased linearly by increasing light intensity at p < 0.05. Compared to BR 130 plants, leaf net photosynthesis and transpiration increased by 34% and 28% under BR 259, and by 122% and 108% under BR 389 (Figure 2). Light use efficiency was higher under low irradiance, and it decreased by 27% on average for BR 259 and BR 389 compared to BR 130. Intrinsic water use efficiency was not affected by the light intensity, and it was on average 2.7 mol CO2/mol H2O (Figure 2).

3.1.2. Chlorophyll a Fluorescence Emission

The maximal photochemical efficiency of PSII (Fv/Fm) did not differ between the light treatments, and it was on average 0.74 (data not shown). The quantum yield of PSII electron transport (ΦPSII) was higher in plants grown at BR 259 and BR 389 compared to BR 130 plants. This was the case for all tested light intensities (Figure 3a). Likewise, the photochemical quenching of PSII (qP) indicated a higher proportion of open PSII reaction centres in plants grown under BR 259 and BR 389 compared to BR 130 plants (Figure 3c). In contrast, the quantum yield of non-regulated heat dissipation and fluorescence emission (ΦNO) was higher in BR 130 plants than BR 259 and BR 389 plants for light intensities between 0–760 µmol m−2 s−1 but similar at irradiances above 1000 µmol m−2 s−1 (Figure 3b). Compared to BR 130 plants, non-photochemical quenching (NPQ) was higher in BR 389 plants at light intensities between 50 and 760 µmol m−2 s−1 (Figure 3d), up to 1000 µmol m−2 s−1. NPQ increased by 31% in BR 130 plants, reaching similar values to BR 259 and BR 389 plants (Figure 3d).
Light intensity treatment did not influence significantly the ETR light response curves; the parameters ETRmax, Ik, and α were on average 45, 205, and 0.03 (Table 1).

3.2. Leaf Optical Properties

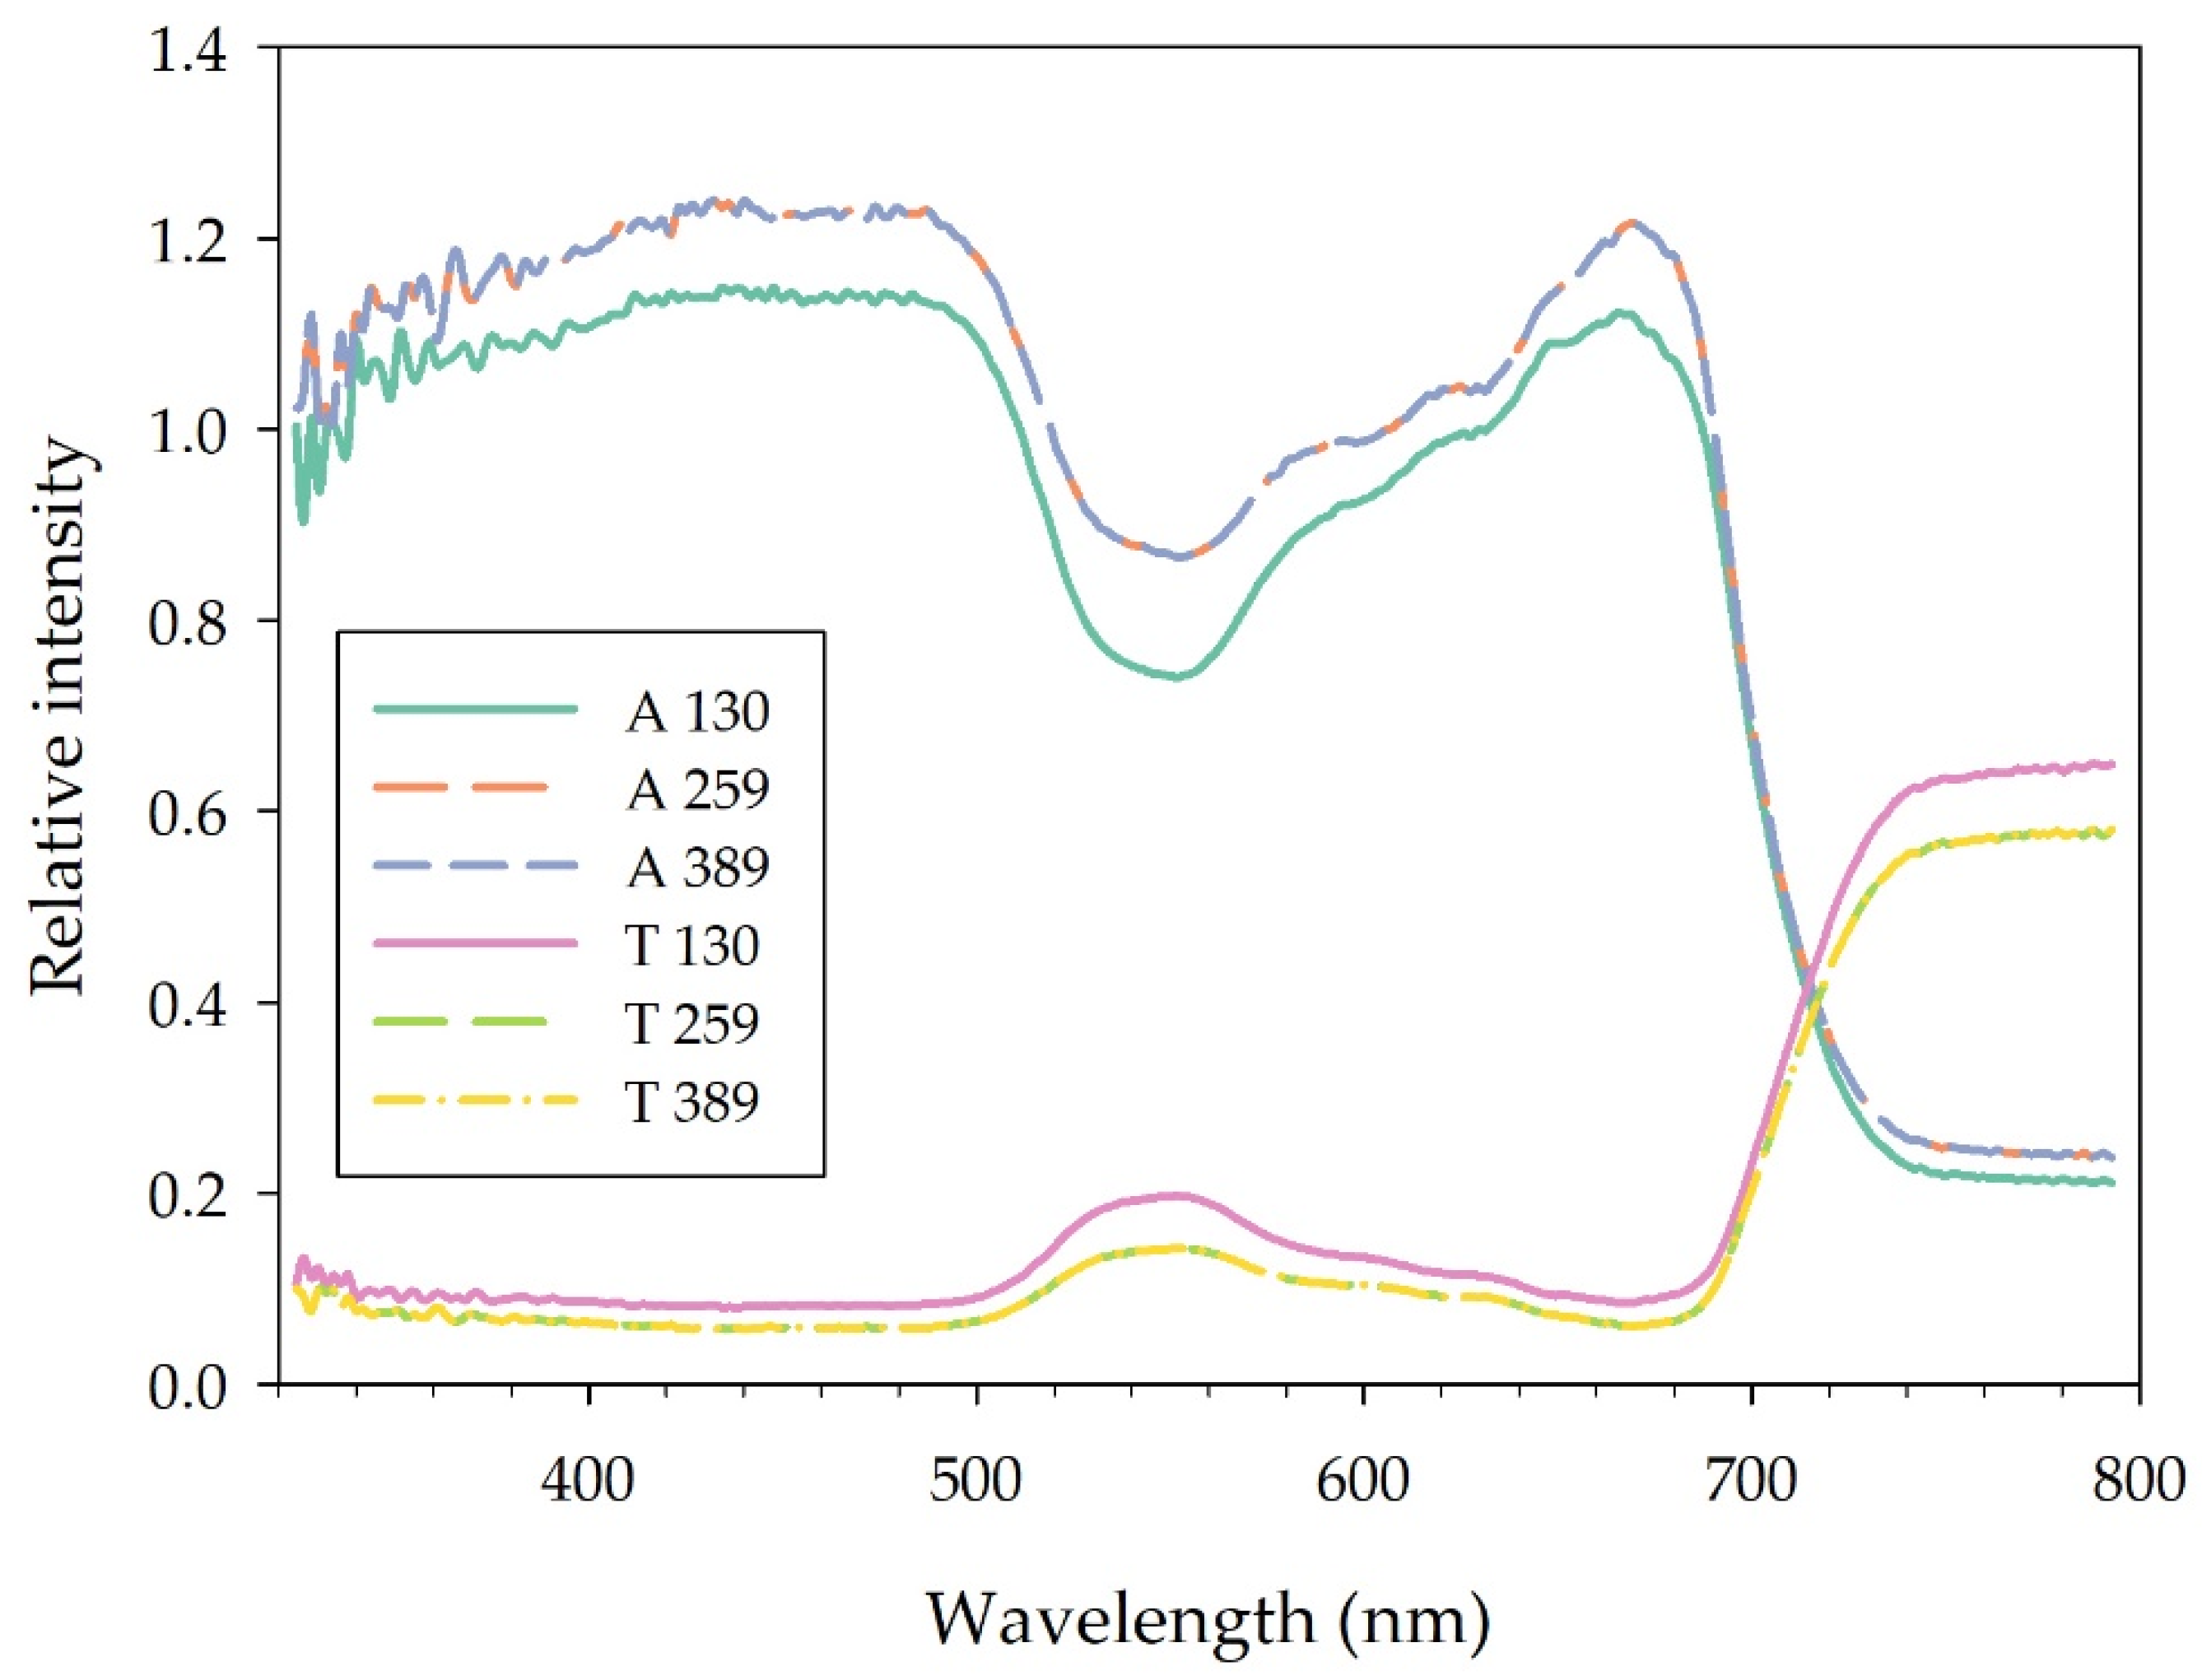
3.2.1. Leaf Transmittance and Absorbance

Leaf adaxial absorbance from 360 to 800 nm was lower in plants grown under BR 130, while it did not differ between plants grown under BR 259 and BR 389 (Figure 4). In particular, in the region of the blue (400–500 nm), green (500–600 nm), red (600–700 nm) and far red (700–800 nm) spectra, BR 130 plants absorbed 8.9%, 17.58%, 8.3%, and 13.7% less light compared to BR 259 and BR 389 plants. Conversely, leaf transmittance was higher in BR 130 plants, especially in the green (500–600 nm) and in the far-red (700–800 nm) region of the spectrum, where it was on average 62% and 17.7% higher compared to the other treatments. The intersection between leaf absorbance and transmittance spectra occurred at 713 nm in BR 130 plants, while it occurred at 716 and 717 nm for BR 259 and BR 389 plants, respectively (Figure 4).

3.2.2. Vegetation Indexes

Vegetation indexes were affected by light intensity (Table 2). The NDVI and Ctr1 indices were similar between the three treatments and were on average 0.72 and 2.24 (Table 2). Compared to BR 130 plants, the MCARI1 and PRI indexes decreased linearly with increasing light intensity by −11% and −27% and by −45% and −126% in BR 259 and BR 389, respectively. The greenness index decreased by 37% only in BR 389 plants. In contrast, both anthocyanin indexes (ARI1 and ARI2) increased linearly with increasing light intensity (Table 2). Compared to BR 130 plants, ARI1 increased by 266% in BR 259 and 785% in BR 389 plants. Likewise, the ARI2 increased by 232% and 619% in BR 259 and BR 389 plants, respectively. The carotenoid reflectance index 2 (CRI2) increased by 57% and 121% compared to BR 130 plant (Table 2).

3.3. Plant Growth

Plants grown under the three lighting regimes produced on average 28 leaves and reached a total leaf area of 1278.71 cm2 per plant (Table 3). Plant biomass production significantly increased only in BR 389 plants compared to BR 130 plants, where fresh leaves and root weight increased by +78% and +416%, respectively, while leaves and root dry weight were +87% and +588% higher than BR 130 plants (Table 3). The three tested light intensities did not affect the leaves’ dry matter content. Compared to BR 130 plants, root dry matter increased by 37% in BR 389 plants and ranged between 7.48–10.23% in BR 130 and BR 389, respectively (Table 3).

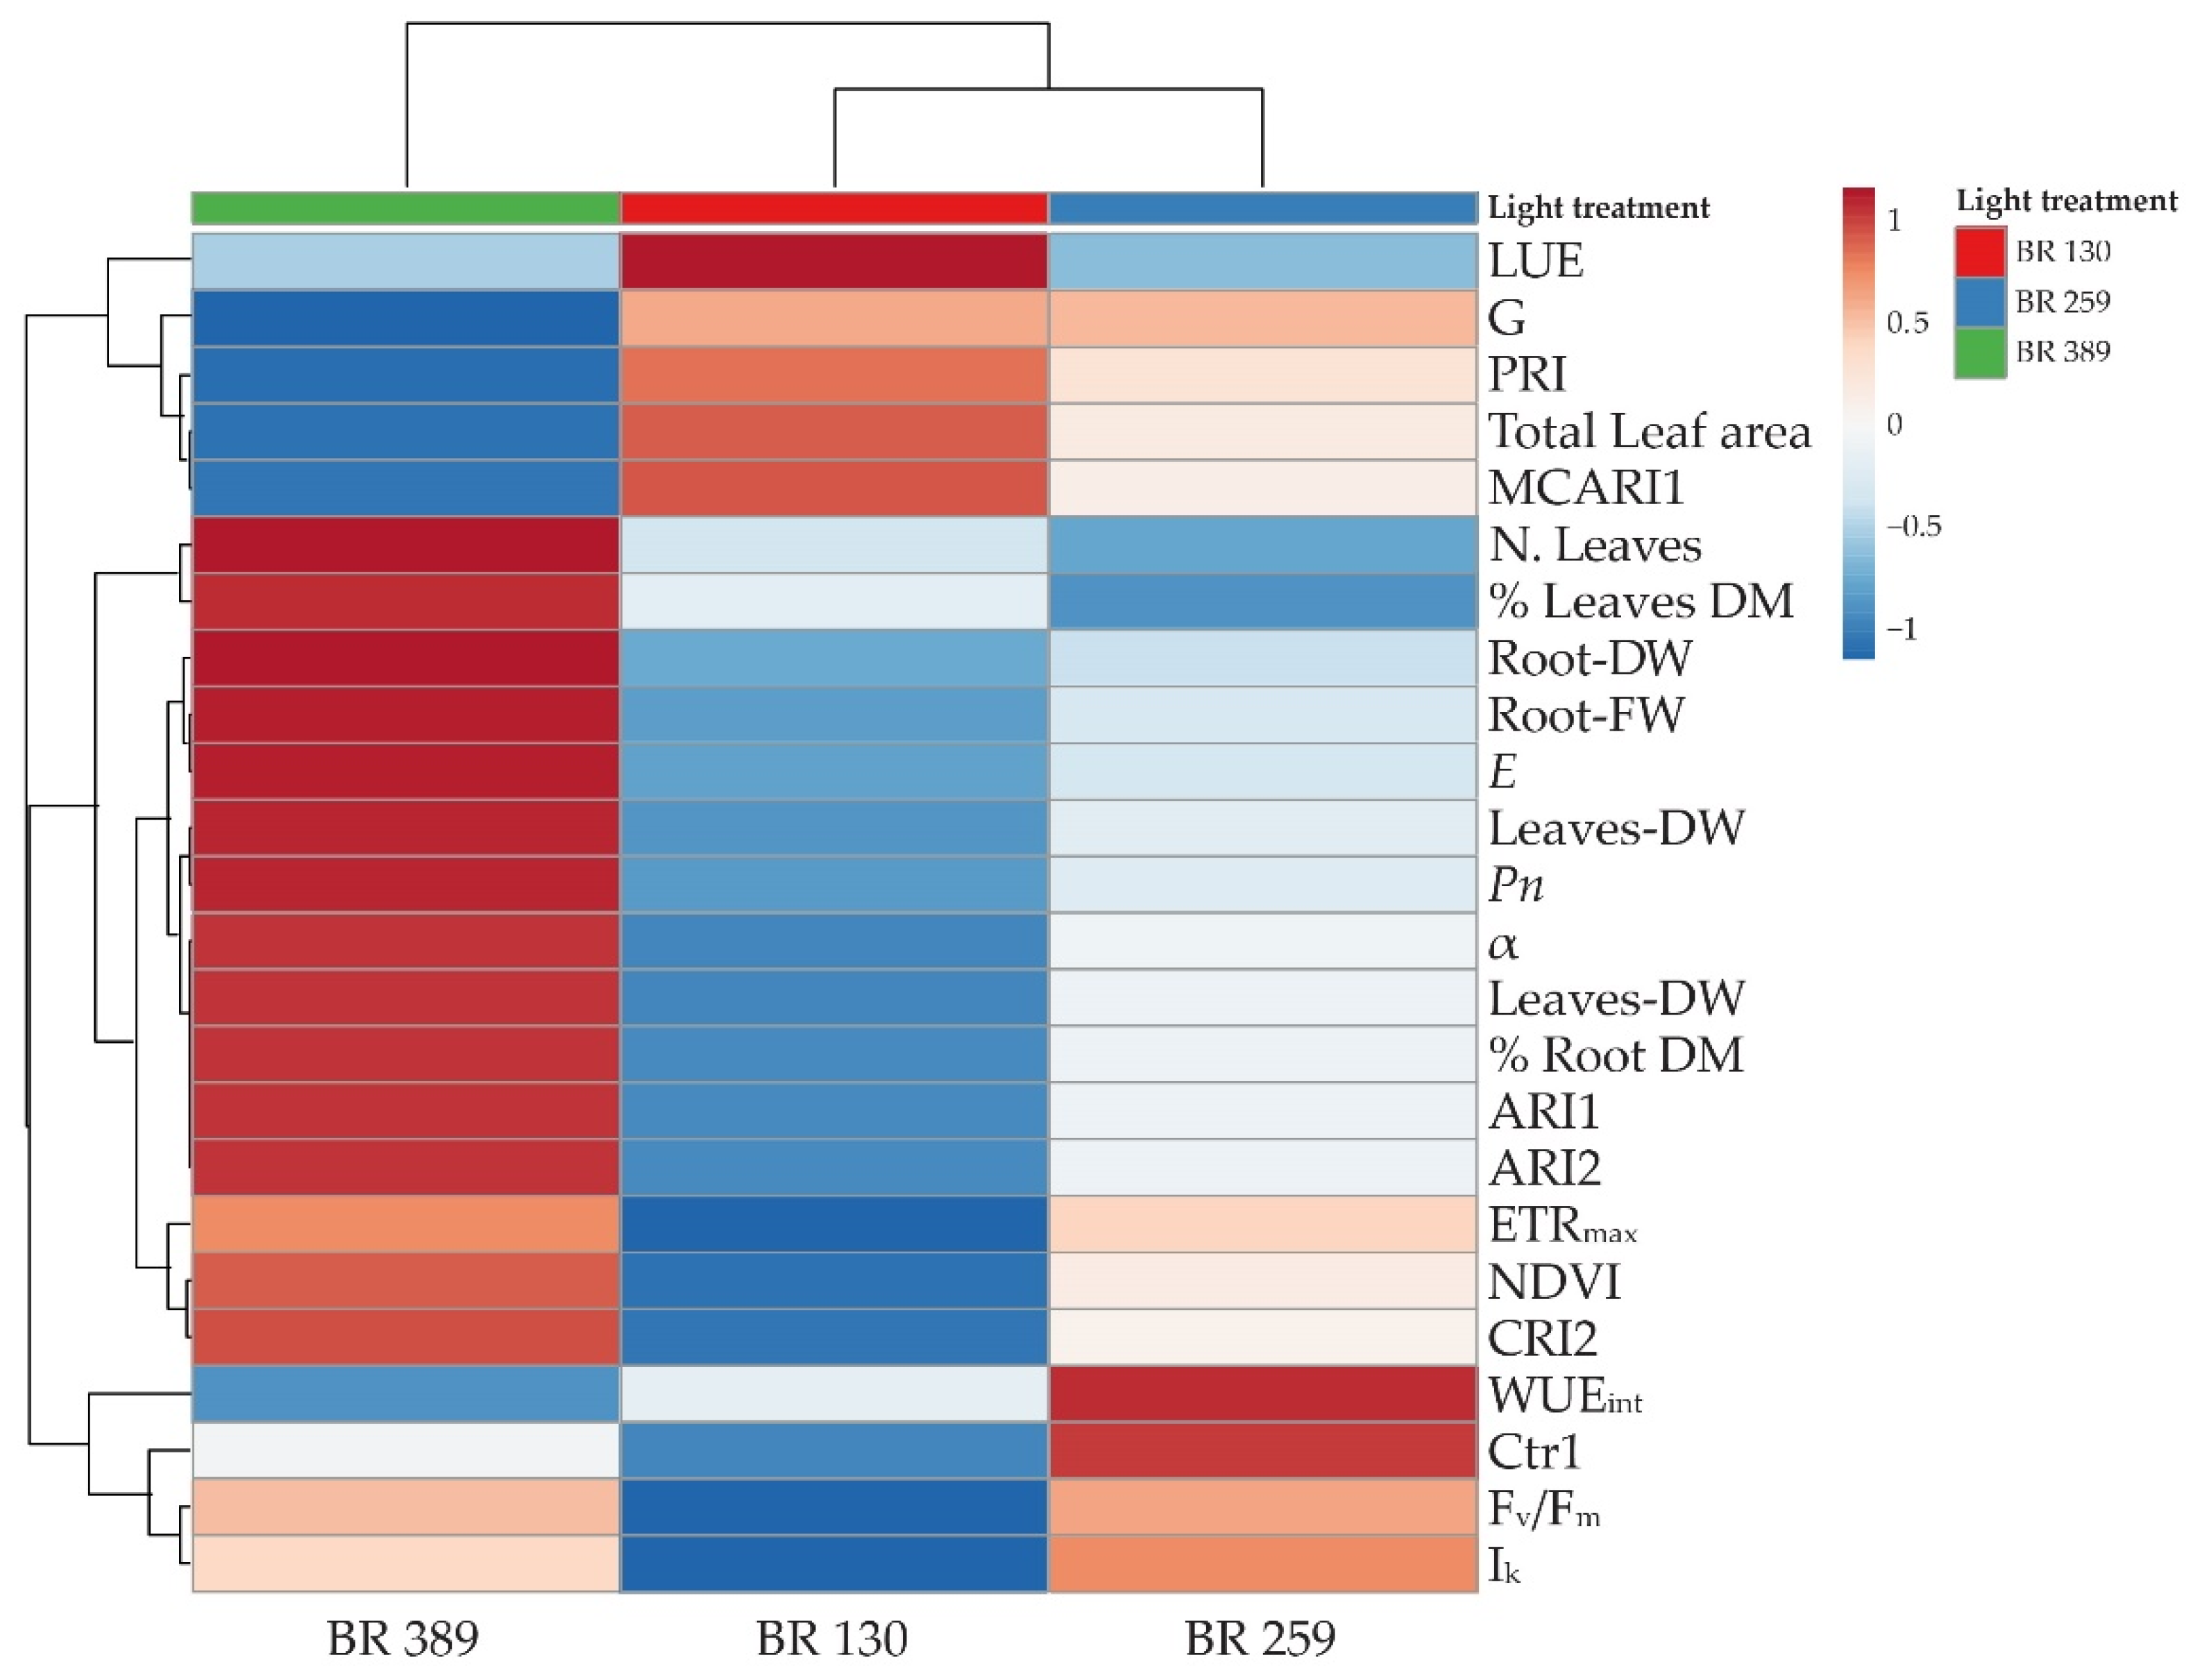
3.4. Heatmap and Cluster Analysis

To obtain an overview of the measured parameters and better distinguish the morpho-physiological changes induced by light intensity, a cluster heat map was conducted for all the aforementioned measured parameters.
The cluster heatmap shows that BR 259 is the threshold irradiance within BR 130 and BR 389 (Figure 5). The light treatments lead to the formation of two main clusters. The first was occupied by BR 389 plants that clustered alone, mainly as a consequence of an increase in plant growth in terms of leaf number, fresh and dry biomass accumulation, leaf net photosynthesis, transpiration, ETRmax, NDVI and ARI1 and ARI2 and CRI2, together with a lower LUE, G, and PRI index, as well as total leaf area and intrinsic water use efficiency (Figure 5). The second cluster is split into two by BR 130 and BR 259 plants, mainly due to common G, PRI, total leaf area, and biomass values. Despite this, BR 130 plants were characterised by the highest LUE, G, PRI, MCARI1, and total leaf area, as well as the lowest Fv/Fm and Ik and ETRmax values (Figure 5). On the other hand, BR 259 plants showed average variations, compared to BR 130 and BR 389, and the highest WUEint and Fv/Fm and Ik values (Figure 5).

4. Discussion

Daily light integral effects on green-leaved lettuce have been extensively validated during the last years under full white or BR spectra [36,37,38,39,40]. The optimal DLI requirement for lettuce ranges between 14 and 17 mol m−2 d−1; however, this may vary among the species and the light spectrum used.
Light primary drives the photosynthetic process [9,41]. In our growing conditions, leaf net photosynthesis increased linearly as light intensity increased, while water transpiration increased significantly only in BR 389, in agreement with similar studies [36,39,41,42]. Despite this, intrinsic leaf water use efficiency did not vary among the treatments. On the other hand, light use efficiency was higher under lower light intensities, consistent with the higher vegetation indexes, G, MCARI1, and PRI, indicating at low irradiance a higher content of chlorophylls, especially chlorophyll a, in the light-harvesting antenna complex. We found, indeed, that the vegetation indexes G, MCARI1, and PRI decreased with increasing light intensity up to 259 µmol m−2 s−1, suggesting better photon use in the photosynthetic process. This is in agreement with Elkins and co-workers [40], who reported improved light absorption and a daily photochemical integral by ΦPSII when decreasing light intensity and extending the photoperiod. In our growing conditions, we applied an increasing DLI as a function of light intensity rather than day length extension, the photoperiod being set at 16 h.
Excess of light may damage the photosynthetic apparatus. The excess excitation energy negatively affects chloroplasts’ performance, inducing a rapid decline in ΦPSII and a reduction in carbon fixation [43]. This triggers the activation of photoprotective mechanisms, like chloroplast movement, reactive oxygen species (ROS) scavenging systems, cyclic electron flow, and photorespiratory pathways, but also regulated or non-regulated heat and fluorescence dissipation [37,42,44]. Indeed, the excess of light induces pigment composition and ratio changes in the light-harvesting complexes. More specifically, it increases chlorophyll b and carotenoid contents and activates the transcription of several genes involved in the biosynthesis of photoprotective non-photosynthetic pigments to quench ROS, thus shielding high-energy wavelengths (e.g., UV and blue), which can lead to photo-inhibition. Anthocyanins are organic flavonoid compounds primarily responsible for the dark-red colour in plant tissue under high-energy radiation, such as UV-A (315–400 nm) or blue and green wavelengths [45]. At the photosystem level, light intensity and quality affect the PSI and PSII differently; PSI is photo-inhibited by the same amount of red and blue light, while PSII is mainly photo-inhibited by blue light [46]. Anthocyanin preserves PSII from photo-inhibition with a photo-abatement effect, intercepting and screening high energy photons (e.g., UV-A, blue, and green) and by reducing the incidence and severity of the photooxidative damages, mainly caused by the oxygen-evolving complex (OEC) and from the inhibition of repair mechanisms of the PSII D1 protein [43,45].
In our experimental conditions, as revealed by the Chl a fluorescence and light intensity response curves, the non-regulated dissipation processes (ΦNO) were higher in BR 130, indicating higher stress on the photosystems. On the other hand, NPQ was lower than BR 259 and BR 389 in the first part of the light response curve. A similar dissipation capacity was observed between BR 259 and BR 389 plants. This agrees with chlorophyll pigment contents and ratios, since at low irradiance, more Chl a is present in the light-harvesting antenna complexes than Chl b or carotenoids, in line with the change in vegetation indexes. Increasing light intensity decreased leaf greenness, Chl pigments, and PRI indexes according to LUE decrease, while the ARI1 and ARI2, indexes related to anthocyanin content, and the carotenoid reflectance index CRI2 increased with increasing irradiance. This indicates a predominant role at the photosystem level of anthocyanins and carotenoids in photoprotective action rather than the thermal dissipation mechanism, since WUEint was not affected and leaf photosynthesis increased [47,48].
In addition, compared to lower irradiances that induced a low anthocyanin index, the results from the light response curve showed that the quantum yield of ΦPSII decreased similarly under irradiance above 259 µmol m−2 s−1, according to the fraction of PSII open reaction centres (qP) that indicated higher light assimilation, in agreement with the similar absorbance and transmittance spectra. Therefore, the lower yield of ΦPSII in BR 130 plants may be related to a higher number of blue photons effectively reaching the PSII. These results agree with the reduced leaf light absorbance and higher transmittance of BR 130 plants and explain the reasons for the decrease of PRI and LUE, since red-leaf plants show a smaller pool of xanthophyll pigments compared to green-leaf plants [43,49,50], as anthocyanins offer an alternative to dissipate the excess of light [51,52]. They could also explain the absence of differences in ETRmax, effectively reducing the number of blue photons reaching photosystems, contributing to the photosynthetic electron transport.
As a result of assimilative and dissipative processes, higher light intensity promotes several physiological and morpho-anatomical adaptations, increasing leaf thickness and stomatal density, resulting in a decrease in specific leaf area (SLA) and a more compact canopy [53,54]. Changes in leaf traits and pigment profiles are reflected by leaf spectral properties. Accordingly, BR130 plants transmitted more light than the other treatments in our experiment, indicating thinner leaves. In addition, the increase in DLI increased fresh and dry biomass without influencing the leaf number and the total leaf area, as these parameters are mainly influenced by light spectral ratios [36,37,54]. However, the biomass increase was significant at DLIs above 14.9 mol m−2 d−1, indicating a higher DLI and higher light energy requirement and threshold for Batavia red leaf-type lettuce, as has been reported for other red-leaf lettuces [47,48] as compared to other types [36,37,39].

5. Conclusions

DLI requirements vary among species and varieties. The DLI lighting strategy currently considers mainly the use of full-spectrum LEDs to reach specific growth targets. In our experiment we tested the plant physiological response of red-pigmented lettuce, lighting with a blue–red spectrum at different DLIs obtained with three different light intensities.
Our results showed that net photosynthesis increases with light intensity and that increases in light intensities and DLIs sustain the ETR and stimulate the synthesis of anthocyanins and carotenoids, with positive effects on plant photoprotection. Furthermore, the decrease of vegetation indexes (photochemical reflectance index (PRI), greenness (G), and MCARI1) also indicates a modulation of photosynthetic pigment profiles in response to plant acclimation to different DLIs. The treatment BR 398 seems to be the most suitable to improve photosynthetic traits.
To conclude, monitoring leaf optical properties with proximal sensors is suitable for screening plant capacities to absorb and utilise light, as well as nutritional status, these being well linked with Chl fluorescence emissions. Among the three light intensities, 389 µmol m−2 s−1 (DLI 22.41 mol m−2 d−1) gave the best results in terms of improving photosynthetic traits in Batavia red lettuce cv ‘Blackhawk’ in PFAL and enhancing both production and qualitative traits.

Author Contributions

Conceptualization, G.C.M. and M.-C.V.L.; methodology, G.C.M. and M.-C.V.L.; software, G.C.M.; validation, G.C.M.; formal analysis, G.C.M.; investigation, G.C.M.; resources, M.-C.V.L.; data curation, G.C.M.; writing—original draft preparation, G.C.M.; writing—review and editing, M.-C.V.L., R.P., C.A. and S.D.P.; supervision, S.D.P. and M.-C.V.L.; project administration, M.-C.V.L.; funding acquisition, S.D.P., R.P. and M.-C.V.L. All authors have read and agreed to the published version of the manuscript.

Funding

This research was carried out within the framework of the research doctorate on Food and Agricultural Sciences—XXII cycle, of the University of Naples Federico II.

Institutional Review Board Statement

Not applicable.

Informed Consent Statement

Not applicable.

Data Availability Statement

The data presented in this study are available on request from the corresponding author (G.C.M.).

Acknowledgments

The authors are thankful to Christophe Petit for his help and technical assistance in setting up the experiment.

Conflicts of Interest

The authors declare no conflict of interest.

References

  1. Dubbeling, M.; Santini, G.; Renting, H.; Taguchi, M.; Lançon, L.; Zuluaga, J.; De Paoli, L.; Rodriguez, A.; Andino, V. Assessing and planning sustainable city region food systems: Insights from two Latin American cities. Sustainability 2017, 9, 1455. [Google Scholar] [CrossRef] [Green Version]
  2. Rufí-Salís, M.; Calvo, M.J.; Petit-Boix, A.; Villalba, G.; Gabarrell, X. Exploring nutrient recovery from hydroponics in urban agriculture: An environmental assessment. Resour. Conserv. Recycl. 2020, 155, 104683. [Google Scholar] [CrossRef]
  3. Tan, B.; Li, Y.; Liu, T.; Tan, X.; He, Y.; You, X.; Leong, K.H.; Liu, C.; Li, L. Response of Plant Rhizosphere Microenvironment to Water Management in Soil- and Substrate-Based Controlled Environment Agriculture (CEA) Systems: A Review. Front. Plant Sci. 2021, 12, 691651. [Google Scholar] [CrossRef] [PubMed]
  4. Van Delden, S.H.; SharathKumar, M.; Butturini, M.; Graamans, L.J.A.; Heuvelink, E.; Kacira, M.; Kaiser, E.; Klamer, R.S.; Klerkx, L.; Kootstra, G.; et al. Current status and future challenges in implementing and upscaling vertical farming systems. Nat. Food 2021, 2, 944–956. [Google Scholar] [CrossRef]
  5. Paucek, I.; Appolloni, E.; Pennisi, G.; Quaini, S.; Gianquinto, G.; Orsini, F. LED Lighting Systems for Horticulture: Business Growth and Global Distribution. Sustainability 2020, 12, 7516. [Google Scholar] [CrossRef]
  6. Orsini, F.; Pennisi, G.; Zulfiqar, F.; Gianquinto, G. Sustainable use of resources in plant factories with artificial lighting (PFALs). Eur. J. Hortic. Sci. 2020, 85, 297–309. [Google Scholar] [CrossRef]
  7. Sambo, P.; Nicoletto, C.; Giro, A.; Pii, Y.; Valentinuzzi, F.; Mimmo, T.; Lugli, P.; Orzes, G.; Mazzetto, F.; Astolfi, S.; et al. Hydroponic Solutions for Soilless Production Systems: Issues and Opportunities in a Smart Agriculture Perspective. Front. Plant Sci. 2019, 10, 923. [Google Scholar] [CrossRef]
  8. Pennisi, G.; Orsini, F.; Landolfo, M.; Pistillo, A.; Crepaldi, A.; Nicola, S.; Fernández, J.A.; Marcelis, L.F.M.; Gianquinto, G. Optimal photoperiod for indoor cultivation of leafy vegetables and herbs. Eur. J. Hortic. Sci. 2020, 85, 329–338. [Google Scholar] [CrossRef]
  9. Pattison, P.M.; Tsao, J.Y.; Brainard, G.C.; Bugbee, B. LEDs for photons, physiology and food. Nature 2018, 563, 493–500. [Google Scholar] [CrossRef]
  10. Sims, D.A.; Gamon, J.A. Relationships between leaf pigment content and spectral reflectance across a wide range of species, leaf structures and developmental stages. Remote Sens. Environ. 2002, 81, 337–354. [Google Scholar] [CrossRef]
  11. Lama, G.F.C.; Crimaldi, M.; Pasquino, V.; Padulano, R.; Chirico, G.B. Bulk Drag Predictions of Riparian Arundo donax Stands through UAV-Acquired Multispectral Images. Water 2021, 13, 1333. [Google Scholar] [CrossRef]
  12. Bracke, J.; Elsen, A.; Adriaenssens, S.; Vandendriessche, H.; Van Labeke, M.-C. Utility of proximal plant sensors to support nitrogen fertilization in Chrysanthemum. Sci. Hortic. 2019, 256, 108544. [Google Scholar] [CrossRef]
  13. Kim, M.J.; Moon, Y.; Tou, J.C.; Mou, B.; Waterland, N.L. Nutritional value, bioactive compounds and health benefits of lettuce (Lactuca sativa L.). J. Food Compos. Anal. 2016, 49, 19–34. [Google Scholar] [CrossRef]
  14. Son, K.H.; Oh, M.M. Leaf shape, growth, and antioxidant phenolic compounds of two lettuce cultivars grown under various combinations of blue and red light-emitting diodes. HortScience 2013, 48, 988–995. [Google Scholar] [CrossRef]
  15. Selma, M.V.; Luna, M.C.; Martínez-Sánchez, A.; Tudela, J.A.; Beltrán, D.; Baixauli, C.; Gil, M.I. Sensory quality, bioactive constituents and microbiological quality of green and red fresh-cut lettuces (Lactuca sativa L.) are influenced by soil and soilless agricultural production systems. Postharvest Biol. Technol. 2012, 63, 16–24. [Google Scholar] [CrossRef]
  16. Colonna, E.; Rouphael, Y.; Barbieri, G.; De Pascale, S. Nutritional quality of ten leafy vegetables harvested at two light intensities. Food Chem. 2016, 199, 702–710. [Google Scholar] [CrossRef] [PubMed]
  17. Giordano, M.; El-Nakhel, C.; Pannico, A.; Kyriacou, M.C.; Stazi, S.R.; De Pascale, S.; Rouphael, Y. Iron biofortification of red and green pigmented lettuce in closed soilless cultivation impacts crop performance and modulates mineral and bioactive composition. Agronomy 2019, 9, 290. [Google Scholar] [CrossRef] [Green Version]
  18. El-Nakhel, C.; Petropoulos, S.A.; Pannico, A.; Kyriacou, M.C.; Giordano, M.; Colla, G.; Troise, A.D.; Vitaglione, P.; De Pascale, S.; Rouphael, Y. The bioactive profile of lettuce produced in a closed soilless system as configured by combinatorial effects of genotype and macrocation supply composition. Food Chem. 2020, 309, 125713. [Google Scholar] [CrossRef]
  19. Rouphael, Y.; Petropoulos, S.A.; El-Nakhel, C.; Pannico, A.; Kyriacou, M.C.; Giordano, M.; Troise, A.D.; Vitaglione, P.; De Pascale, S. Reducing Energy Requirements in Future Bioregenerative Life Support Systems (BLSSs): Performance and Bioactive Composition of Diverse Lettuce Genotypes Grown Under Optimal and Suboptimal Light Conditions. Front. Plant Sci. 2019, 10, 1305. [Google Scholar] [CrossRef] [Green Version]
  20. Cristofano, F.; El-Nakhel, C.; Pannico, A.; Giordano, M.; Colla, G.; Rouphael, Y. Foliar and root applications of vegetal-derived protein hydrolysates differentially enhance the yield and qualitative attributes of two lettuce cultivars grown in floating system. Agronomy 2021, 11, 1194. [Google Scholar] [CrossRef]
  21. Pannico, A.; El-Nakhel, C.; Kyriacou, M.C.; Giordano, M.; Stazi, S.R.; De Pascale, S.; Rouphael, Y. Combating Micronutrient Deficiency and Enhancing Food Functional Quality Through Selenium Fortification of Select Lettuce Genotypes Grown in a Closed Soilless System. Front. Plant Sci. 2019, 10, 1495. [Google Scholar] [CrossRef] [PubMed] [Green Version]
  22. Najera, C.; Urrestarazu, M. Effect of the intensity and spectral quality of LED light on yield and nitrate accumulation in vegetables. HortScience 2019, 54, 1745–1750. [Google Scholar] [CrossRef] [Green Version]
  23. Amitrano, C.; Rouphael, Y.; De Pascale, S.; De Micco, V. Modulating vapor pressure deficit in the plant micro-environment may enhance the bioactive value of lettuce. Horticulturae 2021, 7, 32. [Google Scholar] [CrossRef]
  24. Samuoliene, G.; Virsile, A.; Miliauskiene, J.; Haimi, P.; Laužike, K.; Jankauskiene, J.; Novičkovas, A.; Kupčinskiene, A.; Brazaityte, A. The photosynthetic performance of red leaf lettuce under UV-A irradiation. Agronomy 2020, 10, 761. [Google Scholar] [CrossRef]
  25. Viršilė, A.; Miliauskienė, J.; Haimi, P.J.; Laužikė, K.; Samuolienė, G. The comparison of constant and dynamic red and blue light irradiation effects on red and green leaf lettuce. Agronomy 2020, 10, 1802. [Google Scholar] [CrossRef]
  26. Amitrano, C.; Rouphael, Y.; Pannico, A.; De Pascale, S.; De Micco, V. Reducing the Evaporative Demand Improves Photosynthesis and Water Use Efficiency of Indoor Cultivated Lettuce. Agronomy 2021, 11, 1396. [Google Scholar] [CrossRef]
  27. Genty, B.; Briantais, J.-M.M.; Baker, N.R. The relationship between the quantum yield of photosynthetic electron transport and quenching of chlorophyll fluorescence. Biochim. Biophys. Acta Gen. Subj. 1989, 990, 87–92. [Google Scholar] [CrossRef]
  28. Maxwell, K.; Johnson, G.N. Chlorophyll fluorescence—A practical guide. J. Exp. Bot. 2000, 51, 659–668. [Google Scholar] [CrossRef]
  29. Platt, T.; Gallegos, C.L.; Harrison, W.G. Photoinhibition of photosynthesis in natural assemblages of marine phytoplankton. J. Mar. Res. 1980, 38, 687–701. [Google Scholar]
  30. Haboudane, D.; Miller, J.R.; Pattey, E.; Zarco-Tejada, P.J.; Strachan, I.B. Hyperspectral vegetation indices and novel algorithms for predicting green LAI of crop canopies: Modeling and validation in the context of precision agriculture. Remote Sens. Environ. 2004, 90, 337–352. [Google Scholar] [CrossRef]
  31. Gamon, J.A.; Peñuelas, J.; Field, C.B. A narrow-waveband spectral index that tracks diurnal changes in photosynthetic efficiency. Remote Sens. Environ. 1992, 41, 35–44. [Google Scholar] [CrossRef]
  32. Carter, G.A. Reflectance Wavebands and Indices for Remote Estimation of Photosynthesis and Stomatal Conductance in Pine Canopies. Remote Sens. Environ. 1998, 63, 61–72. [Google Scholar] [CrossRef]
  33. Gitelson, A.A.; Merzlyak, M.N.; Chivkunova, O.B. Optical properties and nondestructive estimation of anthocyanin content in plant leaves. Photochem. Photobiol. 2001, 74, 38–45. [Google Scholar] [CrossRef]
  34. Gitelson, A.A.; Zur, Y.; Chivkunova, O.B.; Merzlyak, M.N. Assessing carotenoid content in plant leaves with reflectance spectroscopy. Photochem. Photobiol. 2002, 75, 272–281. [Google Scholar] [CrossRef]
  35. Metsalu, T.; Vilo, J. ClustVis: A web tool for visualizing clustering of multivariate data using Principal Component Analysis and heatmap. Nucleic Acids Res. 2015, 43, W566–W570. [Google Scholar] [CrossRef]
  36. Pennisi, G.; Pistillo, A.; Orsini, F.; Cellini, A.; Spinelli, F.; Nicola, S.; Fernandez, J.A.; Crepaldi, A.; Gianquinto, G.; Marcelis, L.F.M. Optimal light intensity for sustainable water and energy use in indoor cultivation of lettuce and basil under red and blue LEDs. Sci. Hortic. 2020, 272, 109508. [Google Scholar] [CrossRef]
  37. Kelly, N.; Choe, D.; Meng, Q.; Runkle, E.S. Promotion of lettuce growth under an increasing daily light integral depends on the combination of the photosynthetic photon flux density and photoperiod. Sci. Hortic. 2020, 272, 109565. [Google Scholar] [CrossRef]
  38. Clavijo-Herrera, J.; Van Santen, E.; Gómez, C. Growth, water-use efficiency, stomatal conductance, and nitrogen uptake of two lettuce cultivars grown under different percentages of blue and red light. Horticulturae 2018, 4, 16. [Google Scholar] [CrossRef] [Green Version]
  39. Weaver, G.; Van Iersel, M.W. Photochemical characterization of greenhouse-grown lettuce (Lactuca sativa L. ‘green towers’) with applications for supplemental lighting control. HortScience 2019, 54, 317–322. [Google Scholar] [CrossRef] [Green Version]
  40. Elkins, C.; Van Iersel, M.W. Longer photoperiods with the same daily light integral increase daily electron transport through photosystem II in lettuce. Plants 2020, 9, 1172. [Google Scholar] [CrossRef]
  41. Agarwal, A.; Dutta Gupta, S.; Barman, M.; Mitra, A. Photosynthetic apparatus plays a central role in photosensitive physiological acclimations affecting spinach (Spinacia oleracea L.) growth in response to blue and red photon flux ratios. Environ. Exp. Bot. 2018, 156, 170–182. [Google Scholar] [CrossRef]
  42. Palmer, S.; Van Iersel, M.W. Increasing growth of lettuce and mizuna under sole-source LED lighting using longer photoperiods with the same daily light integral. Agronomy 2020, 10, 1659. [Google Scholar] [CrossRef]
  43. Landi, M.; Tattini, M.; Gould, K.S. Multiple functional roles of anthocyanins in plant-environment interactions. Environ. Exp. Bot. 2015, 119, 4–17. [Google Scholar] [CrossRef]
  44. Ghorbanzadeh, P.; Aliniaeifard, S.; Esmaeili, M.; Mashal, M.; Azadegan, B.; Seif, M. Dependency of Growth, Water Use Efficiency, Chlorophyll Fluorescence, and Stomatal Characteristics of Lettuce Plants to Light Intensity. J. Plant Growth Regul. 2021, 40, 2191–2207. [Google Scholar] [CrossRef]
  45. Landi, M.; Agati, G.; Fini, A.; Guidi, L.; Sebastiani, F.; Tattini, M. Unveiling the shade nature of cyanic leaves: A view from the “blue absorbing side” of anthocyanins. Plant Cell Environ. 2021, 44, 1119–1129. [Google Scholar] [CrossRef]
  46. Oguchi, R.; Terashima, I.; Chow, W.S. The effect of different spectral light quality on the photoinhibition of Photosystem I in intact leaves. Photosynth. Res. 2021, 149, 83–92. [Google Scholar] [CrossRef]
  47. Cammarisano, L.; Donnison, I.S.; Robson, P.R.H. Producing Enhanced Yield and Nutritional Pigmentation in Lollo Rosso through Manipulating the Irradiance, Duration, and Periodicity of LEDs in the Visible Region of Light. Front. Plant Sci. 2020, 11, 598082. [Google Scholar] [CrossRef]
  48. Cammarisano, L.; Donnison, I.S.; Robson, P.R.H. The Effect of Red & Blue Rich LEDs vs Fluorescent Light on Lollo Rosso Lettuce Morphology and Physiology. Front. Plant Sci. 2021, 12, 603411. [Google Scholar]
  49. Lin, K.H.; Shih, F.C.; Huang, M.Y.; Weng, J.H. Physiological characteristics of photosynthesis in yellow-green, green and dark-green Chinese Kale (Brassica oleracea L. var. alboglabra musil.) under varying light intensities. Plants 2020, 9, 960. [Google Scholar] [CrossRef]
  50. Izzo, L.G.; Arena, C.; De Micco, V.; Capozzi, F.; Aronne, G. Light quality shapes morpho-functional traits and pigment content of green and red leaf cultivars of Atriplex hortensis. Sci. Hortic. 2019, 246, 942–950. [Google Scholar] [CrossRef]
  51. Yan, Z.; He, D.; Niu, G.; Zhou, Q.; Qu, Y. Growth, nutritional quality, and energy use efficiency of hydroponic lettuce as influenced by daily light integrals exposed to white versus white plus red light-emitting diodes. HortScience 2019, 54, 1737–1744. [Google Scholar] [CrossRef] [Green Version]
  52. Lobiuc, A.; Vasilache, V.; Pintilie, O.; Stoleru, T.; Burducea, M.; Oroian, M.; Zamfirache, M.M. Blue and red LED illumination improves growth and bioactive compounds contents in acyanic and cyanic Ocimum basilicum L. Microgreens. Molecules 2017, 22, 2111. [Google Scholar] [CrossRef] [PubMed] [Green Version]
  53. Cho, J.Y.; Yoo, K.S.; Kim, J.; Choi, B.J.; Oh, W. Growth and bioactive compounds of lettuce as affected by light intensity and photoperiod in a plant factory using external electrode fluorescent lamps. Hortic. Sci. Technol. 2020, 38, 645–659. [Google Scholar]
  54. Formisano, L.; Ciriello, M.; Cirillo, V.; Pannico, A.; El-Nakhel, C.; Cristofano, F.; Duri, L.G.; Giordano, M.; Rouphael, Y.; De Pascale, S. Divergent leaf morpho-physiological and anatomical adaptations of four lettuce cultivars in response to different greenhouse irradiance levels in early summer season. Plants 2021, 10, 1179. [Google Scholar] [CrossRef] [PubMed]
Figure 1. Spectral distribution of the BR LED light used in the study light (GreenPower LED dynamic module, Signify, Eindhoven, The Netherlands). Photosynthetic Flux Density at canopy level (PPFD) of 130 µmol m−2 s−1 (BR 130, DLI 7.49 mol m−2 d−1), 259 µmol m−2 s−1 (BR 259, DLI 14.92 mol m−2 d−1), and 389 µmol m−2 s−1 (BR 389, DLI 22.41 mol m−2 d−1).
Horticulturae 08 00114 g001
Figure 2. (a) Leaf net photosynthesis (Pn), (b) leaf transpiration (E), (c) leaf photosynthesis light use efficiency (LUE), and (d) intrinsic water use efficiency (WUEint) in Batavia lettuce cv ‘Blackhawk’ grown under three different light intensities (130, 259, 389 μmol m−2 s−1). Mean value plus standard errors (n = 5, 30 DAT). Different letters indicate significant differences at p < 0.5 according to Tukey’s HSD post hoc test.
Horticulturae 08 00114 g002
Figure 3. Chlorophyll a fluorescence light response curve. (a) Yield of ΦPSII and (b) yield of non-regulated quenching (ΦNO), (c) photochemical quenching (qP), and (d) non-photochemical quenching (NPQ) in Batavia lettuce cv ‘Blackhawk’ grown under three different light intensities (130, 259, 389 μmol m−2 s−1). Means value ± standard error (n = 5, 30 DAT).
Horticulturae 08 00114 g003
Figure 4. Adaxial leaf spectral (380–790 nm) absorbance (A) and transmittance (T) of lettuce type Batavia cv ‘Blackhawk’ grown under three different light intensities (130, 259, 389 μmol m−2 s−1). Mean values (n = 5, 30 DAT).
Horticulturae 08 00114 g004
Figure 5. Heatmap cluster analysis on leaf net photosynthesis (Pn), leaf transpiration (E), leaf photosynthesis light use efficiency (LUE), and intrinsic water use efficiency (WUEint). Chlorophyll a fluorescence parameters: maximal electron transport rate (ETRmax), minimum saturating irradiance (Ik), the slope of the curve (α). The vegetation indexes: normalized difference vegetation index (NDVI), modified chlorophyll absorption reflectance index 1 (MCARI1), greenness index (G), photochemical reflectance index (PRI), Carter index 1 (Crt1), anthocyanin reflectance index (ARI1, ARI2) and carotenoid reflectance index 2 (CRI2), and growth parameters: leaf number, total plant leaf area, fresh leaves weight (leaves FW), fresh root weight (root FW), dry leaf weight (leaves DW), dry root weight (root DW), dry leaf matter (%) (leaves DM), dry root matter (%) (root DM) of Batavia lettuce cv ‘Blackhawk’ grown under three different light intensities (130, 259, 389 μmol m−2 s−1). Original values are ln (x + 1) transformed; data are expressed with Euclidean distances and hierarchical clustering with complete linkage.
Horticulturae 08 00114 g005
Table 1. ETR light response curve-fitting results, maximal electron transport rate (ETRmax), minimum saturating irradiance (Ik), and the slope of the curve (α) in lettuce type Batavia cv Blackhawk grown under three different light intensities (130, 259, 389 μmol m−2 s−1). Mean values ± standard errors (n = 5, 30 DAT); ns indicates no statistical difference.
Light IntensityDLI
(mol m−2 d−1)
ETRmaxIkα
BR 1307.4924.04 ± 10.37197.15 ± 79.50.17 ± 0.06
BR 25914.9249.43 ± 10.69217.94 ± 21.520.23 ± 0.04
BR 38922.4160.49 ± 10.36200.0 ± 35.60.30 ± 0.02
Mean55.65205.030.24
Significance
Lighting treatmentnsnsns
Table 2. Normalized difference vegetation index (NDVI), modified chlorophyll absorption reflectance index 1 (MCARI1), greenness index (G), photochemical reflectance index (PRI), Carter index 1 (Crt1), anthocyanin reflectance index (ARI1, ARI2) and carotenoid reflectance index 2 (CRI2) in Batavia lettuce cv ‘Blackhawk’ grown under three different light intensities (130, 259, 389 μmol m−2 s−1). Mean values ± standard errors (n = 5, 30 DAT). Different letters indicate significative differences at p < 0.5 according to Tukey’s HSD post hoc test. Non-significant or significant differences at p < 0.5, 0.01, and 0.001 are reported as ns or *, **, and ***, respectively.
Light IntensityDLINDVIMCARI1GPRICtr1ARI1ARI2CRI2
(mol m−2 d−1)
BR 1307.490.70 ± 0.000.97 ± 0.02a2.19 ± 0.14a0.04 ± 0.005a2.13 ± 0.150.75 ± 0.06b0.48 ± 0.05b4.86 ± 0.32c
BR 25914.920.72 ± 0.020.87 ± 0.03b2.2 ± 0.29a0.02 ± 0.015ab2.37 ± 0.202.73 ± 0.97b1.61 ± 0.57b7.66 ± 0.59b
BR 38922.410.74 ± 0.020.72 ± 0.01c1.38 ± 0.07b−0.01 ± 0.002b2.22 ± 0.066.6 ± 0.93a3.48 ± 0.46a10.74 ± 0.98a
Mean0.720.851.920.022.243.361.867.75
Significance
Lighting treatmentns*****ns********
Table 3. Plant growth in terms of leaf number, total plant leaf area, fresh leaves weight (leaves FW), fresh root weight (root FW), dry leaves weight (leaves DW), dry root weight (root DW), dry leaves biomass content (leaves DM), dry root biomass content (root DM) in lettuce type Batavia cv ‘Blackhawk’ grown under three different light intensities (130, 259, 389 μmol m−2 s−1). Mean values ± standard errors (n = 5, 33 DAT). Different letters indicate significant differences at p < 0.5 according to Tukey’s HSD post hoc test. Non-significant or significant differences at p < 0.5 and 0.01 are reported as ns, *, and ** respectively.
Light IntensityDLI
(mol m−2 d−1)
Leaf Number
(n Plant−1)
Total Plant Leaf Area
(cm2 plant−1)
Leaves FW
(g FW Plant−1)
Root FW
(g FW Plant−1)
Leaves DW
(g DW Plant−1)
Root DW
(g DW Plant−1)
Leaves DM%Root DM%
BR 1307.4927.20 ± 0.731340.07 ± 56.7588.23 ± 4.02b3.32 ± 0.41b5.48 ± 0.32b0.26 ± 0.05b6.20 ± 0.097.48 ± 0.61b
BR 25914.9226.80 ± 2.111293.03 ± 83.80112.39 ± 5.41b5.25 ± 0.31b6.83 ± 0.61b0.45 ± 0.05b6.03 ± 0.298.49 ± 0.37ab
BR5 38922.4130.00 ± 1.791203.02 ± 60.02156.87 ± 12.58a17.11 ± 1.38a10.26 ± 0.70a1.77 ± 0.22a6.57 ± 0.1710.23 ± 0.78a
Mean281278.71119.168.567.520.826.278.73
Significance
Lighting treatmentnsns********ns*
Publisher’s Note: MDPI stays neutral with regard to jurisdictional claims in published maps and institutional affiliations.

