Article

C-CorA: A Cluster-Based Method for Correlation Analysis of RNA-Seq Data

1
Zhejiang Provincial Key Laboratory of Horticultural Plant Integrative Biology, Zhejiang University, Hangzhou 310058, China
2
School of Mathematical Science, Zhejiang University, Hangzhou 310027, China
*
Author to whom correspondence should be addressed.
These authors contributed equally to this work.
Horticulturae 2022, 8(2), 124; https://doi.org/10.3390/horticulturae8020124
Submission received: 19 November 2021 / Revised: 23 January 2022 / Accepted: 26 January 2022 / Published: 29 January 2022

Abstract

:
Correlation analysis is a routine method of biological data analysis. In the process of RNA-Seq analysis, differentially expressed genes could be identified by calculating the correlation coefficients in the comparison of gene expression vs. phenotype or gene expression vs. gene expression. However, due to the complicated genetic backgrounds of perennial fruit, the correlation coefficients between phenotypes and genes are usually not high in fruit quality studies. In this study, a cluster-based correlation analysis method (C-CorA) is presented for fruit RNA-Seq analysis. C-CorA is composed of two main parts: the clustering analysis and the correlation analysis. The algorithm is described and then integrated into the MATLAB code and the C# WPF project. The C-CorA method was applied to RNA-Seq datasets of loquat (Eriobotrya japonica) fruit stored or ripened under different conditions. Low temperature conditioning or heat treatment of loquat fruit can alleviate the extent of lignification that occurs because of postharvest storage under low temperatures (0 °C). The C-CorA method generated correlation coefficients and identified many candidate genes correlated with lignification, including EjCAD3 and EjCAD4 and transcription factors such as MYB (UN00328). C-CorA is an effective new method for the correlation analysis of various types of data with different dimensions and can be applied to RNA-Seq data for candidate gene detection in fruit quality studies.

1. Introduction

High-throughput transcriptome sequencing (RNA-Seq) has become the main choice to measure gene expression levels. The correct identification of differentially expressed genes between specific conditions is a key to understanding phenotypic variation. The fold change of gene expression between samples and the absolute gene expression value are the main criteria for the identification of differentially expressed genes [1,2]. To mine more useful information, deep data analysis is necessary, such as the correlation analysis between gene expression value and phenotypic variation. Many different correlation-based methods, such as the WGCNA (weighted gene co-expression network analysis), have been used to find the correlation between gene expressions and phenotypic data, or between genes [3,4,5]. There are usually three different ways of ranking statistical correlation according to Spearman, Kendall and Pearson. Each coefficient will represent the result as ‘r’. However, these statistical methods cannot deal directly with multi-dimensional data, such as the phenotypic data which is controlled by multiple genes.
Unlike model plants, perennial woody plants have a long-life cycle and a relatively large and complex genome (e.g., polyploidy and high heterogeneity). Furthermore, bud mutation makes the genetic background of the latter even more complicated [6]. Some traits of woody plants are controlled by multiple genes, and some fruit traits are quantitative, which could be easily affected by the environment. The fruit traits could even be different in the same tree due to different amounts of sunshine along the tree. These environmental factors introduce an amount of noise in the detection of correlation between these traits and the expression values of the genes if common approaches were used, resulting in decreased sensitivity for identifying trait-related genes. Therefore, a more inclusive correlation analysis approach is required.
In this study, we describe a new cluster-based correlation analysis (C-CorA) method which is applied to perennial plants with complicated genetic backgrounds. It could reduce the environmental effect on the traits when calculating the correlation between gene expression and phenotypic values, which is greatly helpful in fruit quality research. We describe the methodology and apply it to a set of RNA-seq data obtained from loquat, kiwifruit and persimmon.
Loquat fruits are sensitive to low temperatures and display chilling injuries, including lignin accumulation during low-temperature storage. Lignification causes an undesirable increase in fruit firmness, leading to a leathery texture [7,8]. Some transcription factors have been reported to be involved in the loquat fruit lignification process, including EjMYB1/2 [9], EjMYB8 [10] and EjAP2-1 [11]. Chilling-induced lignification can be alleviated by an initial low-temperature conditioning (LTC; 5 °C for six days followed by transfer to 0 °C) or heat treatment (HT; 40 °C for four hours followed by transfer to 0 °C). In our previous study [12], we compared the transcriptome profiles of loquat fruit samples under LTC or HT with those stored at 0 °C at five points from day one to day eight after treatment. A total of 48 RNA-Seq samples, including controls and treatments, were analyzed. We identified 5824 differently expressed genes between the LTC and 0 °C samples and 3981 between the HT and 0 °C samples [12]. Correlation analysis was limited, however, due to the low correlation coefficients obtained from the Pearson calculations. Here, we carried out a more detailed analysis using the C-CorA method and identified additional genes related to the loquat lignification process during postharvest storage which were not detected by the Pearson calculation method in the previous study. Using the C-CorA method, we also detected additional genes related to the cell wall metabolism in kiwifruit and additional genes related to acetaldehyde production in persimmon.

2. Materials and Methods

2.1. Plant Materials and Treatments

The loquat fruits (Eriobotrya japonica Lindl. cv. Luoyangqing) were harvested at commercial maturity from the orchard of a lvyuanguopin cooperative in Luqiao, Zhejiang, China. For the identification and details of these samples, please refer to the following references [11,12]. Fruits were transported to the laboratory on the harvest day and screened for uniform size and maturity with no disease or mechanical damage. The fruit samples were divided into three pools with three biological replicates each. The first pool of fruit was stored at 0 °C. The second pool was subjected to HT (40 °C for 4 h and then transferred to 0 °C). The third pool was subjected to LTC (5 °C for 6 d then transferred to 0 °C for 2 d) [9]. Fruit flesh tissues were collected at days 0, 1, 2, 4, 6 and 8 during each treatment.
The lignin content of loquat fruits was determined using the method as described by Shan et al [13]. The specific parameter settings during each treatment are shown in the work of Xu et al. [9] and Liu et al [12].

2.2. RNA-Seq Analysis

Total RNA extraction from the flesh tissues was carried out with the QIAGEN RNeasy Plant Mini Kit following the manufacturer’s instructions (QIAGEN, Chatsworth, CA, USA). The RNA quality was evaluated by electrophoresis on 1% agarose gels and quantity was determined by a NanoDrop 1000 spectrophotometer (Thermo Scientific, Wilmington, DE, USA). The construction of strand-specific RNA-Seq libraries was carried out using the protocol from Zhong et al. [14] and sequencing was completed on the Illumina HiSeq 2500 platform with single-end mode.
Raw RNA-Seq reads were first trimmed with Trimmomatic [15], and reads shorter than 40 bp were discarded. Reads were then aligned to the ribosomal RNA database [16] using bowtie [1] and aligned sequences were removed. The cleaned reads were assembled using Trinity [17] with minimum kmer coverage 10. The iAssembler was used to remove the redundant contigs [18]. The raw reads count of each contig was normalized to RPKM (reads per kilobase exon model per million mapped reads). The assembled contigs were blasted against three databases for gene annotation: TrEMBL, Swiss-Prot and Arabidopsis protein (TAIR), with an E-value cutoff of 1 × 10⁻⁵.

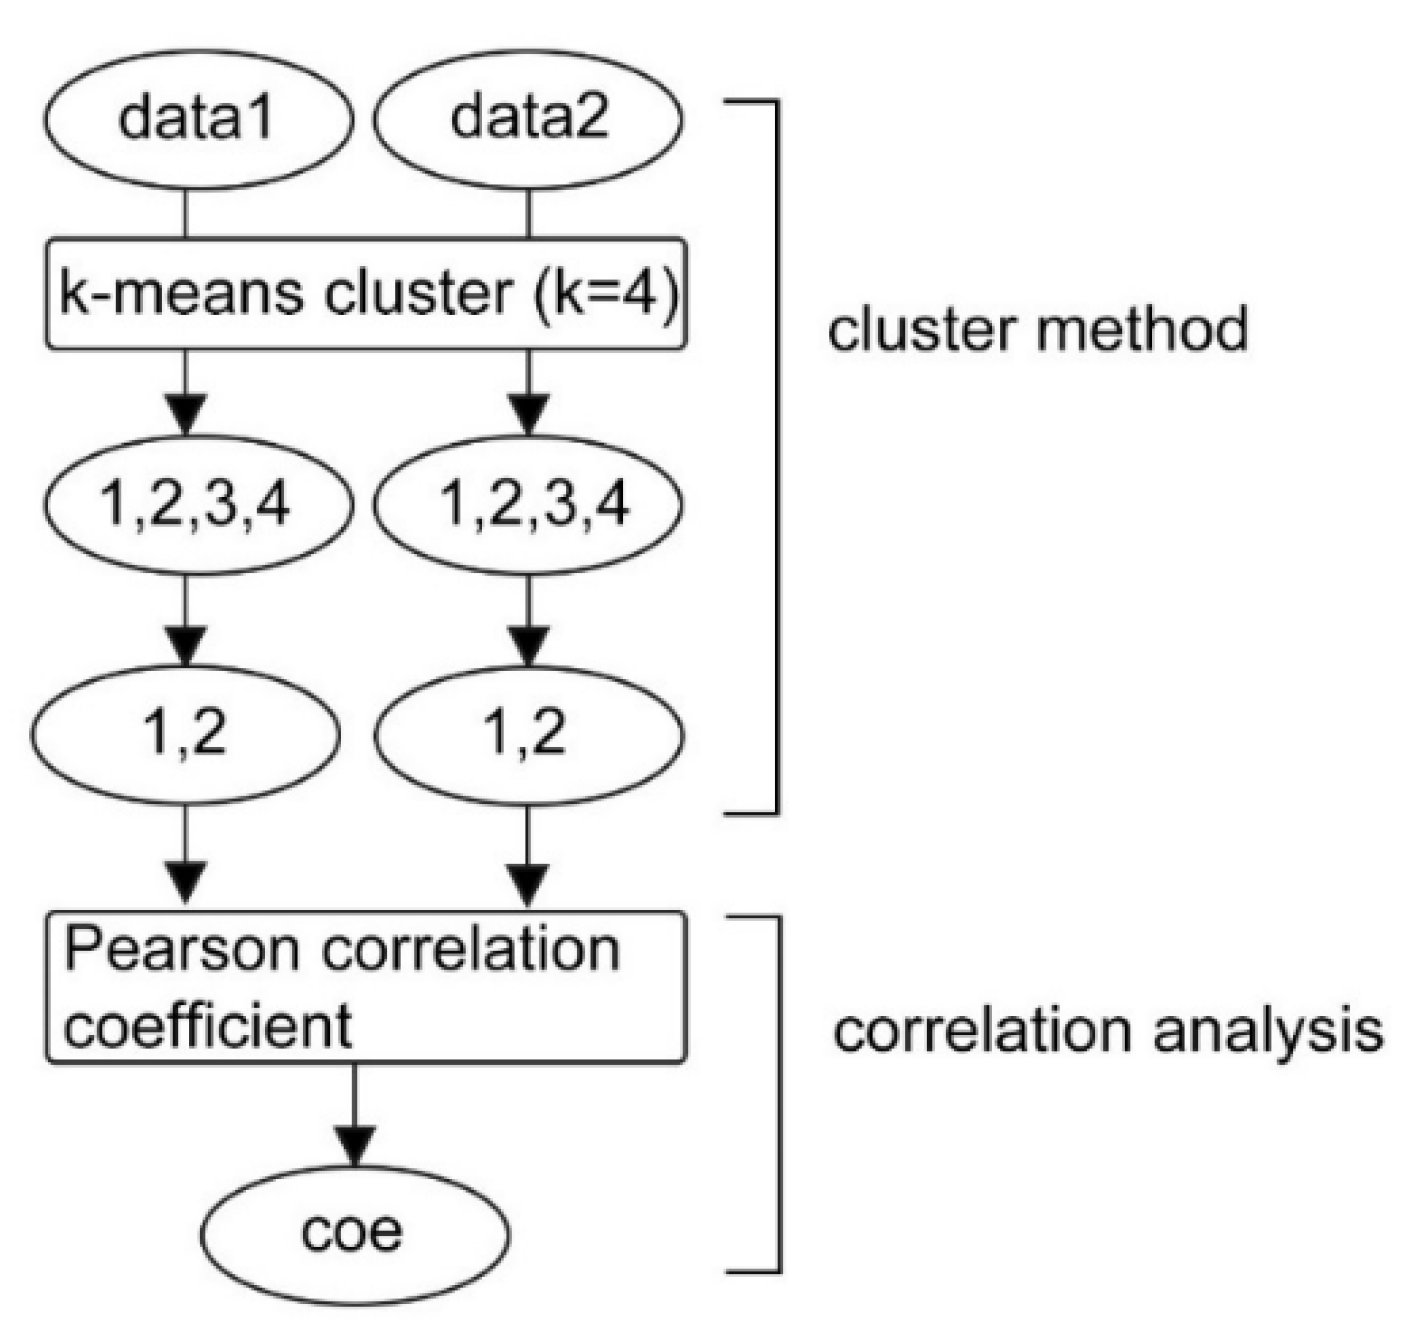
2.3. Cluster-Based Correlation Method (C-CorA)

The cluster-based correlation method, named C-CorA, calculates the correlation coefficient using gene clustering results, based on gene expression and phenotype. In this study, we combined the basic k-means clustering method and the Pearson correlation coefficient to analyze the RNA-Seq of loquat fruit.
The variable k was set to 4 in the k-means clustering method in this study. The four clusters were then assembled into several 2-group combinations for the correlation coefficient calculations. There are C (4, 1) + C (4, 2)/2 = 7 different combinations in total for each of the two inputs which gave 7 × 7 = 49 correlation coefficients. Then the threshold was set from 0.7 to 0.9 to obtain the correlated and highly correlated candidate gene sets. The algorithm is written as follows, using MATLAB (R2018b, version 9.5, an environment developed by MathWorks) in Algorithm 1:
Algorithm 1: Cluster-Based Correlation Coefficient Calculation.
Input: Spheno, Sexp, k, p
Output: Coe
1: v = kmeans ( S p h e n o ,   k )
2: fori = 1, 2, …, 7 do
3:    v i = f d e g e n e r a t i o n i ( v )
4: end for
5: while readline Sexp do
6:    w = kmeans ( S e x p ,   k )
7:   for i = 1, 2, …, 7 do
8:    w i = f d e g e n e r a t i o n i ( w )
9:      for j = 1, 2, …, 7 do
10:       c = abs(corr( w i , v j ), pearson)
11:       if c ≥ p then
12:          store c in Coe
13:       end if
14:    end for
15:   end for
16: end while

3. Results

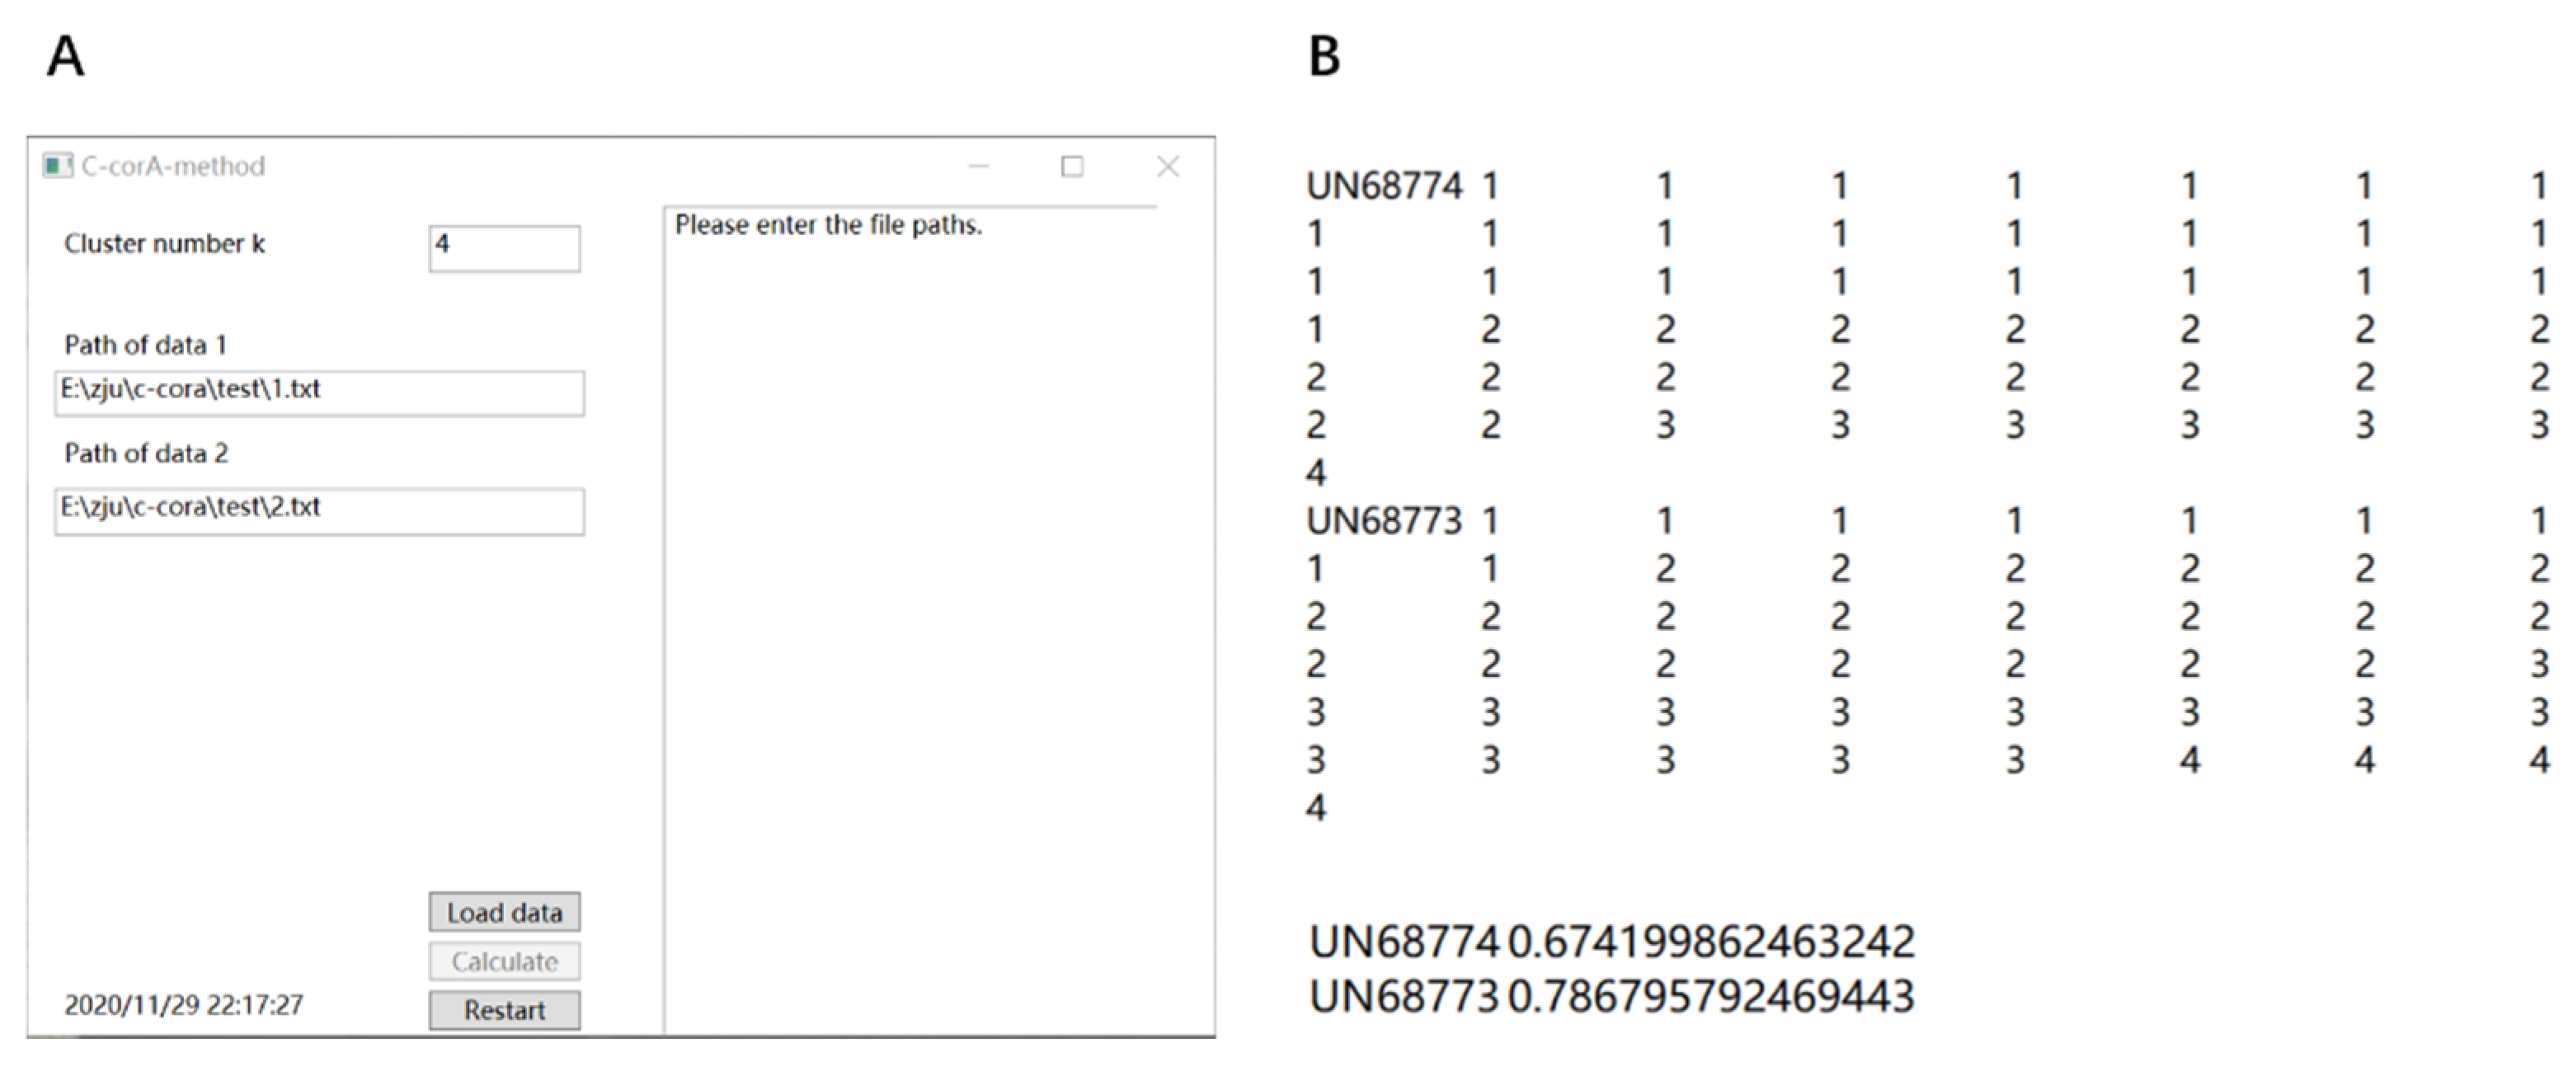
3.1. Method Implementation

The C-CorA method contains two modules: the cluster module and the correlation analysis module (Figure 1). This approach is highly flexible, as it can process various types of data and each of the two modules can be replaced with other suitable algorithms. The output is the correlation coefficients, which can be used in downstream analyses.
The algorithm used in the C-CorA method is written in two ways: MATLAB code and C# WPF (Windows Presentation Foundation). The algorithm written using MATLAB code is suitable for large-scale data sets, while the C# WPF is suitable for small-scale data sets and researchers with less experience in bioinformatics. The code and implementation results can be accessed on the website https://github.com/ili-4/C-corA (accessed: 20 January 2021). The MATLAB code can be run with MATLAB R2018b under the Windows or Linux systems. The cluster method used in the algorithm is the k-means function of MATLAB and the correlation calculation method is the corr function of MATLAB. The C# WPF is a visual program in windows that provides a convenient way to use the C-CorA method (Figure 2A). The program requires two paths for the input of data files, and the user can adjust the value of k used in the k-means clustering module of C-CorA. The output includes results of clustering and correlation coefficient calculations. An example of the output file is shown in Figure 2B, which was generated by the C# WPF application of C-CorA using the RNA-seq data of loquat fruit as mentioned above.

3.2. Transcriptome Analysis Using C-CorA Method

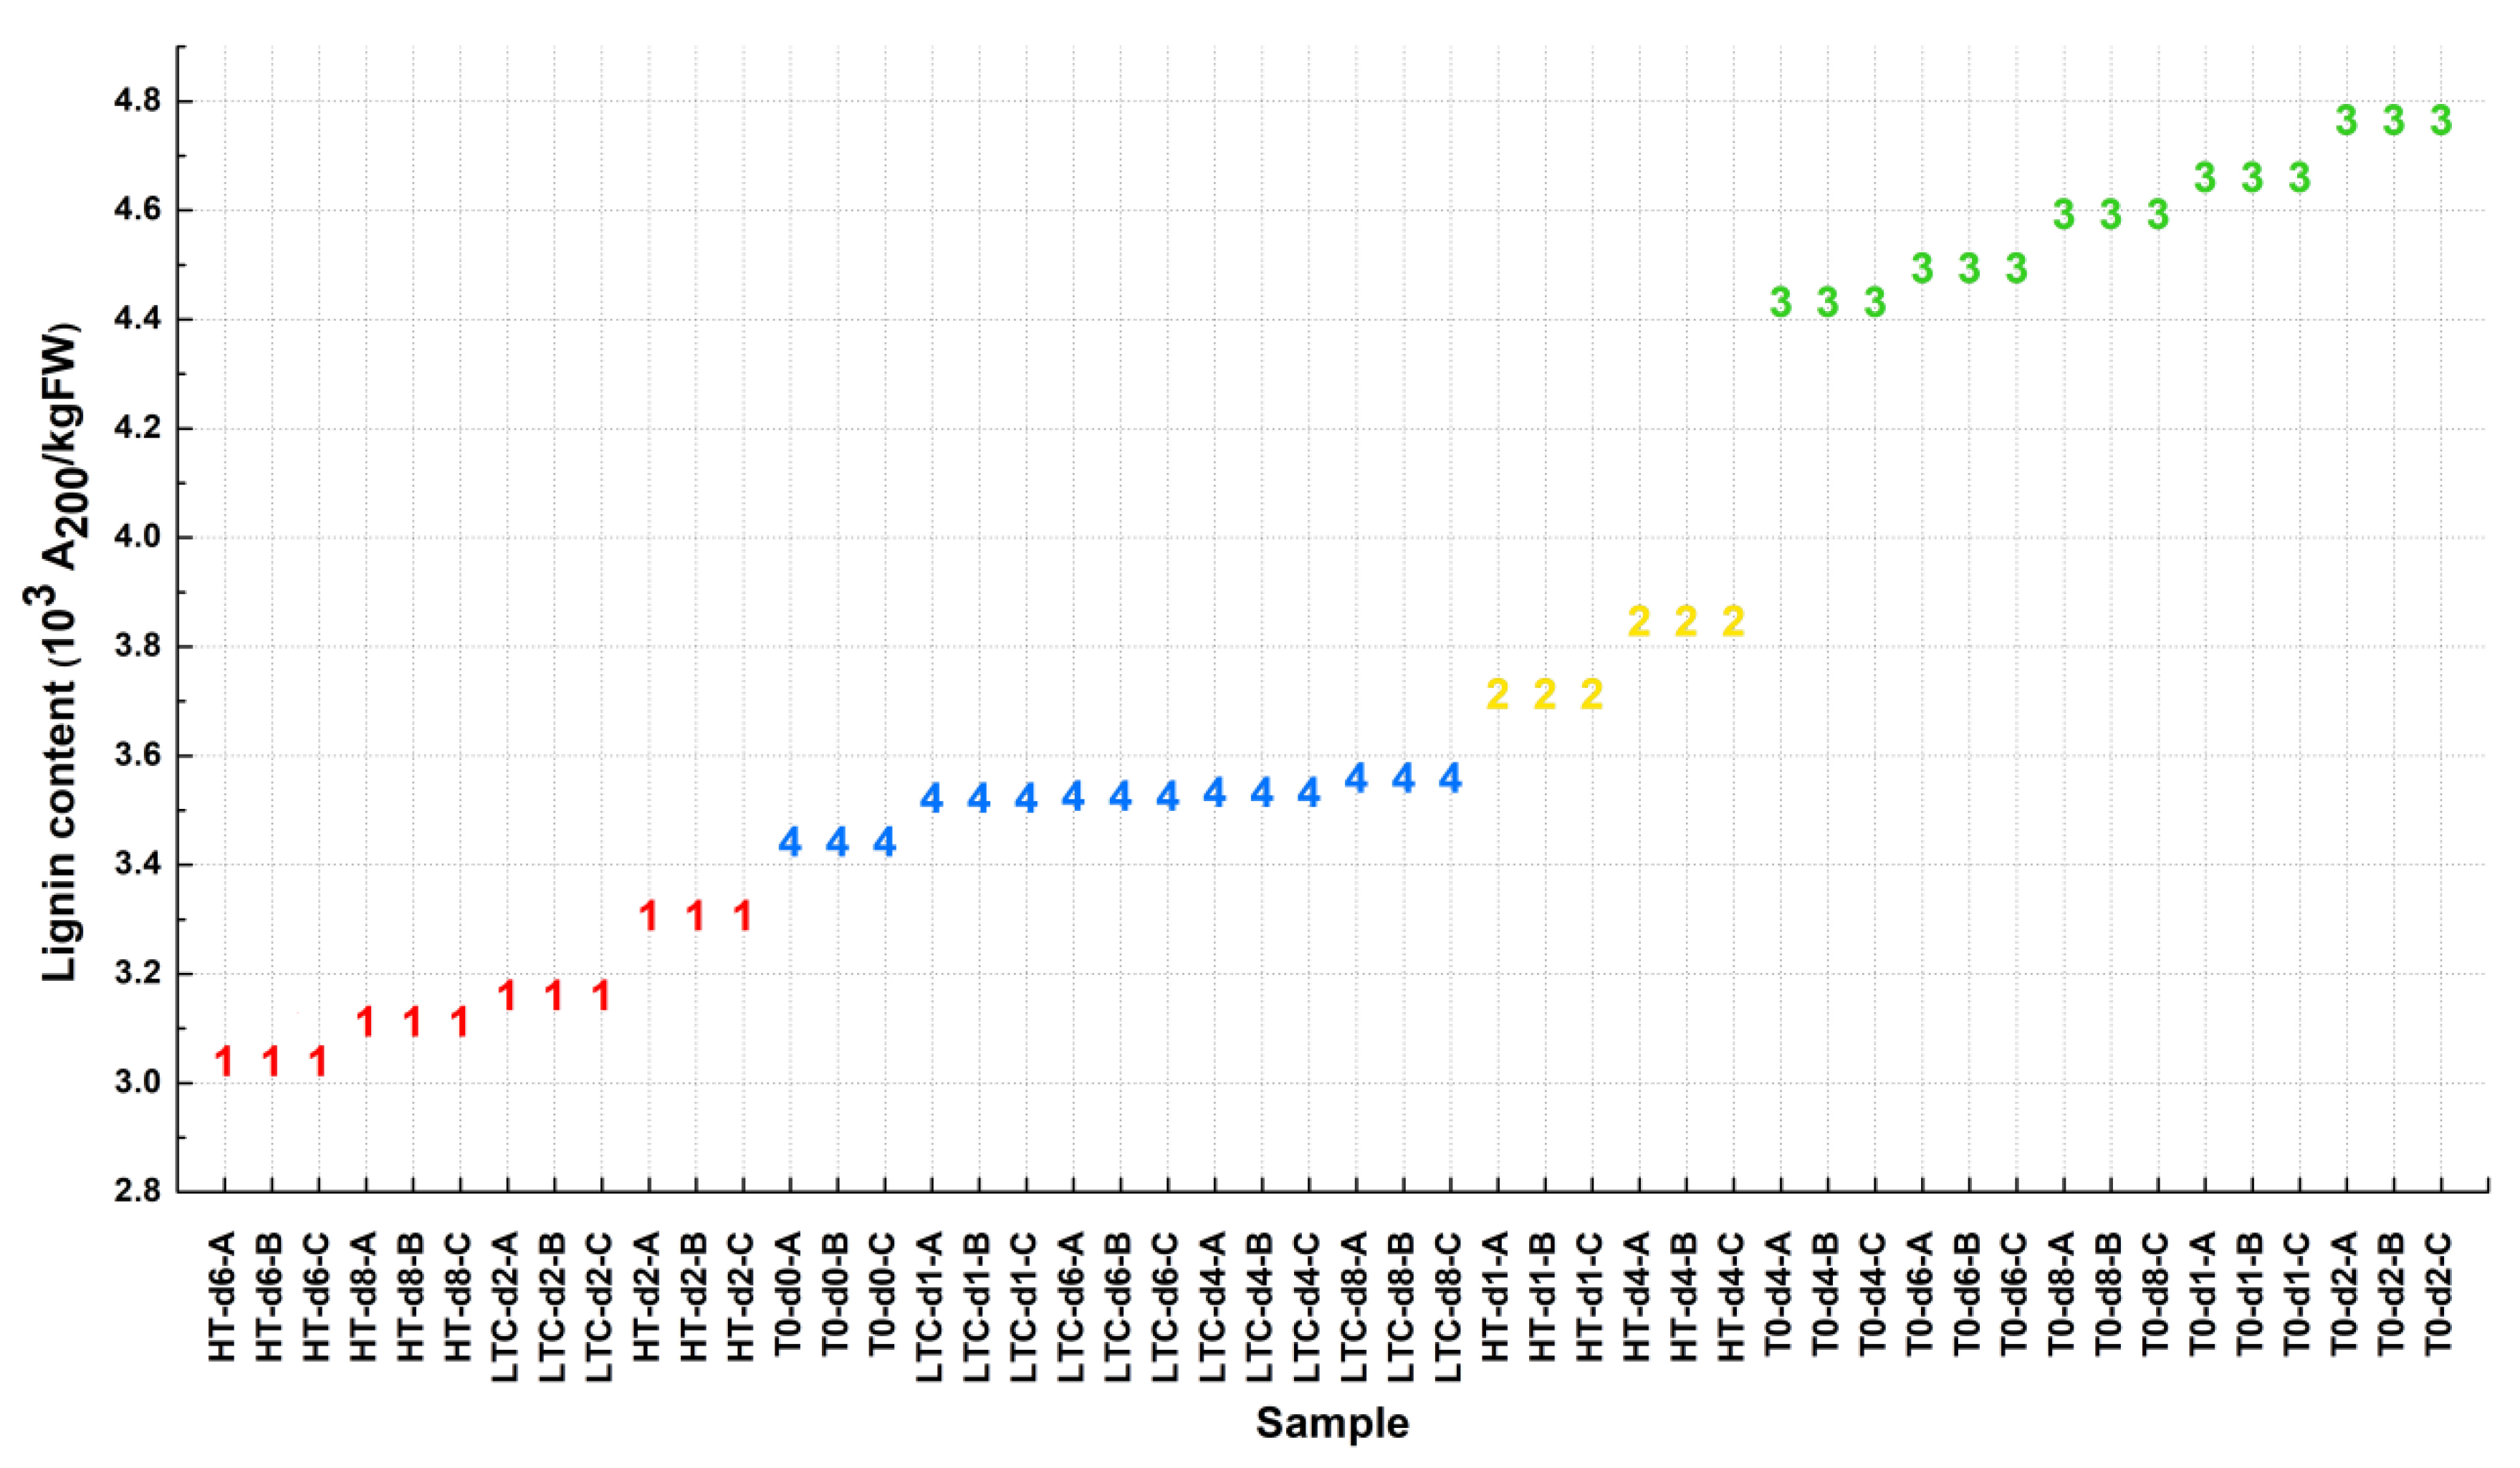
3.2.1. Clustering of Loquat Samples Based on Lignin Content

To get a more convincing 2-cluster pattern, the k-means method was used for the initial cluster. Setting the k parameter as 4, 48 loquat samples were randomly combined and clustered into four groups based on the lignin content (Figure 3). Then these clustered groups were randomly combined into seven 2-classes: ((1), (2, 3, 4)), ((2), (1, 3, 4)), ((3), (1, 2, 4)), ((4), (1, 2, 3)), ((1, 2), (3, 4)), ((1, 3), (2, 4)) and ((1, 4), (2, 3)). For further correlation coefficient calculations, the lignin content value was replaced by the discrete variable 1 or 2 in each 2-class. For example, in ((1), (2, 3, 4)), the lignin content value was substituted as 1 in (1) and 2 in (2, 3, 4).

3.2.2. Clustering of Gene Expression Data

The gene expression value was processed using the same cluster method as above. The k parameter was set to 4 as well. We divided the gene expression value into four groups and then randomly combined them into seven 2-classes for subsequent calculations. In each 2-class, the discrete variable 1 or 2 was substituted for the gene expression value, i.e., gene expression values were replaced as 1 in one class, and 2 in the other class.

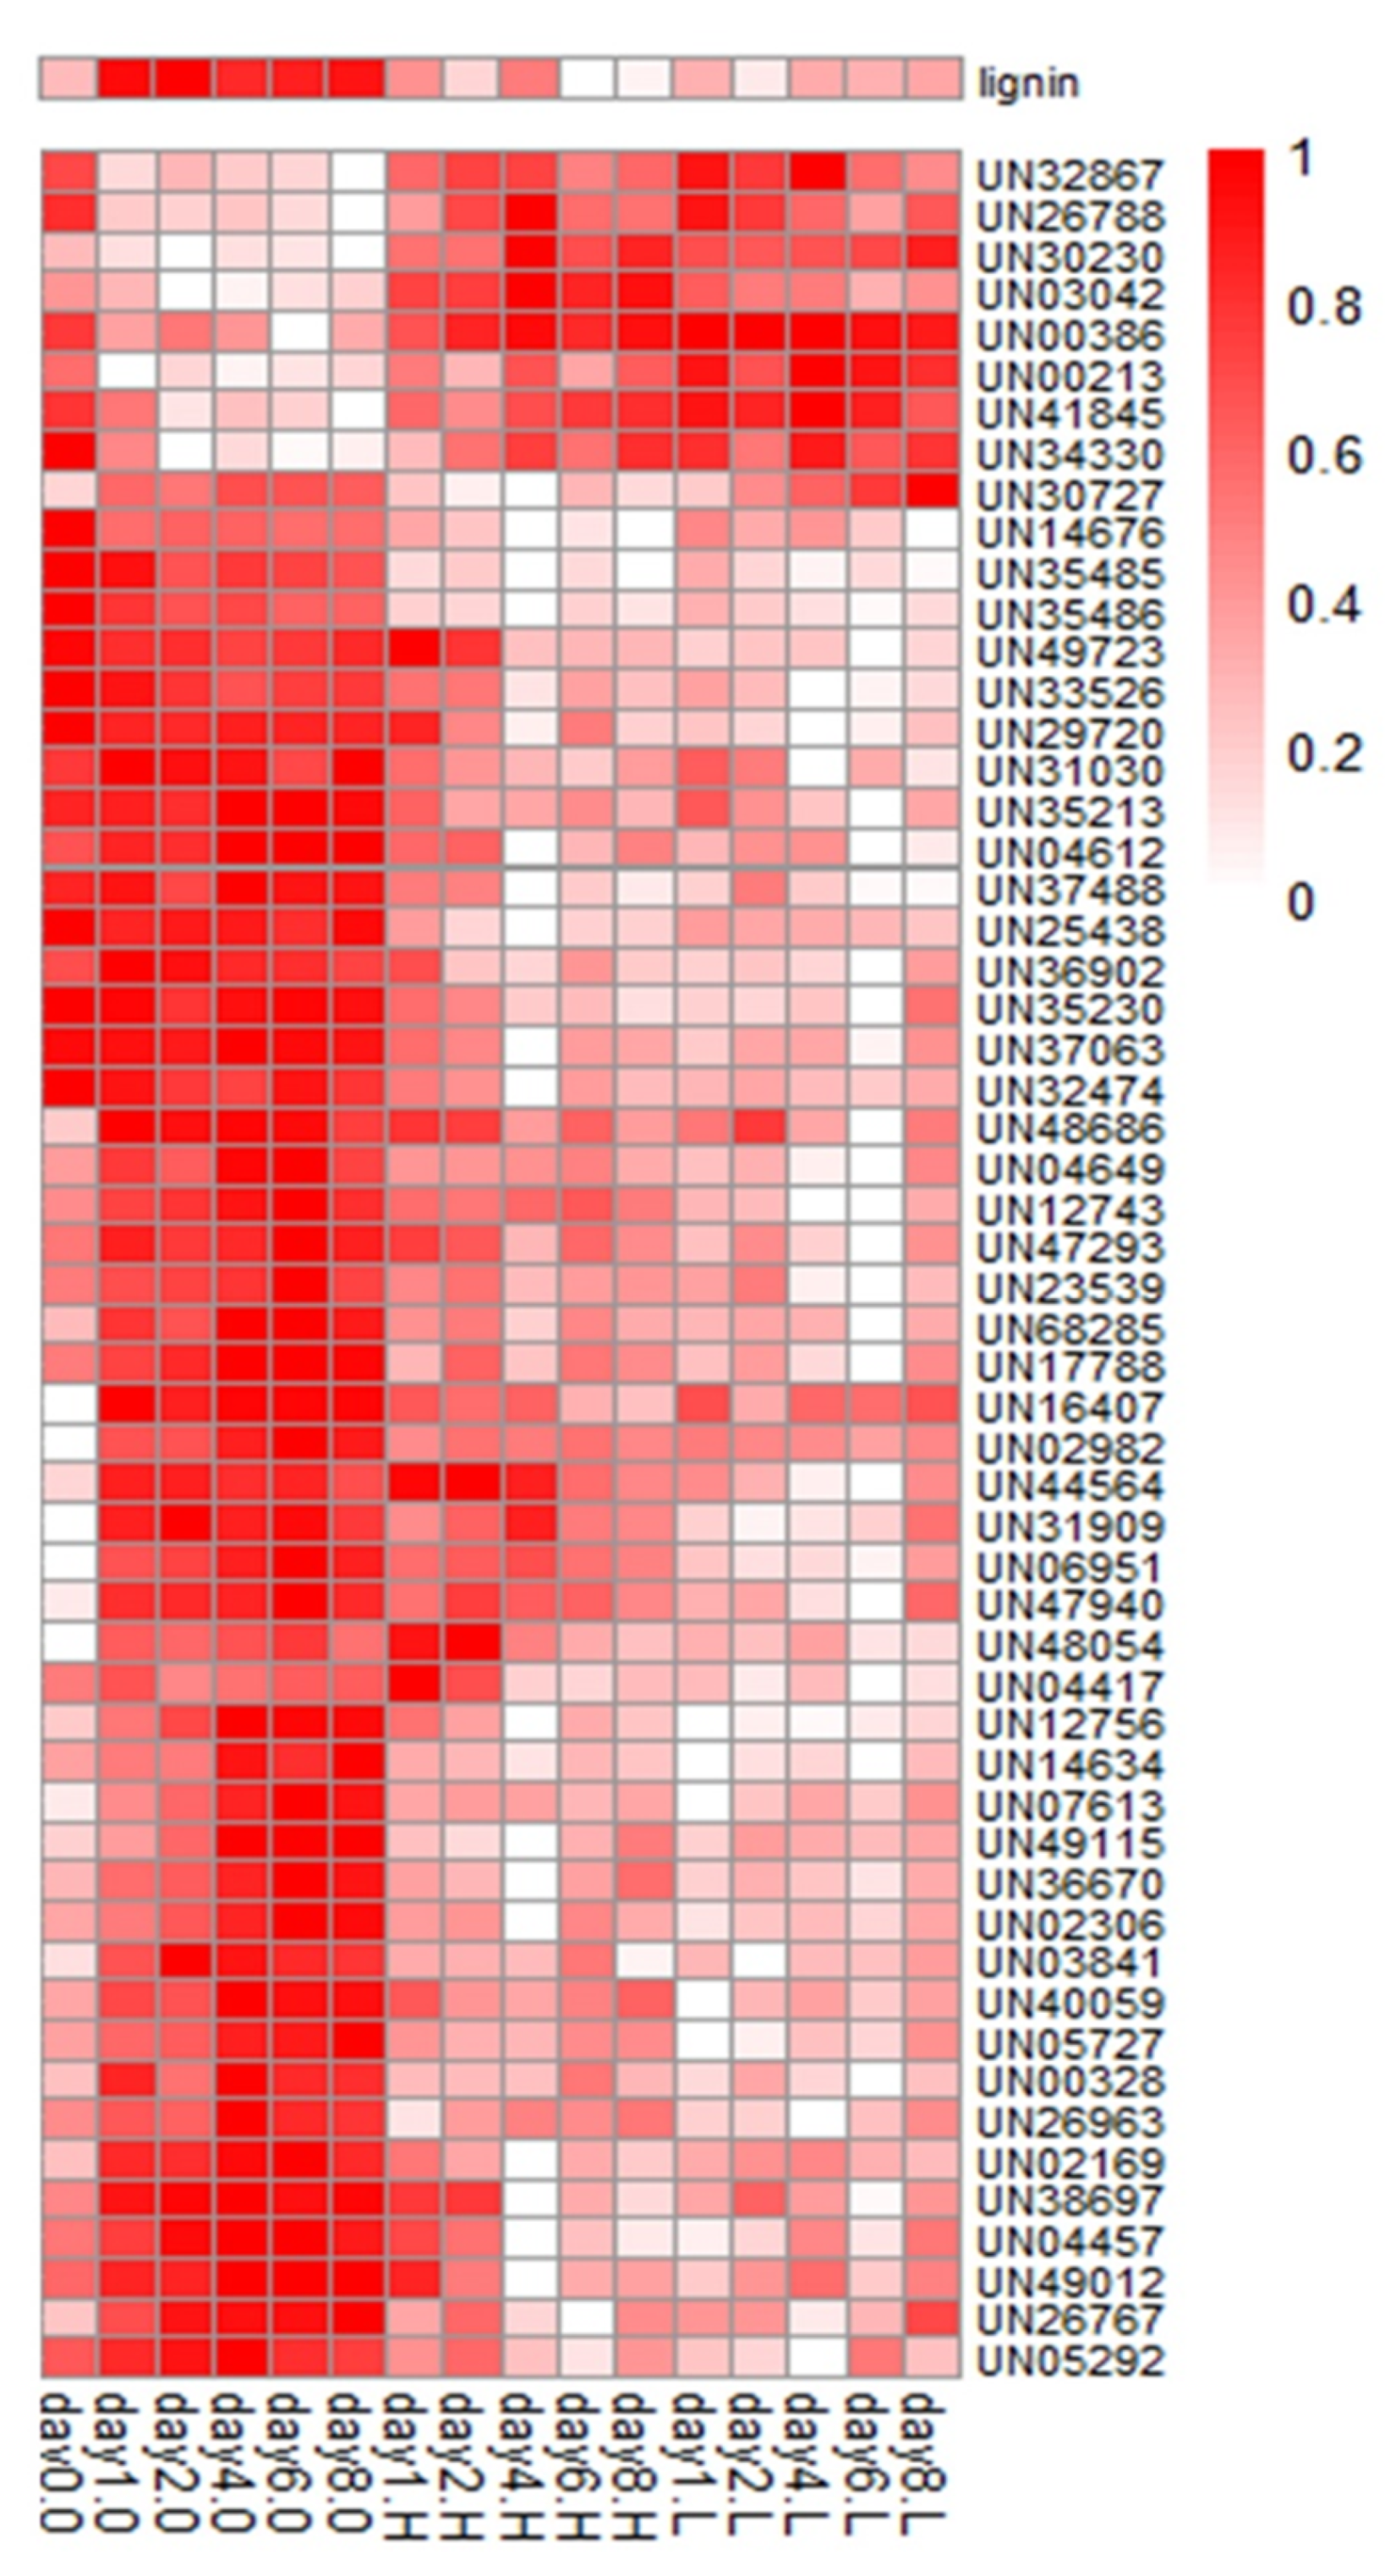
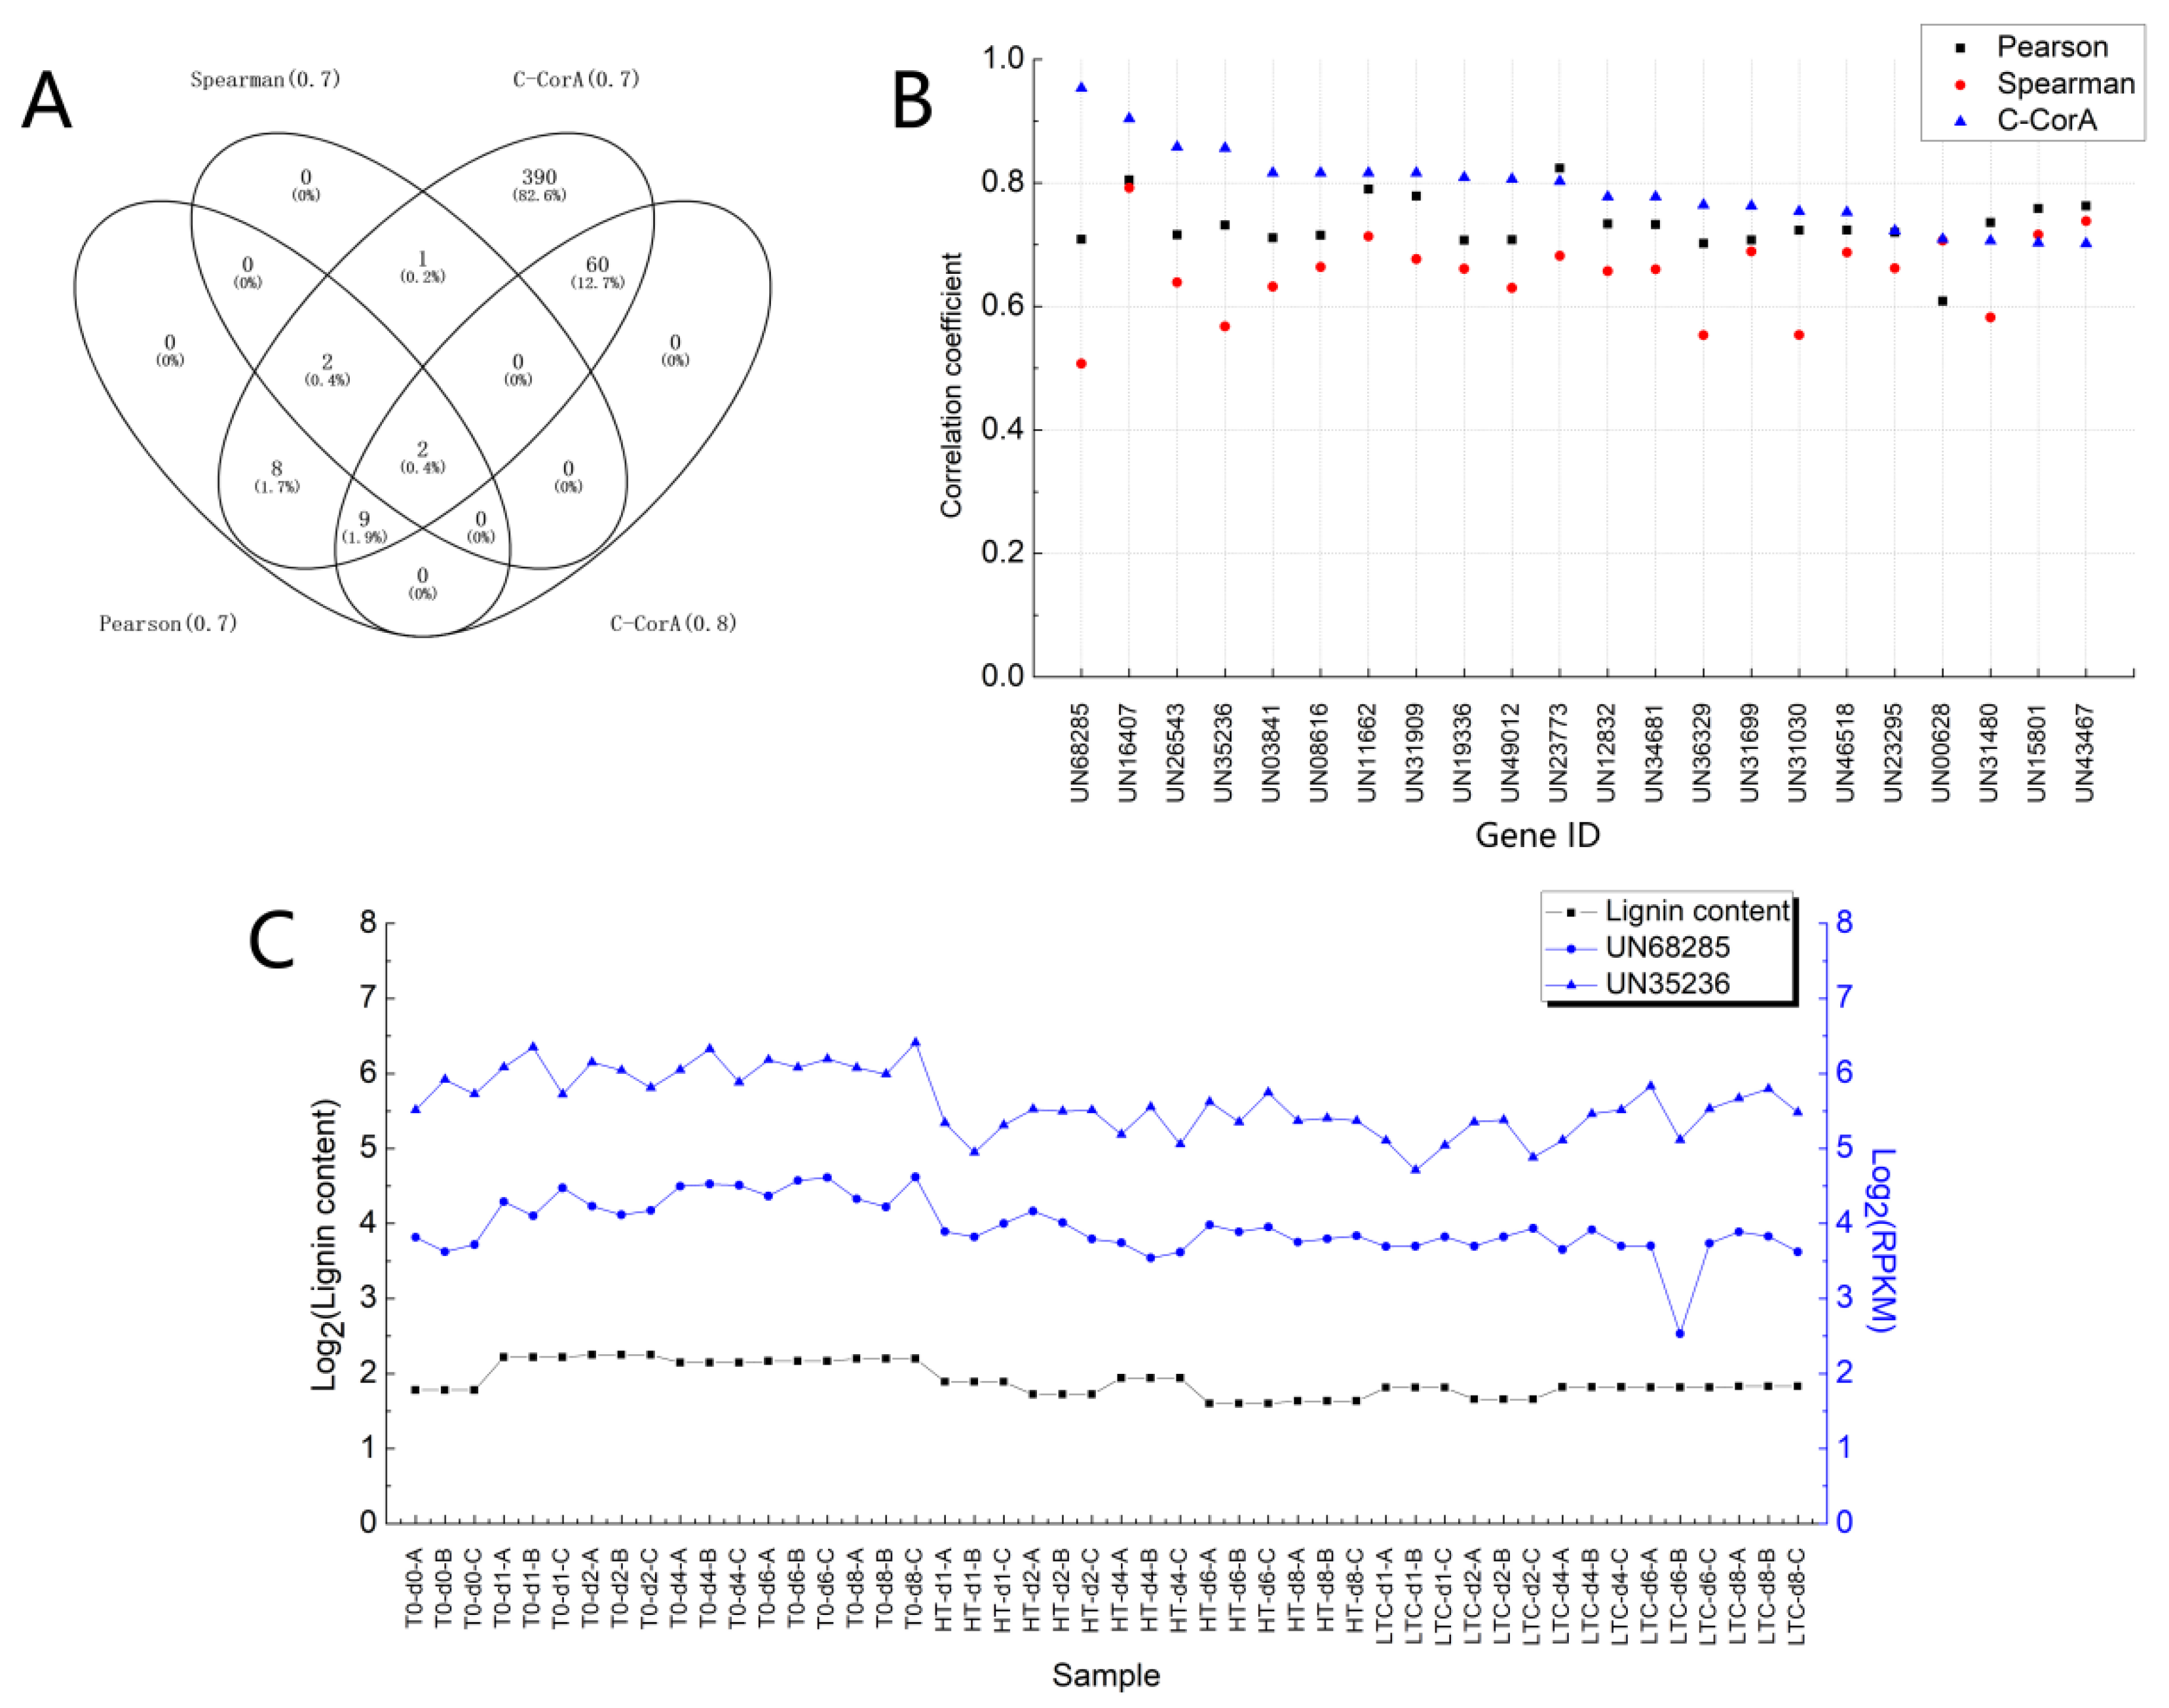
3.2.3. Correlation Analysis of Gene Expression vs. Lignin Content

In correlation analysis, the strategy was to calculate all possible phenotype vs. gene expression combinations and then identify the most reliable pair. In this case, seven 2-class lignin content groups and seven 2-class gene expression groups were used for a Pearson correlation coefficient calculation. For each sample, there were seven patterns of phenotype and seven patterns of gene expression value. Be aware that these values only contain the discrete variables 1 and 2. Throughout the Pearson calculations for the seven groups of lignin content vs. the seven groups of gene expression, once the coefficient value appeared higher than the threshold given by the user, this gene was marked. The threshold was set as 0.7, 0.8 and 0.9. For each pattern of phenotype, the count of marked genes was summarized in Table 1. The 2-group pattern ((3), (1, 2, 4)) of phenotype had the most genes (Table 1). Moreover, the separation of group (3) and group (1, 2, 4) was consistent with the lignin content distribution for the 48 loquat fruit samples (Figure 3), thus, we used ((3), (1, 2, 4)) for further analysis.
For the 2-group pattern of phenotype ((3), (1, 2, 4)), 53 of the 71 highly correlated genes (correlation coefficient greater than 0.8) were well annotated (Table S1). The count of annotated genes with a correlation coefficient between 0.7 and 0.8 was 307. The correlated genes were more numerous than reported in our previous study [12]. The expression patterns of the 53 highly correlated genes are shown in Figure 4.
To assess the validity and accuracy of the C-CorA method, we compared the correlation coefficients calculated by C-CorA to those of the Pearson method and the Spearman method; the results are summarized in Figure 5. Genes highly related to the lignin content which were detected by the Pearson method and the Spearman method are all included in the result from C-CorA (Figure 5A). The C-CorA method identified a larger number of candidate genes, and the correlation coefficient values showed better discrimination. Using the Pearson or Spearman methods, 22 genes with correlation coefficients greater than 0.7 were screened (Figure 5B). For these 22 genes, the correlation coefficients calculated using C-CorA were consistent with at least one of the traditional methods, except for two genes (UN68285 and UN35236). The correlation coefficients for these two genes calculated by the three methods are different. Comparison of the RPKM values for these two genes showed that the expression of UN68285 and UN35236 in all 48 samples (Figure 5C) was similar to trends in the lignin content, suggesting that these two genes are related to lignin content.
In our previous study, we constructed co-expression networks between genes based on the Pearson product-moment correlation coefficient to determine lignin-related genes. Then EjCAD3 (UN68301) and other genes were identified as candidate genes [12]. Using the C-CorA analysis, EjCAD3 (UN68301) also showed a high correlation signal (Table S1). Other genes identified by C-CoA included a CBL-interacting protein kinase 08 (UN00386), an RNA binding protein (UN30230), a gibberellin 3-beta hydroxylase (UN68191) and so on, which was also consistent with the former work [12].
Among the newly identified genes were two lignin-related genes, encoding a CAD (cinnamyl alcohol dehydrogenase) (UN26767, EjCAD4) and a MYB transcription factor (UN00328). These two genes were not identified in the previous work [12]. The expression levels of EjCAD4 and MYB (UN00328) decreased in LTC and HT treated samples compared with control samples (Figure 6), and they were positively correlated to the lignin content (the correlation coefficients with lignin content were 0.86 and 0.87, respectively). CAD is an enzyme that participates in the last step of monolignol biosynthesis. AtCAD4 (AT3G19450), the homologous gene EjCAD4 in Arabidopsis is involved in lignin biosynthesis and reported to act as an essential component in pathogen defense [19,20]. Moreover, the homologous gene EjCAD4 in Chinese White Poplar (Populus tomentosa Carr.), JX986606.1, has also been identified as a candidate gene related to lignification by SSR markers [21].
The expression of other transcription factors was also identified as being correlated with lignin content, including ERF (UN41017), BHLH (UN35332), MYB (UN31768, UN02037), WRKY (UN10110 and UN23662), NAC (UN48890) and so on (Table S1).

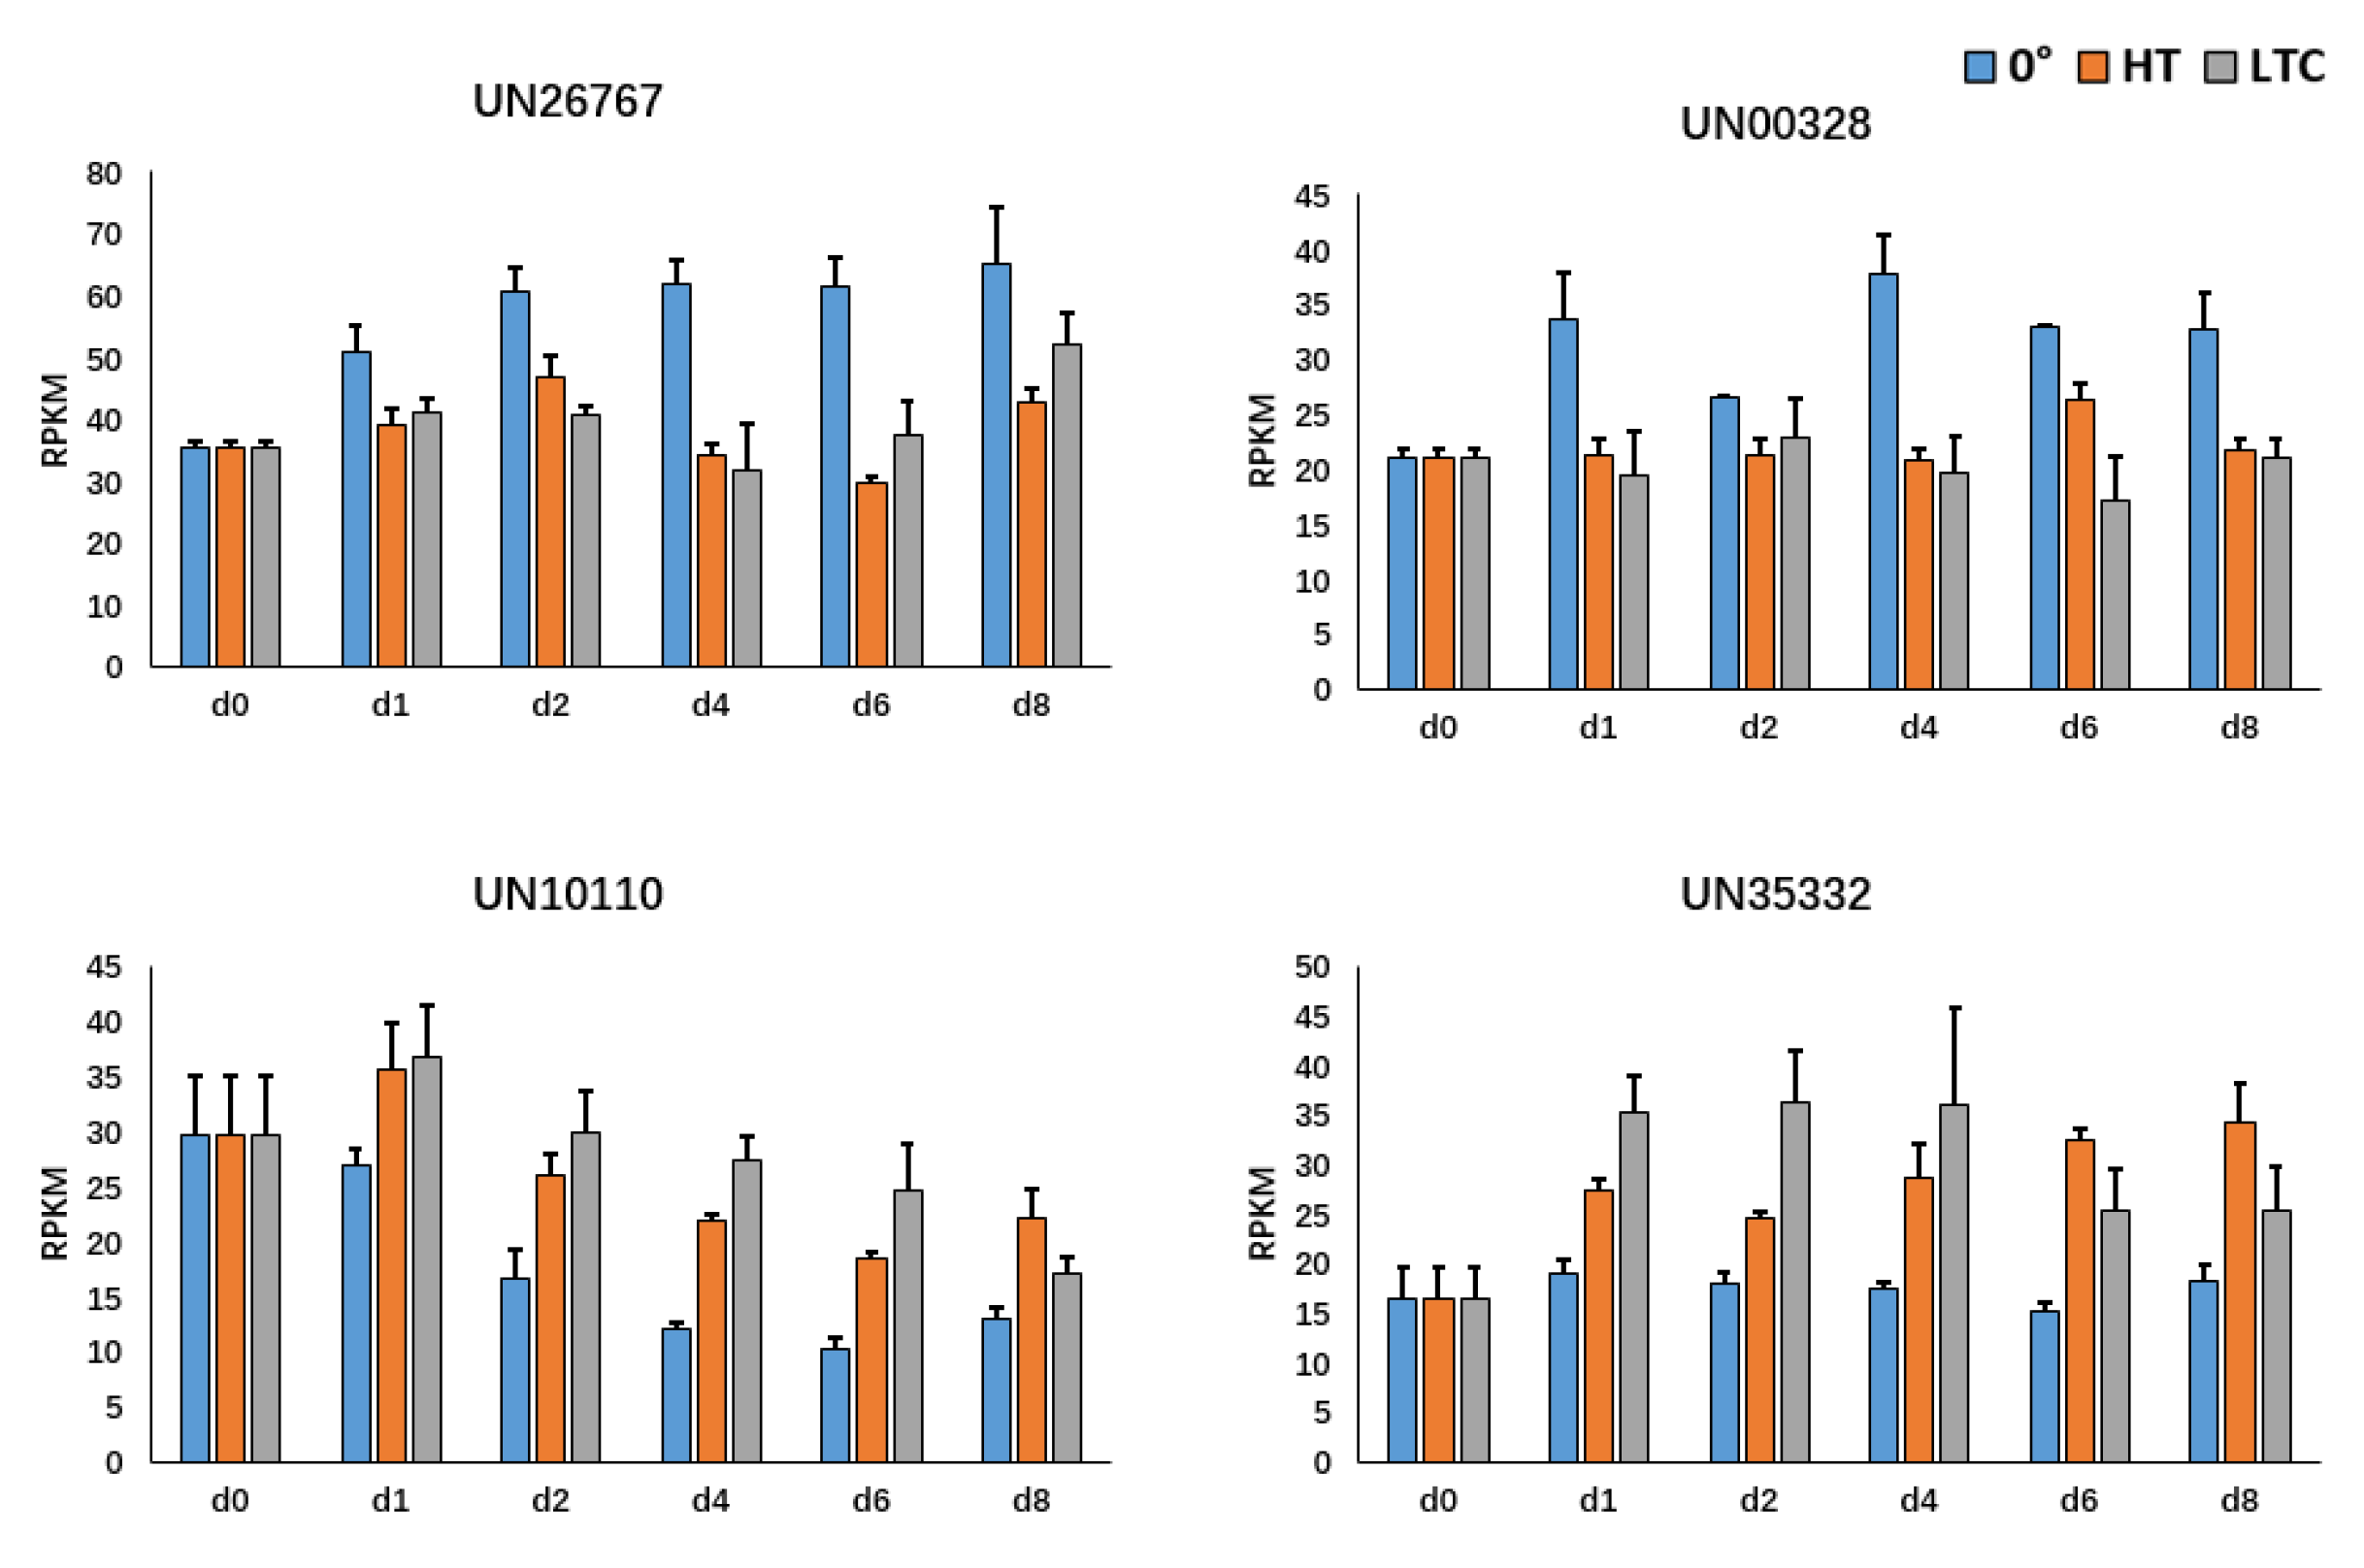
3.2.4. Correlation Analysis for Newly Identified Candidate Genes

To better understand the regulatory network of genes newly identified by the C-CorA method above, a correlation analysis of gene vs. gene based on their expression values was performed. The C-CorA method was used to detect the genes correlated with EjCAD4 (UN26767), and a total of 65 correlated genes were identified (Table S2). Interestingly, two transcription factors, WRKY (UN10110) and BHLH (UN35332), showed the opposite expression patterns when compared to EjCAD4 (Figure 6), which suggested that they might be negative regulators of EjCAD4.
Multiple genes are involved in lignin accumulation. We used the EjCAD4 as an example to perform a correlation analysis of multi-gene vs. lignin content. When searching for genes that act synergistically with EjCAD4 to influence the fruit lignin content, we applied the k-means clustering method to a 2 × 48 matrix formed by the expression values of two genes, one of which was EjCAD4. The clustering results were then used as the input vector for the correlation analysis together with the lignin content. Based on the results produced by C-CorA, we obtained 38 annotated genes with a correlation coefficient cutoff value of 0.8. Six calcium-correlated genes were identified, including EjCAD3 (Table S3). Cold shock elicits an immediate rise in cytosolic free calcium concentration [22] and can activate the expression of lignin-associated genes [23,24]. As we know, Ca2+ treatment could help to maintain fruit firmness via forming an “egg-box” [25]. Whether calcium-correlated genes interplay with loquat fruit lignification during postharvest and how they synergistically work with lignin-related gene EjCAD4 requires further research.

3.3. Other Cases of Correlation Analysis Using C-CorA

The C-CorA method could be applied to any multi-dimensional data. It could detect more candidate genes in a correlation analysis of RNA-Seq. Two more cases are presented here.

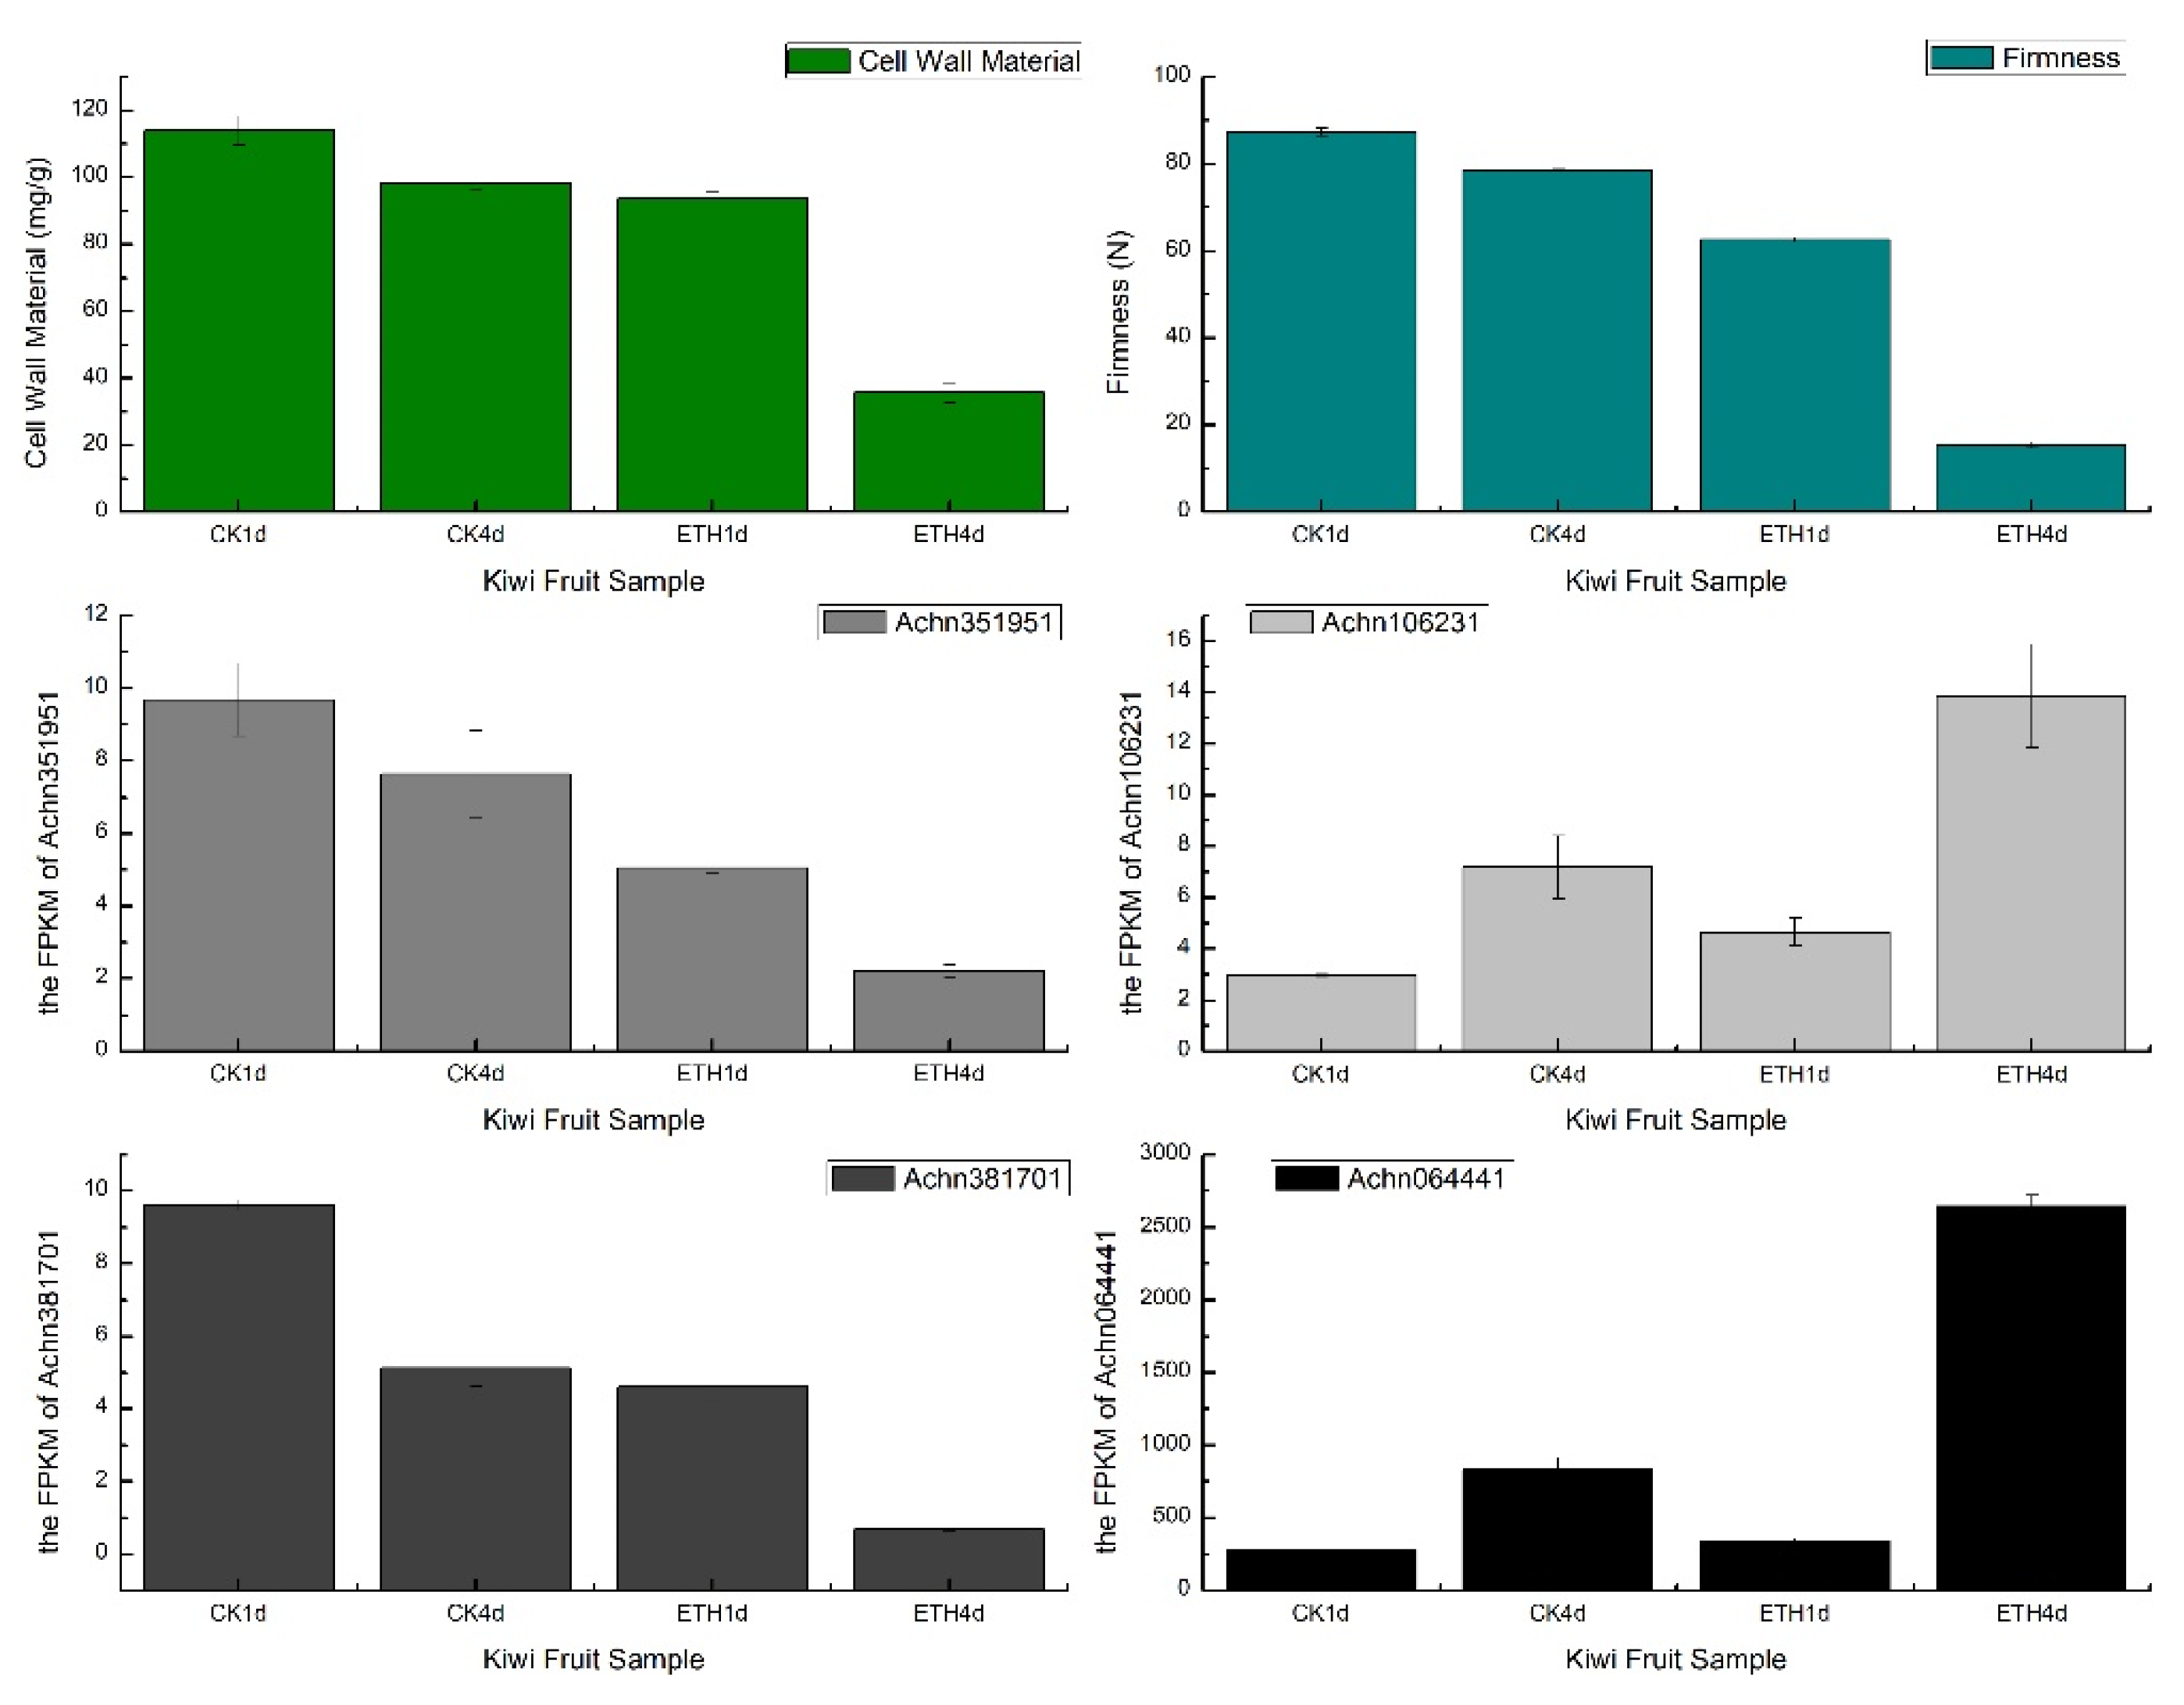
3.3.1. Transcriptome Analysis in Kiwifruit Using C-CorA

In a recent study of fruit softening [26], the mechanism of postharvest cell wall metabolism was explored in kiwifruit. Six cell wall metabolism-related genes (AdGAL1, AdMAN1, AdPL1, AdPL5, Adβ-Gal5 and AdPME1) were identified as candidate genes for pectin degradation by a correlation-based analysis as reported in Zhang et al [26]. The correlation coefficients in this study were generated by the Pearson method. We applied the C-CorA method on the data provided by the author, and ten pectin degradation-related structural genes were highly related to the physiological traits. These ten genes included the six candidate genes mentioned above and four more genes (Achn351951, Achn106231, Achn381701 and Achn064441). Among these four genes, two genes (Achn351951 and Achn106231) were annotated as pectate lyase while the other two (Achn381701 and Achn064441) were annotated as pectinesterase. Both pectate lyase and pectinesterase play an important role in pectin degradation [27]. Figure 7 illustrates the gene expression trends of these four genes in the firmness and the cell wall material pattern of kiwifruits. The pattern of physiological traits and the FPKM of these four genes showed the same or opposite trends during the treatment of kiwi fruit, which indicated that specific genes detected by C-CorA should also be considered as candidate genes in cell wall metabolism.

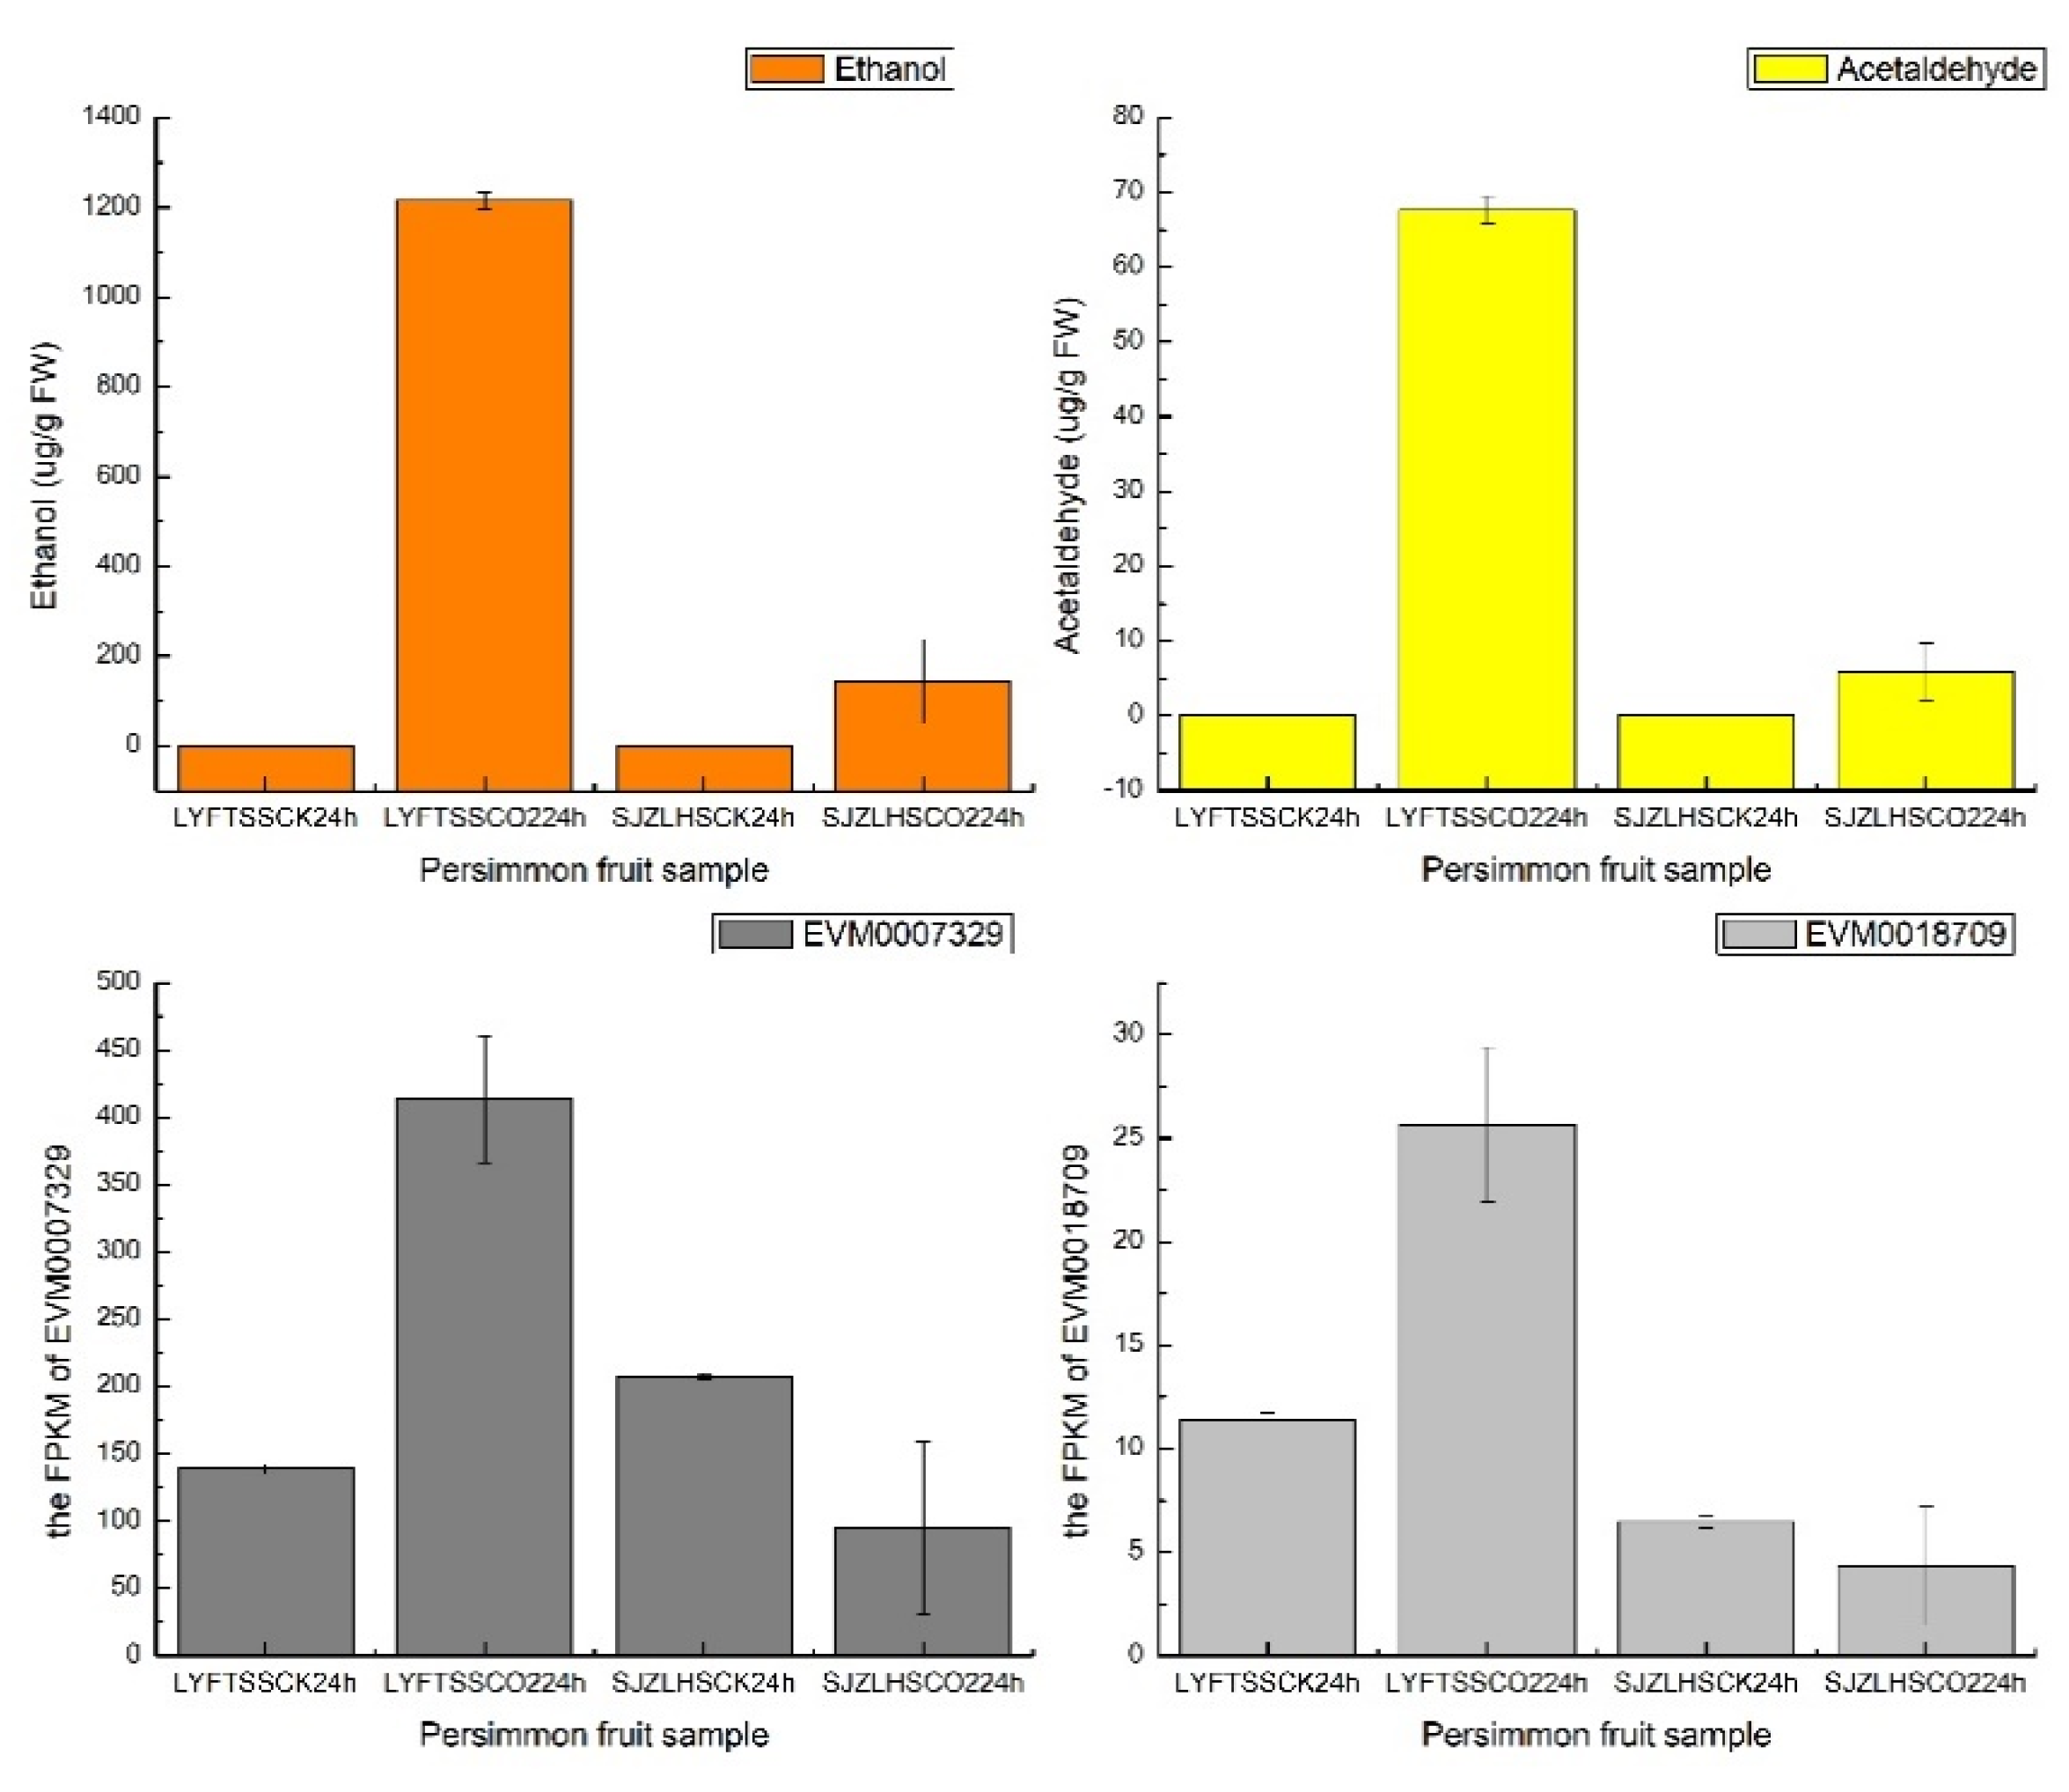
3.3.2. Transcriptome Analysis in Persimmon Using C-CorA

Acetaldehyde is a compound that could precipitate soluble condensed tannins into insoluble condensed tannins, which is an important process for persimmon fruit flavor [28]. The production of acetaldehyde depends on two key enzymes, pyruvate decarboxylase (PDC) and alcohol dehydrogenase (ADH) [28]. Three PDC genes (EVM0028451, EVM0027273 and EVM0022732) and two ADH genes (EVM0007501 and EVM0027066) were detected in the highest correlated module by a weighted gene co-expression network analysis (WGCNA) as reported in Kou et al [29]. When we applied the C-CorA method on the same dataset as Kou et al. [29], two more genes (PDC, EVM0018709 and ADH, EVM0007329) were detected. The gene expressions and ethanol/acetaldehyde production are shown in Figure 8. The expression patterns of the two genes were consistent with ethanol and acetaldehyde content. The new genes found by C-CorA are worth further research.

4. Discussion

In this work, we used a cluster-based correlation analysis method (C-CorA) to analyze the loquat RNA-Seq and identified some additional lignification-related transcripts which were not detected in the previous study [12]. In the C-CorA workflow, the cluster step and correlation analysis step are treated as two independent modules. In the cluster step, many alternative methods could be used rather than the k-means method, depending on the features of the input data. An advantage of using the clustering result for the correlation coefficient calculations is that it can process various types of data in different dimensions. For the correlation analysis of RNA-Seq data, C-CorA can deal with different cases, including gene vs. gene/phenotype, multi-gene vs. gene/phenotype and multi-phenotype vs. gene. The correlation coefficient calculated by the C-CorA method can also be used in other correlation-based analyses, such as the WGCNA [3].
The k-means method has some limitations. The number of groups must be determined in advance. In this work, the parameter k was set to 4. By choosing a relative value of k and then combining these groups into 2-group patterns, the potential correct cluster will be included. Also, the clustering result given by the k-mean method is sometimes not unique. To overcome this deficiency, multiple rounds of calculations should be performed for each data set.
For RNA-Seq analysis, alignment-free methods are quickly developed. Kallisto [30] and Sailfish [31] use the unique kmer from each transcript to calculate the read count for the calculation of abundance. The C-CorA method can also use these kmer counts to do the correlation analysis. The kmer distribution can describe the difference between transcripts or genome sequences, meaning that the C-CorA method can be extended to other applicable sequence-based analyses. For data from hybrid population analyses, the cluster method matches the phenomena of segregation of character. The C-CorA method has the potential to be applied to these analyses.
According to previous work [32,33], CAD (cinnamyl alcohol dehydrogenase) is an important enzyme that catalyzes the final step in the biosynthesis of lignin precursors, and MYB transcription factors [9,10] have been identified that are involved in loquat fruit chilling lignification by regulating lignin biosynthetic genes. By performing a C-CorA analysis of gene expression vs. lignin content, we identified EjCAD3 (UN68301) and EjCAD4 (UN26767) as candidate genes. In addition, a MYB transcription factor (UN00328) was highly correlated to the lignin content, which suggests that it could be a positive regulator of lignin biosynthesis. Using the same approach on gene vs. gene, we found two transcription factors, BHLH (UN35332) and WRKY (UN10110), that might work as negative regulators of EjCAD4. For the correlation analysis of multi-gene vs. lignin content, we identified six calcium correlated genes that may cooperate with EjCAD4 in loquat fruit lignification.
Several differentially expressed genes previously identified [12] as candidate genes, such as EjCAD3 (UN68301), also showed a high correlation with the lignin content using the C-CorA method. This indicates that the C-CorA method is an effective method for RNA-Seq data analysis. Furthermore, the correlation analysis of gene vs. gene and multi-gene vs. phenotype performed by C-CorA can help to build a network of the target genes.

5. Conclusions

The cluster-based correlation analysis method described in this work, C-CorA, is a new correlation coefficient calculation algorithm. It uses the clustering result from the original data sets to do the correlation analysis. It can deal with various types of data and data in different dimensions. This method was applied to a set of RNA-Seq data of loquat fruit. It identified the fruit lignification correlated structural genes and transcription factors as candidate genes for further research. Using this analysis, we also identified two additional genes (EjCAD4 and MYB), which were not detected in our previous work, as candidates for involvement in the lignification process. The loquat fruit case indicates that compared to other correlation methods, the C-CorA may be a better choice for fruit quality studies.

Supplementary Materials

The following are available online at https://www.mdpi.com/article/10.3390/horticulturae8020124/s1: Table S1: genes correlated with the lignin content of loquat fruit during postharvest treatments (0 oC, LTC, HT) from C-CorA, showing their correlation coefficients and annotations; Table S2: genes correlated with the EjCAD4 (UN26767) from C-CorA.; Table S3: genes act synergistically with EjCAD4 on the fruit lignin content identified by C-CorA.

Author Contributions

Conception and design: K.C., Q.W., W.L. and W.C. Algorithm design and implementation: W.L. Data analysis and interpretation: J.Q., W.L., W.C., Y.S. and M.Z. Manuscript writing: J.Q. and W.L. All authors have read and agreed to the published version of the manuscript.

Funding

This research was supported by grants from the National Natural Science Foundation of China (11771393, 11632015 and 31630067) and the Natural Science Foundation of Zhejiang Province, China (LZ14A010002). The funding bodies did not play any role in the design of the study, data collection and analysis or preparation of the manuscript.

Data Availability Statement

The raw RNA-Seq data used in this work was submitted to the NCBI Sequence Read Archive (SRA) under the accession SRP128075.

Acknowledgments

We thank Don Grierson for helpful suggestions and comments on the manuscript.

Conflicts of Interest

The authors declare no conflict of interest.

References

  1. Langmead, B.; Trapnell, C.; Pop, M.; Salzberg, S.L. Ultrafast and memory-efficient alignment of short DNA sequences to the human genome. Genome Biol. 2009, 10, 1–10. [Google Scholar] [CrossRef] [PubMed] [Green Version]
  2. Robinson, M.D.; McCarthy, D.J.; Smyth, G.K. edgeR: A Bioconductor package for differential expression analysis of digital gene expression data. Bioinformatics 2010, 26, 139–140. [Google Scholar] [CrossRef] [PubMed] [Green Version]
  3. Langfelder, P.; Horvath, S. WGCNA: An R package for weighted correlation network analysis. BMC Bioinform. 2008, 9, 1–13. [Google Scholar] [CrossRef] [PubMed] [Green Version]
  4. Zhang, B.; Horvath, S. A general framework for weighted gene co-expression network analysis. Stat. Appl. Genet. Mol. Biol. 2005, 4, 17. [Google Scholar] [CrossRef] [PubMed]
  5. Li, H.; Sun, Y.; Zhan, M. Exploring pathways from gene co-expression to network dynamics. In Computational Systems Biology. Methods in Molecular Biology; Ireton, R., Montgomery, K., Bumgarner, R., Samudrala, R., McDermott, J., Eds.; Humana Press: Totowa, NJ, USA, 2009; pp. 249–267. [Google Scholar]
  6. Sax, K.; Gowen, J.W. Permanence of tree performance in a clonal variety and a critique of the theory of bud mutation. Genetics 1923, 8, 179. [Google Scholar] [CrossRef]
  7. Cai, C.; Chen, K.; Xu, W.; Zhang, W.; Li, X.; Ferguson, I. Effect of 1-MCP on postharvest quality of loquat fruit. Postharvest Biol. Technol. 2006, 40, 155–162. [Google Scholar] [CrossRef]
  8. Cai, C.; Xu, C.; Li, X.; Ferguson, I.; Chen, K. Accumulation of lignin in relation to change in activities of lignification enzymes in loquat fruit flesh after harvest. Postharvest Biol. Technol. 2006, 40, 163–169. [Google Scholar] [CrossRef]
  9. Xu, Q.; Yin, X.R.; Zeng, J.K.; Ge, H.; Song, M.; Xu, C.J.; Chen, K.S. Activator-and repressor-type MYB transcription factors are involved in chilling injury induced flesh lignification in loquat via their interactions with the phenylpropanoid pathway. J. Exp. Bot. 2014, 65, 4349–4359. [Google Scholar] [CrossRef] [Green Version]
  10. Wang, W.Q.; Zhang, J.; Ge, H.; Li, S.J.; Li, X.; Yin, X.R.; Chen, K.S. EjMYB8 transcriptionally regulates flesh lignification in loquat fruit. PLoS ONE 2016, 11, e0154399. [Google Scholar] [CrossRef]
  11. Zeng, J.K.; Li, X.; Xu, Q.; Chen, J.Y.; Yin, X.R.; Ferguson, I.B.; Chen, K.S. EjAP2-1, an AP 2/ERF gene, is a novel regulator of fruit lignification induced by chilling injury, via interaction with Ej MYB transcription factors. Plant Biotechnol. J. 2015, 13, 1325–1334. [Google Scholar] [CrossRef]
  12. Liu, W.; Zhang, J.; Jiao, C.; Yin, X.; Fei, Z.; Wu, Q.; Chen, K. Transcriptome analysis provides insights into the regulation of metabolic processes during postharvest cold storage of loquat (Eriobotrya japonica) fruit. Hortic. Res. 2019, 6, 1–11. [Google Scholar] [CrossRef] [PubMed] [Green Version]
  13. Shan, L.L.; Li, X.; Wang, P.; Cai, C.; Zhang, B.; De Sun, C.; Chen, K.S. Characterization of cDNAs associated with lignification and their expression profiles in loquat fruit with different lignin accumulation. Planta 2008, 227, 1243–1254. [Google Scholar] [CrossRef] [PubMed]
  14. Zhong, S.; Joung, J.G.; Zheng, Y.; Chen, Y.R.; Liu, B.; Shao, Y.; Giovannoni, J.J. High-throughput illumina strand-specific RNA sequencing library preparation. Cold Spring Harbor Protoc. 2011, 2011, 940. [Google Scholar] [CrossRef] [Green Version]
  15. Bolger, A.M.; Lohse, M.; Usadel, B. Trimmomatic: A flexible trimmer for Illumina sequence data. Bioinformatics 2014, 30, 2114–2120. [Google Scholar] [CrossRef] [PubMed] [Green Version]
  16. Quast, C.; Pruesse, E.; Yilmaz, P.; Gerken, J.; Schweer, T.; Yarza, P.; Glöckner, F.O. The SILVA ribosomal RNA gene database project: Improved data processing and web-based tools. Nucleic Acids Res. 2012, 41, D590–D596. [Google Scholar] [CrossRef] [PubMed]
  17. Grabherr, M.G.; Haas, B.J.; Yassour, M.; Levin, J.Z.; Thompson, D.A.; Amit, I.; Regev, A. Full-length transcriptome assembly from RNA-Seq data without a reference genome. Nat. Biotechnol. 2011, 29, 644–652. [Google Scholar] [CrossRef] [PubMed] [Green Version]
  18. Zheng, Y.; Zhao, L.; Gao, J.; Fei, Z. iAssembler: A package for de novo assembly of Roche-454/Sanger transcriptome sequences. BMC Bioinform. 2011, 12, 1–8. [Google Scholar] [CrossRef] [PubMed] [Green Version]
  19. Lee, S.; Mo, H.; Im Kim, J.; Chapple, C. Genetic engineering of Arabidopsis to overproduce disinapoyl esters, potential lignin modification molecules. Biotechnol. Biofuels 2017, 10, 1–13. [Google Scholar] [CrossRef] [PubMed] [Green Version]
  20. Tronchet, M.; Balague, C.; Kroj, T.; Jouanin, L.; Roby, D. Cinnamyl alcohol dehydrogenases-C and D, key enzymes in lignin biosynthesis, play an essential role in disease resistance in Arabidopsis. Mol. Plant Pathol. 2010, 11, 83–92. [Google Scholar] [CrossRef]
  21. Du, Q.; Gong, C.; Pan, W.; Zhang, D. Development and application of microsatellites in candidate genes related to wood properties in the Chinese white poplar (Populus tomentosa Carr.). DNA Res. 2013, 20, 31–44. [Google Scholar] [CrossRef] [Green Version]
  22. Knight, H.; Trewavas, A.J.; Knight, M.R. Cold calcium signaling in Arabidopsis involves two cellular pools and a change in calcium signature after acclimation. Plant Cell 1996, 8, 489–503. [Google Scholar] [PubMed] [Green Version]
  23. Lu, G.; Li, Z.; Zhang, X.; Wang, R.; Yang, S. Expression analysis of lignin-associated genes in hard end pear (Pyrus pyrifolia Whangkeumbae) and its response to calcium chloride treatment conditions. J. Plant Growth Regul. 2015, 34, 251–262. [Google Scholar] [CrossRef]
  24. Figueroa, C.R.; Opazo, M.C.; Vera, P.; Arriagada, O.; Díaz, M.; Moya-León, M.A. Effect of postharvest treatment of calcium and auxin on cell wall composition and expression of cell wall-modifying genes in the Chilean strawberry (Fragaria chiloensis) fruit. Food Chem. 2012, 132, 2014–2022. [Google Scholar] [CrossRef]
  25. Braccini, I.; Pérez, S. Molecular basis of Ca2+-induced gelation in alginates and pectins: The egg-box model revisited. Biomacromolecules 2001, 2, 1089–1096. [Google Scholar] [CrossRef] [PubMed]
  26. Zhang, Q.Y.; Ge, J.; Liu, X.C.; Wang, W.Q.; Liu, X.F.; Yin, X.R. Consensus Co-expression network analysis identifies AdZAT5 regulating pectin degradation in ripening kiwifruit. J. Adv. Res. 2021; in press. [Google Scholar] [CrossRef]
  27. Anderson, C.T. We be jammin’: An update on pectin biosynthesis, trafficking and dynamics. J. Exp. Bot. 2015, 67, erv501. [Google Scholar] [CrossRef] [Green Version]
  28. Min, T.; Yin, X.R.; Shi, Y.N.; Luo, Z.R.; Yao, Y.C.; Grierson, D.; Ferguson, I.B.; Chen, K.S. Ethylene-responsive transcription factors interact with promoters of ADH and PDC involved in persimmon (Diospyros kaki) fruit de-astringency. J. Exp. Bot. 2012, 63, 6393–6405. [Google Scholar] [CrossRef] [Green Version]
  29. Kou, S.M.; Jin, R.; Wu, Y.Y.; Huang, J.W.; Zhang, Q.Y.; Sun, N.J.; Yang, Y.; Guan, C.F.; Wang, W.Q.; Zhu, C.Q.; et al. Transcriptome analysis revealed the roles of carbohydrate metabolism on differential acetaldehyde production capacity in persimmon fruit in response to high-CO2 treatment. J. Agric. Food Chem. 2021, 69, 836–845. [Google Scholar] [CrossRef]
  30. Nicolas, B.; Harold, P.; Páll, M.; Lior, P. Near-optimal RNA-Seq quantification. Nat. Biotechnol. 2015, 34, 525–527. [Google Scholar]
  31. Patro, R.; Mount, S.M.; Kingsford, C. Sailfish enables alignment-free isoform quantification from RNA-seq reads using lightweight algorithms. Nat. Biotechnol. 2014, 32, 462–464. [Google Scholar] [CrossRef] [Green Version]
  32. Salentijn, E.M.; Aharoni, A.; Schaart, J.G.; Boone, M.J.; Krens, F.A. Differential gene expression analysis of strawberry cultivars that differ in fruit-firmness. Physiol. Plant. 2003, 118, 571–578. [Google Scholar] [CrossRef]
  33. Xu, M.; Zhang, M.X.; Shi, Y.N.; Liu, X.F.; Li, X.; Grierson, D.; Chen, K.S. EjHAT1 participates in heat alleviation of loquat fruit lignification by suppressing the promoter activity of key lignin monomer synthesis gene EjCAD5. J. Agric. Food Chem. 2019, 67, 5204–5211. [Google Scholar] [CrossRef] [PubMed]
Figure 1. The C-CorA workflow showing the clustering module and a correlation analysis module. The numbers 1, 2, 3 and 4 represent the different clusters. When the k-mean is set as 4 for the cluster module, input data1 and input data 2 are first clustered into four groups. Then these groups are randomly combined into two groups for correlation analysis.
Horticulturae 08 00124 g001
Figure 2. (A) The appearance of the C-CoA application written using C # WPF. (B) An example of an output file.
Horticulturae 08 00124 g002
Figure 3. The k-means cluster result of the 48 loquat fruit samples from MATLAB. The number of groups was set to 4 in the k-means function. The data points are clustered based on the value of lignin content. (HT: heat treatment, LTC: Low temperature conditioning and T0: 0 °C).
Horticulturae 08 00124 g003
Figure 4. A heatmap of normalized gene expression values of the 53 highly correlated genes in gene expression vs. lignin content comparison, as calculated by the C-CorA method.
Horticulturae 08 00124 g004
Figure 5. (A) A Venn diagram of the count of genes with high correlation coefficients in gene expression vs. lignin content comparison as calculated by the Pearson method, the Spearman method and the C-CorA method. (B) The correlation coefficients for 22 genes screened by the Pearson method or the Spearman method (>0.7) and the coefficients from the C-CorA method. (C) The base-2 logarithmic values of the RPKM values of genes UN68285 and UN35236.
Horticulturae 08 00124 g005
Figure 6. The RPKM of UN26767, UN00328, WRKY (UN10110) and BHLH (UN35332) at each time point under LTC, HT and 0 °C treatments from the RNA-Seq analysis of loquat fruit.
Horticulturae 08 00124 g006
Figure 7. The cell wall material content (mg/g), firmness (N) and FPKM value of four new candidate genes (Achn351951, Achn106231, Achn381701 and Achn064441) detected by C-CorA in four groups of kiwi fruit.
Horticulturae 08 00124 g007
Figure 8. The ethanol production (μg/g FW) and acetaldehyde production (μg/g FW) of four persimmon fruit groups, along with the FPKM value of the two newly detected genes (EVM0007329 and EVM0018709) detected by C-CorA.
Horticulturae 08 00124 g008
Table 1. The count of genes which highly correlated to lignin content in each of the seven 2-group patterns of phenotype data. The threshold of correlation coefficient was set as 0.7, 0.8 and 0.9.
2-Group PatternCorrelation Coefficient
0.70.80.9
[{1}, {2, 3, 4}]2010
[{4}, {1, 2, 3}]445763
[{2}, {1, 3, 4}]5191
[{3}, {1, 2, 4}]4727110
[{1, 4}, {2, 3}]23090
[{1, 2}, {3, 4}]93280
[{1, 3}, {2, 4}]4020
Publisher’s Note: MDPI stays neutral with regard to jurisdictional claims in published maps and institutional affiliations.

