Article

Understanding the Priming Effect and the Routes and Stocks of C in Incubated Soil with Residue Inputs

by
Risely Ferraz-Almeida
Luiz de Queiroz College of Agriculture, University of São Paulo, Piracicaba 13418-900, SP, Brazil
Horticulturae 2022, 8(2), 154; https://doi.org/10.3390/horticulturae8020154
Submission received: 22 December 2021 / Revised: 7 February 2022 / Accepted: 9 February 2022 / Published: 11 February 2022

Abstract

:
The priming effect is a strong short-term change of organic matter decomposition that can accelerate or slow residue decomposition, and release or immobilize a large amount of carbon (C) and nitrogen (N) in soil. Our goal here was to (i) monitor the influence of residue additions in stocks of C and N in residues and soil (ii) and identify the main routes of C stabilization and the priming effect in soil. An incubation study was run with residue additions of high C:N (brachiaria and sugarcane) and low C:N (soybean) in soil. CO2 emissions, stocks of C (humic substance; labile C and C mic) and N (soil and residues) were monitored for 50 days, and the priming effect and route of C were calculated. Results showed that after incubation the final stocks of humin increased (31%), while there were reductions of humic (54%) and fulvic acids (42%). The stocks of soil total C and N were constant, while the residue C was decreased. The residues with high C:N immobilized N, while there was a decrease of N in residues with low C:N. There was a positive priming effect and a C stabilization route concentrated from C mic to humic substances with the addition of low C:N, while inputs of high C:N diversified the C stabilization routes from C mic or labile C to humic substances. The C routes were intense because the study was run in control conditions with a loam soil and adequate conditions of water, oxygen, and temperature.

1. Introduction

The no-tillage system is an agricultural technique that avoids disturbing the soil and the integration of crops and pastures [1,2]. Brazil has more than 50% of its annual crop area in conservation systems [3], with a mean of 25.5 million hectares in the no-tillage system [4]. In the world, there are about 157 million hectares in conservation systems, corresponding to about 11% of all cropland [5]. The adoption of conservation agriculture systems is based on principles of sustainability, with a balance of social, economic, and environmental factors [3]. The balance of these three dimensions is the base for achieving a circular economy [6,7].
In Brazil, the main crops used in conservation systems are sugarcane (Saccharum officinarum), soybean (Glycine max), Brachiaria (Brachiaria sp.), and corn (Zea mays), with a mean residue accumulation of 10–15 Mg ha−1 year−1 [8,9], 2–6 Mg ha−1 crop−1, 2–5 Mg ha−1 year−1, and 6–14 Mg ha−1 crop−1, respectively [10,11,12]. Residues present different characteristics and proportions of free sugars, fructus, pectin, hemicellulose, cellulose, starch, lignin [13], and contents of carbon (C) and nitrogen (N) [14,15,16].
The diversity of cropping systems with the accumulation of residues improves crop yields, especially under water-stress conditions [17]. The residue accumulation increases the carbon sequestration in soil, avoiding erosion and improving nutrient cycling, aggregation, and water retention [18,19,20]. The gains of soil carbon sequestration are obtained by the use of cover crops, root biomass, and crop residues, while carbon losses are associated with erosion, leaching, and decomposition [21,22,23,24]. The stocks of soil organic carbon depend on the balance between these C inputs and losses [25,26,27]. Soil organic carbon storage is strongly linked to organic residue inputs, but soil geochemistry (e.g., type and quantity of clay) also plays a critical role [28,29].
Soil organic carbon can be divided into humic substances (humic acid: HA; fulvic acid: FA; and humin: HU), labile fractions (labile C), and microorganisms (C mic) [30,31,32]. The humic substances are organic polymers with relatively high-molecular weight resulting from the decomposition of organic residues by microorganisms and enzymes. The humic substances represent approximately 70–80% of total soil organic carbon [32,33] and play an important role in the formation and stability of soil aggregates [32,34,35]. On the other hand, the C in microbial biomass represents a lower fraction of soil organic matter, approximately 3–4%, with low stability [36,37]. The stocks of C mic have a close relationship with the cycling of C, N, and phosphorus, as well as pH and temperature in soil [38,39,40,41].
The strong short-term change of organic matter decomposition is described as a priming effect that can accelerate or slow residue decomposition and release or immobilize a large amount of C, N, and other nutrients in the soil in a very short time [42,43,44]. Residues of low C:N accelerate the decomposition of residues, while high C:N suppresses it. The impact of residue addition in C stocks is important, due to the C pool in the soil being much larger than in the atmosphere, where the increase in atmospheric CO2 concentrations promotes negative climate feedback [45]. Thus, it is necessary to clarify the impact of residue inputs in C stocks (humic substances, labile C, and C mic) and N available in the soil; their associations with the priming effect, therefore, justify this study.
The hypothesis raised herein was that the addition of residues with low C:N promotes the positive priming effect with a release of N in the soil, and a change in the routes of C stabilization and stocks. Our goal here was to (i) monitor the influence of residue additions in stocks of C and N in residues and soil (humic and labile fractions), (ii) and to identify the main routes of C stabilization and the priming effect in soil.

2. Materials and Methods

2.1. Experimental Characterization

An incubation was run with residue additions of high C:N (brachiaria and sugarcane) and low C:N (soybean) in soil using three replications. Soil without residue input was monitored as a control. The residue inputs were separated into low and high C:N to explain the priming effect and the routes of C in soil.
Before the incubation, the soil was collected in the 0.0–20.0 cm layer from areas cultivated with brachiaria, located between the cities of Uberlândia and Uberaba/Triângulo Mineiro (latitude 19°13′00.22″S and longitude 48°08′24.80″ W). The soil was characterized using chemical [46] and texture analysis [47]. Soil samples showed the following contents of phosphorus: 2.47 mg dm−3 (Mehlich I); potassium: 208.08 cmolc dm−3; calcium: 2.20 cmolc dm−3; and magnesium: 0.56 cmolc dm−3. Soil presented a loam texture with 230, 140, and 630 g kg−1 of clay, silt, and sand, respectively; and it was classified as a Latossolo Amarelo [48], corresponding to an Oxisol [49]. The contents of C and N in the soil and residues were characterized using the digestion of the soil with an acidified dichromate [50,51,52] and their digestion in sulfuric acid, respectively (Kjeldahl method). The total C and N in soil were 7.40 and 0.69 g kg−1, respectively.
Residues were collected from areas cultivated with sugarcane, brachiaria, and soybean—also located between the cities of Uberlândia and Uberaba/Triângulo Mineiro. Residues presented leaves and stems, which were cut into a size of 2 cm. The total C and N in residues was 120.00 and 1.44 g kg−1 (sugarcane); 122.40 and 1.68 g kg−1 (Brachiaria); and 142.12 and 2.49 g kg−1 (soybean), respectively.
Soil and residues were incubated in a column with a total volume of 1298.8 cm3 (height of 13 cm, diameter of 10.5 cm, and base of 15 cm), fixed on a styrofoam base properly isolated to prevent soil water loss. A soil sample of 700 g (disturbed with size < 2 mm) was added in a column with a residue mean rate of 8 Mg ha−1 of soybean (low C:N), sugarcane, and brachiaria (high C:N). Each column shows soil with one type of residue (sugarcane, soybean, or brachiaria).
The setup was left in an open laboratory environment at a controlled temperature of 25 °C, at 60% field capacity. To keep the water content constant, the weight of the pots was monitored daily to assure optimum microbial activity.

2.2. C and N Stocks in Soil

Daily emissions of CO2 were monitored on the 1st, 3rd, 6th, 12th, and 50th day of incubation using LI 8100 (Li-Cor Inc., Lincoln, NE, USA). The system for CO2 collecting consisted of a closed chamber with 854.2 cm3 internal volume, and 83.7 cm2 ground contact area. The CO2 was determined by optical absorption spectroscopy in the infrared spectral region.
After collecting daily CO2 emissions, soil samples were collected to determine the C in humin, fulvic acid, humic acid, labile C, and C mic—also on the 1st, 3rd, 6th, 12th, and 50th day of incubation. The C fractionation in humic substances was determined using the differential solubility according to the International Humic Substances Society. The labile C was determined by the oxidation potassium permanganate (0.033 mol L−1) according to [53]. The C mic was determined using a microwave oven for irradiation in soil [54,55]. The total carbon and nitrogen in soil and residues were also monitored using the digestion of the soil with an acidified dichromate [50], and the digestion with sulfuric acid (Kjeldahl method).

2.3. Data Processing and Statistical Analysis

The descriptive statistics, assumptions of normality (Shapiro–Wilk test), and homogeneity of variance (Bartlett test) were evaluated using a p of 0.05. When present, the outliers were identified and excluded by the Grubbs test.
The daily stocks of humin, fulvic acid, humic acid, labile C, C mic, and CO2 emissions were graphically represented, and the mean of the 50-day curves was calculated to show the daily variability. The routes of C in the fractions of humin, fulvic acid, humic acid, labile C, and C mic during the incubation period (Initial: 1–10 days and Final: 11–50 days) were tested using a linear correlation to explain the C stabilization in stocks (Pearson’s correlation; p ≤ 0.05).
The stock balance of humin, fulvic acid, humic acid, labile C, C mic, and CO2 emissions was calculated according to the difference of C contents at 50 days and the initial soil C (day 0). The priming effect was calculated according to the release of CO2 during the incubation time using an Exponential Decay equation (Equation (1)), where C(t) is the release dynamics of CO2; CS is the maximum CO2 release possible in the curve; k is the CO2 rate of the substrate; and t: is the period of maximum CO2 release (10-days):
Ct = Cs (1 − exp(−kt))
The effect of residues with high and low C:N were compared using the t-test (residues) and the LSD test (residues and control) with a p ≤ 0.05. The results of brachiaria and sugarcane inputs were associated with high C:N due to similar results, as well demonstrated in previous studies of residue incubations developed by our research group [16,33]. All statistical analysis was performed using R Statistical Software (version 4.0.0; R Foundation for Statistical Computing), and graphically represented using Sigmaplot Software (version 11.0; SYSTAT Software Inc., San Jose, CA, USA).

3. Results

3.1. Daily C and N in Soil and Residues

Final stocks of C had 31% increased levels of humin, but there was a decrease of 54% and 42% of humic and fulvic acid after 50 days of incubation. There was a peak of C mic and CO2 emissions in the first days of incubation, following a reduction of 26 and 41%, respectively. Interestingly, there was no variation in stocks of labile C, with a general mean of 5.21 g kg−1 (Figure 1).
There was a clear difference between residue inputs in CO2 emissions during the incubation. The low C:N presented with higher CO2 emissions, followed by high C:N and the control. There was no difference between the residue inputs in the C mic, but there was a higher mean of C mic in the residue additions compared to the control (Figure 1).
Regarding the incubation means, low C:N increased CO2 emissions and fulvic acid by 40% and 10% compared with high C:N, respectively. In contrast, there were no effects of the residues in stocks of humin, humic acid, labile C, and C mic, with a small difference of 0.5; 0.1 and 0.0 g kg−1; and 8.2 μg g−1 ha−1 and 3.7 g CO2 m−2 h−1, respectively (Table 1).
Daily contents of C and N in soil were constant during the incubation time, with a general mean of 22.9 ± 1.0 and 22.5 ± 0.6 g kg−1, and 1.6 ± 0.1 and 1.5 ± 0.09 g kg−1, respectively, with low and high C:N (Table 1; Figure 2). Interestingly, we expected to detect an increase of N in soil with additions of low C:N, but there was no differences during the 50 days of incubation. On the other hand, the daily contents of C and N in residues were changed in soil with residue additions.
In low C:N, the increase in residue C was correlated negatively with residue N (r: 0.49; p < 0.05), indicating that the higher N content increased the C decomposition of the residue (C losses). The was no correlation between C and N in high C:N (Figure 3).

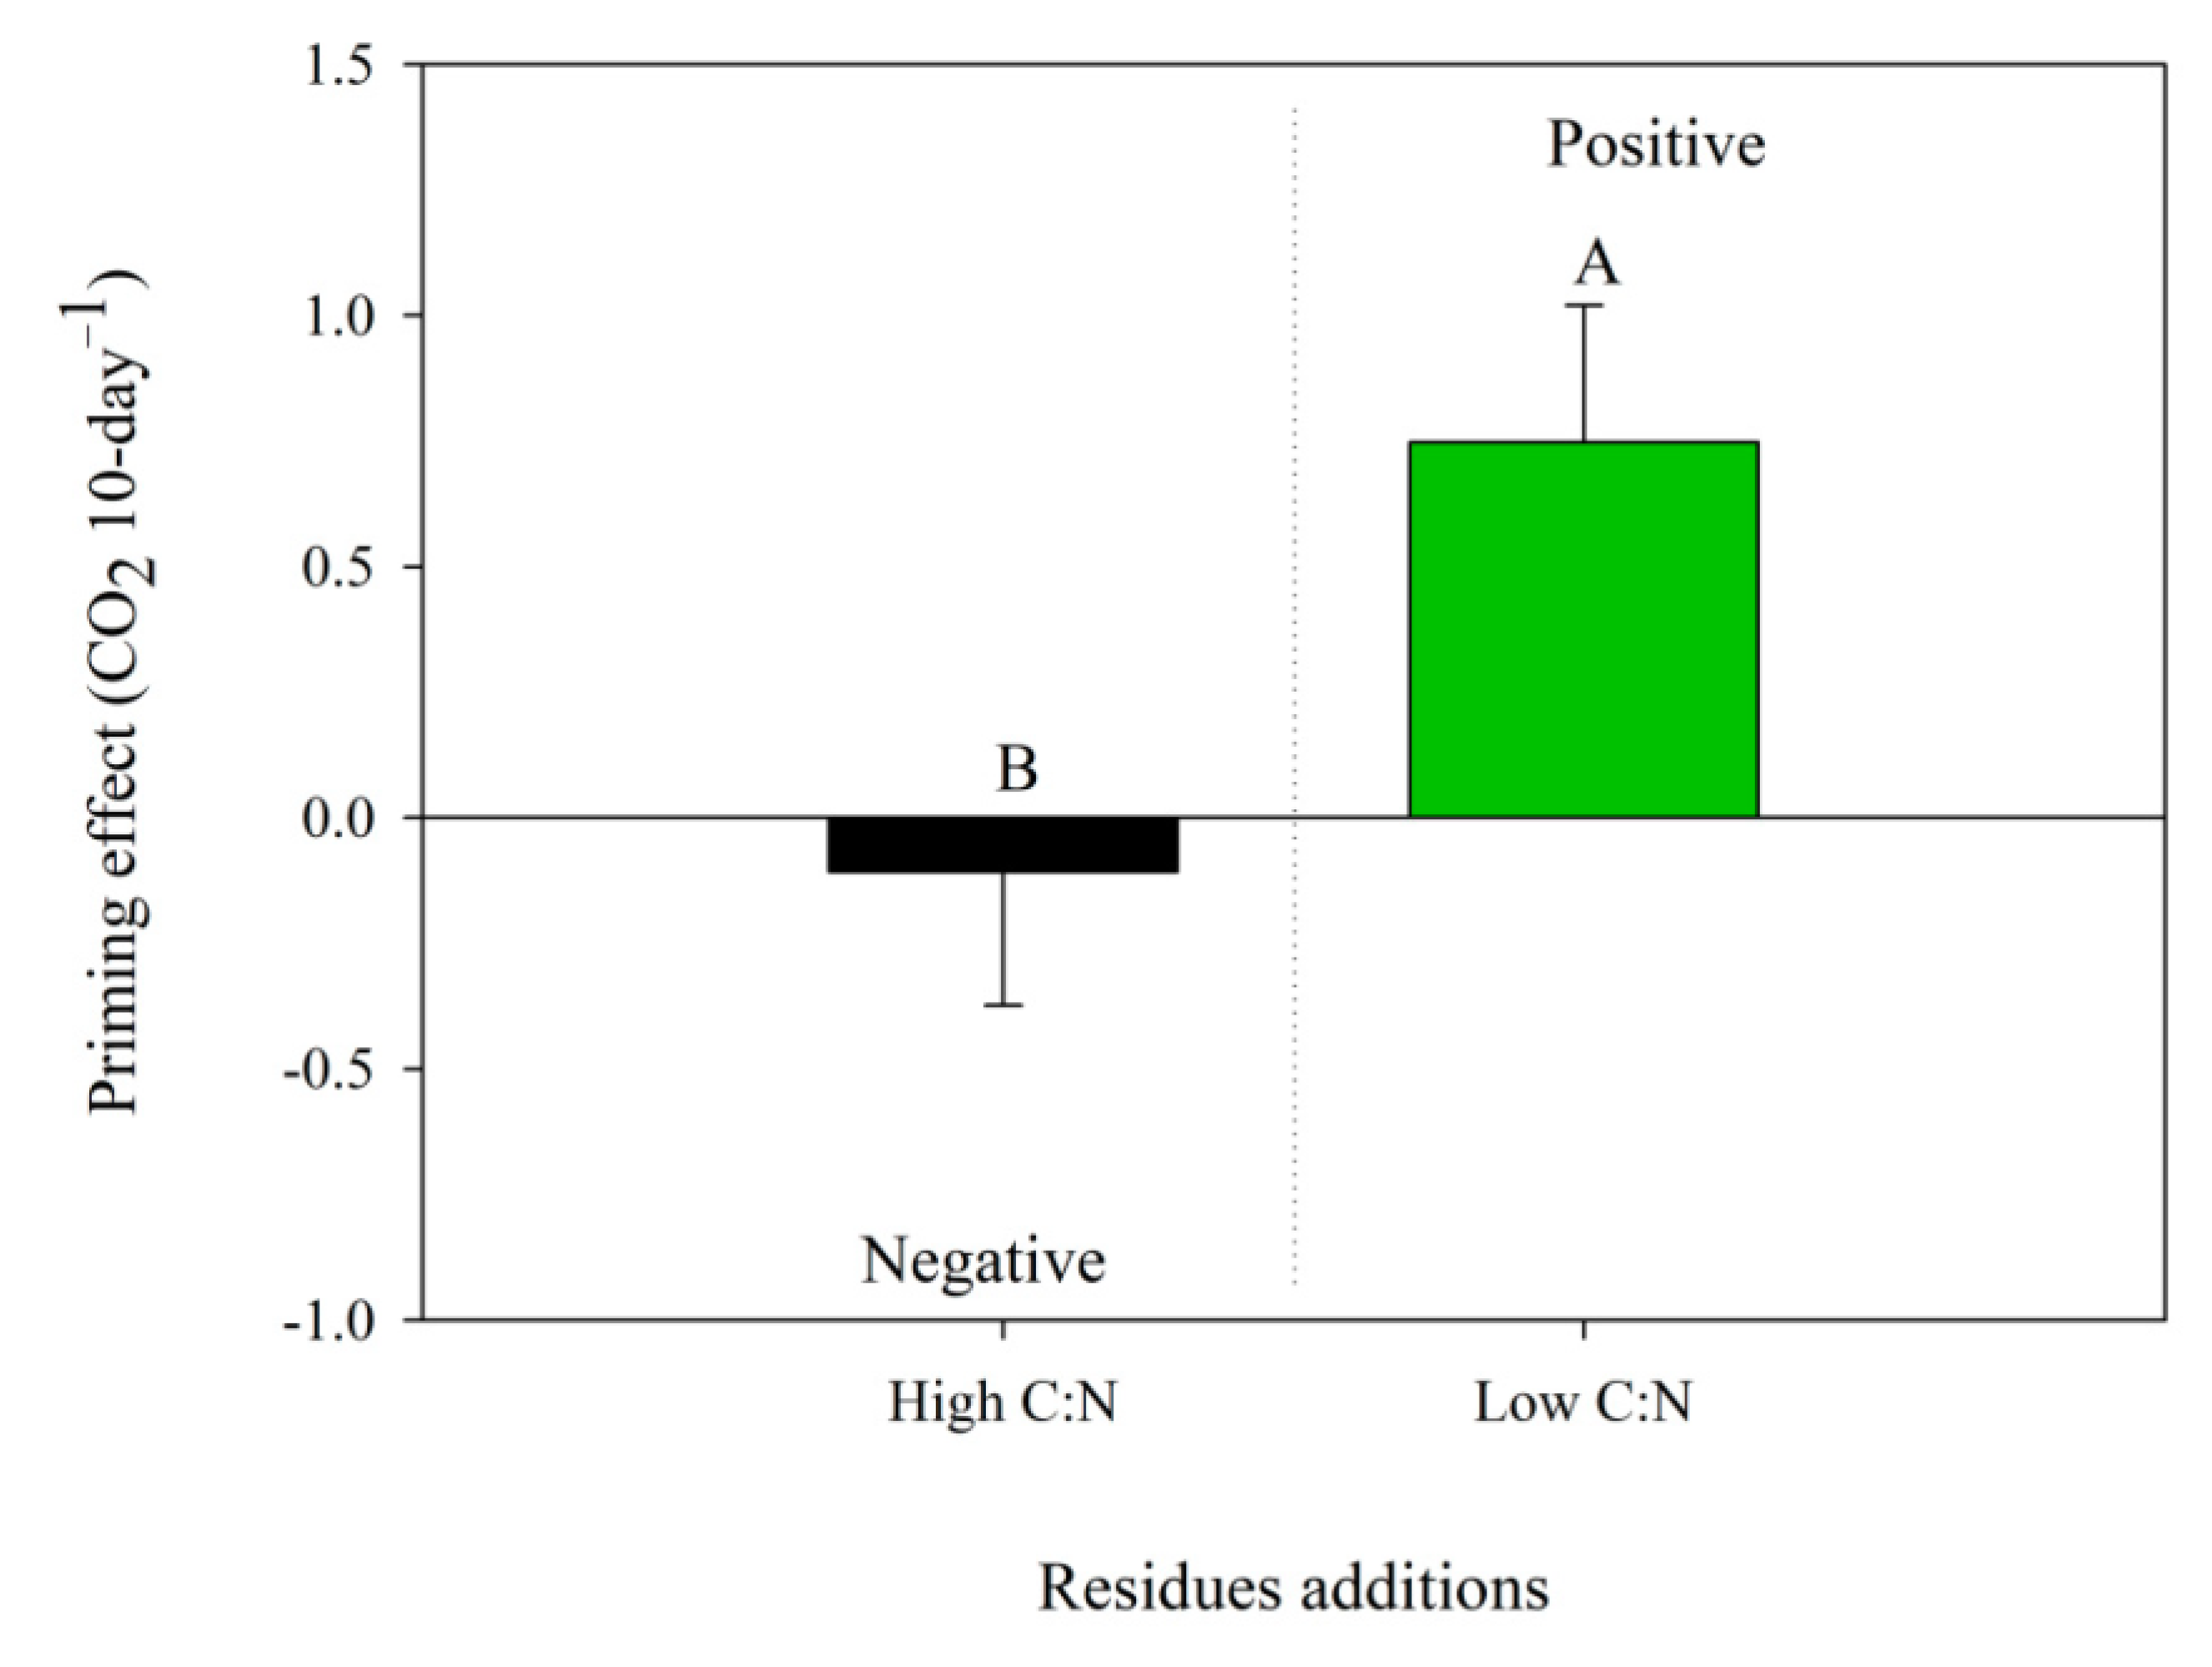
3.2. Priming Effect and Route of C Stocks

Values of humin, C mic, and CO2 emission increased with additions of both residues, with a mean increase of 0.7 g kg−1, 336.3 μg g−1 ha−1, and 6.0 g CO2 m−2 h−1, respectively. These results indicate that the residue additions increased the biological activity and accumulation of stabilized C in soil. In contrast, there was a negative effect on humic acid in both residues. In addition, high C:N promoted a negative effect on fulvic acid and labile C, while low C:N promoted increases in the other C stocks (Figure 4).
The input of low C:N concentrated the route of humic substances from C mic during the incubation time due to the increase of biological activities in soil. Specifically, the C stabilization route occurred from C mic to humic acid (positive flux; r: 0.58), C mic to humin acid (inverse flux; r: −0.55), and C mic to fulvic acid (inverse flux; r: −0.55; Figure 5).
On the other hand, with the input of high C:N, the route of humic substances diversified, with a C stabilization route from C mic to humin (inverse flux; r: −0,38), fulvic acid to humin (inverse flux; r: −0.65), labile C to fulvic acid (positive flux; r: 0.34), and labile C to humin (positive flux; r: 0.62; Figure 5).
The addition of low C:N promoted a positive priming effect, around 85% higher than high C:N after 50 days of incubation. Interestingly, the priming effect was negative with inputs of high C:N, with a mean of -0.10 CO2 10-day−1 demonstrating a lower soil biological activity (Figure 6).

4. Discussion

4.1. Daily C and N in Soil and Residues

The peak of C mic and CO2 emission in the first days of incubation, followed by a reduction, follows previous studies [16,51,56]. Both C mic and CO2 emissions increased due to the residue additions of soybean, sugarcane, and brachiaria, with a CO2 emission mean 86% higher than that of the control.
The CO2 emissions are a result of organic matter microbial degradation, as well as root and faunal respiration in soil [57,58,59]. Similar results for CO2 emissions were also reported from field studies [26,58,60,61]. Our study was conducted in laboratory conditions, and the data might not correlate with field conditions due to the diversity and heterogeneity of the latter environment. In both conditions (field and laboratory), the input of residues and other soil conditions impacted soil CO2 evolution, i.e., temperature, volumetric water content, and the oxygen available in soil [26,51,57,58,60].
The input of low C:N promoted higher CO2 emissions due to the higher total N content (2.49 g kg−1) and low C, compared with residues of sugarcane and brachiaria, which presented with lower available N (sugarcane, 1.44 g kg−1; and brachiaria, 1.68 g kg−1). Applications of other residues in soil (e.g., rice straw, rice root, cow dung, and poultry manure) with a high amount of total nitrogen and low C:N ratio also contributed to rapid microbial decomposition. This result is corroborated by the negative correlation between the total contents of C and N in the residue, indicating that the higher N content increased the C decomposition (C losses) of residue. The addition of inorganic N promotes the rapid activity of microbial communities under favorable temperature and moisture regimes [31,56,62]. Generally, organic residues from legumes (i.e., soybean) also often rapidly decompose due to high soil biological activity [63]. With the rapid proliferation of microbial communities, substrate for the proliferation and growth of microorganisms is requested in a short time, following a natural reduction in CO2 emissions and state equilibrium, explained by the reduction of residues in the soil [57].
The low CO2 emissions with high C:N residues are explained by a high percentage of cellulose, hemicellulose, and lignin in brachiaria and sugarcane straw that can negatively impact residue decomposition [13,64]. In residues with high C concentrations, the microorganisms need several cycles and extra time to decompose it. In addition, during the breakdown process, microorganisms use C substrate to build their cells, and as a source of energy [56].
The daily contents of C and N in soil were constant during the incubation. Interestingly, we expected to detect an increase of N in soil with additions of low C:N residues, but there was no difference during the 50 days of incubation. An increase of N in soil with the rotation of legumes has been demonstrated in previous studies [65,66]. Probably, in our study, the low increment of N in the soil can be associated with a residue sample of soybean that presents with leaves and shoots, which present with a lower N content. A higher concentration of N is found in nodules > shoots > roots. Previous studies have already demonstrated the potential of N immobilization in residues with high C:N, i.e., sugarcane and bachiaria [27,58].

4.2. Priming Effect and Route of C Stocks

Here, we explored C balance and stabilization routes with inputs of low and high C:N in soil. To our knowledge, this is the first study related to C stabilization routes associated with the priming effect in soil. We found that there was a positive balance of humin, C mic, and CO2 emissions with additions of both residues, while the balance was negative in humic acid.
The addition of high C:N promoted a decrease in fulvic acid and labile C; and low C:N created an increase in these C stocks. There was a higher C concentration in humin (17.7 ± 2.2) > humic acid (2.0 ± 0.3) > fulvic acid (17.7 ± 2.2) stocks. This influence of soil management in stocks of humic substances is in agreement with previous studies [67,68]. The C stabilization routes went from less stable C fractions to humin in all residue inputs. The higher concentration of humin was due to high molecular size and its greater degree of stability, while fulvic acid and humic acid are less stable and can be polymerized or mineralized faster by soil microbial activity [69].
The mechanisms of the priming effect play different roles, along with the residue inputs in the soil. Low C:N input created a positive priming effect, and concentrated the C stabilization route from C mic to humic substances, while inputs of high C:N diversified the C stabilization route from C mic, labile C, and fulvic acid to humic substances, and created a negative priming effect. The flux between the humic substances was due to the polymerization of humic compounds [68]. Probably, the addition of high C:N created a diversity of C routes due to low biological activity and slow soil carbon cycling that occurs with N immobilization in residues. Negative priming can be explained by the competition for energy and nutrient acquisition between the microorganisms [70,71]. Therefore, the priming effect is strongly enhanced by high C:N labile inputs, but slowed by low C:N labile inputs [44]. These divergent responses to the C stabilization routes and priming effects indicated that the mechanisms of the priming effect are explained by the input of residues in soil with the acceleration of biological activity (positive priming) or deceleration due to N immobilization (negative priming). The hypothesis raised that the addition of residues with low C:N promotes the positive priming effect was accepted and explained by higher N inputs in soil being associated with the C route being concentrated from C mic to humic substances.

5. Conclusions

The addition of residues with high and low C:N in the soil increases the stocks of humin and decreases humic and fulvic acid, but the total organic carbon and nitrogen in the soil are not changed. High C:N increases the residue N as a result of N immobilization causing a negative priming effect in soil. There is a positive effect on humin, C mic, and CO2 emissions with additions of both residues, while the effect was negative on humic acid levels. There was a higher C concentration in humin > humic acid > fulvic acid. Under laboratory conditions, the C stabilization routes and priming effect indicated that mechanisms for the priming effect are explained by the input of residues in the soil with the acceleration of biological activity (positive priming) and a concentrated C stabilization route with low C:N inputs. Meanwhile, there is a slowing down of biological activity due to N immobilization (negative priming) and a diversified C stabilization route with low C:N inputs. The C routes were intensified because the study was run in control conditions with loam soil and adequate conditions of water, oxygen, and temperature.

Funding

This researcher was funded by the Coordenação de Aperfeiçoamento de Pessoal de Nível Superior (CAPES), grant number #88882.317567/2019-01), and The APC was funded by researcher.

Conflicts of Interest

The author declares no conflict of interest.

References

  1. Calegari, A.; Araújo, A.G.; de Costa, A.; Lanillo, R.F.; Casão Junior, R.; Santos, D.R.d. Conservation agriculture in Brazil. In Conservation Agriculture: Global Prospects and Challenges; CABI: Wallingford, UK, 2013; pp. 54–88. [Google Scholar]
  2. Marcelo, A.V.; Corá, J.E.; Fernandes, C.; Martins, M.d.R.; Jorge, R.F. Crop sequences in no-tillage system: Effects on soil fertility and soybean, maize and rice yield. Rev. Bras. Ciênc. Solo 2009, 33, 417–428. [Google Scholar] [CrossRef] [Green Version]
  3. De Freitas, P.L.; Landers, J.N. The Transformation of Agriculture in Brazil Through Development and Adoption of Zero Tillage Conservation Agriculture. Int. Soil Water Conserv. Res. 2014, 2, 35–46. [Google Scholar] [CrossRef] [Green Version]
  4. FBPDI Federação Brasileira de Plantio Direto e Irrigação. Available online: https://febrapdp.org.br/publicacoes-em-pd (accessed on 17 June 2020).
  5. Kassam, A.; Friedrich, T.; Derpsch, R.; Kienzle, J. Overview of the Worldwide Spread of Conservation Agriculture. Available online: https://journals.openedition.org/factsreports/3966 (accessed on 17 June 2020).
  6. Ghisellini, P.; Cialani, C.; Ulgiati, S. A review on circular economy: The expected transition to a balanced interplay of environmental and economic systems. J. Clean. Prod. 2016, 114, 11–32. [Google Scholar] [CrossRef]
  7. Yong, R. The circular economy in China. J. Mater. Cycles Waste Manag. 2007, 9, 121–129. [Google Scholar] [CrossRef]
  8. Carvalho, J.L.N.; Otto, R.; Franco, H.C.J.; Trivelin, P.C.O. Input of sugarcane post-harvest residues into the soil. Sci. Agric. 2013, 70, 336–344. [Google Scholar] [CrossRef] [Green Version]
  9. De Landel, M.G.A.; Scarpari, M.S.; Xavier, M.A.; dos Anjos, I.A.; Baptista, A.S.; de Aguiar, C.L.; da Silva, D.N.; Bidóia, M.A.P.; Brancalião, S.R.; Bressiani, J.A.; et al. Residual biomass potential of commercial and pre-commercial sugarcane cultivars. Sci. Agric. 2013, 70, 299–304. [Google Scholar] [CrossRef] [Green Version]
  10. Cavalli, E.; Lange, A.; Cavalli, C.; Behling, M. Decomposition and release of nutrients from crop residues on soybean-maize cropping systems. Rev. Bras. Ciênc. Solo 2018, 13, 1–8. [Google Scholar] [CrossRef] [Green Version]
  11. Torres, J.L.R.; Pereira, M.G.; Rodrigues Junior, D.J.; Loss, A. Efeitos de práticas de descompactação do solo em área sob sistema plantio direto. Rev. Cienc. Agron. 2015, 46, 451–459. [Google Scholar] [CrossRef] [Green Version]
  12. Gunnarsson, S.; Marstorp, H.; Dahlin, A.S.; Witter, E. Influence of non-cellulose structural carbohydrate composition on plant material decomposition in soil. Biol. Fertil. Soils 2008, 45, 27–36. [Google Scholar] [CrossRef] [Green Version]
  13. Wang, W.J.; Baldock, J.A.; Dalal, R.C.; Moody, P.W. Decomposition dynamics of plant materials in relation to nitrogen availability and biochemistry determined by NMR and wet-chemical analysis. Soil Biol. Biochem. 2004, 36, 2045–2058. [Google Scholar] [CrossRef]
  14. Trinsoutrot, I.; Recous, S.; Mary, B.; Nicolardot, B. C and N fluxes of decomposing 13C and 15N Brassica napus L.: Effects of residue composition and N content. Soil Biol. Biochem. 2000, 32, 1717–1730. [Google Scholar] [CrossRef]
  15. Moritsuka, N.; Yanai, J.; Mori, K.; Kosaki, T. Biotic and abiotic processes of nitrogen immobilization in the soil-residue interface. Soil Biol. Biochem. 2004, 36, 1141–1148. [Google Scholar] [CrossRef]
  16. De Almeida, R.F.; Silveira, C.H.; Mota, R.P.; Moitinho, M.; Arruda, E.M.; Mendonça, E.D.S.; La Scala, N.; Wendling, B. For how long does the quality and quantity of residues in the soil affect the carbon compartments and CO2-C emissions? J. Soils Sediments 2016, 16, 2354–2364. [Google Scholar] [CrossRef] [Green Version]
  17. Franchini, J.C.; Debiasi, H.; Balbinot Junior, A.A.; Tonon, B.C.; Farias, J.R.B.; de Oliveira, M.C.N.; Torres, E. Evolution of crop yields in different tillage and cropping systems over two decades in southern Brazil. Field Crop. Res. 2012, 137, 178–185. [Google Scholar] [CrossRef] [Green Version]
  18. Nascente, A.S.; Li, Y.; Crusciol, C.A.C. Agregação do solo, concentração de carbono orgânico e densidade do solo em razão de espécies de plantas de cobertura no sistema de plantio direto. Rev. Bras. Ciênc. Solo 2015, 39, 871–879. [Google Scholar] [CrossRef]
  19. Ramesh, T.; Bolan, N.S.; Kirkham, M.B.; Wijesekara, H.; Kanchikerimath, M.; Srinivasa Rao, C.; Sandeep, S.; Rinklebe, J.; Ok, Y.S.; Choudhury, B.U.; et al. Soil organic carbon dynamics: Impact of land use changes and management practices: A review. In Advances in Agronomy; Academic Press Inc.: Cambridge, MA, USA, 2019; Volume 156, pp. 1–107. ISBN 9780128175989. [Google Scholar]
  20. Jat, H.S.; Datta, A.; Choudhary, M.; Yadav, A.K.; Choudhary, V.; Sharma, P.C.; Gathala, M.K.; Jat, M.L.; McDonald, A. Effects of tillage, crop establishment and diversification on soil organic carbon, aggregation, aggregate associated carbon and productivity in cereal systems of semi-arid Northwest India. Soil Tillage Res. 2019, 190, 128–138. [Google Scholar] [CrossRef]
  21. Almeida, R.F.; Spokas, K.A.; de Bortoli Teixeira, D.; Júnior, N.L.S. Biochar insights from laboratory incubations monitoring O2 consumption and CO2 production. Biochar 2019, 1, 249–258. [Google Scholar] [CrossRef] [Green Version]
  22. Paustian, K.; Larson, E.; Kent, J.; Marx, E.; Swan, A. Soil C Sequestration as a Biological Negative Emission Strategy. Front. Clim. 2019, 1, 8. [Google Scholar] [CrossRef]
  23. Lal, R. Sequestration of atmospheric CO2 in global carbon pools. Energy Environ. Sci. 2008, 1, 86–100. [Google Scholar] [CrossRef]
  24. Poeplau, C.; Don, A. Carbon sequestration in agricultural soils via cultivation of cover—A meta-analysis. Agric. Ecosyst. Environ. 2015, 200, 33–41. [Google Scholar] [CrossRef]
  25. Jobbágy, E.G.; Jackson, R.B. The vertical distribution of soil organic carbon and its relation to climate and vegetation. Ecol. Appl. 2000, 10, 423–436. [Google Scholar] [CrossRef]
  26. Wendling, B.; Jucksch, I.; de Sá Mendonça, E.; de Almeida, R.F.; Alvarenga, R.C. Simulação dos estoques de Carbono e Nitrogênio pelo Modelo Century em Latossolos, no Cerrado Brasileiro. Rev. Cienc. Agron. 2014, 45, 238–248. [Google Scholar] [CrossRef] [Green Version]
  27. Almeida, R.F.; Mikhael, J.E.R.; Franco, F.O.; Santana, L.M.F.; Wendling, B. Measuring the labile and recalcitrant pools of carbon and nitrogen in forested and agricultural soils: A study under tropical conditions. Forests 2019, 10, 544. [Google Scholar] [CrossRef] [Green Version]
  28. Sayer, E.J.; Lopez-Sangil, L.; Crawford, J.A.; Bréchet, L.M.; Birkett, A.J.; Baxendale, C.; Castro, B.; Rodtassana, C.; Garnett, M.H.; Weiss, L.; et al. Tropical forest soil carbon stocks do not increase despite 15 years of doubled litter inputs. Sci. Rep. 2019, 9, 1–9. [Google Scholar] [CrossRef] [Green Version]
  29. Six, J.; Conant, R.T.; Paul, E.A.; Paustian, K. Stabilization mechanisms of soil organic matter: Implications for C-saturation of soils. Plant Soil 2002, 241, 155–176. [Google Scholar] [CrossRef]
  30. Loureiro, D.C.; de-Polli, H.; Ceddia, M.B.; de Aquino, A.M. Variabilidade espacial da biomassa microbiana e compartimentos lábeis da matéria orgânica de um planossolo háplico. Bragantia 2010, 69, 85–95. [Google Scholar] [CrossRef]
  31. Almeida, R.F.; Nave, E.R.; Mota, R.P. Soil quality: Enzymatic activity of soil β-glucosidase. Glob. Sci. Res. J. 2015, 3, 146–150. [Google Scholar]
  32. Stevenson, F.J. Humus Chemistry: Genesis, Composition, Reactions, 1st ed.; John Wiley & Sons,: New York, NY, USA, 1994. [Google Scholar]
  33. Almeida, R.F.; Haddad Silveira, C.; Mikhael, J.E.R.; Franco, F.O.; Ribeiro, B.T.; de Bruno Siqueira, A.; de Sa Mendonca, E.; Wendling, B. CO2 emissions from soil incubated with sugarcane straw and nitrogen fertilizer. Afr. J. Biotechnol. 2014, 13, 3376–3384. [Google Scholar] [CrossRef]
  34. Zhang, J.; Chi, F.; Wei, D.; Zhou, B.; Cai, S.; Li, Y.; Kuang, E.; Sun, L.; Li, L.J. Impacts of Long-term Fertilization on the Molecular Structure of Humic Acid and Organic Carbon Content in Soil Aggregates in Black Soil. Sci. Rep. 2019, 9, 11908. [Google Scholar] [CrossRef]
  35. Mikhael, J.E.R.; Almeida, R.F.; Franco, F.d.O.; Camargo, R.O.; Wendling, B. Recalcitrant carbon and nitrogen in agriculture soils with residue accumulation and fertilization under tropical conditions. Biosci. J. 2019, 35, 732–740. [Google Scholar] [CrossRef] [Green Version]
  36. Dou, S.; Shan, J.; Song, X.; Cao, R.; Wu, M.; Li, C.; Guan, S. Are humic substances soil microbial residues or unique synthesized compounds? A perspective on their distinctiveness. Pedosphere 2020, 30, 159–167. [Google Scholar] [CrossRef]
  37. Bae, H.C.; Cota-Robles, E.H.; Casida, L.E. Microflora of Soil as Viewed by Transmission Electron Microscopy1. Appl. Microbiol. 1972, 23, 637–648. [Google Scholar] [CrossRef] [PubMed]
  38. Joergensen, R.G.; Anderson, T.H.; Wolters, V. Carbon and nitrogen relationships in the microbial biomass of soils in beech (Fagus sylvatica L.) forests. Biol. Fertil. Soils 1995, 19, 141–147. [Google Scholar] [CrossRef]
  39. Diniz, L.T.; Ramos, M.L.G.; Junior, W.Q.R.; Cruz, A.F.; de Franca, L.V.; Diniz, B.T.; Amabile, R.F. Effect of nitrogen fertilization on soil microbial biomass in an Oxisol cultivated with irrigated barley in the Brazilian Cerrado. Acta Agron. 2016, 65, 137–143. [Google Scholar] [CrossRef]
  40. Gong, S.; Zhang, T.; Guo, J. Warming and nitrogen addition change the soil and soil microbial biomass C:N:P stoichiometry of a meadow steppe. Int. J. Environ. Res. Public Health 2019, 16, 2705. [Google Scholar] [CrossRef] [PubMed] [Green Version]
  41. Lopes, C.M.; Silva, A.M.M.; Estrada-Bonilla, G.A.; Ferraz-Almeida, R.; Vieira, J.L.V.; Otto, R.; Vitti, G.C.; Cardoso, E.J.B.N. Improving the fertilizer value of sugarcane wastes through phosphate rock amendment and phosphate-solubilizing bacteria inoculation. J. Clean. Prod. 2021, 298, 126821. [Google Scholar] [CrossRef]
  42. Zhou, Y.; Selvam, A.; Wong, J.W.C. Evaluation of humic substances during co-composting of food waste, sawdust and Chinese medicinal herbal residues. Bioresour. Technol. 2014, 168, 229–234. [Google Scholar] [CrossRef] [PubMed]
  43. Kuzyakov, Y.; Friedel, J.K.; Stahr, K. Review of mechanisms and quantification of priming effects. Soil Biol. Biochem. 2000, 32, 1485–1498. [Google Scholar] [CrossRef]
  44. Qiao, N.; Xu, X.; Hu, Y.; Blagodatskaya, E.; Liu, Y.; Schaefer, D.; Kuzyakov, Y. Carbon and nitrogen additions induce distinct priming effects along an organic-matter decay continuum. Sci. Rep. 2016, 6, 1–8. [Google Scholar] [CrossRef]
  45. Melillo, J.M.; Butler, S.; Johnson, J.; Mohan, J.; Steudler, P.; Lux, H.; Burrows, E.; Bowles, F.; Smith, R.; Scott, L.; et al. Soil warming, carbon-nitrogen interactions, and forest carbon budgets. Proc. Natl. Acad. Sci. USA 2011, 108, 9508–9512. [Google Scholar] [CrossRef] [Green Version]
  46. EMBRAPA, Empresa Brasileira de Pesquisa Agropecuária. Manual de Métodos de Análise de Solo; Centro Nacional de Pesquisa de Solos: Rio Janeiro, Brazil, 1997. [Google Scholar]
  47. Gee, G.W.; Orr, D. Particle-size analysis. In Methods of Soil Analysis; Dane, J., Topp, G., Eds.; Soils Science Society of America: Madison, WI, USA, 2002; pp. 255–293. [Google Scholar]
  48. Embrapa. Sistema Brasileiro de Classificação de Solos, 5th ed.; Embrapa: Rio Janeiro, Brazil, 2018. [Google Scholar]
  49. Soil Survey Staff Soil Survey. NRCS Soils. Available online: https://www.nrcs.usda.gov/wps/portal/nrcs/main/soils/survey/ (accessed on 29 May 2020).
  50. Yeomans, J.C.; Bremner, J.M. A rapid and precise method for routine determination of organic carbon in soil1. Commun. Soil Sci. Plant Anal. 1988, 19, 1467–1476. [Google Scholar] [CrossRef]
  51. Guo, L.; Nishimura, T.; Imoto, H.; Sun, Z. Applicability of soil column incubation experiments to measure CO2 efflux**. Int. Agrophys. 2015, 29, 413–421. [Google Scholar] [CrossRef] [Green Version]
  52. Swift, R. Organic matter characterization. In Methods of Soil Analysis: Chemical Methods, Part 3; Sparks, D., Page, A., Helmke, P., Loeppert, R., Soltanpour, P., Tabatabai, M., Johnston, C., Sumner, M., Eds.; Soil Science Society of America, American Society of Agronomy: Madison, WI, USA, 1996; pp. 1011–1020. [Google Scholar]
  53. Mendonça, E.; Matos, E. Matéria Orgânica do Solo: Métodos de Análises; D&M Gráfica e Editora Ltd.a,: Ponte Nova, Brazil, 2005. [Google Scholar]
  54. Islam, K.R.; Weil, R.R. Microwave irradiation of soil for routine measurement of microbial biomass carbon. Biol. Fertil. Soils 1998, 27, 408–416. [Google Scholar] [CrossRef]
  55. Vance, E.D.; Brookes, P.C.; Jenkinson, D.S. An extraction method for measuring soil microbial biomass C. Soil Biol. Biochem. 1987, 19, 703–707. [Google Scholar] [CrossRef]
  56. Rahman, M.M. Carbon Dioxide Emission from Soil. Agric. Res. 2013, 2, 132–139. [Google Scholar] [CrossRef] [Green Version]
  57. Li, X.S.; Han, H.F.; Ning, T.Y.; Lal, R. CO 2-C evolution rate in an incubation study with straw input to soil managed by different tillage systems. RSC Adv. 2018, 8, 12588–12596. [Google Scholar] [CrossRef] [Green Version]
  58. Vargas, V.P.; Cantarella, H.; Martins, A.A.; Soares, J.R.; do Carmo, J.B.; de Andrade, C.A. Sugarcane Crop Residue Increases N2O and CO2 Emissions Under High Soil Moisture Conditions. Sugar Tech. 2014, 16, 174–179. [Google Scholar] [CrossRef]
  59. Luo, Y.; Zhou, X. Soil Respiration and the Environment; Elsevier Inc.: Amsterdam, The Netherlands, 2006; ISBN 9780120887828. [Google Scholar]
  60. Ferraz-Almeida, R.; de Bortoli Teixeira, D.; Montanari, R.; Bolonhezi, A.C.; Teixeira, E.B.; Moitinho, M.R.; Panosso, A.R.; Spokas, K.A.; La Scala Júnior, N. Ratio of CO2 and O2 as index for categorising soil biological activity in sugarcane areas under contrasting straw management regimes. Soil Res. 2018, 56, 373. [Google Scholar] [CrossRef]
  61. Tavares, R.L.M.; Spokas, K.; Hall, K.; Colosky, E.; de Souza, Z.M.; La Scala, N. Sugarcane residue management impact soil greenhouse gas. Ciênc. e Agrotecnol. 2018, 42, 195–203. [Google Scholar] [CrossRef]
  62. Cardoso, E.J.B.N.; Vasconcellos, R.L.F.; Bini, D.; Miyauchi, M.Y.H.; dos Santos, C.A.; Alves, P.R.L.; de Paula, A.M.; Nakatani, A.S.; Pereira, J. de M.; Nogueira, M.A. Soil health: Looking for suitable indicators. What should be considered to assess the effects of use and management on soil health? Sci. Agric. 2013, 70, 274–289. [Google Scholar] [CrossRef] [Green Version]
  63. Uchida, Y.; Akiyama, H. Soil Science and Plant Nutrition Mitigation of postharvest nitrous oxide emissions from soybean ecosystems: A review Mitigation of postharvest nitrous oxide emissions from soybean ecosystems: A review. Soil Sci. Plant Nutr. 2013, 59, 477–487. [Google Scholar] [CrossRef] [Green Version]
  64. Ferraz-Almeida, R.; Da Silva, N.; Wendling, B. How Does N Mineral Fertilizer Influence the Crop Residue N Credit? Nitrogen 2020, 1, 99–110. [Google Scholar] [CrossRef]
  65. Danga, B.O.; Ouma, J.P.; Wakindiki, I.I.C.; Bar-Tal, A. Chapter 5 Legume-Wheat Rotation Effects on Residual Soil Moisture, Nitrogen and Wheat Yield in Tropical Regions. Adv. Agron. 2009, 101, 315–349. [Google Scholar]
  66. Uzoh, I.M.; Igwe, C.A.; Okebalama, C.B.; Babalola, O.O. Legume-maize rotation effect on maize productivity and soil fertility parameters under selected agronomic practices in a sandy loam soil. Sci. Rep. 2019, 9, 1–9. [Google Scholar] [CrossRef] [Green Version]
  67. Bacanamwo, M.; Harper, J.E. Regulation of nitrogenase activity in Bradyrhizobium japonicum/soybean symbiosis by plant N status as determined by shoot C:N ratio. Physiol. Plant. 1996, 98, 529–538. [Google Scholar] [CrossRef]
  68. Fontana, A.; Pereira, M.G.; Loss, A.; Cunha, T.J.F.; Salton, J.C. Atributos de fertilidade e frações húmicas de um Latossolo Vermelho no Cerrado. Pesqui. Agropecu. Bras. 2006, 41, 847–853. [Google Scholar] [CrossRef]
  69. Ebeling, A.G.; dos Anjos, L.H.C.; Pereira, M.G.; Pinheiro, É.F.M.; Valladares, G.S. Substâncias húmicas e relação com atributos edáficos. Bragantia 2011, 70, 157–165. [Google Scholar] [CrossRef]
  70. Fontaine, S.; Mariotti, A.; Abbadie, L. The priming effect of organic matter: A question of microbial competition? Soil Biol. Biochem. 2003, 35, 837–843. [Google Scholar] [CrossRef]
  71. Wang, H.; Boutton, T.W.; Xu, W.; Hu, G.; Jiang, P.; Bai, E. Quality of fresh organic matter affects priming of soil organic matter and substrate utilization patterns of microbes. Sci. Rep. 2015, 5, 10102. [Google Scholar] [CrossRef] [Green Version]
Figure 1. Daily humin (g kg−1), fulvic acid (g kg−1), humic acid (g kg−1), labile C (g kg−1), microbial biomass carbon (C mic, μg g−1ha−1), and CO2 emission (g CO2 m−2 h−1) during 50 days of incubation. Ns: no difference; * difference between residue additions (high and low C:N) and control. In CO2 emissions, the mean of the residues and the control were compared by the LSD test (p < 0.05). The variables were monitored on the 1st, 3rd, 6th, 12th, and 50th day of incubation.
Horticulturae 08 00154 g001
Figure 2. Daily total organic carbon and nitrogen in residue and soil (g kg−1) during 50 days of incubation. The mean of high and low C:N was compared by the t test (p < 0.05); * and Ns mean significant difference and no difference between residues, respectively. The variables were monitored on the 1st, 3rd, 6th, 12th, and 50th day of incubation.
Horticulturae 08 00154 g002
Figure 3. Correlation of carbon and nitrogen in the residue (g kg−1) with additions of high and low C:N after 50 days of incubation. The mean of C and N in the residues was correlated by Pearson correlation (p < 0.05).
Horticulturae 08 00154 g003
Figure 4. Stock balance of humin (g kg−1), fulvic acid (g kg−1), humic acid (g kg−1), labile carbon (g kg−1), microbial biomass carbon (C mic, μg g−1 ha−1), and CO2 emissions (g CO2 m−2 h−1). The stock was calculated according to the difference in C contents in 50-day and initial soil C (day 0).
Horticulturae 08 00154 g004
Figure 5. Routes of humin (g kg−1), fulvic acid (g kg−1), humic acid (g kg−1), labile carbon (g kg−1), and microbial biomass carbon (C mic, μg g−1 ha−1) between the initial (1–6th day of incubation) and final period (7–50th day of incubation). Negative and positive routes are demonstrated by red and blue arrows, respectively.
Horticulturae 08 00154 g005
Figure 6. Priming effect (positive and negative) in soil with residue additions with high and low C:N. Means were compared by t test (p < 0.05).
Horticulturae 08 00154 g006
Table 1. Means of humin, fulvic acid, humic acid, labile carbon, microbial biomass carbon (C mic), CO2 emissions, and total organic carbon and nitrogen in soil and residues.
Stocks of C and N-Residues
ControlLow C:NHigh C:N
Humin, g kg−1, Ns14.2 ± 0.215.0 ± 0.214.5 ± 0.2
Humic acid, g kg−1, Ns1.7 ± 0.11.8 ± 0.11.7 ± 0.1
Fulvic acid, g kg−13.0 ± 0.13.2 ± 0.1 A2.9 ± 0.1B
Labile carbon, g kg−1, Ns5.2 ± 0.05.2 ± 0.05.2 ± 0.0
C mic, μg g−1 ha−1, Ns1718.0 ± 50.32048.9 ± 132.12057.1 ± 97.5
CO2 emission, g CO2 m−2 h−11.0 ± 0.19.4 ± 1.0A5.7 ± 0.4 B
Soil C, g kg−1, Ns-22.9 ± 1.022.5 ± 0.6
Residue C, g kg−1-76.3 ± 16.1 B86.2 ± 11.1 A
Soil N, g kg−1, Ns-1.6 ± 0.11.5 ± 0.09
Residue N, g kg−1-11.5 ± 1.5 A8.3 ± 0.5 B
Means of low and high C:N were compared by the t test (p < 0.05), and represented by uppercase letters in rows. In control, total C and N in soil were not monitored. Ns: there was no difference.
Publisher’s Note: MDPI stays neutral with regard to jurisdictional claims in published maps and institutional affiliations.

