Article

Effects of Metribuzin Herbicide on Some Morpho-Physiological Characteristics of Two Echinacea Species

1
Department of Agronomy and Plant Breeding, College of Agriculture, Isfahan University of Technology, Isfahan 84156-83111, Iran
2
Department of Plant and Soil Sciences, Mississippi State University, Starkveli, MS 39762, USA
3
Department of Molecular and Translational Medicine, Division of Pharmacology, University of Brescia, 25123 Brescia, Italy
*
Authors to whom correspondence should be addressed.
Horticulturae 2022, 8(2), 169; https://doi.org/10.3390/horticulturae8020169
Submission received: 7 January 2022 / Revised: 14 February 2022 / Accepted: 14 February 2022 / Published: 17 February 2022

Abstract

:
Echinacea is a perennial plant that is used for its phytotherapeutic potential. Echinacea crops are often affected by invasive weeds. One of the most effective strategies in weed control is the use of chemicals such as herbicides. However, herbicides also affect the physiological and morphological processes of Echinacea. For this reason, the aim of this study was to determine the effects of different dosages (0, 250, 500, 750, 1000, and 1250 g ha−1) of the postemergent herbicide metribuzin on some morphological and physiological characteristics of Echinacea purpurea and Echinacea angustifolia collected from different locations in Iran (E. purpurea from the Shiraz and Isfahan regions and E. angustifolia from the Ardestan and Kazerun regions). Application of metribuzin decreased leaf dry weight for both Echinacea species at high doses (750 and 1250 g ha−1). At high metribuzin dose (1250 g ha−1), E. purpurea Shiraz leaves showed an increase in MDA (malondialdehyde) up to 9.14, while in other species the MDA content was lower. Minimum and maximum fluorescence increased at both the registered dosage (500 g ha1) and at high doses (750–1250 g ha−1) of metribuzin treatments in both species. The Fv/Fm (maximum quantum yield) value was reduced in herbicide treated species, compared to the control, starting at the 250 g ha−1 dose, and was lowest at 750 g ha−1 dose. The results of this study indicate that metribuzin has adverse effects on the physiology and morphology of Echinacea species at dosages above 500 g ha−1.

1. Introduction

Echinacea is a perennial plant of the Asteraceae family found naturally in parts of North America [1]. Three species of Echinacea, E. pallida (Nutt) Nutt, E. purpurea (L.) Moench, and E. angustifolia (DC) Hell, are used for their medicinal aspects [2]. All three were traditionally used by native Americans in medicinal remedies for cold viruses, pain, coughing, influenza, and snake bites [3]. Additionally, Echinacea has been found to have antibacterial, antiviral, anti-inflammatory, and antioxidant properties [4]. With the growing demand for Echinacea, the cultivation of these species has increased worldwide for several years [5]. Unfortunately, relatively little is known on the effects of plantation management on the physiological aspects and yield of Echinacea [6]. One of the primary aspects of management that is least addressed is weed control, particularly in newly established crops [7,8,9,10,11,12]. Because of the effectiveness and ease of application of herbicides for weed control, farmers have been repeatedly using herbicides to control adventitious weeds in different cropping systems [5,13]. Use of herbicides for weed control in medicinal plants has also been reported [14]. Pre-planting and post-planting application of oxadiazon- (dichlorobenzenes group) and oxyfluorfen- (ether group) based herbicides on Origanum syriacum L. indicates both molecules to be effective in controlling weeds in this species [14]. Forcella et al. (2012) evaluated the tolerance of pot marigold (Calendula officinalis L.) to postemergence herbicides, phenmedipham- (carbamate acid group) and desmedipham- (carbamate acid group) based herbicides, and reported tolerance of this species to both compounds [15]. Foeniculum vulgare Mill was identified to be tolerant to pendimethalin- (dinitroaniline group) and trifluralin- (aniline group) based herbicides, and the treatment provided substantial weed control without Foeniculum vulgare Mill injury. Moreover, dinitroaniline group-based herbicide (pendimethalin) was found to be more effective than aniline group-based herbicide (trifluralin) [16].
Cultivars with herbicide tolerance provide an effective way to manage weeds and at the same time protect the yield and quality of Echinacea. The effects of herbicides on crops may be assessed through agronomic traits (leaf area, plant growth, biomass, and yield, etc.) and physiological variations (chlorophyll content, photosynthesis, and lipid peroxidation) [17,18]. Chlorophyll fluorescence analysis may be a useful tool to detect adverse effects of herbicides belonging to the chemical group of photosynthetic inhibitors. These herbicides cause damage to photosystem II (PSII) complex, blocked PSII electron transport, enhanced F0, decreased Fm and Fv/Fm, and reduced photosynthetic efficiency [17,19]. Moreover, herbicide application resulted in peroxidation and destruction of lipids in plant leaves [20]. Malondialdehyde (MDA) is the most important and is an indicator of lipid peroxidation. MDA causes adverse effects in plants, thus, free MDA has been determined in various sources as an oxidative stress marker [21]. It is a product of lipid peroxidation, and its levels are shown to rise when a plant is exposed to herbicide stress [20].
Among the herbicides that could be potentially labeled in Echinacea production is metribuzin, a postemergent herbicide, having the ability to effectively control a broad spectrum of dicot weeds [22]. In particular, metribuzin is a herbicide that blocks photosynthetic processes by inhibiting the electron transport of PSII [23]. This inhibiting action causes an alteration of the physiology and morphology of the leaf structures that turn yellow and fall (abscission) [24]. The PSII inhibition generated by metribuzin is not species specific, and many other plants can be affected by its toxic action [24]. Moreover, the production of secondary metabolites is also affected by the action of metribuzin. Indeed, metribuzin acts on the metabolism of mevalonate by reducing the synthesis of secondary metabolites [25]. Furthermore, metribuzin reduces the synthesis of jasmonates making plants more vulnerable to biotic and abiotic stress [25]. Echinacea also is sensitive to metribuzin [26] and in some cases metribuzin application has led to noticeable seed yield reduction in Echinacea [27]. However, some plants have developed a certain tolerance to metribuzin, thanks to the increase in detoxification processes. Indeed, Xu and colleagues identified in some metribuzin-resistant species of Triticum aestivum L. an increase in the expression of genes associated with metabolic detoxification, such as those of the P450 pathway and those of the xenobiotic transmembrane transporter activity [28].
Echinacea species need to be evaluated for tolerance to metribuzin to ensure crop safety under different field conditions and to improve weed control. Furthermore, there is little information on the effects of metribuzin in postemergence phases in Echinacea. Therefore, the aim of the present study was (i) to evaluate the morphological and physiological responses of Echinacea species to metribuzin treatment and (ii) to establish the maximum dose of metribuzin tolerated by E. purpurea and E. angustifolia.

2. Materials and Methods

2.1. Experimental Setup and Plant Material

A pot experiment was conducted from May to October 2018 (i.e., 170 days) to investigate the effects of metribuzin on four Echinacea cultivars collected from different geographical regions in Iran, namely Isfahan, Shiraz, Ardestan, and Kazerun. The experiment was conducted as a two-factor factorial based on completely randomized design with three replications, in the research greenhouse located in the Faculty of Agriculture, Isfahan University of Technology, in 2018. The experimental treatments were five metribuzin doses (0, 250, 500, 750, and 1250 g ha−1) and four Echinacea cultivars including Echinacea purpurea Shiraz, Echinacea purpurea Isfahan, Echinacea angustifolia Ardestan, and Echinacea angustifolia Kazerun. The recommended rate for metribuzin is 750 g ha−1 based on Sencor 70 WP (Bayer, Tehran, Iran) as its commercial formulation in Iran. Metribuzin is a herbicide belonging to the triazines group. Echinacea seeds were treated with 5% NaOCl solution for 2 min, followed by washing with distilled water three times to remove excess sodium hypochlorite solution. Seeds were then pre-germinated in mixed media (80% cocopeat and 20% perlite) and seedlings were transferred to pots when they reached the 2–3 leaf stage. Pots were filled with 8.5 kg of air-dried soil and the plants were grown under 16 h:8 h (light:dark) photoperiod. Each replication consisted of three pots with three plants per pot. During the growing season, pots were irrigated every day and metribuzin was applied to all nine plants individually transferred to a pot. Since the growth area of the plants was about 50 cm2, intermediate dilutions (in irrigation water) were performed starting from Sencor 70 (metribuzin 70%) in order to reach doses of 0, 250, 500, 750, and 1250 g ha−1. Plants were subjected to a single metribuzin treatment with an electric backpack sprayer at the 4–6 leaf stage of Echinacea plant. For the application of metribuzin a diffuser (twin flat-fan nozzle) was used which emits the herbicide at a pressure of 250 kPa, in a calibrated nebulization chamber to deliver 250 L water ha−1.

2.2. Leaf Area and Growth Parameters

Initially, all E. purpurea and E. angustifolia leaves (aerial parts of the plant, about 10 leaves per plant) were collected in spring 2018 and were used to measure the effect of metribuzin treatment on the leaf area. The leaf area was measured by a Leaf Area Meter (WINAREA-UT-11, Isfahan University, Isfahan, Iran). Subsequently, the aerial parts of the plant (about 20 g of E. purpurea and 5 g of E. angustifolia) were oven-dried (Incubator-Model of Arvin Tajhiz Spadan, Isfahan, Iran) completely at 70 °C for 48 h and the dry weight was measured.
Other growth traits such as, stem and root length, root and shoot fresh weight, and root volume, were also assessed. In particular, a precision ruler was used to measure the height of the root and the weight of all the roots of the plants tested. To estimate the root volume the following equation was applied to calculate the volume of the cone:
V o l u m e = π × r 2 × h 3
where r is the radius of the root and h is the height of the root.
The dry weight of both the leaves and the root is about 80% less than their fresh weight.

2.3. Malondialdehyde (MDA) Content

For estimating the amount of MDA production, leaf material was collected 48 h after herbicide application and frozen in liquid N2 and preserved in −80 °C. The thiobarbituric acid (TBA) test was used [29] with slight modification. Briefly, leaf sample (200 mg) was homogenized in 2 mL 0.1% (w:v) TCA (trichloroacetic acid) solution. The homogenate was centrifuged at 10,000× g for 20 min at 4 °C (eppendorf, Teheran, Iran) and 250 µL of the supernatant was added to 1 mL 0.5% (w:v) TBA in 20% TCA. The mixture was incubated in a water bath at 95 °C for 30 min, and the reaction stopped by cooling the tubes in an ice bath. Samples were then centrifuged at 10,000× g for 15 min, and the absorbance of supernatant was recorded at 532 nm. The value for non-specific absorption at 600 nm was subtracted and the MDA (red pigment) dose was calculated from the extinction coefficient (155 mM−1 cm−1).

2.4. Chlorophyll Fluorescence

Measurements of F0 (minimum fluorescence, arbitrary units), Fm (maximum fluorescence, arbitrary units), maximum quantum yield (Fv/Fm, ratio that measures the efficiency of Photosystem II) were randomly taken from the top-most developed leaves of the seedlings using a chlorophyll fluorometer (Opti-Sciences, model OS-30p, Boston, MA, USA). The fluorescence signal was measured at a standard position on the dark adapted leaf, approximately in the middle of the adaxial surface. Plants were covered using a dark plastic sheet for 20 min before the data were recorded. Data for chlorophyll fluorescence were recorded 10 days after application of metribuzin.

2.5. Statistical Analysis

Data analysis was performed after normality test by SPSS 19.0 software and analysis of variance was carried out to determine differences among the treatments using the GLM (general linear model) method in SAS 9.1 software. If the analysis of variance indicated statistically significant differences, the mean comparisons were completed using least significant difference (LSD) test at 0.05 level of probability. All data were normalized as a percentage of the control mean for each parameter. This processing allows to evaluate the percentage increase and decrease with respect to the control group. Moreover, for leaf area, leaf dry weight, malondialdehyde, root dry weight, root volume, root length, and photosynthesis parameters a two-way ANOVA was performed using the GraphPad Software, San Diego, CA, USA followed by Dunnett’s multiple comparisons test for the comparison of individual means.

3. Results

From the general analysis of the collected results, it is highlighted that the herbicide had a significant effect in all Echinacea cultivars. In particular, the analysis of variance revealed a significant effect of metribuzin dose on all measured traits. Additionally, the effect of Echinacea cultivars and Echinacea cultivars x herbicide was significant for all traits (Table 1).

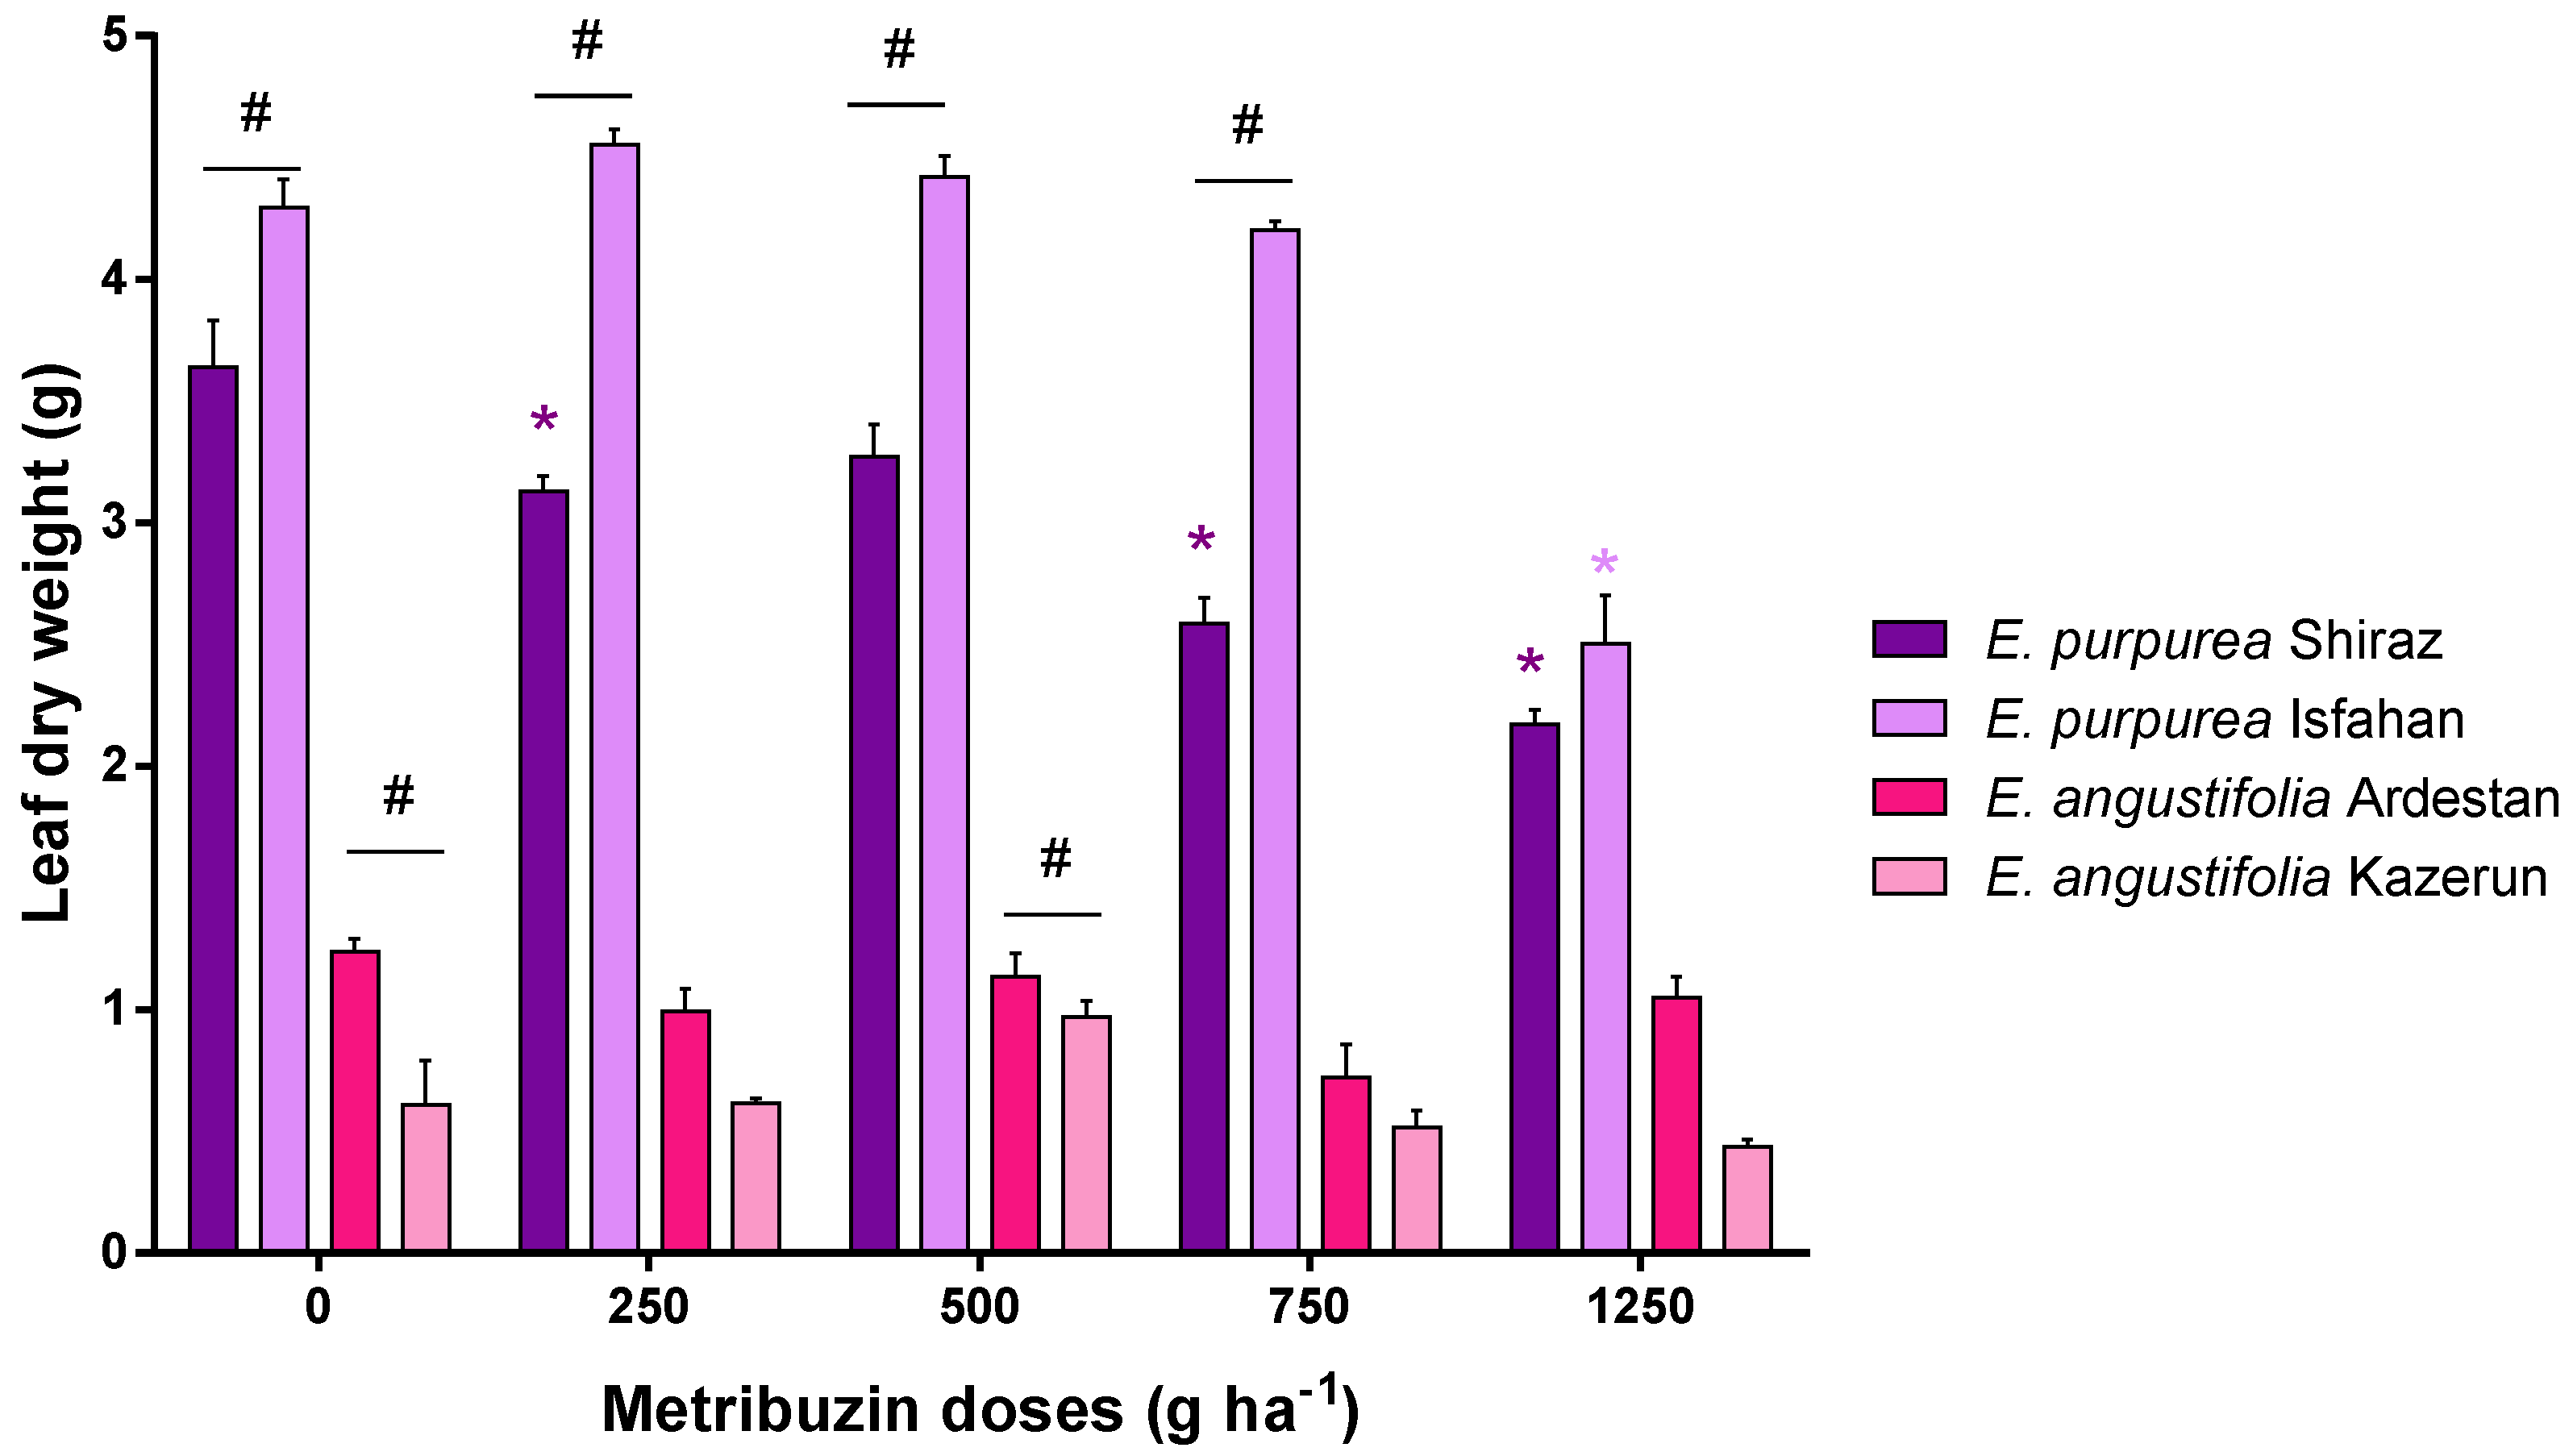
3.1. Leaf Parameters: Leaf Area and Leaf Dry Weight

Analyzing in detail the effects of metribuzin on the studied Echinacea cultivars, statistically significant effects were highlighted at high dosages. Regarding leaf area (Figure 1), both E. angustifolia and E. purpurea showed an increase after treatment with 500 g ha−1 of metribuzin compared to control. Moreover, statistical analysis revealed significant differences between the cultivars of E. purpurea and E. angustifolia. At 250, 500, 750, and 1250 g ha−1 metribuzin doses, E. purpurea Shiraz showed significant differences in the leaf area compared to Isfahan. Above the 500 g ha−1 metribuzin dose, the significant differences between the two E. purpurea cultivars were maintained and the leaf area decreased. A similar trend was observed in E. angustifolia Ardestan and Kazerun at 250 g ha−1. Finally, at high dosages of metribuzin, no significant differences in the leaf area were observed with respect to the control in both E. angustifolia cultivars.
The effects of high dosages of metribuzin on the leaf area also affected the dry weight of Echinacea leaves. Particularly, application of metribuzin at high doses (750–1250 g ha−1) resulted in drastic reduction in leaf dry weight of all Echinacea species (Figure 2). Furthermore, all the experimental groups of E. purpurea Isfahan show a higher and significant dry weight of the leaf compared to E. purpurea Shiraz. E. angustifolia Kazerun also shows statistically higher foliar dry weight values than Ardestan, but only at 250 g ha−1 metribuzin.
These results suggest that application of high doses (750–1250 g ha−1) of metribuzin adversely affects the biomass accumulation in Echinacea species.

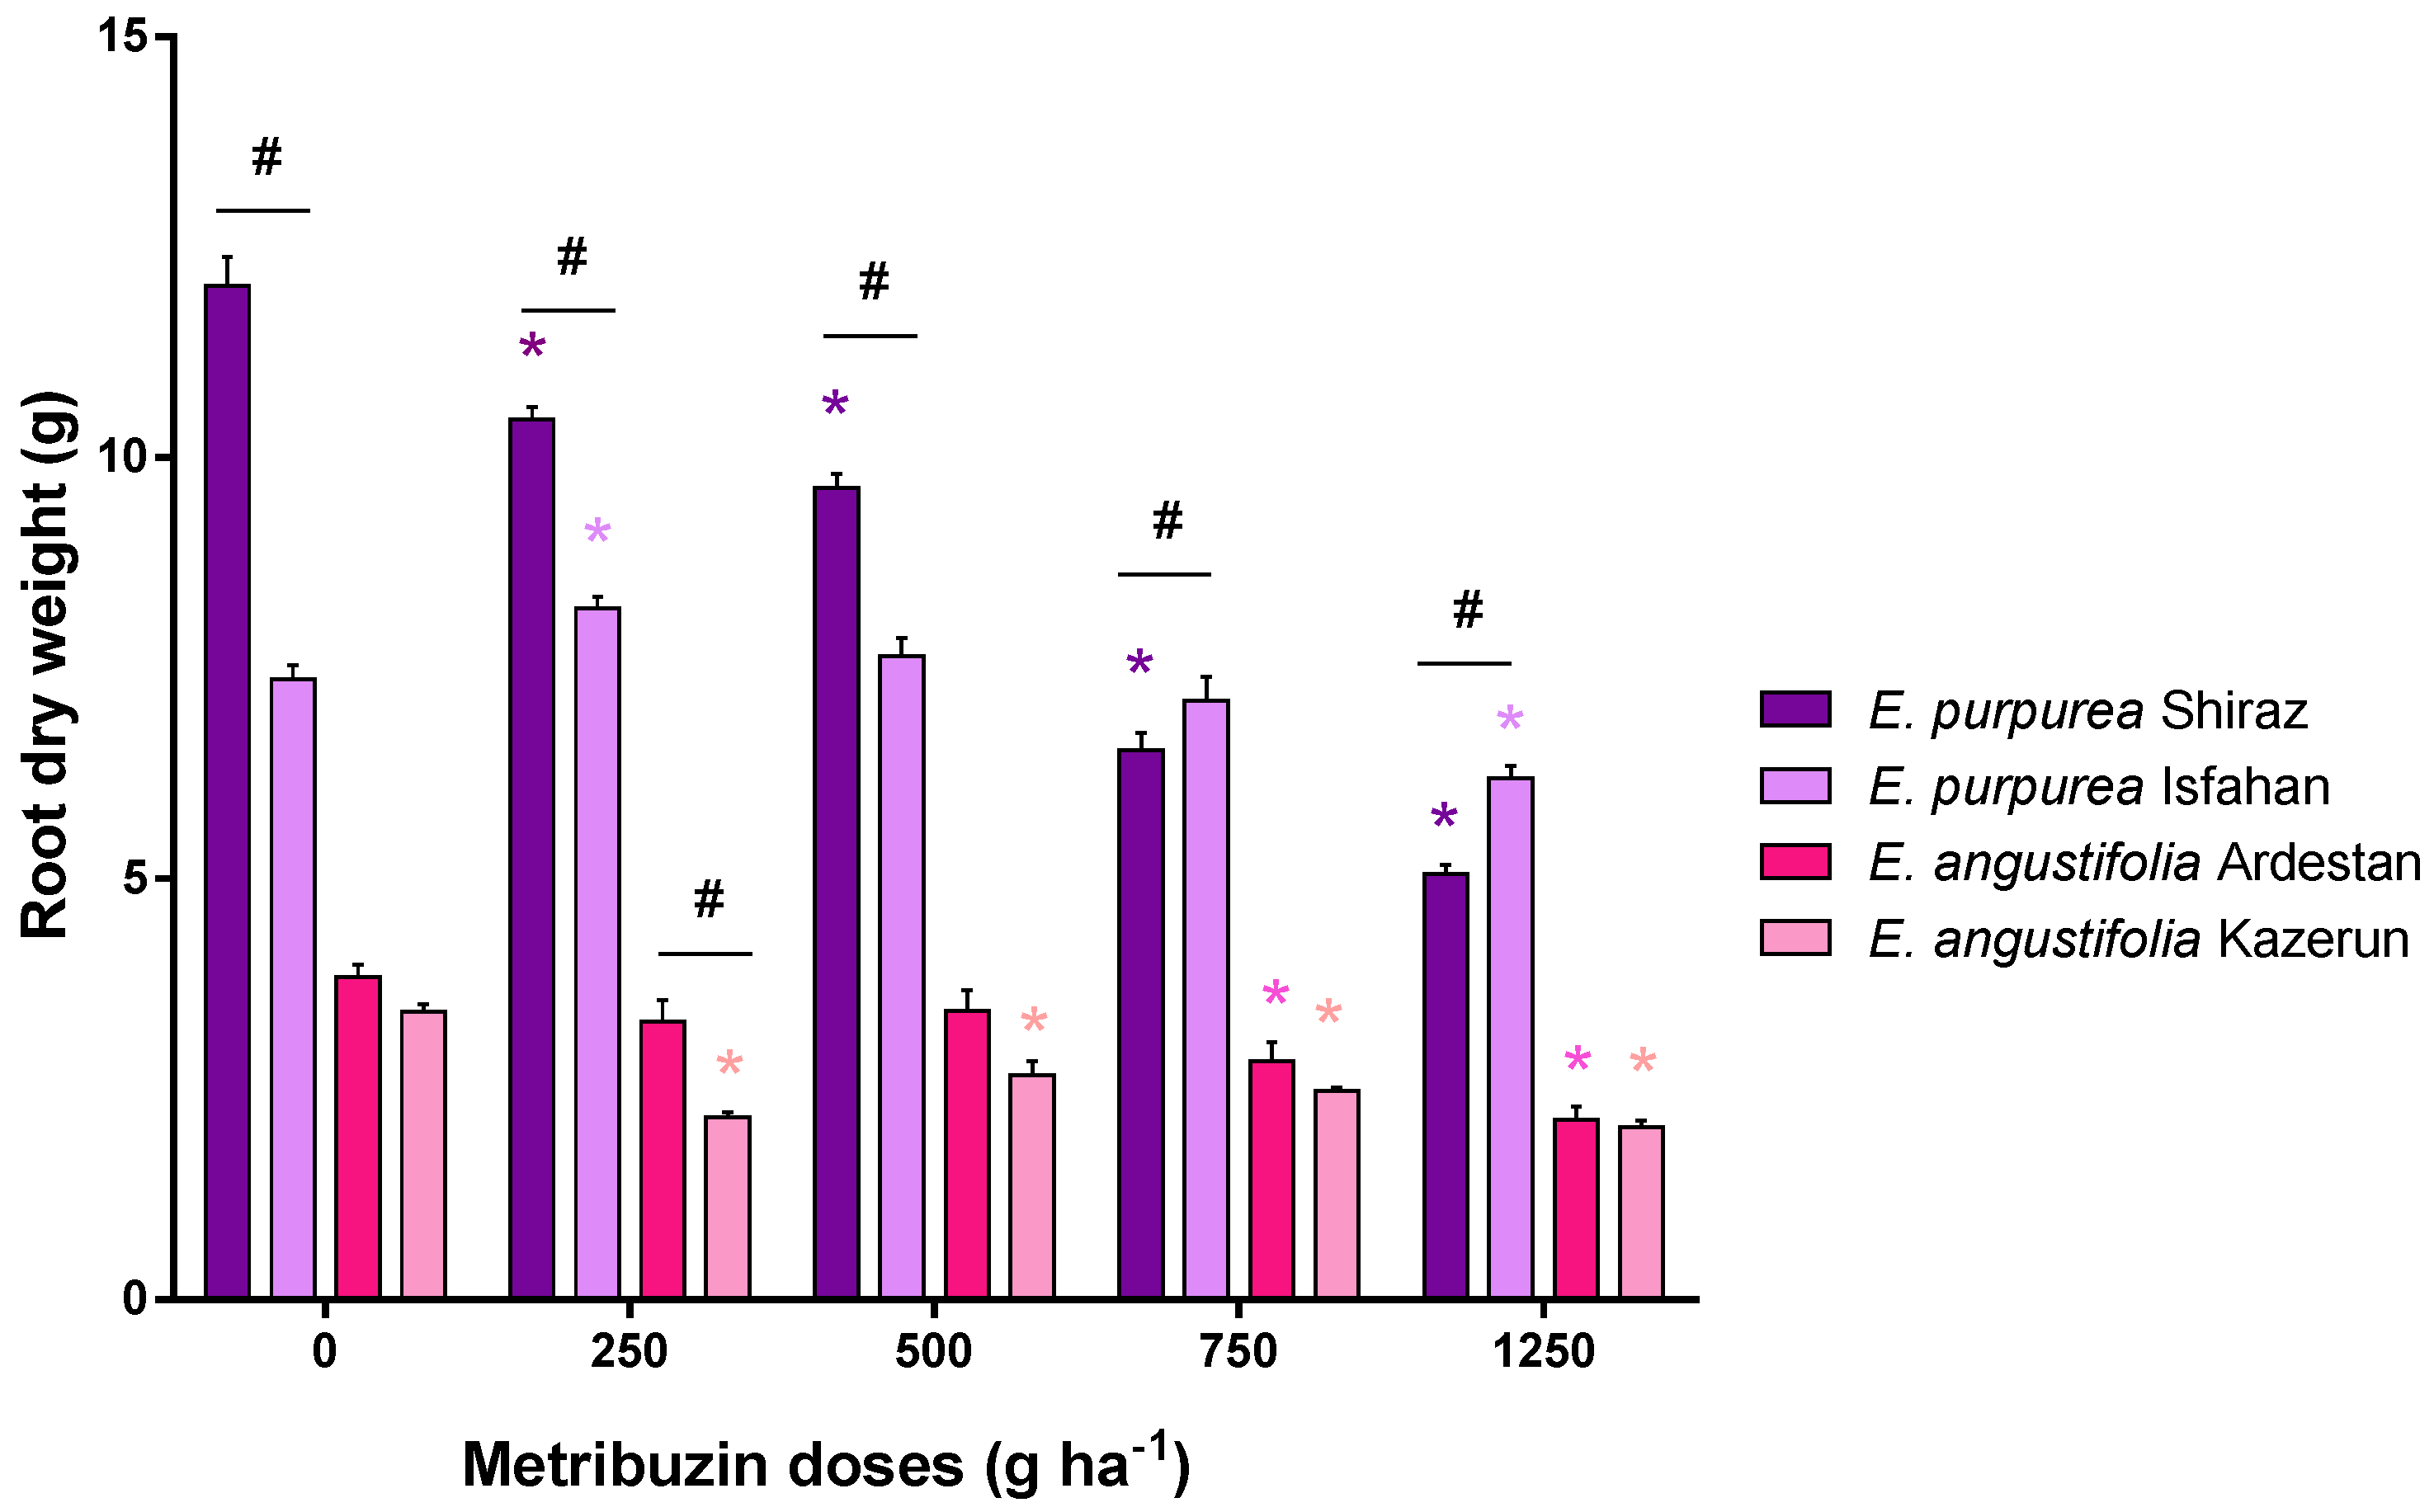
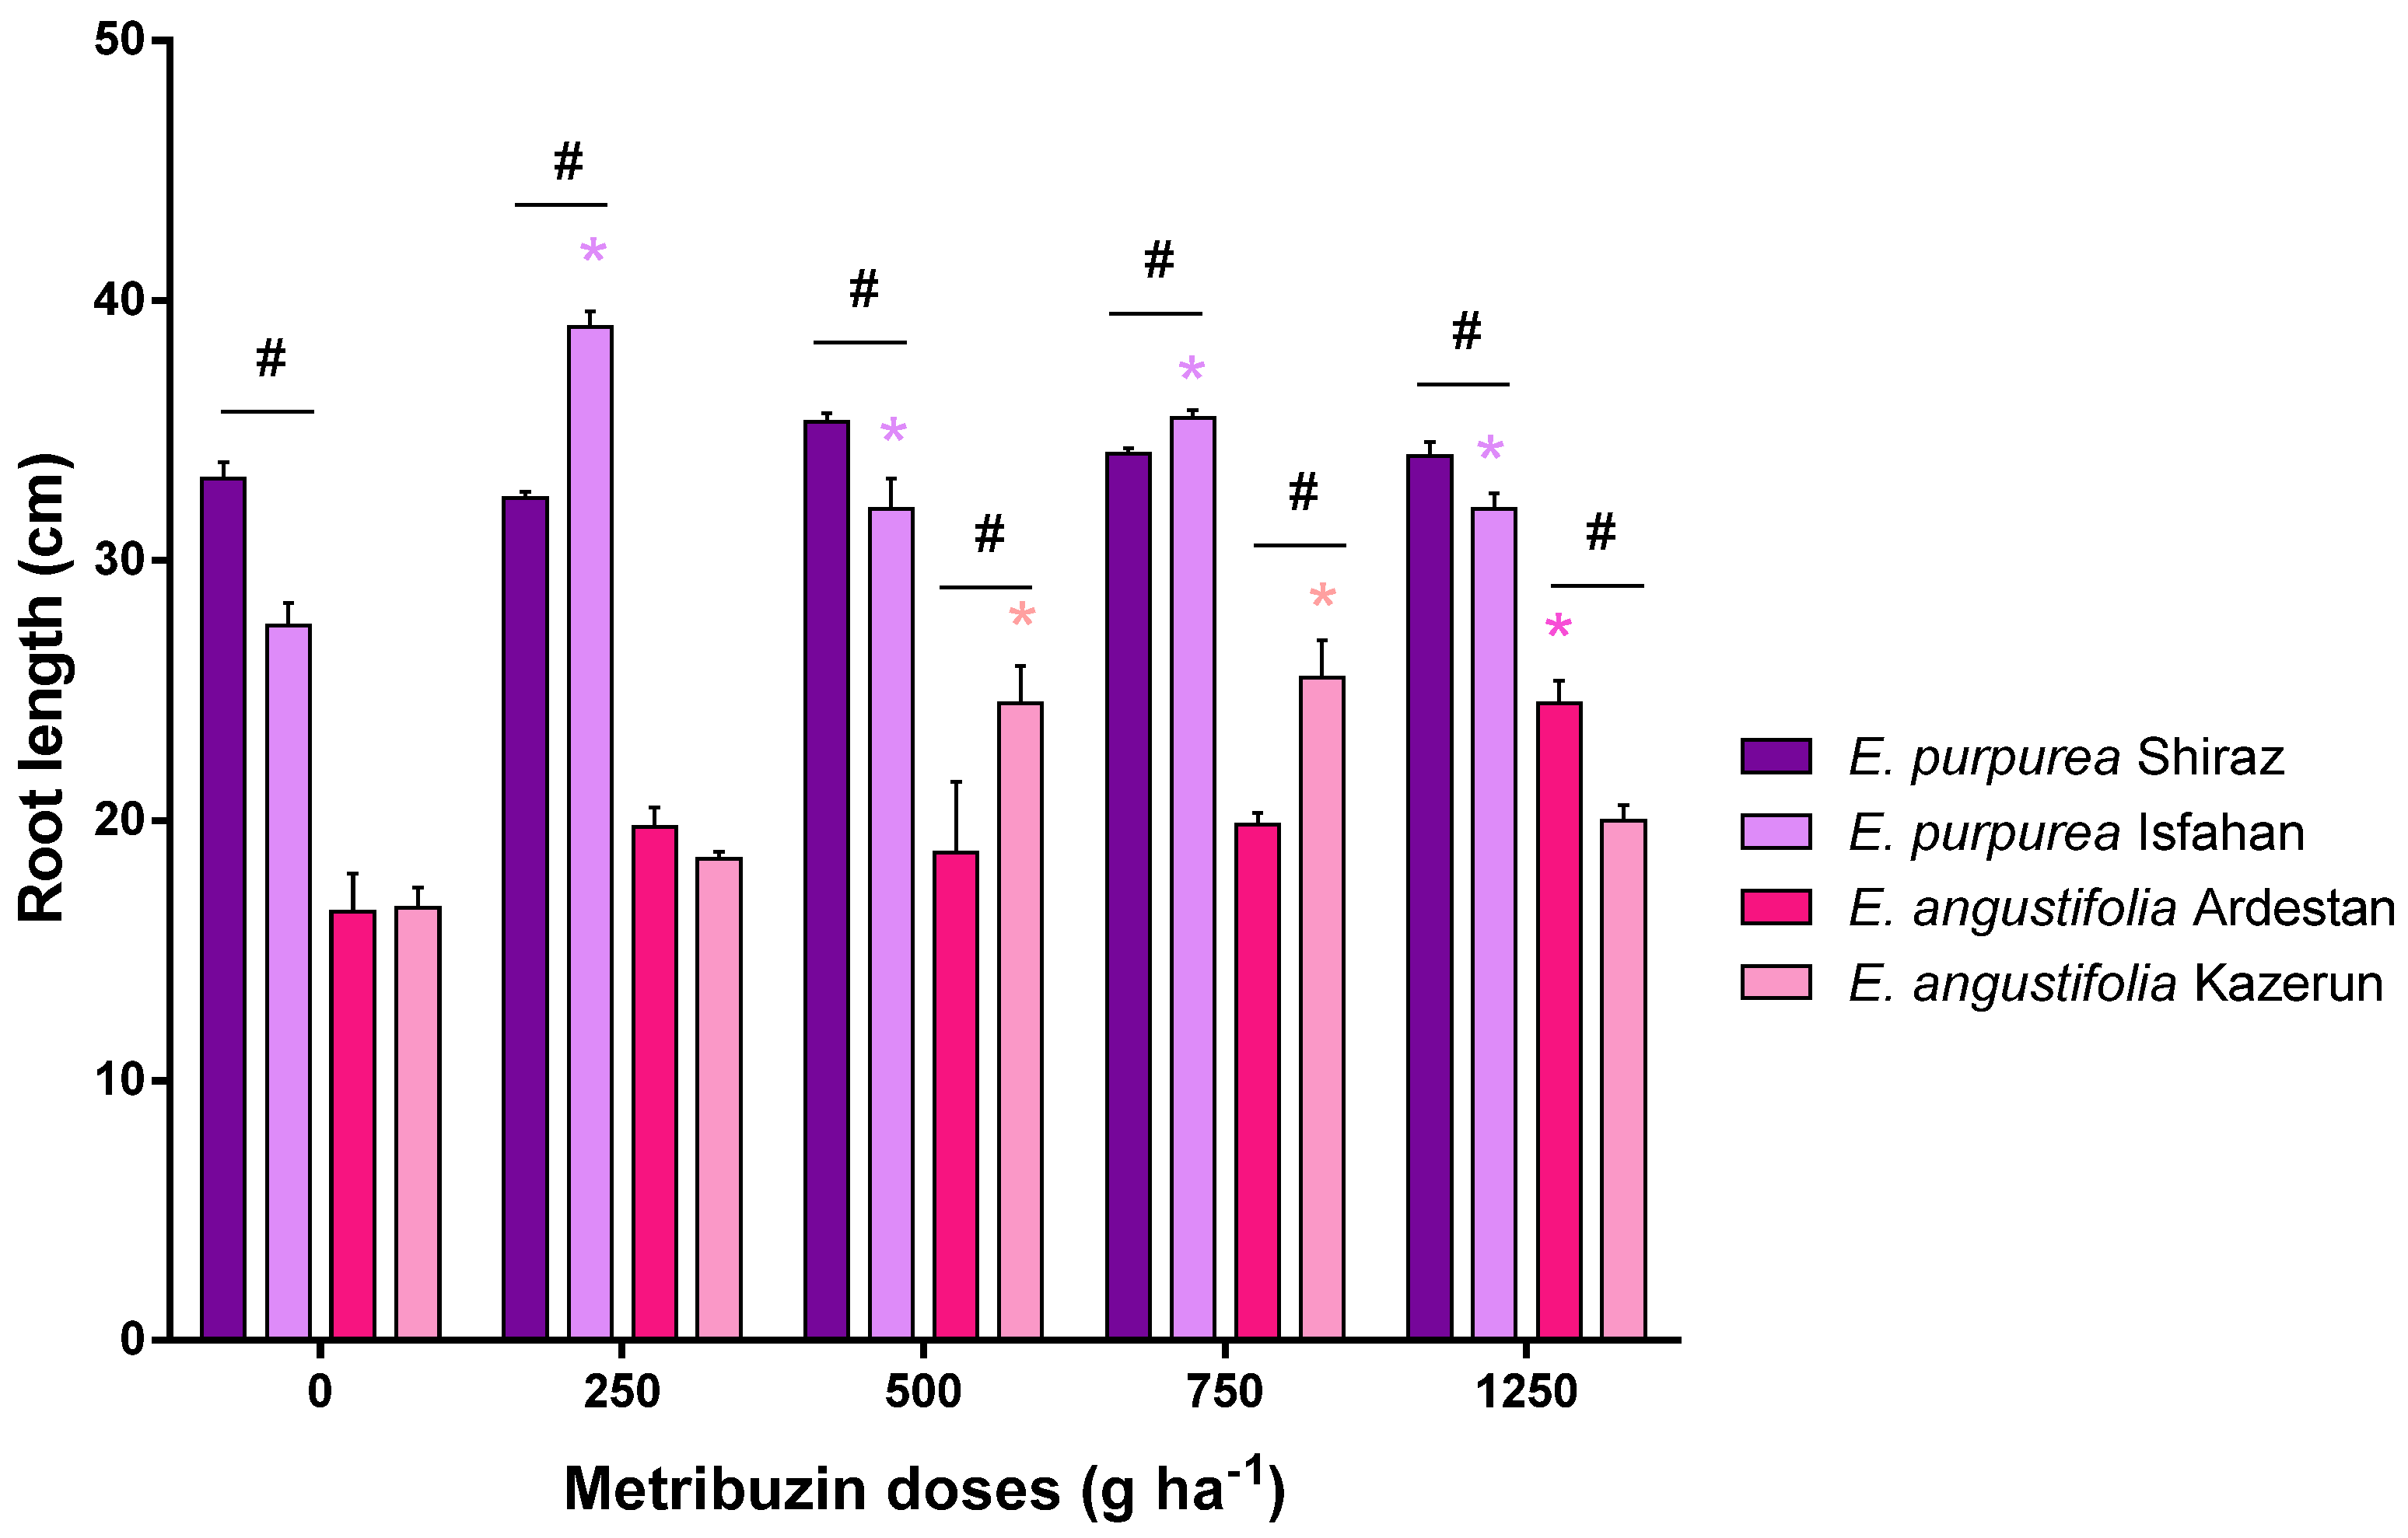
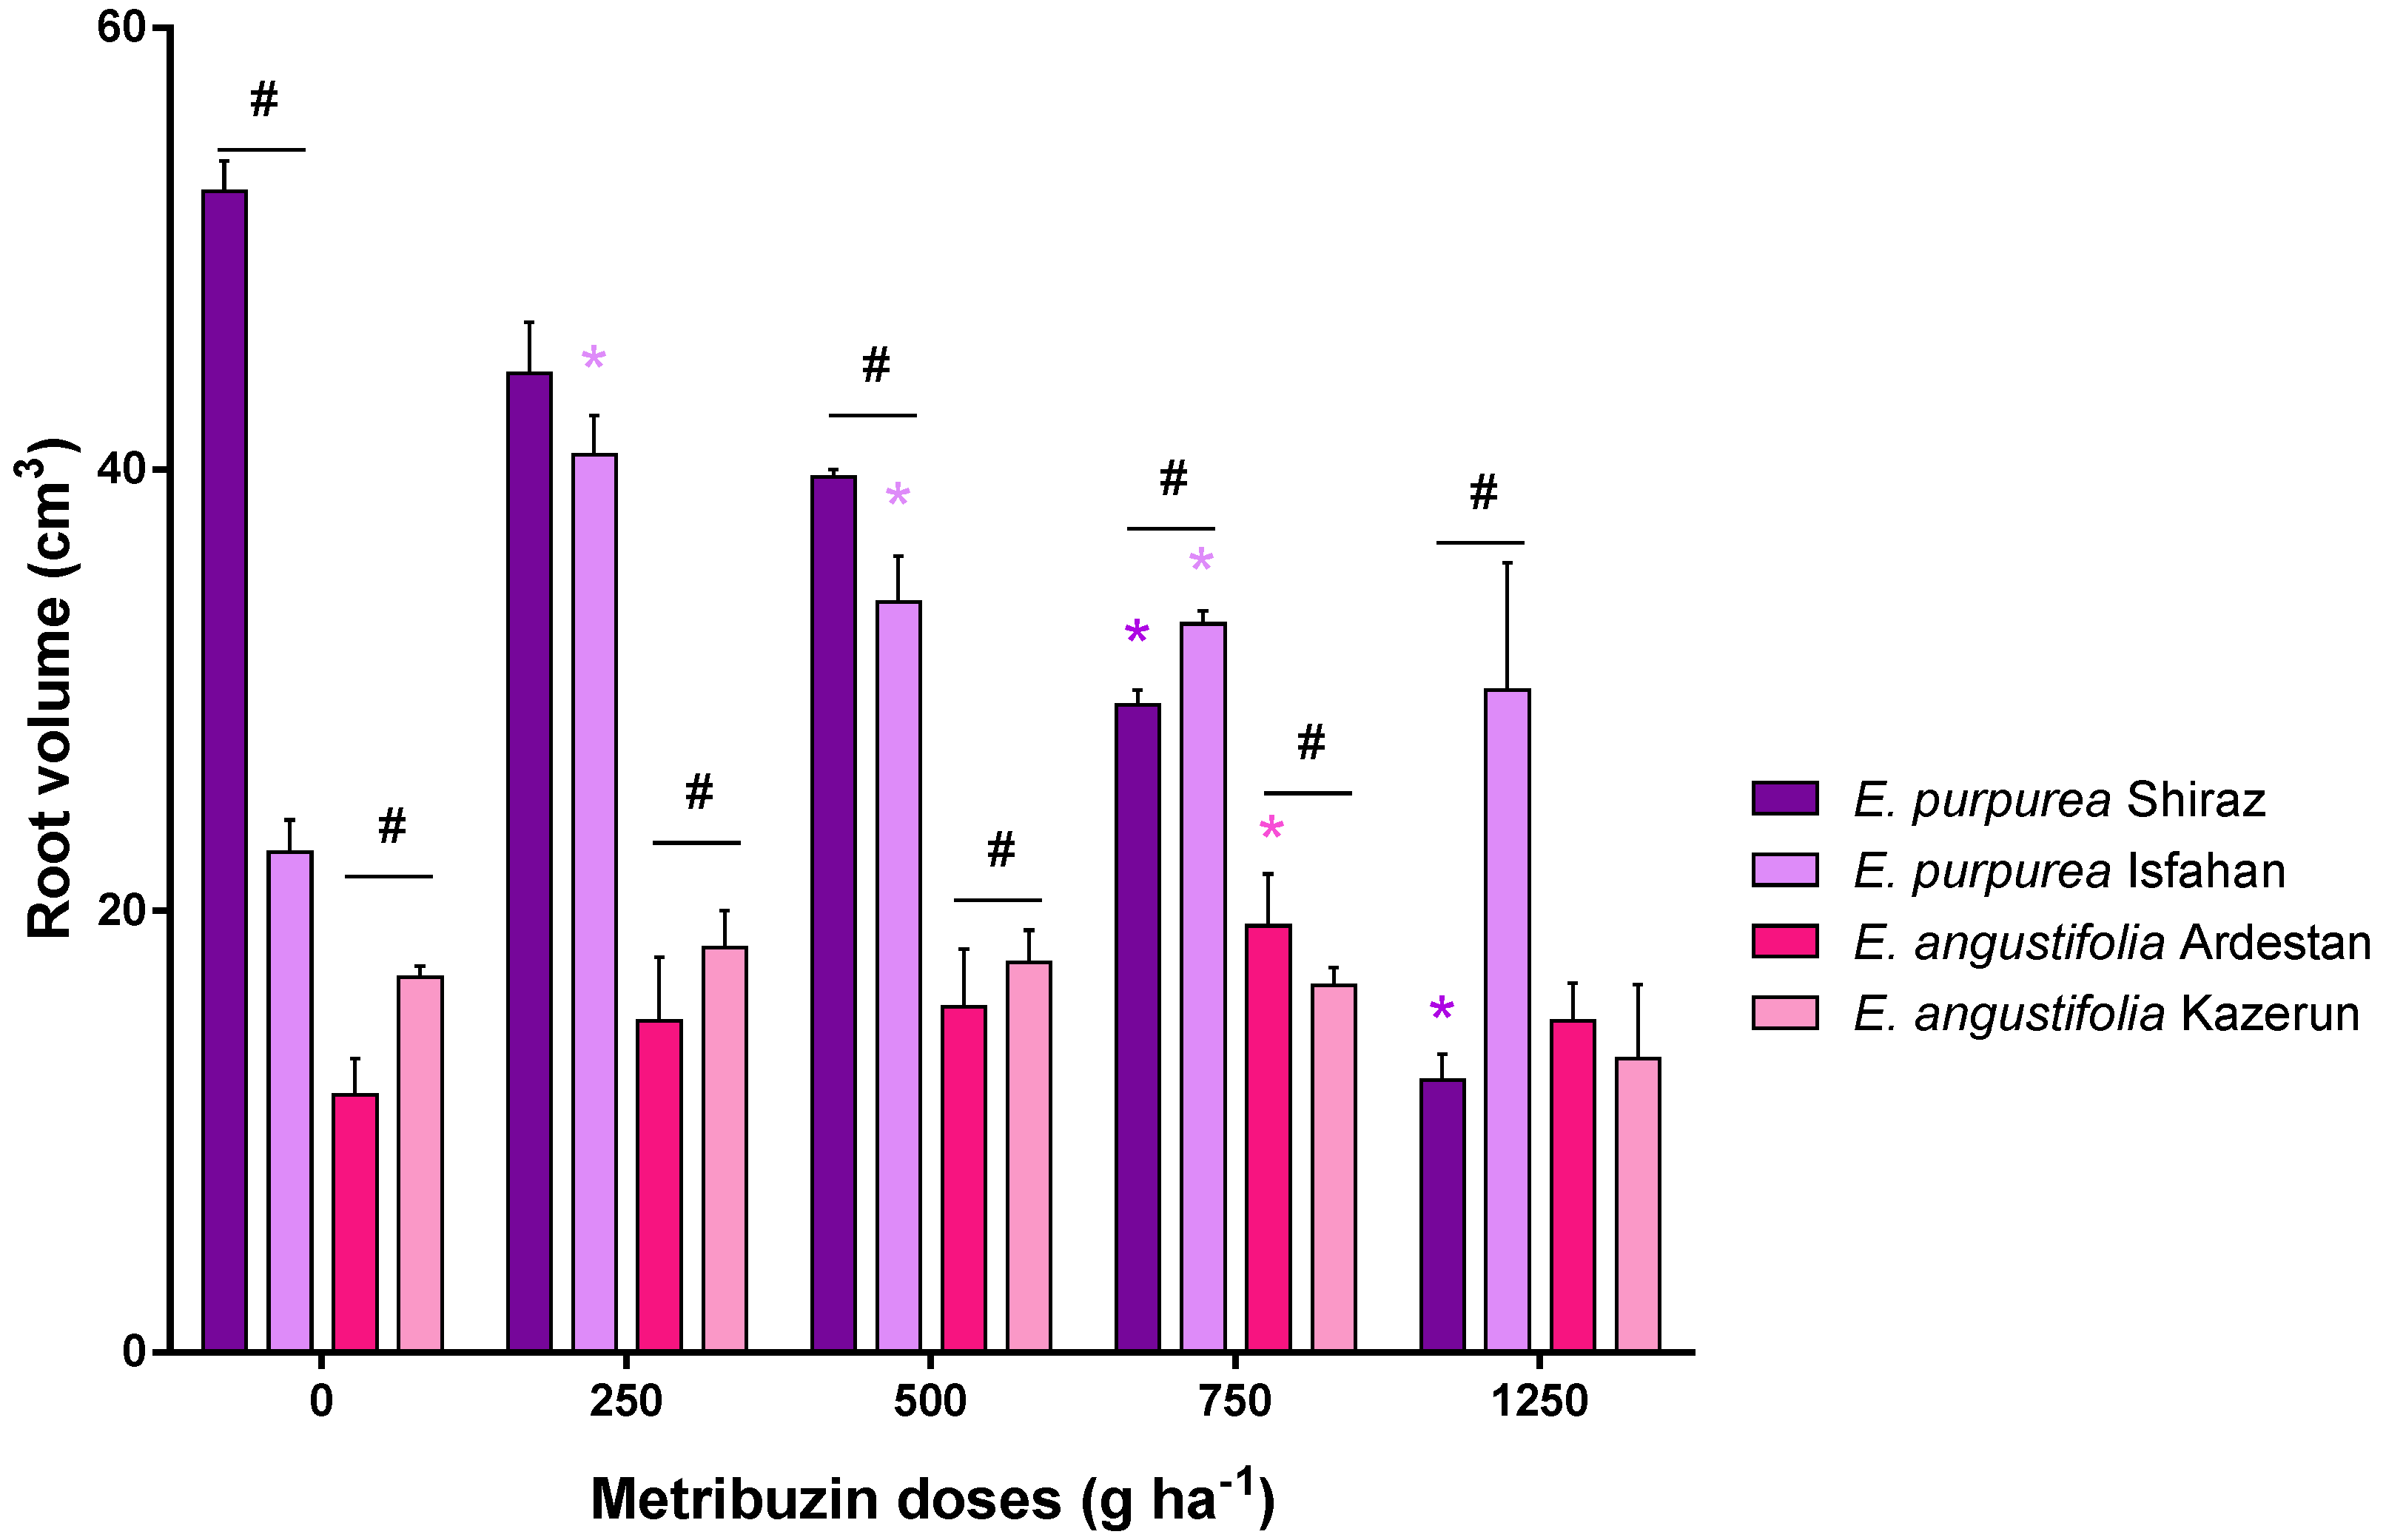
3.2. Root Parameters: Dry Weight, Length, and Volume

The effect of metribuzin was also evaluated at the root level of the studied Echinacea species. In particular, the highest root dry weight was represented by E. purpurea Isfahan compared to the control group (0 g ha−1 metribuzin) (Figure 3). At 1250 g ha−1 metribuzin, all species showed the lowest root dry weight except E. purpurea Isfahan. In E. purpurea Shiraz, E. angustifolia Kazerun and Ardestan, root dry weight significantly decreased with increasing herbicide dose, while in E. purpurea Isfahan, root dry weight increased up to 250 g ha−1 dose after which it decreased with increasing metribuzin dose. Root dry weight was significantly different between the two E. purpurea cultivars in all experimental groups. Finally, the response to herbicide dose was statistically different between the two E. angustifolia plants Kazerun and Ardestan only at 250 g ha−1.
Regarding the root length (Figure 4), in E. purpurea Shiraz no significant differences were found compared to the control group (0 g ha−1 metribuzin). On the contrary, all doses of metribuzin significantly increased root length with the highest value being 250 g ha−1 in E. purpurea Isfahan. On the other hand, E. angustifolia Ardestan showed a significant increase in root length only at 1250 g ha−1 and Kazerun at 500 and 750 g ha−1, compared to the control. Regarding the differences between Echinacea cultivars, Shiraz and Isfahan differed significantly between all experimental groups. On the other hand, Kazerun showed a significant increase in root length compared to Ardestan at 500, 750, and 1250 g ha−1.
Regarding the root volume (Figure 5), metribuzin induces a reduction in root volume in E. purpurea Shiraz starting from 750 to 1250 g ha−1 compared to the control group. On the contrary, E. purpurea Isfahan appears to tolerate metribuzin treatment better. Indeed, a significant increase in root volume is observed at all dosages compared to the untreated control plants. Additionally, metribuzin 250 g ha−1 enhanced the root volume of E. purpurea Isfahan and resulted in twice the root volume (around 40 mm2) as compared to the control group. Application of metribuzin had a similar effect on E. angustifolia Ardestan. Regarding the differences between cultivars of Echinacea, Shiraz and Isfahan differ significantly in all metribuzin-treated groups. Same significant differences were observed between the Ardestan and Kazerun cultivars.

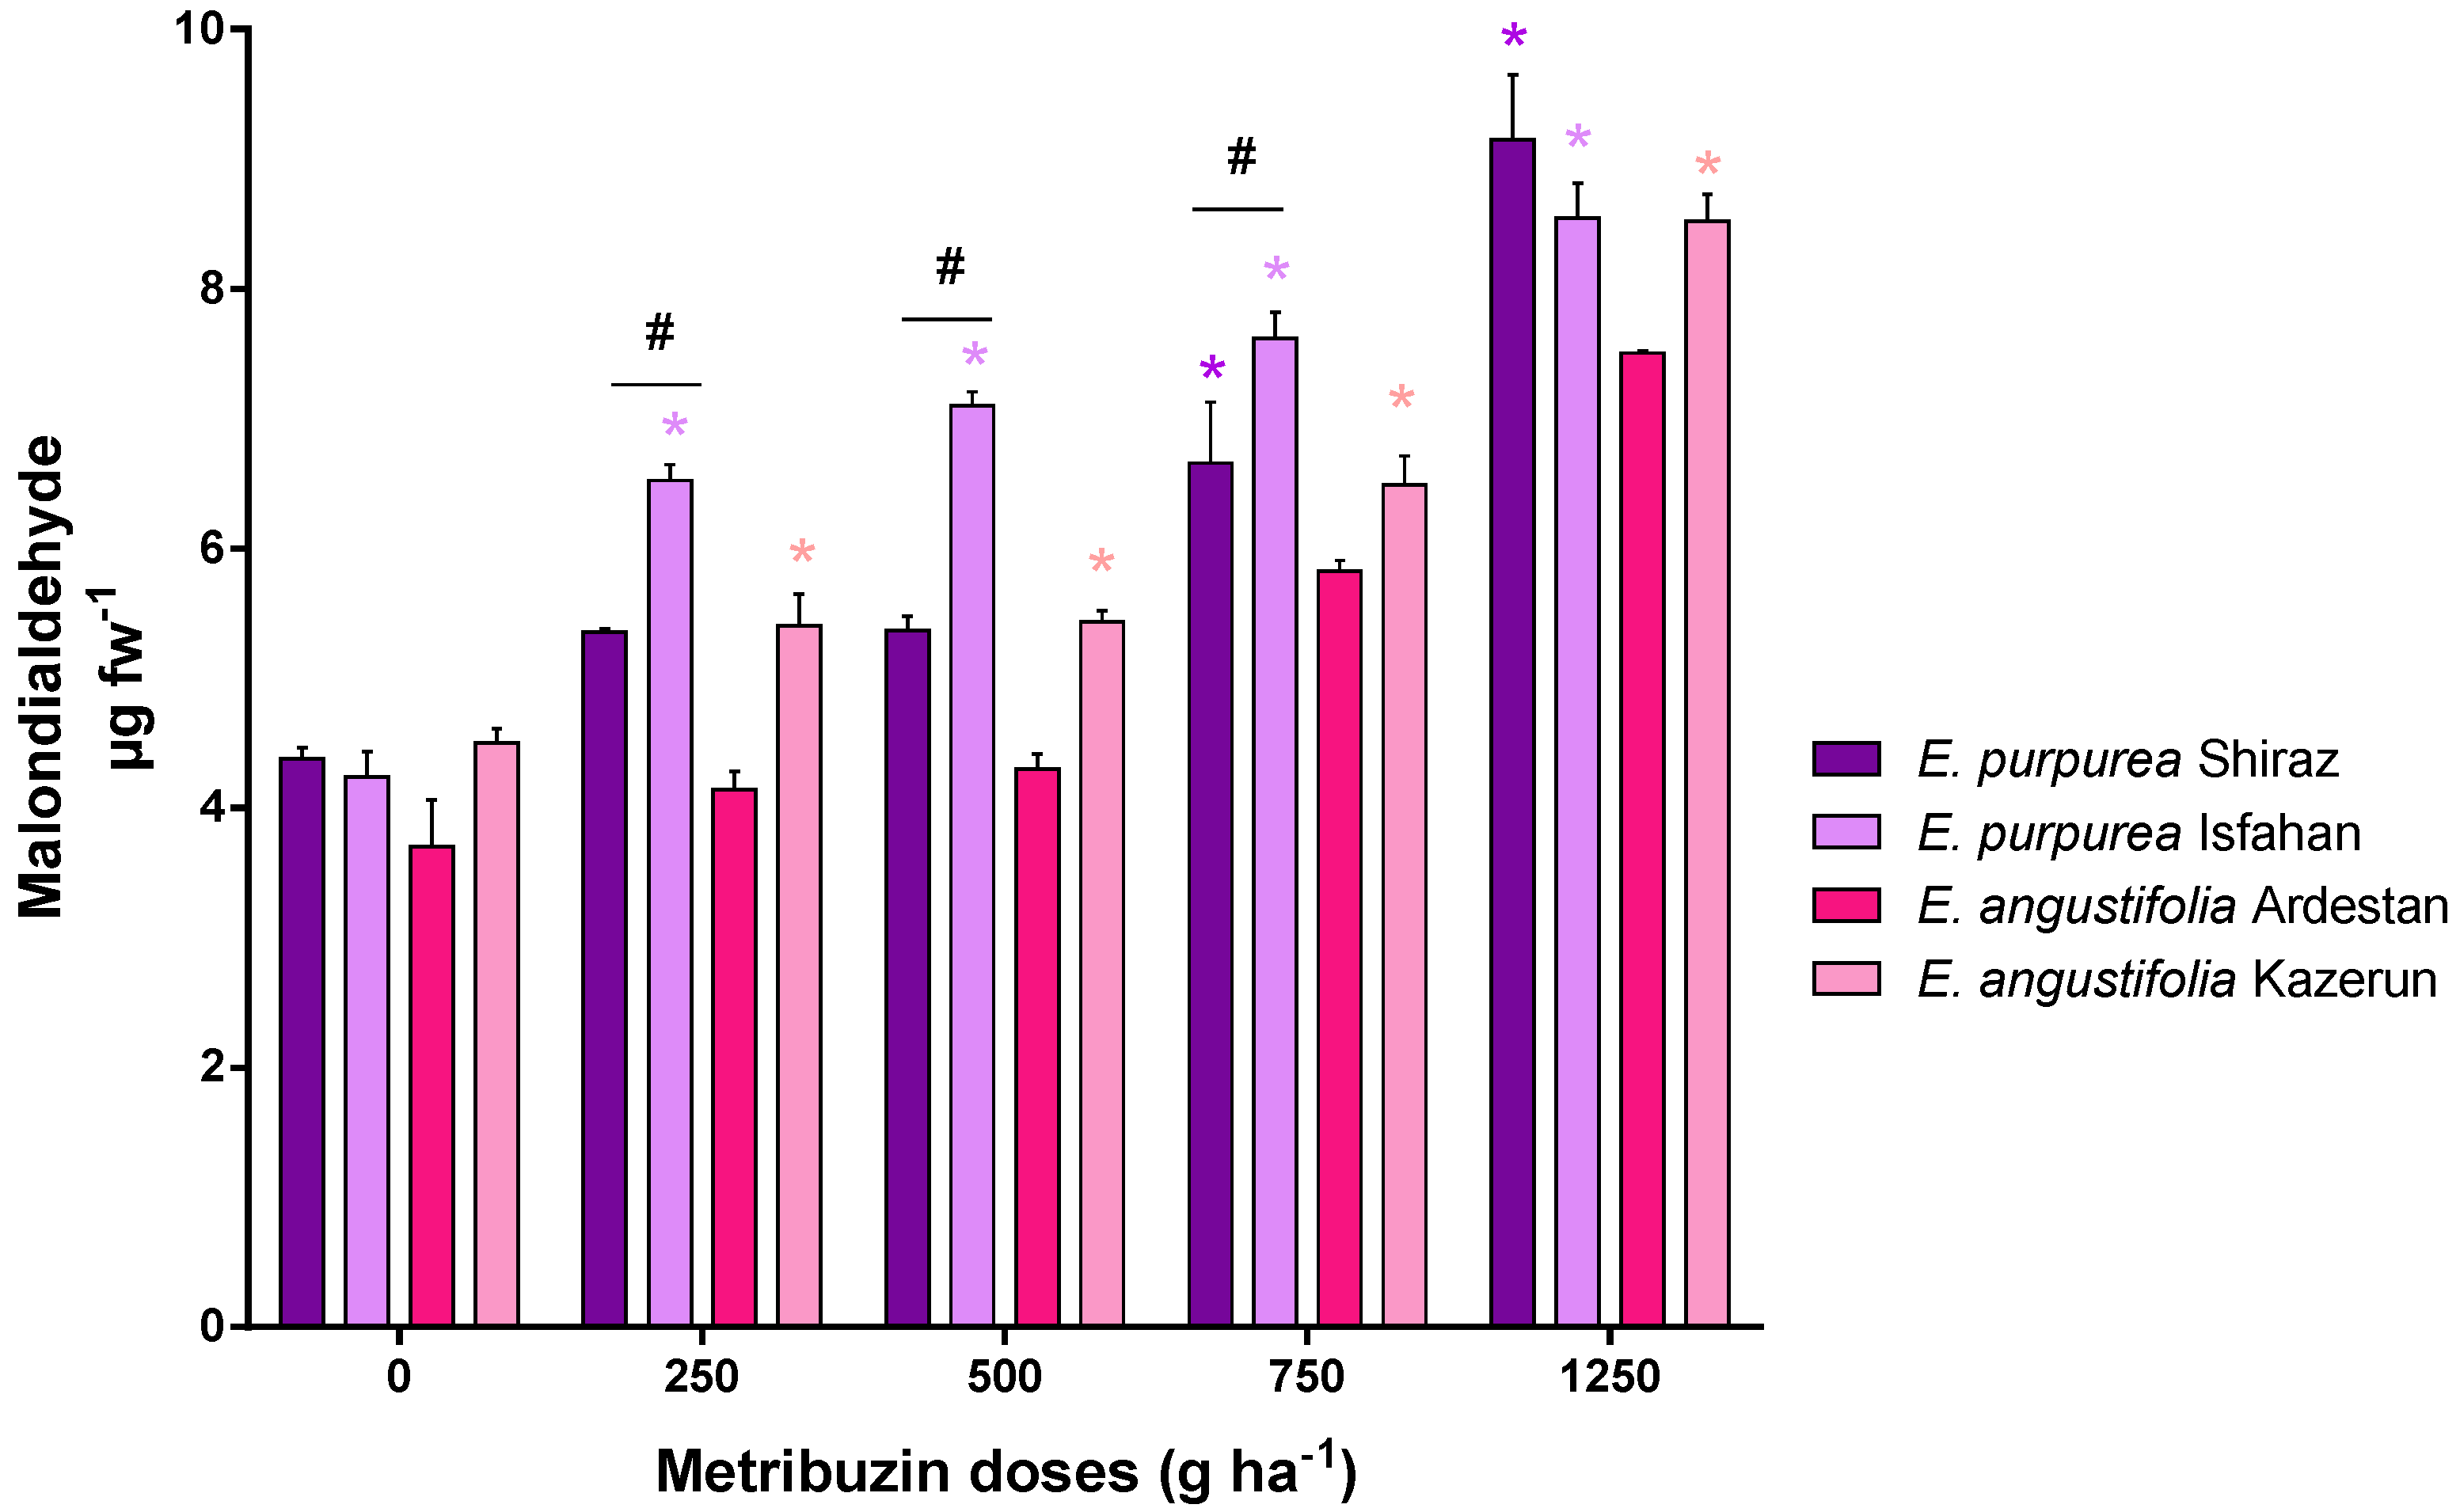
3.3. Oxidative Stress: Malondialdehyde (MDA)

High dosage of metribuzin increased the oxidative stress which led to the increase in malondialdehyde (MDA) as shown in Figure 6. MDA accumulation in leaves increased in response to increasing metribuzin doses and was observed in all Echinacea cultivars. The increase in MDA content seemed species dependent. Indeed, E. purpurea Isfahan and E. angustifolia Kazerun showed a significant increase, compared to control, starting as early as metribuzin 250 g ha1. On the contrary, E. purpurea Shiraz and E. angustifolia Ardestan showed a significant increase in MDA compared to control only starting at metribuzin 750 g ha−1. Furthermore, E. purpurea Isfahan showed significantly higher levels of MDA than E. purpurea Shiraz at metribuzin 250 and 500 g ha−1. Finally, the amount of MDA did not show significant differences between E. angustifolia Kazerun and Ardestan at all doses of metribuzin.

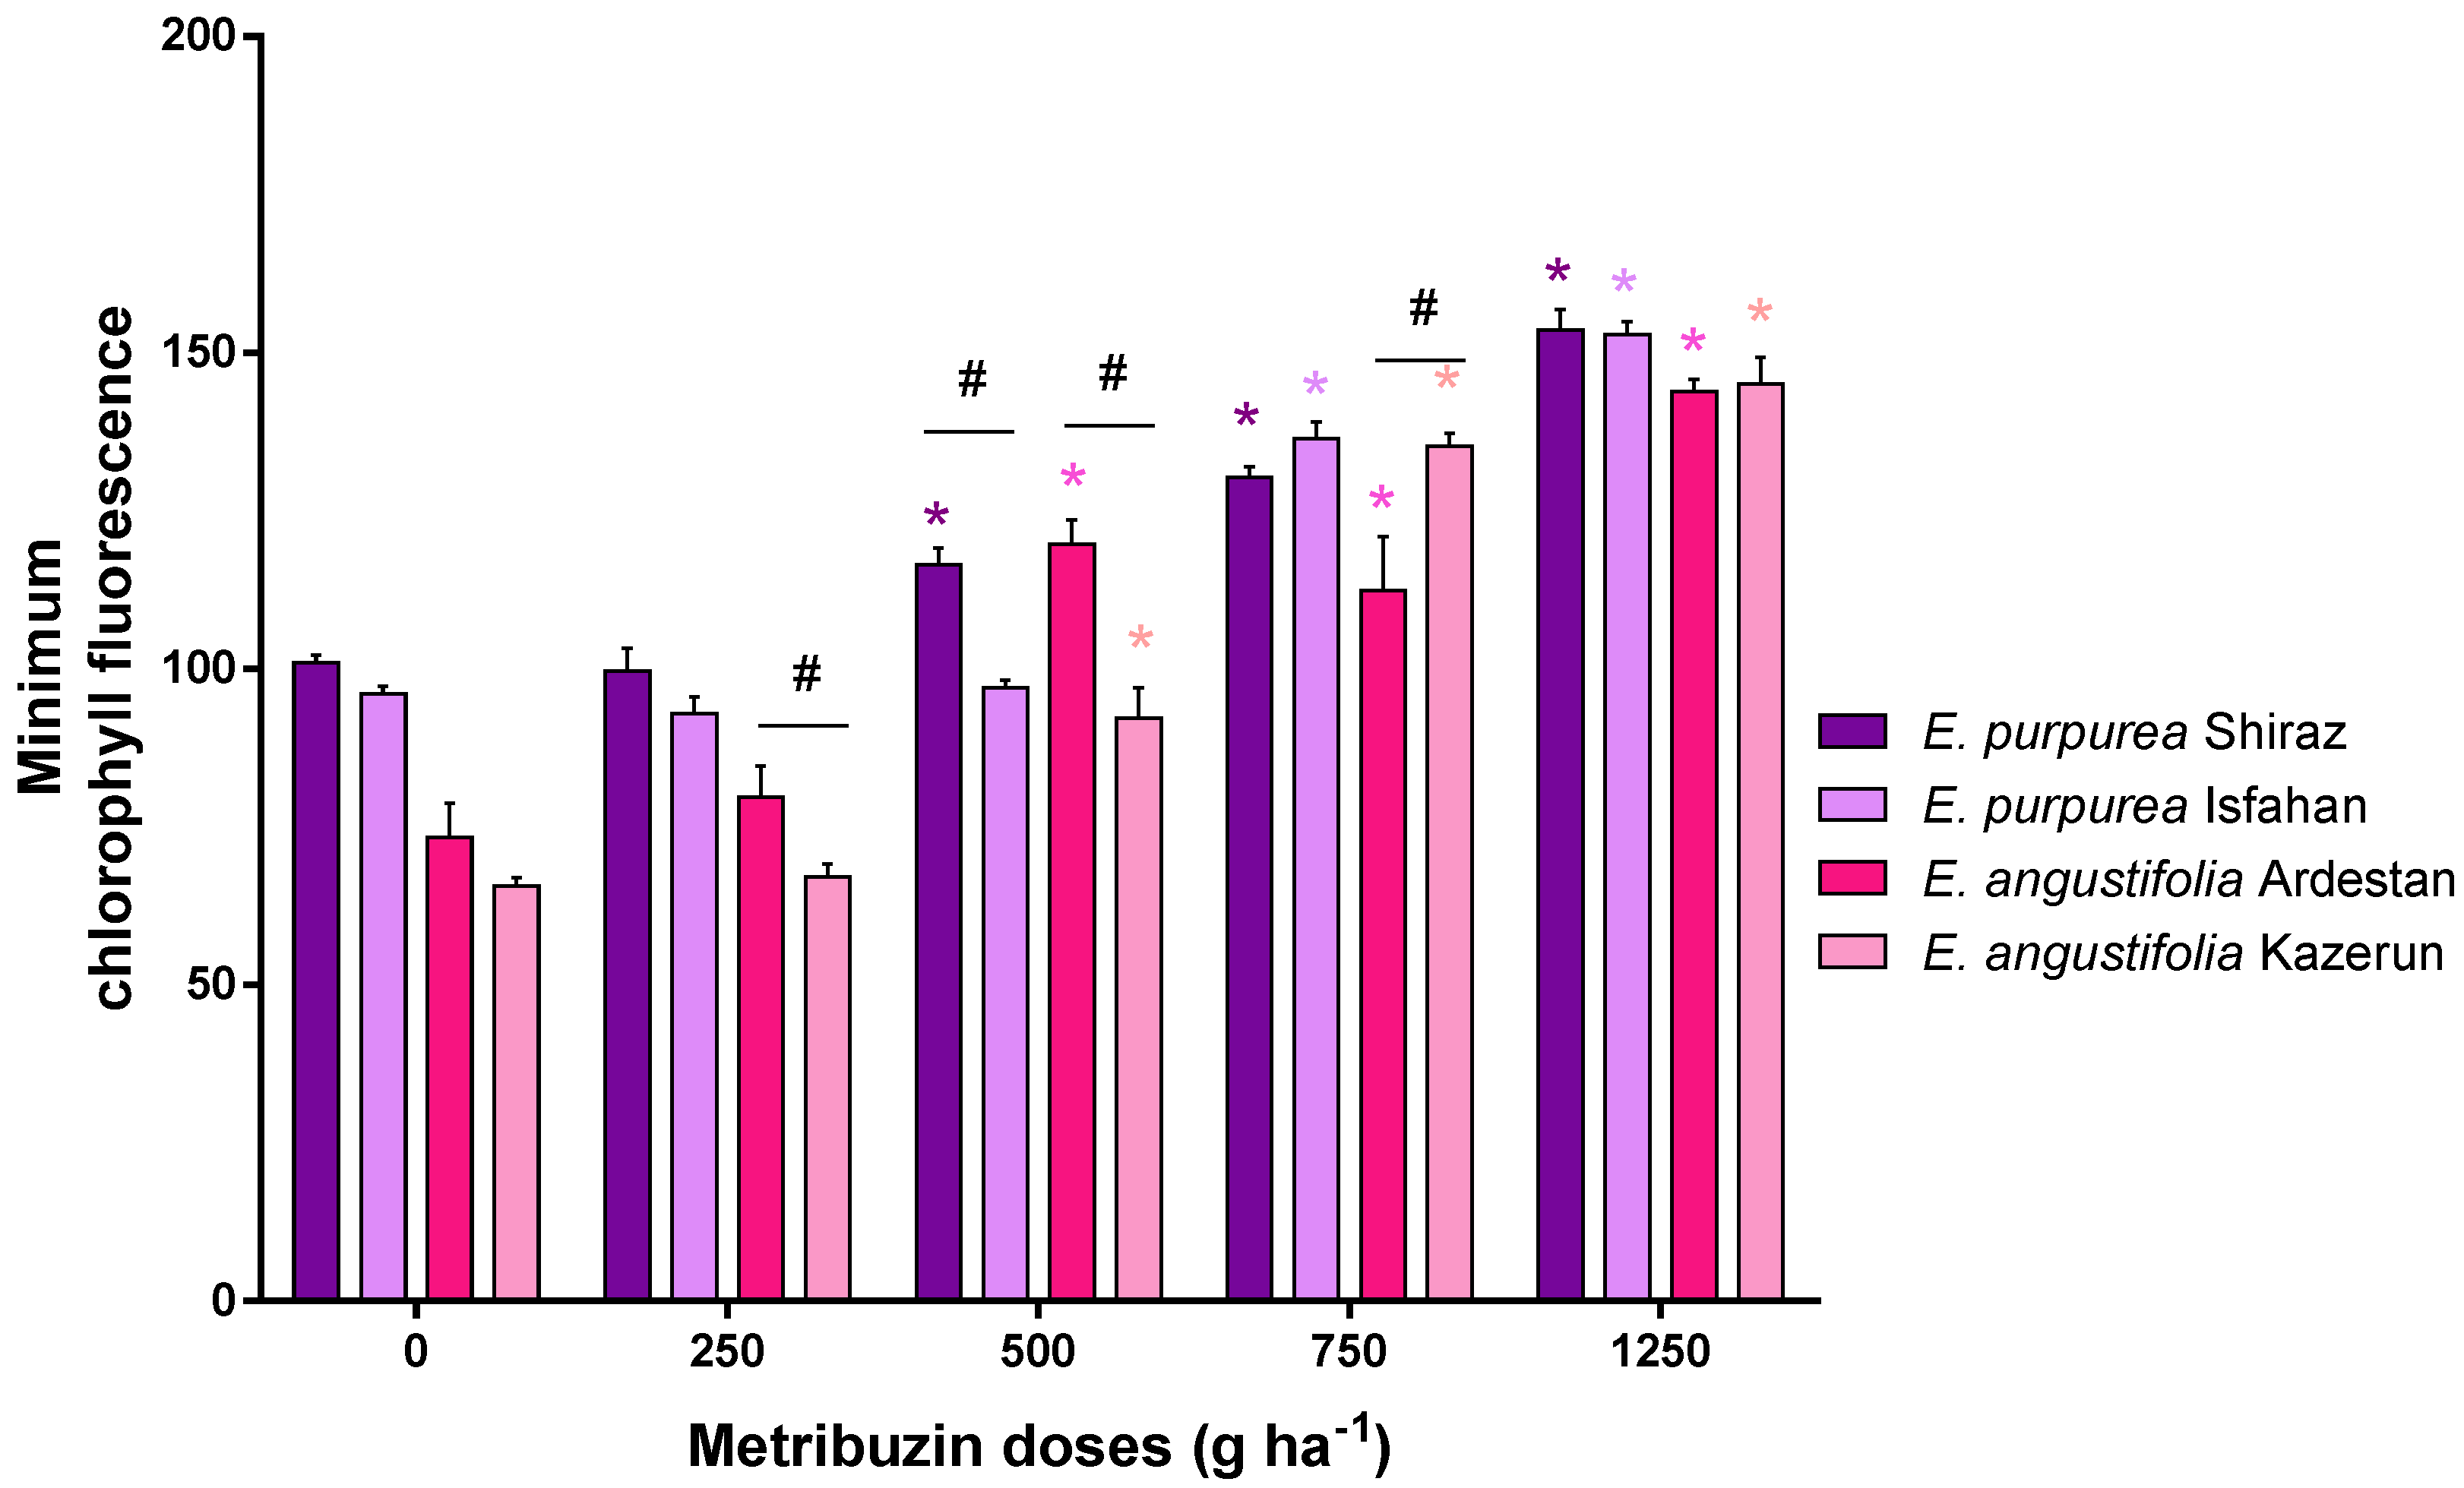
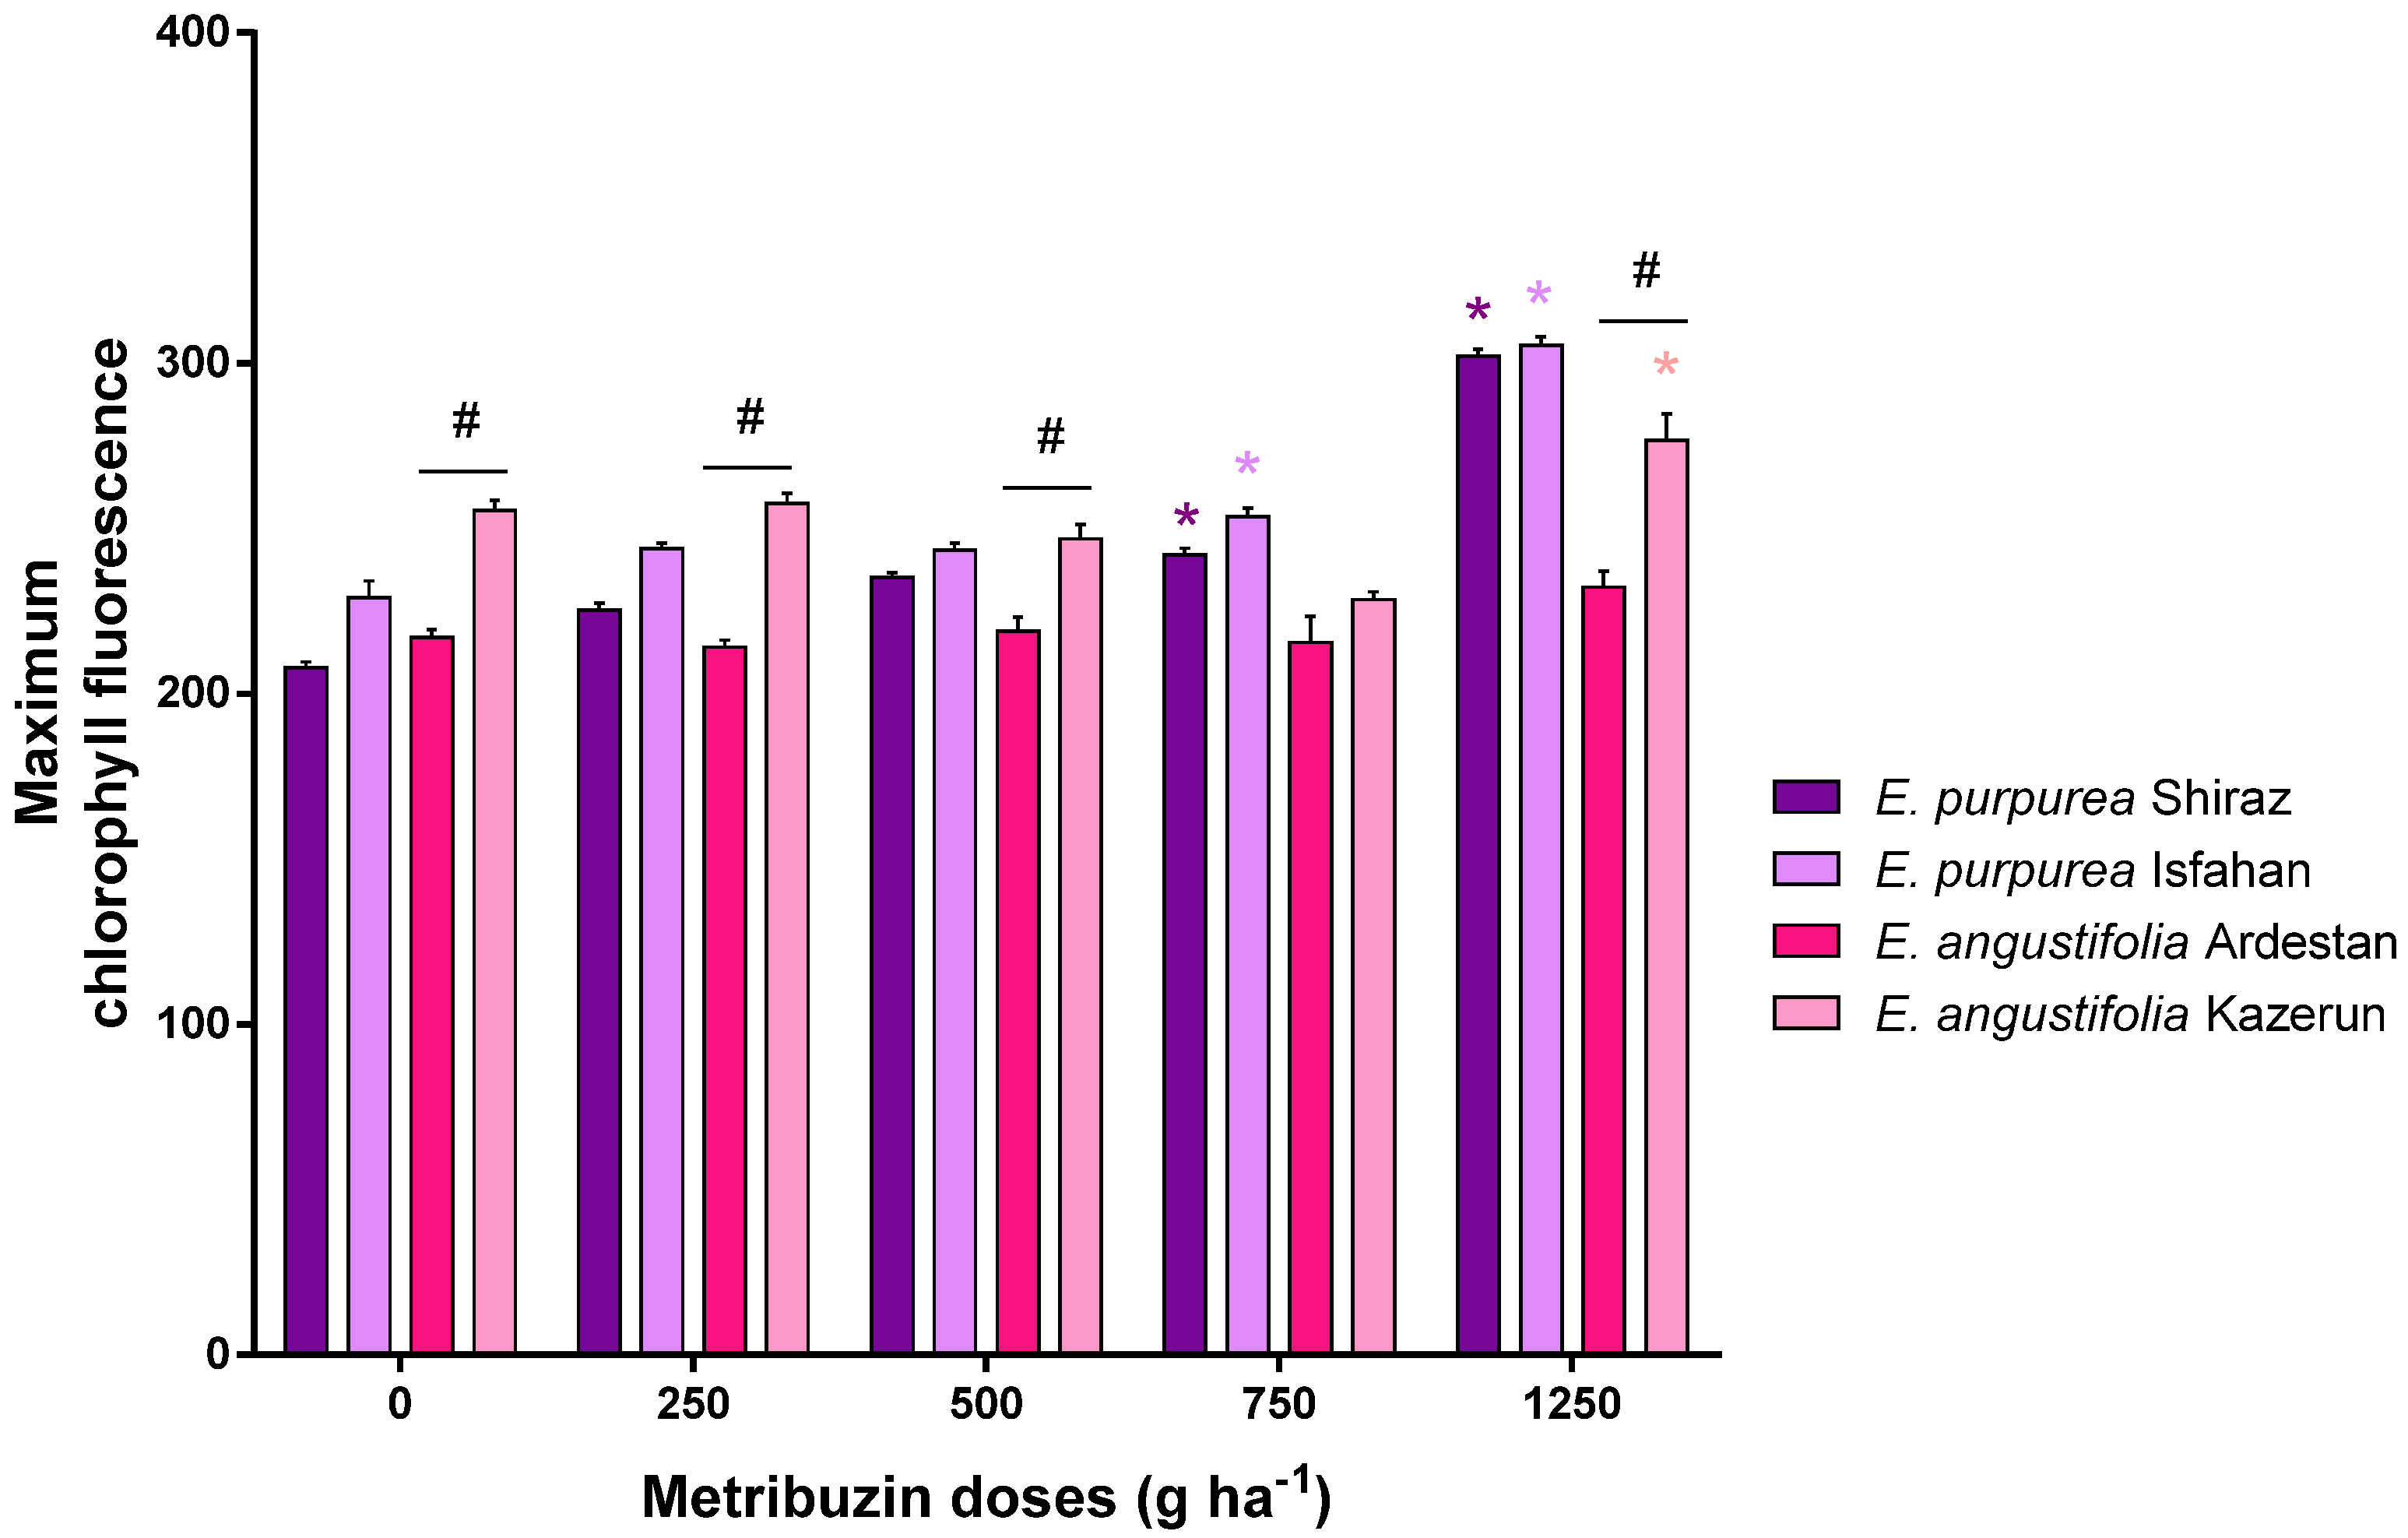
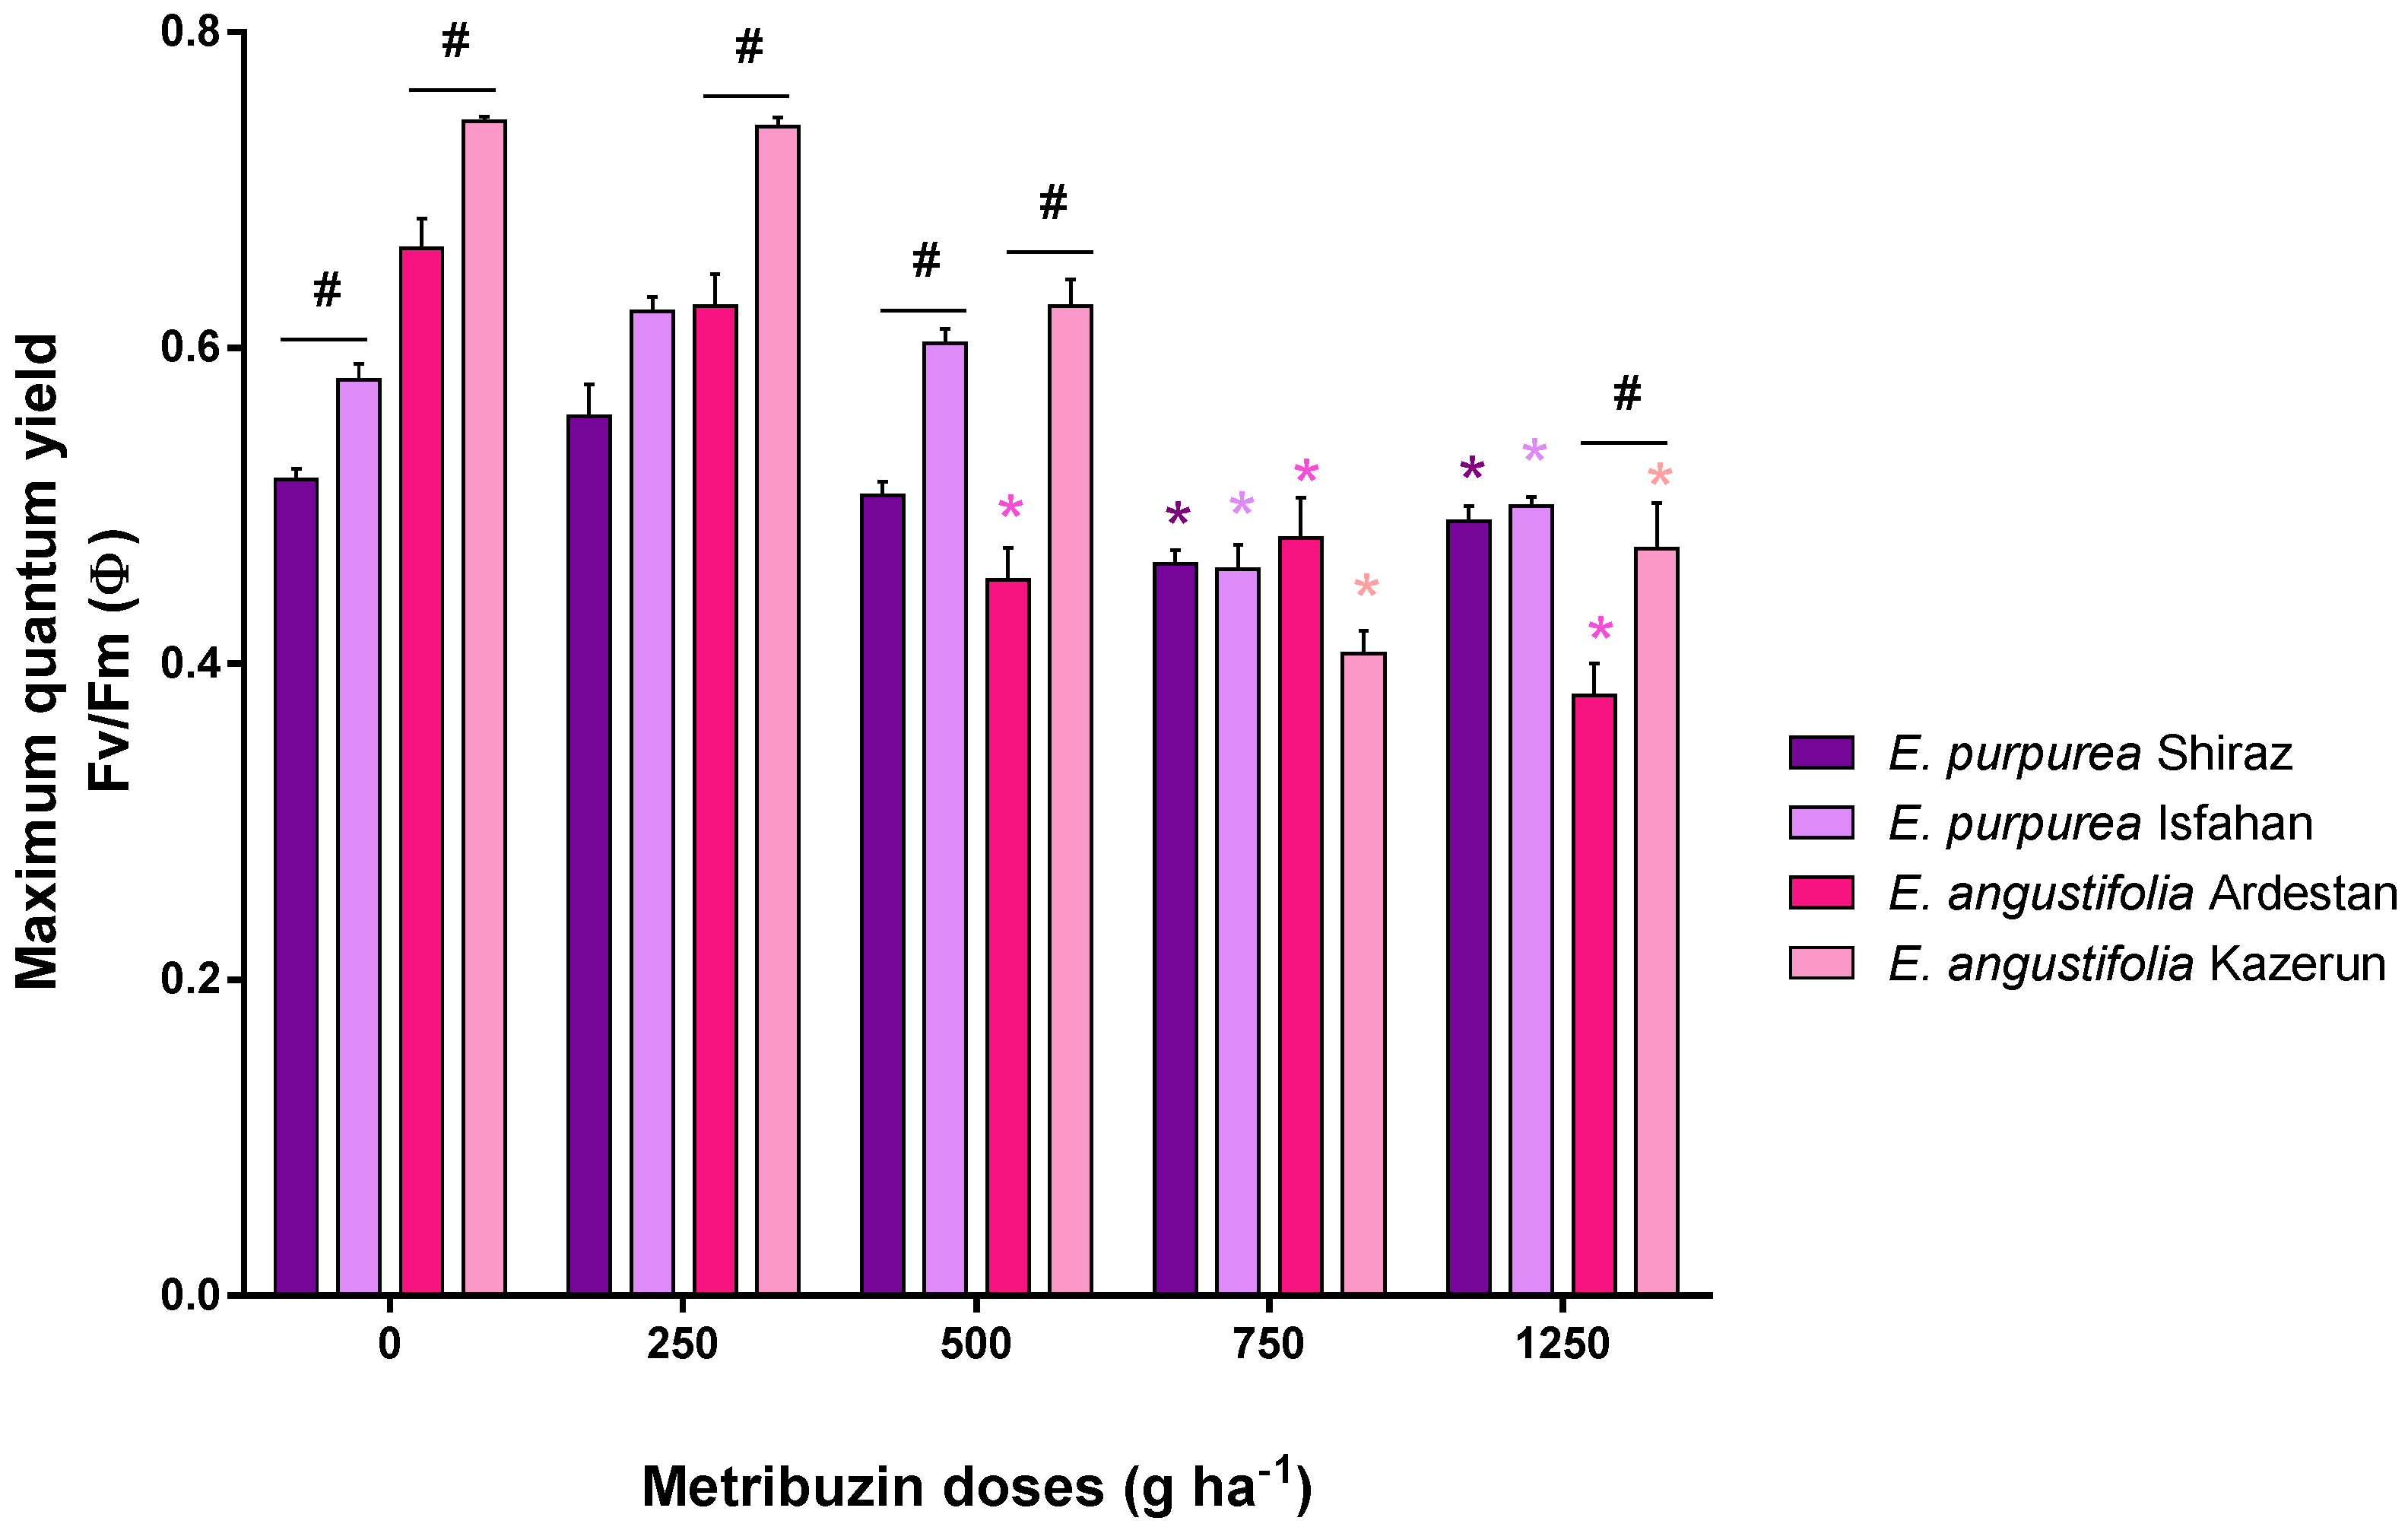
3.4. Chlorophyll Florescence and Maximum Quantum Yield

Minimum chlorophyll fluorescence (Figure 7) in all Echinacea species increased with increasing metribuzin dose. For all species, minimum fluorescence at 250 g ha−1 dose was similar to the untreated control. Regarding the differences between cultivars, Shiraz and Isfahan differed at metribuzin 500 and 750 g ha−1. Furthermore, the minimum chlorophyll fluorescence of E. angustifolia Ardestan and Kazerun differed at metribuzin 750 and 1250 g ha−1.
Similarly, maximum chlorophyll fluorescence (Figure 8) was significantly increased with increasing metribuzin dose in all Echinacea purpurea cultivars. Maximum chlorophyll fluorescence response was statistically relevant between E. purpurea Shiraz and Isfahan in the plants treated with metribuzin 500, 750, and 1250 g ha−1. Furthermore, E. angustifolia Kazerun showed maximum chlorophyll fluorescence values higher than E. angustifolia Ardestan at 1250 g ha−1. No significant differences were observed in the other experimental groups.
As regards photosynthetic efficiency (Figure 9), metribuzin significantly reduced the values of Fv/Fm in the species of E. purpurea studied at dosages of 750 and 1250 g ha−1 compared to the control group. The effects of metribuzin are most noticeable in Echinacea angustifolia. Indeed, both the samples collected in Ardestan and those collected in Kazerun showed a significant reduction starting from 500 g ha−1 compared to the control. Furthermore, significant differences were found between Shiraz and Isfahan in plants receiving metribuzin 750 and 1250 g ha−1. Likewise, significant differences were found between Ardestan and Kazerun at 500 and 750 g ha−1.

3.5. Correlation between Traits

The correlation coefficients between measured traits were calculated and are shown in Table 2. Negative correlations were observed between Fv/Fm and MDA (−0.47), and between Fv/Fm and F0 (−0.88); whereas, significant positive correlations were observed between F0 and MDA (0.766), and between Fm and MDA (0.746). Furthermore, significant positive correlations were found between leaf dry weight and root dry weight (0.854), root length (0.796), root volume (0.740), and leaf area (0.937), in the presence of herbicide (Table 2).

4. Discussion

In this study, the morphological and physiological effects of an increasing dose treatment of metribuzin on cultures of Echinacea purpurea and Echinacea angustifolia were evaluated. Metribuzin is an herbicide that blocks photosystem II and leads to the degeneration of the leaf districts [23]. The toxic action of metribuzin on photosynthesis and leaves is not selectively targeted to weeds but can also affect crops of agronomic value such as Echinacea. However, plants can develop resistance to metribuzin and need higher doses to block photosynthesis [30,31,32,33,34]. Here, we established the metribuzin doses most tolerated by the two Echinacea species. Regarding the foliar apparatus, the high doses (750 and 1250 g ha1) reduced the growth (leaf area and dry weight) of all Echinacea cultivars. This reduction eventually resulted in biomass decrease, thus leading to a decline in biological weight of Echinacea species as observed previously [35]. Although metribuzin appears to be not particularly toxic at dosages of 250 and 500 g ha−1, in all the Echinacea plants studied there was an increase in oxidative stress in terms of increased levels of malondialdehyde. Indeed, accumulation of some metabolites is a strategy to combat oxidative stress within the plant cell [9,10,11,36,37,38,39,40,41,42,43,44,45,46]. Among these metabolites, MDA is the most important and is an indicator of lipid peroxidation [9,39]. Moreover, MDA has been identified in numerous sources as an oxidative stress marker [21,47,48]. However, the biological effects of MDA on plant functions are not yet known [39,49]. In this work, an increased amount of MDA was detected in metribuzin-treated leaves indicating higher lipid peroxidation and oxidative stress as reported previously [50,51]. Therefore, if on the one hand the dosages of metribuzin 250 and 500 g ha−1 did not show particular foliar toxicity in Echinacea species, however, on the other hand, an increase in oxidative stress was observed. The increase in oxidative stress can be associated with the blockade of PSII, which degenerates and increases the release of free radicals [52,53]. For this reason, in order to define the physiological effects on photosynthesis, the minimum and maximum fluorescence of chlorophyll and the photosynthetic yield were evaluated. The data reported here show that treatment with metribuzin greater than 500 g ha−1 induced an alteration in photosynthetic processes. In particular, the PSII of E. angustifolia Ardestan and Kazerun was more sensitive than that of E. purpurea Shiraz and Isfahan to treatment with metribuzin. With regard to photosynthetic efficiency, both E. purpurea and E. angustifolia reduced their photosynthetic yield starting from 250 g ha−1. The effectiveness of many herbicides is based on the alteration of photosynthetic functionality as reported by Wang and colleagues [17]. They reported that mesosulfuron-methyl and iodosulfuron-methyl sodium (herbicides that also act on the photosynthetic yield) were unsafe for wheat and decreased the fresh weight and yield compositions significantly. Reversible inactivation or destruction of PSII reaction center can cause an increase in F0 [54]. Previous studies have shown that herbicides cause damage to the PSII complex, block photosynthetic electron transfer, and reduce Fv/Fm significantly [17]. For example, the use of selective herbicides for photosystems leads to an increase in F0 and a decrease in Fm and Fv/Fm by blocking electron transport to PS II and inactivating the reaction center in wheat crops [17,19]. Similarly, our results indicate that F0 and Fm increased while Fv/Fm decreased in leaves. Moreover, there is a positive correlation between both endpoints, i.e., inhibition of photosynthesis and biomass reduction. This suggests that measuring the quantum yield is a useful tool in predicting adverse herbicide effects on biomass growth. However, both dose–response curves differ from each other, and the quantum yield was more highly sensitive to metribuzin than biomass production.
As for the effects on the root system, metribuzin did not cause significant alterations in terms of length, volume, and dry weight of the roots. These data further confirm the action of metribuzin on the PSII system. Further measures should be carried out to assess the environmental impact of the herbicide. This aspect must be considered above all for the response of other plants and pollinating insects [55,56].
Differences in response to metribuzin treatment were noted in this manuscript between collection sites of the same Echinacea species. These differences may be due to the effect of metribuzin on secondary metabolism [57]. To date, there are no studies exploring the effect of metribuzin on the synthesis and degradation pathways of secondary metabolites of Echinacea. However, the application of metribuzin did not alter the phytochemical profile of Silybum marianum [58]. In addition, Salvia officinalis increases the content of essential oils after weed reduction due to treatment with herbicides (such as metribuzin) [59]. Although secondary metabolite levels have not been evaluated in this manuscript, we cannot exclude a modulatory action of metribuzin in the secondary metabolism of both species of Echinacea. Further studies will be needed in the future to identify and quantify the main classes of secondary metabolites of the different cultivars of Echinacea.

5. Conclusions

The present study clearly indicated that photosynthesis and growth of Echinacea species are affected by metribuzin doses. Differences in sensitivity could be attributed to differences in uptake, translocation, metabolism, and/or dilution within the plant. Unfortunately, only a few of these factors have been thoroughly investigated. However, doses of metribuzin that did not significantly alter the physiology of the two Echinacea species ranged from 250 to 500 g ha−1 for the parameters studied. Doses higher than 500 g ha−1 of metribuzin can alter the foliar morphology, root volume, and PSII. Further studies will be needed to determine the molecular signaling involved in tolerance mechanisms to metribuzin treatment and to establish which weed species are sensitive to dosages below 500 g ha−1. It would be interesting to study the possibility of using metribuzin in combination with other herbicides.

Author Contributions

Conceptualization, H.K., M.R., T.-M.T. and A.M.; methodology, H.K., M.R. and T.-M.T.; formal analysis, H.K., M.R. and T.-M.T.; writing—original draft preparation, H.K., M.R. and T.-M.T.; writing—review and editing, A.M.; funding acquisition, A.M. All authors have read and agreed to the published version of the manuscript.

Funding

This research received no external funding.

Institutional Review Board Statement

Not applicable.

Informed Consent Statement

Not applicable.

Data Availability Statement

The data presented in this study are available on request from the corresponding author.

Acknowledgments

The authors gratefully acknowledge financial support from Isfahan University of Technology and scientific support from University of Brescia.

Conflicts of Interest

The authors declare no conflict of interest.

References

  1. Binns, S.E.; Livesey, J.F.; Arnason, J.T.; Baum, B.R. Phytochemical Variation in Echinacea from Roots and Flowerheads of Wild and Cultivated Populations. J. Agric. Food Chem. 2002, 50, 3673–3687. [Google Scholar] [CrossRef]
  2. Mistríková, I.; Vaverková, Š. Morphology and anatomy of Echinacea purpurea, E. angustifolia, E. pallida and Parthenium integrifolium. Biologia 2007, 62, 2–5. [Google Scholar] [CrossRef] [Green Version]
  3. Haidu, D.; Parkanyi, D.; Moldovan, R.I.; Savii, C.; Pinzaru, I.; Dehelean, C.; Kurunczi, L. Elemental Characterization of Romanian Crop Medicinal Plants by Neutron Activation Analysis. J. Anal. Methods Chem. 2017, 2017. [Google Scholar] [CrossRef] [PubMed]
  4. Sloley, B.D.; Urichuk, L.J.; Tywin, C.; Coutts, R.T.; Pang, P.K.T.; Shan, J.J. Comparison of chemical components and antioxidant capacity of different Echinacea species. J. Pharm. Pharmacol. 2001, 53, 849–857. [Google Scholar] [CrossRef] [PubMed]
  5. Loddo, D.; McElroy, J.S.; Giannini, V. Problems and perspectives in weed management. Ital. J. Agron. 2021, 16, 1854. [Google Scholar] [CrossRef]
  6. Chen, C.L.; Zhang, S.C.; Sung, J.M. Biomass and Caffeoyl Phenols Production Ofechinacea purpurea grown in Taiwan. Exp. Agric. 2008, 44, 497–507. [Google Scholar] [CrossRef] [Green Version]
  7. Kristiansen, P.; Sindel, B.M.; Jessop, R.S. Weed management in organic echinacea (Echinacea purpurea) and lettuce (Lactuca sativa) production. Renew. Agric. Food Syst. 2008, 23, 120–135. [Google Scholar] [CrossRef] [Green Version]
  8. Aghajanlou, F.; Mirdavoudi, H.; Shojaee, M.; Mac Sweeney, E.; Mastinu, A.; Moradi, P. Rangeland Management and Ecological Adaptation Analysis Model for Astragalus curvirostris Boiss. Horticulturae 2021, 7, 67. [Google Scholar] [CrossRef]
  9. Karimmojeni, H.; Rahimian, H.; Alizadeh, H.; Yousefi, A.R.; Gonzalez-Andujar, J.L.; Mac Sweeney, E.; Mastinu, A. Competitive Ability Effects of Datura stramonium L. and Xanthium strumarium L. on the Development of Maize (Zea mays) Seeds. Plants 2021, 10, 1922. [Google Scholar] [CrossRef]
  10. Kumar, A.; Memo, M.; Mastinu, A. Plant behaviour: An evolutionary response to the environment? Plant Biol. 2020, 22, 961–970. [Google Scholar] [CrossRef]
  11. Rad, S.V.; Valadabadi, S.A.R.; Pouryousef, M.; Saifzadeh, S.; Zakrin, H.R.; Mastinu, A. Quantitative and Qualitative Evaluation of Sorghum bicolor L. under Intercropping with Legumes and Different Weed Control Methods. Horticulturae 2020, 6, 78. [Google Scholar] [CrossRef]
  12. Biareh, V.; Shekari, F.; Sayfzadeh, S.; Zakerin, H.; Hadidi, E.; Beltrão, J.G.T.; Mastinu, A. Physiological and Qualitative Response of Cucurbita pepo L. to Salicylic Acid under Controlled Water Stress Conditions. Horticulturae 2022, 8, 79. [Google Scholar] [CrossRef]
  13. Gharibvandi, A.; Karimmojeni, H.; Ehsanzadeh, P.; Maleki, M.R.; Mastinu, A. Weed management by allelopathic activity of Foeniculum vulgare essential oil. Plant Biosyst. 2022, 1–15. [Google Scholar] [CrossRef]
  14. Qasem, J.R.; Foy, C.L. Selective Weed Control in Syrian Marjoram (Origanum syriacum) with Oxadiazon and Oxyfluorfen Herbicides. Weed Technol. 2017, 20, 670–676. [Google Scholar] [CrossRef]
  15. Forcella, F.; Papiernik, S.K.; Gesch, R.W. Postemergence Herbicides for Calendula. Weed Technol. 2017, 26, 566–569. [Google Scholar] [CrossRef] [Green Version]
  16. Yousefi, A.R.; Rahimi, M.R. Integration of soil-applied herbicides at the reduced rates with physical control for weed management in fennel (Foeniculum vulgare Mill.). Crop Prot. 2014, 63, 107–112. [Google Scholar] [CrossRef]
  17. Wang, X. Effect of quizalofop on protective enzymes and photosynthesis in Radix isatidis. J. Med. Plants Res. 2012, 6, 1770–1776. [Google Scholar] [CrossRef]
  18. Zhao, R.; Guo, P.Y.; Yuan, X.Y.; Wang, J.Y.; Han, M.Q. Effect of paraquat on the antioxidative enzyme activities and lipid peroxidation in opium poppy (Papaver somniferum L.). J. Plant Dis. Prot. 2016, 117, 55–59. [Google Scholar] [CrossRef]
  19. Kong, L.; Sun, M.; Xie, Y.; Wang, F.; Zhao, Z. Photochemical and antioxidative responses of the glume and flag leaf to seasonal senescence in wheat. Front. Plant Sci. 2015, 6, 358. [Google Scholar] [CrossRef] [Green Version]
  20. Ahsan, N.; Lee, D.-G.; Lee, K.-W.; Alam, I.; Lee, S.-H.; Bahk, J.D.; Lee, B.-H. Glyphosate-induced oxidative stress in rice leaves revealed by proteomic approach. Plant Physiol. Biochem. 2008, 46, 1062–1070. [Google Scholar] [CrossRef]
  21. Harfouche, R.; Basu, S.; Soni, S.; Hentschel, D.M.; Mashelkar, R.A.; Sengupta, S. Nanoparticle-mediated targeting of phosphatidylinositol-3-kinase signaling inhibits angiogenesis. Angiogenesis 2009, 12, 325–338. [Google Scholar] [CrossRef] [PubMed]
  22. Hashem, A.; Collins, R.M.; Bowran, D.G. Efficacy of Interrow Weed Control Techniques in Wide Row Narrow-Leaf Lupin. Weed Technol. 2017, 25, 135–140. [Google Scholar] [CrossRef]
  23. Brown, H.M. Mode of action, crop selectivity, and soil relations of the sulfonylurea herbicides. Pestic. Sci. 1990, 29, 263–281. [Google Scholar] [CrossRef]
  24. Kostopoulou, S.; Ntatsi, G.; Arapis, G.; Aliferis, K.A. Assessment of the effects of metribuzin, glyphosate, and their mixtures on the metabolism of the model plant Lemna minor L. applying metabolomics. Chemosphere 2020, 239, 124582. [Google Scholar] [CrossRef] [PubMed]
  25. Ganugi, P.; Miras-Moreno, B.; Garcia-Perez, P.; Lucini, L.; Trevisan, M. Concealed metabolic reprogramming induced by different herbicides in tomato. Plant Sci. 2021, 303, 110727. [Google Scholar] [CrossRef]
  26. Si, P.; Sweetingham, M.W.; Buirchell, B.J.; Bowran, D.G.; Piper, T. Genotypic variation in metribuzin tolerance in narrow-leafed lupin (Lupinus angustifolius L.). Aust. J. Exp. Agric. 2006, 46, 85. [Google Scholar] [CrossRef]
  27. Si, P.; Buirchell, B.; Sweetingham, M. Improved metribuzin tolerance in narrow-leafed lupin (Lupinus angustifolius L.) by induced mutation and field selection. Field Crop Res. 2009, 113, 282–286. [Google Scholar] [CrossRef]
  28. Xu, L.; Liu, H.; Kilian, A.; Bhoite, R.; Liu, G.; Si, P.; Wang, J.; Zhou, W.; Yan, G. QTL Mapping Using a High-Density Genetic Map to Identify Candidate Genes Associated with Metribuzin Tolerance in Hexaploid Wheat (Triticum aestivum L.). Front. Plant Sci. 2020, 11, 1440. [Google Scholar] [CrossRef]
  29. Heath, R.L.; Packer, L. Photoperoxidation in isolated chloroplasts. Arch. Biochem. Biophys. 1968, 125, 189–198. [Google Scholar] [CrossRef]
  30. Bhoite, R.; Onyemaobi, I.; Si, P.; Siddique, K.H.M.; Yan, G. Identification and validation of QTL and their associated genes for pre-emergent metribuzin tolerance in hexaploid wheat (Triticum aestivum L.). BMC Genet. 2018, 19, 102. [Google Scholar] [CrossRef] [Green Version]
  31. Bhoite, R.; Si, P.; Liu, H.; Xu, L.; Siddique, K.H.M.; Yan, G. Inheritance of pre-emergent metribuzin tolerance and putative gene discovery through high-throughput SNP array in wheat (Triticum aestivum L.). BMC Plant Biol. 2019, 19, 457. [Google Scholar] [CrossRef] [PubMed] [Green Version]
  32. Lu, H.; Yu, Q.; Han, H.; Owen, M.J.; Powles, S.B. Metribuzin Resistance in a Wild Radish (Raphanus raphanistrum) Population via Both psbA Gene Mutation and Enhanced Metabolism. J. Agric. Food Chem. 2019, 67, 1353–1359. [Google Scholar] [CrossRef] [PubMed]
  33. Ma, H.; Lu, H.; Han, H.; Yu, Q.; Powles, S. Metribuzin resistance via enhanced metabolism in a multiple herbicide resistant Lolium rigidum population. Pest Manag. Sci. 2020, 76, 3785–3791. [Google Scholar] [CrossRef] [PubMed]
  34. Lazzari, P.; Pau, A.; Tambaro, S.; Asproni, B.; Ruiu, S.; Pinna, G.; Mastinu, A.; Curzu, M.M.; Reali, R.; Emilio Heiner Bottazzi, M.; et al. Synthesis and Pharmacological Evaluation of Novel 4-Alkyl-5-thien-2′-yl Pyrazole Carboxamides. Cent. Nerv. Syst. Agents Med. Chem. 2012, 12, 254–276. [Google Scholar] [CrossRef]
  35. Zhila, N.; Murueva, A.; Shershneva, A.; Shishatskaya, E.; Volova, T. Herbicidal activity of slow-release herbicide formulations in wheat stands infested by weeds. J. Environ. Sci. Health. Part. B Pestic. Food Contam. Agric. Wastes 2017, 52, 729–735. [Google Scholar] [CrossRef] [Green Version]
  36. Gupta, A.K.; Rather, M.A.; Jha, A.K.; Shashank, A.; Singhal, S.; Sharma, M.; Pathak, U.; Sharma, D.; Mastinu, A. Artocarpus lakoocha Roxb. and Artocarpus heterophyllus Lam. Flowers: New Sources of Bioactive Compounds. Plants 2020, 9, 1329. [Google Scholar] [CrossRef]
  37. Abate, G.; Zhang, L.L.; Pucci, M.; Morbini, G.; Mac Sweeney, E.; Maccarinelli, G.; Ribaudo, G.; Gianoncelli, A.; Uberti, D.; Memo, M.; et al. Phytochemical Analysis and Anti-Inflammatory Activity of Different Ethanolic Phyto-Extracts of Artemisia annua L. Biomolecules 2021, 11, 975. [Google Scholar] [CrossRef]
  38. Gupta, A.K.; Dhua, S.; Sahu, P.P.; Abate, G.; Mishra, P.; Mastinu, A. Variation in Phytochemical, Antioxidant and Volatile Composition of Pomelo Fruit (Citrus grandis (L.) Osbeck) during Seasonal Growth and Development. Plants 2021, 10, 1941. [Google Scholar] [CrossRef]
  39. Khaleghnezhad, V.; Yousefi, A.R.; Tavakoli, A.; Farajmand, B.; Mastinu, A. Concentrations-dependent effect of exogenous abscisic acid on photosynthesis, growth and phenolic content of Dracocephalum moldavica L. under drought stress. Planta 2021, 253, 127. [Google Scholar] [CrossRef]
  40. Kumar, A.; Premoli, M.; Aria, F.; Bonini, S.A.; Maccarinelli, G.; Gianoncelli, A.; Memo, M.; Mastinu, A. Cannabimimetic plants: Are they new cannabinoidergic modulators? Planta 2019, 249, 1681–1694. [Google Scholar] [CrossRef] [PubMed]
  41. Mahdavi, A.; Moradi, P.; Mastinu, A. Variation in Terpene Profiles of Thymus vulgaris in Water Deficit Stress Response. Molecules 2020, 25, 1091. [Google Scholar] [CrossRef] [Green Version]
  42. Mastinu, A.; Bonini, S.A.; Premoli, M.; Maccarinelli, G.; Mac Sweeney, E.; Zhang, L.L.; Lucini, L.; Memo, M. Protective Effects of Gynostemma pentaphyllum (var. Ginpent) against Lipopolysaccharide-Induced Inflammation and Motor Alteration in Mice. Molecules 2021, 26, 570. [Google Scholar] [CrossRef] [PubMed]
  43. Naservafaei, S.; Sohrabi, Y.; Moradi, P.; Mac Sweeney, E.; Mastinu, A. Biological Response of Lallemantia iberica to Brassinolide Treatment under Different Watering Conditions. Plants 2021, 10, 496. [Google Scholar] [CrossRef] [PubMed]
  44. Noryan, M.; Hervan, I.M.; Sabouri, H.; Kojouri, F.D.; Mastinu, A. Drought Resistance Loci in Recombinant Lines of Iranian Oryza sativa L. in Germination Stage. BioTech 2021, 10, 26. [Google Scholar] [CrossRef]
  45. Reza Yousefi, A.; Rashidi, S.; Moradi, P.; Mastinu, A. Germination and Seedling Growth Responses of Zygophyllum fabago, Salsola kali L. and Atriplex canescens to PEG-Induced Drought Stress. Environments 2020, 7, 107. [Google Scholar] [CrossRef]
  46. Gianoncelli, A.; Bonini, S.A.; Bertuzzi, M.; Guarienti, M.; Vezzoli, S.; Kumar, R.; Delbarba, A.; Mastinu, A.; Sigala, S.; Spano, P.; et al. An Integrated Approach for a Structural and Functional Evaluation of Biosimilars: Implications for Erythropoietin. BioDrugs 2015, 29, 285–300. [Google Scholar] [CrossRef] [PubMed] [Green Version]
  47. Anjum, N.A.; Umar, S.; Ahmad, A.; Iqbal, M.; Khan, N.A. Sulphur protects mustard (Brassica campestris L.) from cadmium toxicity by improving leaf ascorbate and glutathione. Plant Growth Regul. 2007, 54, 271–279. [Google Scholar] [CrossRef]
  48. Lazzari, P.; Sanna, A.; Mastinu, A.; Cabasino, S.; Manca, I.; Pani, L. Weight loss induced by rimonabant is associated with an altered leptin expression and hypothalamic leptin signaling in diet-induced obese mice. Behav. Brain Res. 2011, 217, 432–438. [Google Scholar] [CrossRef]
  49. Yamauchi, Y.; Furutera, A.; Seki, K.; Toyoda, Y.; Tanaka, K.; Sugimoto, Y. Malondialdehyde generated from peroxidized linolenic acid causes protein modification in heat-stressed plants. Plant Physiol. Biochem. 2008, 46, 786–793. [Google Scholar] [CrossRef]
  50. Almeida, A.C.; Gomes, T.; Langford, K.; Thomas, K.V.; Tollefsen, K.E. Oxidative stress potential of the herbicides bifenox and metribuzin in the microalgae Chlamydomonas reinhardtii. Aquat. Toxicol. 2019, 210, 117–128. [Google Scholar] [CrossRef]
  51. Husak, V.V.; Mosiichuk, N.M.; Maksymiv, I.V.; Storey, J.M.; Storey, K.B.; Lushchak, V.I. Oxidative stress responses in gills of goldfish, Carassius auratus, exposed to the metribuzin-containing herbicide Sencor. Environ. Toxicol. Pharmacol. 2016, 45, 163–169. [Google Scholar] [CrossRef] [PubMed]
  52. Weisz, D.A.; Gross, M.L.; Pakrasi, H.B. Reactive oxygen species leave a damage trail that reveals water channels in Photosystem II. Sci. Adv. 2017, 3, eaao3013. [Google Scholar] [CrossRef] [PubMed] [Green Version]
  53. Pospisil, P. Production of Reactive Oxygen Species by Photosystem II as a Response to Light and Temperature Stress. Front. Plant Sci. 2016, 7, 1950. [Google Scholar] [CrossRef] [PubMed]
  54. Demmig, B.; Winter, K.; Krüger, A.; Czygan, F.-C. Photoinhibition and Zeaxanthin Formation in Intact Leaves. Plant Physiol. 1987, 84, 218–224. [Google Scholar] [CrossRef] [PubMed] [Green Version]
  55. Guo, W.; Weiperth, A.; Hossain, M.S.; Kubec, J.; Grabicova, K.; Lozek, F.; Vesely, L.; Blaha, M.; Buric, M.; Kouba, A.; et al. The effects of the herbicides terbuthylazine and metazachlor at environmental concentration on the burrowing behaviour of red swamp crayfish. Chemosphere 2021, 270, 128656. [Google Scholar] [CrossRef]
  56. Shekoofa, A.; Brosnan, J.T.; Vargas, J.J.; Tuck, D.P.; Elmore, M.T. Environmental effects on efficacy of herbicides for postemergence goosegrass (Eleusine indica) control. Sci Rep. 2020, 10, 20579. [Google Scholar] [CrossRef]
  57. Xie, Y.L.; Zhao, Z.D.; Zhang, X.L.; Tang, L.L.; Zhang, Y.; Zhang, C.H. Simultaneous analysis of herbicide metribuzin and its transformation products in tomato using QuEChERS-based gas chromatography coupled to a triple quadrupole mass analyzer. Microchem. J. 2017, 133, 468–473. [Google Scholar] [CrossRef]
  58. Zheljazkov, V.D.; Zhalnov, I.; Nedkov, N.K. Herbicides for Weed Control in Blessed Thistle (Silybum marianum). Weed Technol. 2017, 20, 1030–1034. [Google Scholar] [CrossRef]
  59. Jervekani, M.T.; Karimmojeni, H.; Razmjoo, J. Effects of light-dependent herbicides on growth and physiology of Salvia officinalis. Planta Daninha 2020, 38. [Google Scholar] [CrossRef]
Figure 1. Effect of different metribuzin doses (0, 250, 500, 750, 1250 (g ha−1)) on leaf area of Echinacea purpurea and Echinacea angustifolia species. Data are shown as the mean ± SEM, and ordinary two-way ANOVA followed by Dunnett’s multiple comparisons test was used for statistical significance; * p < 0.005 vs. control (0 g ha−1 metribuzin). Significant differences between Echinacea cultivars are indicated with #.
Horticulturae 08 00169 g001
Figure 2. Effect of different metribuzin doses on leaf dry weight of Echinacea purpurea and Echinacea angustifolia species. Data are shown as the mean ± SEM, and ordinary two-way ANOVA followed by Dunnett’s multiple comparisons test was used for statistical significance; * p < 0.005 vs. control (0 g ha−1 metribuzin). Significant differences between Echinacea cultivars are indicated with #.
Horticulturae 08 00169 g002
Figure 3. Effect of different metribuzin doses on root dry weight of Echinacea purpurea and Echinacea angustifolia species. Data are shown as the mean ± SEM, and ordinary two-way ANOVA followed by Dunnett’s multiple comparisons test was used for statistical significance; * p < 0.005 vs. control (0 g ha−1 metribuzin). Significant differences between Echinacea cultivars are indicated with #.
Horticulturae 08 00169 g003
Figure 4. Effect of different metribuzin doses on root length of Echinacea purpurea and Echinacea angustifolia species. Data are shown as the mean ± SEM, and ordinary two-way ANOVA followed by Dunnett’s multiple comparisons test was used for statistical significance; * p < 0.005 vs. control (0 g ha−1 metribuzin). Significant differences between Echinacea cultivars are indicated with #.
Horticulturae 08 00169 g004
Figure 5. Effect of different metribuzin doses on root volume of Echinacea purpurea and Echinacea angustifolia species. Data are shown as the mean ± SEM, and ordinary two-way ANOVA followed by Dunnett’s multiple comparisons test was used for statistical significance; * p < 0.005 vs. control (0 g ha−1 metribuzin). Significant differences between Echinacea cultivars are indicated with #.
Horticulturae 08 00169 g005
Figure 6. Effect of different metribuzin doses on malondialdehyde content of Echinacea purpurea and Echinacea angustifolia species. Data are shown as the mean ± SEM, and ordinary two-way ANOVA followed by Dunnett’s multiple comparisons test was used for statistical significance; * p < 0.005 vs. control (0 g ha−1 metribuzin). Significant differences between Echinacea cultivars are indicated with #.
Horticulturae 08 00169 g006
Figure 7. Effect of different metribuzin doses on minimum chlorophyll fluorescence of Echinacea purpurea and Echinacea angustifolia species. Data are shown as the mean ± SEM, and ordinary two-way ANOVA followed by Dunnett’s multiple comparisons test was used for statistical significance; * p < 0.005 vs. control (0 g ha−1 metribuzin). Significant differences between Echinacea cultivars are indicated with #.
Horticulturae 08 00169 g007
Figure 8. Effect of different metribuzin doses on maximum chlorophyll fluorescence of Echinacea purpurea and Echinacea angustifolia species. Data are shown as the mean ± SEM, and ordinary two-way ANOVA followed by Dunnett’s multiple comparisons test was used for statistical significance; * p < 0.005 vs. control (0 g ha−1 metribuzin). Significant differences between Echinacea cultivars are indicated with #.
Horticulturae 08 00169 g008
Figure 9. Effect of different metribuzin doses on maximum quantum yield of Echinacea purpurea and Echinacea angustifolia species. Data are shown as the mean ± SEM, and ordinary two-way ANOVA followed by Dunnett’s multiple comparisons test was used for statistical significance; * p < 0.005 vs. control (0 g ha−1 metribuzin). Significant differences between Echinacea cultivars are indicated with #.
Horticulturae 08 00169 g009
Table 1. Analysis of variance for morphophysiological traits of four Echinacea cultivars (G) evaluated at five doses of metribuzin (H).
MS
SOVdfLDWRDWRLRVLAMDAF0FmFv/Fm
G340.35 **140.83 **856.51 **1637 **15,445,432 **7.49 **1131.2 **3972 **0.0246 **
H42.78 **15.01 **49.79 **236 **1,082,277 **30.43 **9525.2 **5140 **0.0917 **
G × H120.36 **4.53 **26.41 **215 **272,880.2 **0.68 **349.4 **780 **0.0134 **
Error400.0330.102314.351638.480.15137.5142.570.00071
CV-8.655.906.4215.203.206.455.542.684.91
** p ≤ 0.01; MS—mean squares; SOV—source of variation; df—degrees of freedom; LDW—leaf dry weight; RDW—root dry weight; RL—root length; RV—root volume; LA—leaf area; MDA—malondialdehyde; F0—minimum fluorescence; Fm—maximum fluorescence; Fv/Fm—maximum quantum yield; CV—coefficient of variation.
Table 2. Correlation coefficients among measured traits in four Echinacea cultivars treated by metribuzin.
RDWRLRVMDALAFv/FmF0Fm
RDW-
RL0.760 **-
RV0.888 **0.702 **-
MDA−0.08 ns0.407 **−0.05 ns-
LA0.868 **0.810 **0.775 **0.119 ns-
Fv/Fm−0.03 ns−0.299 *−0.04 ns−0.47 **−0.03 ns-
F0−0.01 ns0.377 **−0.03 ns0.766 **0.05 ns−0.88 **-
Fm−0.14 ns0.21 ns−0.17 ns0.746 **0.02 ns−0.00 ns0.460 **-
** p ≤ 0.01; * p ≤ 0.05; ns not significant; RDW—root dry weight; RL—root length; RV—root volume; MDA—malondialdehyde; LA—leaf area; Fv/Fm—maximum quantum yield; F0—minimum fluorescence; Fm—maximum fluorescence.
Publisher’s Note: MDPI stays neutral with regard to jurisdictional claims in published maps and institutional affiliations.

