Article

Growth Characteristics of Lettuce Relative to Generation Position of Air Anions in a Closed-Type Plant Factory

1
Department of Agricultural Engineering, National Institute of Agricultural Science, Jeonju 54875, Korea
2
Department of Bioindustrial Machinery Engineering, Jeonbuk National University, Jeonju 54896, Korea
3
Department of Biosystems Engineering, Chungbuk National University, Cheongju 28644, Korea
*
Author to whom correspondence should be addressed.
These authors contributed equally to this work.
Horticulturae 2022, 8(4), 346; https://doi.org/10.3390/horticulturae8040346
Submission received: 21 March 2022 / Revised: 11 April 2022 / Accepted: 13 April 2022 / Published: 18 April 2022
(This article belongs to the Section Vegetable Production Systems)

Abstract

:
(1) Background: We studied how the generation position of air anions in a closed-type plant factory affects the growth characteristics of lettuce and identified the optimal position. (2) Methods: We used LEDs (red/green/blue = 8:1:1) as a light source and set the temperature and RH of the plant factory to 20 ± 2 °C and 50% ± 5%, respectively. We grew lettuce under three air anion conditions—sideward, upward, and downward—and compared the growth characteristics to those of a control grown without air anions. We measured the growth characteristics of the lettuce at 3 and 4 weeks after sowing, and the measurement items were shoot fresh weight (FW) and dry weight (DW); leaf area (LA), length (LL), and width (LW); SPAD; antioxidant capacity; and total phenol content. (3) Results: At 4 weeks, FW in the downward treatment condition was 25.3% higher than in the control, and DW showed a similar difference. LA was about 1943.94 cm²/plant in the downward treatment condition, which was about 15.5% higher than in the control. (4) Conclusions: We conclude that air anion generation has a positive effect on lettuce growth, and the optimal generation position for air anions is downward.

1. Introduction

Lettuce (Lactuca sativa L.) is an important leafy vegetable because of its high production and consumption in Korea [1]. It is one of the most suitable crops for closed-type plant factory research [2], and growing lettuce in controlled closed environments is gaining popularity because it offers up to 100 times higher annual productivity than field growing [3]. However, some costs (heating, ventilation, air conditioning, etc.) are much higher for closed-type plant factories than for field production [4]. For this reason, several researchers have studied the optimal conditions for improving the growth characteristics and increasing the yield of lettuce in closed production environments. Anions are one possible method for increasing plant growth and production. Anions can be generated by obtaining negative charges or electrons in neutral atoms or molecules, and they usually occur as oxygen anions [5]. When applied in plant growth systems, air anions promote plant photosynthesis and respiration and have a positive effect on growth [6,7]. In addition, several researchers have reported that air anions help lettuce growth by promoting photosynthesis [8], and help the growth of kale and its absorption of minerals [9]. Researchers have consistently investigated the effect of air anions on plants. However, few have studied the effect of the air anion generation position on plant growth. In a previous study, researchers investigated the effect of air anions in a closed-type plant factory using a fluorescent lamp as a light source [5]. However, LEDs (light-emitting diodes) are widely used as light sources in closed-type plant factories because of their lower heat emission, longer operating lifespan, and narrower spectral output [10]. In addition, some researchers have reported that crop growth was higher under LED conditions than in fluorescent conditions [11]. However, these results may differ between environments, plant species, growth conditions, etc. Thus, we must study the effect of air anions in a closed-type plant factory using LEDs.
We aimed to investigate how the generation position of air anions affects the growth characteristics of lettuce in a closed-type plant factory using LEDs as a light source, and to determine the optimal position.

2. Materials and Methods

2.1. Samples and Cultivation Environment

We used lettuce (Lactuca sativa L., ‘Jeokchima’) for this study. We sowed seeds in plastic trays filled with rock wool and then placed them for 14 days in a closed-type plant factory. We used LEDs (red/green/blue = 8:1:1) as a light source. Light intensity and photoperiod were 180 ± 30 μmol∙m−2∙s−1 and 16/8 h (light/dark), respectively, and the temperature was 20 ± 2 °C [12]. Relative humidity and carbon dioxide concentration were 50% ± 5% and 1000 ± 200 ppm, respectively. We transplanted the lettuces onto a nutrient film technique (NFT) bed 14 days after sowing and grew them for 20 days in a closed-type plant factory. The experimental conditions of the closed-type plant factory were as follows: We used Yamazaki solution (N:P:K = 17.3:4.0:8.0) as a nutrient solution and adjusted it to 6 ± 0.5 and 1.8 ± 0.2 dS∙m−1 for pH and electric conductivity (EC), respectively. We supplied nutrient solution for 5 min at 25 min intervals using a timer [5,13].

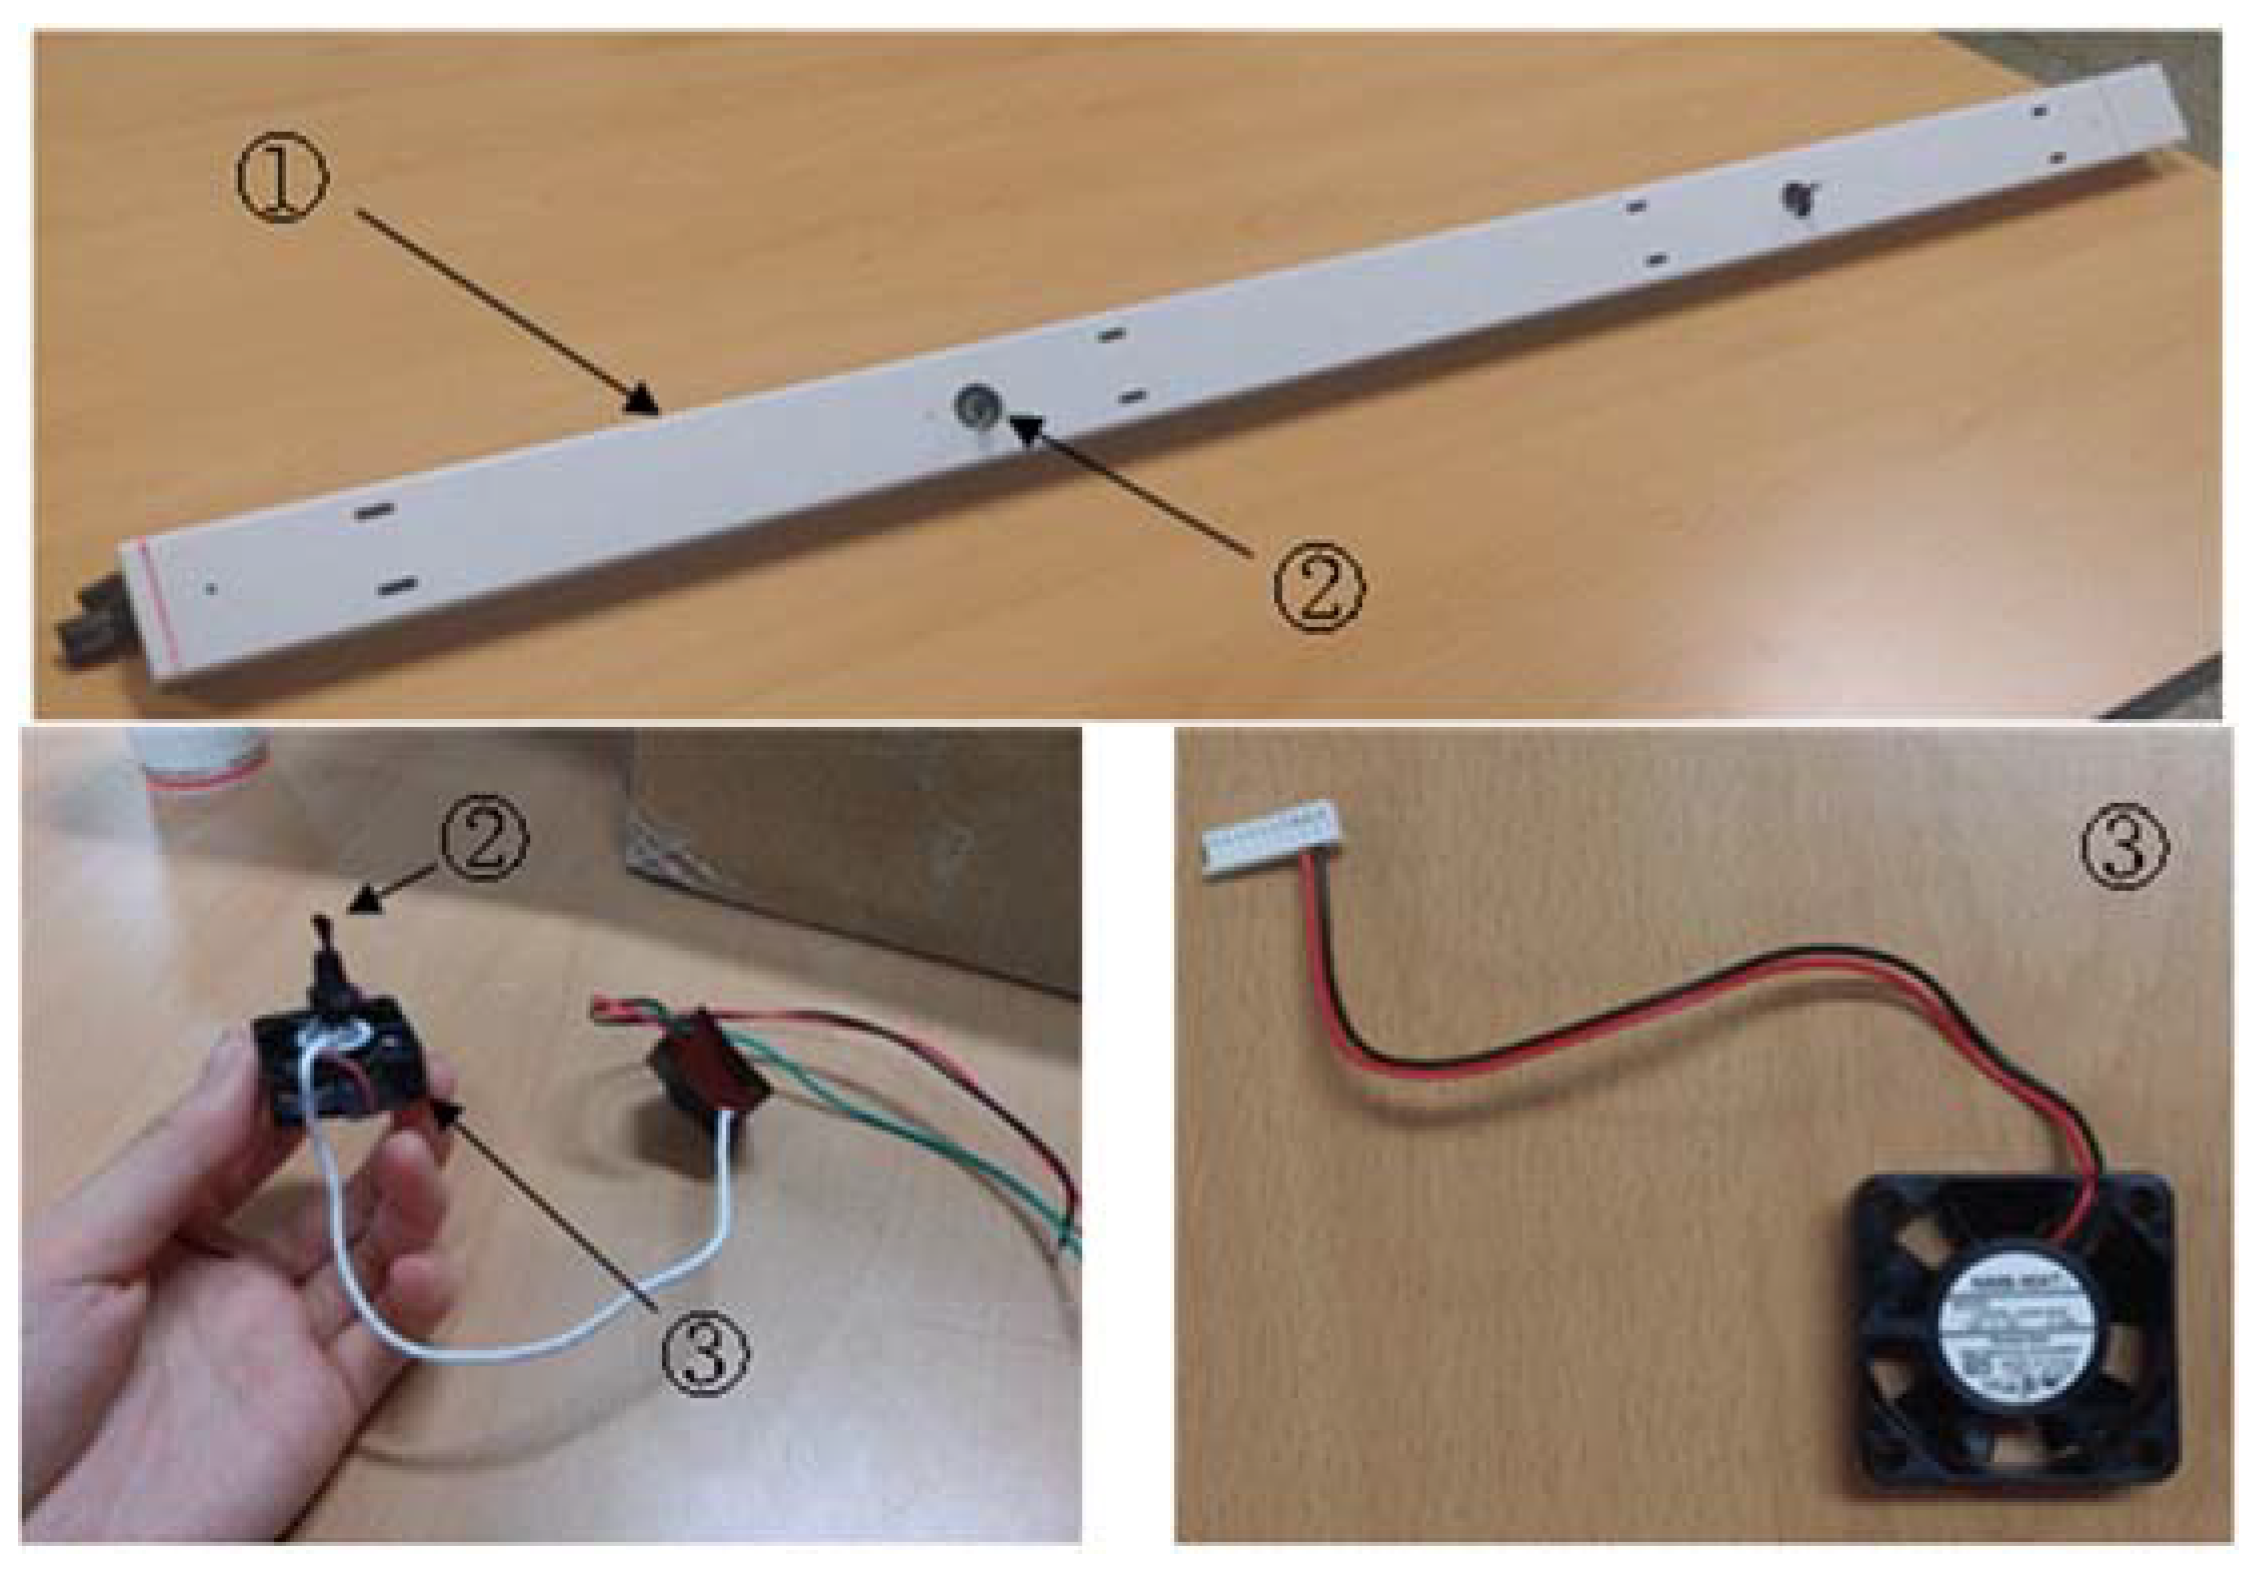
2.2. Air Anion Treatment

We used air anion generators (TFB-YA249, TRUMPXP, Anhui, China) based on an electrospinning method. We installed the air anion generation system in three different positional conditions: sideward, upward, and downward. We used a condition without air anion treatment as a control. Figure 1 shows the anion generation system installed in the closed-type plant factory. As shown in Figure 1, we installed a small fan behind the generator to smoothly supply the anions to the lettuce. The air anions treated the lettuce for 24 h a day. We compared the anion concentrations in the different conditions using an air anion counter (COM-3200 PRO, COM System Inc., Tokyo, Japan) [5].

2.3. Growth Characteristics

We measured the lettuce growth characteristics 21 days (3 weeks) and 28 days (4 weeks) after sowing, including its fresh and dry weights (FW and DW), the area (LA), length (LL), and width (LW) of the third unfolded leaf, and SPAD. We measured the FW using electronic scales and the DW after drying the lettuce at 70 °C for 72 h in a dry oven (OF-11E, Jeio Tech, Daejeon, Korea). We measured the LA of all lettuce leaves with a leaf area meter (LI-3100C, LI-Cor, Lincoln, OR, USA) and calculated the average value after 3 measurements. We measured the LL and LW with digital Vernier calipers (CD-15CP, Mitutoyo, Kanagawa, Japan) and calculated SPAD as the average of five measurements using a SPAD meter (SPAD-502, Konica Minolta, Tokyo, Japan).

2.4. Antioxidant Capacity and Total Phenol Content

To measure antioxidant capacity and total phenol content, we stored 0.2 g of leaves at −70 °C in a deep freezer (NF-300SF, Nihon Freezer Co. Ltd., Tokyo, Japan), pulverized them using a mortar, and extracted antioxidants and phenol using a 2,2′-azino-bis (3-ethylbenzothiazoline-6-sulfonic acid) diammonium salt reagent and Folin-Ciocalteu’s phenol reagent. We used a spectrophotometer (UV-1800, Shimadzu, Kyoto, Japan) to measure the antioxidant capacity and total phenolic content at 730 and 765 nm, respectively [5,14].

2.5. Statistical Analysis

We analyzed significance using the SPSS statistical package (IBM SPSS Statistics 20.0, IBM, Armonk, NY, USA) and used one-way ANOVA for statistical analysis. In addition, we statistically analyzed the results for each air anion generation position using Duncan’s multiple range test with a significance level of p < 0.05.

3. Results

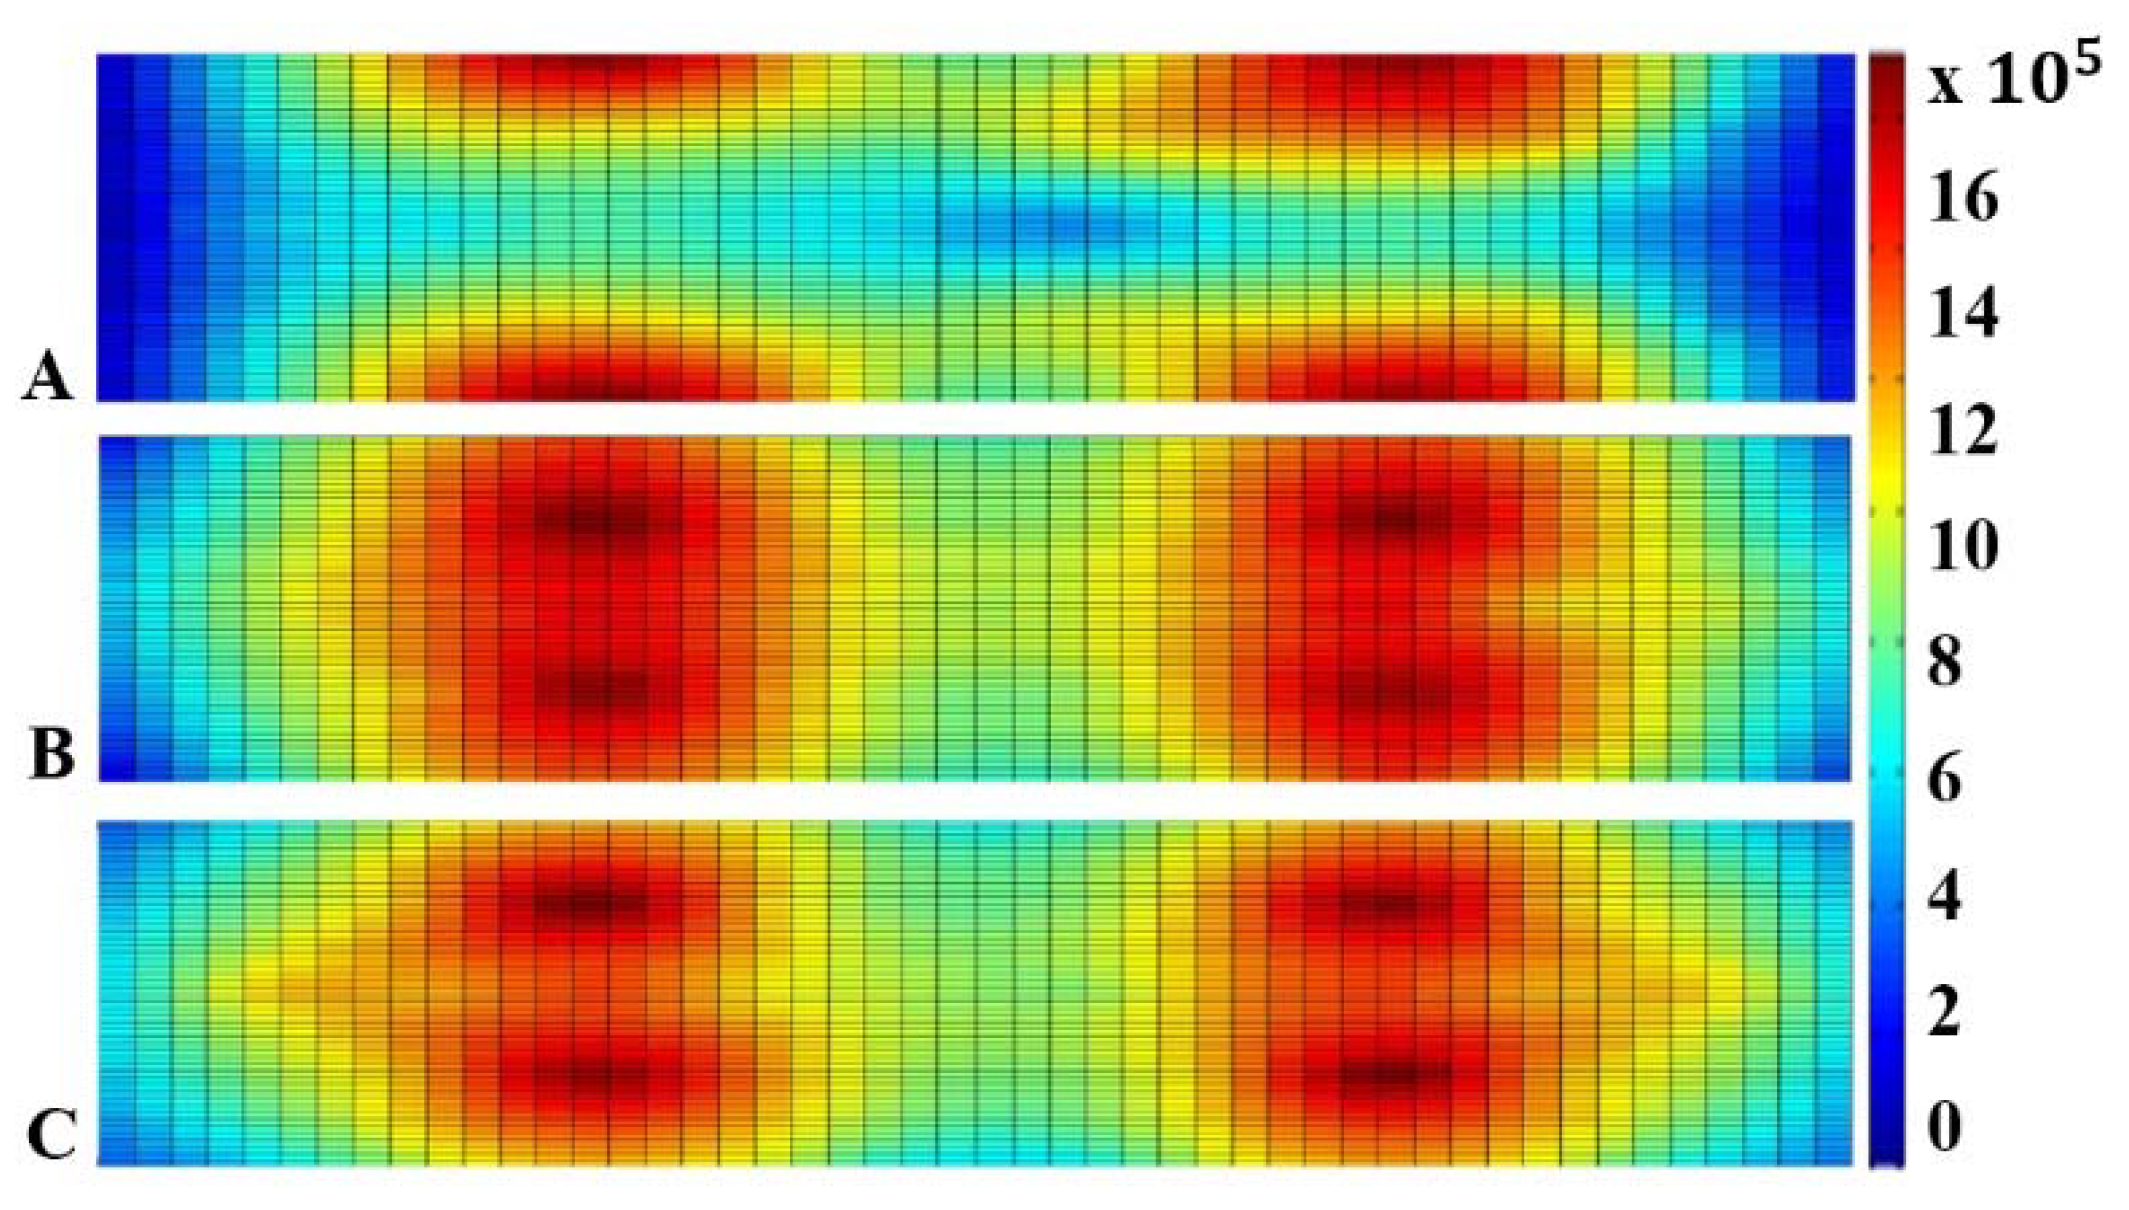
3.1. Concentration Relative to Air Anion Treatment

Figure 2 shows the anion concentration on the cultivation beds relative to the anion generation position. We visualized the anion concentration distribution using the color function of MATLAB R2014a (MathWorks, Natick, MA, USA), which showed the differences for each generation position, as shown in Figure 2.
We measured the control condition without an air anion generator at 70 ea/cc. The anion concentrations were 4.1 × 10⁵, 1.1 × 10⁶, and 6.7 × 10⁵ ea/cc for the sideward, upward, and downward treatment conditions, respectively. The upward treatment condition showed the highest concentration. In addition, the anion concentration was highest near the location that the anion generator was installed at and decreased moving away from the discharge source [5].

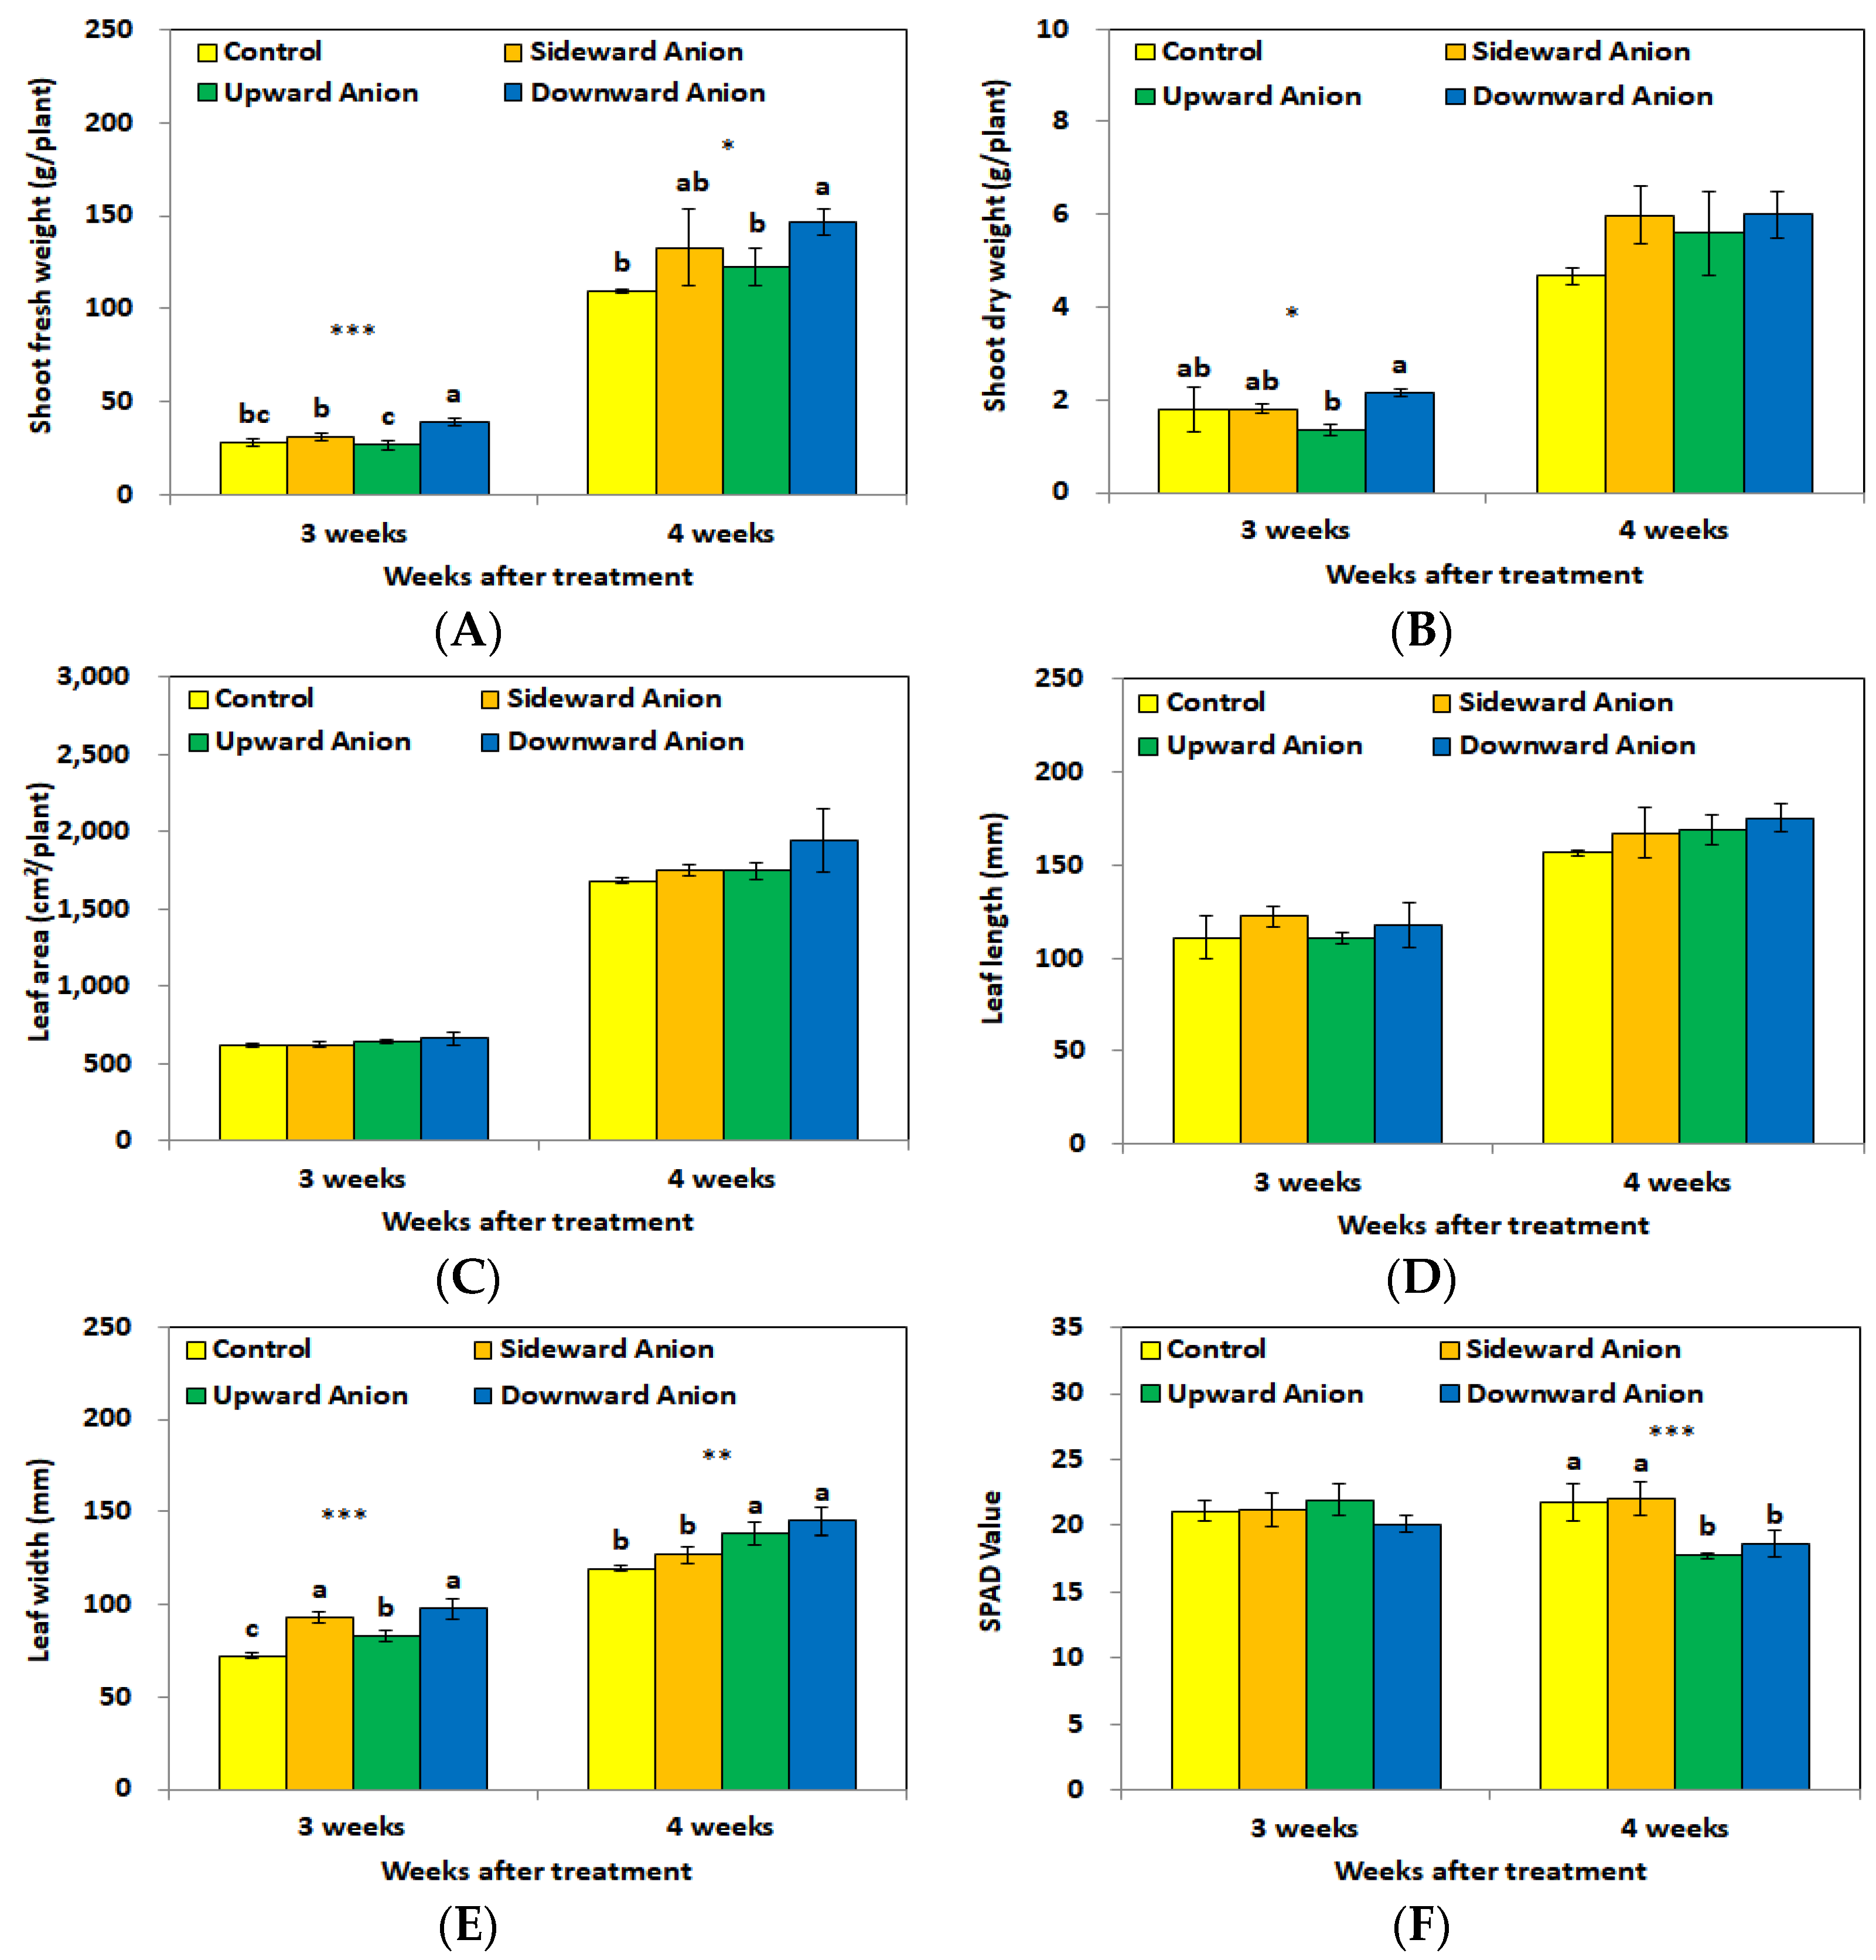
3.2. Growth Characteristics

The FW was higher at 3 and 4 weeks in the downward treatment condition than in the other treatment conditions (Figure 3A). The FW was also higher in the air anion treatment conditions than in the control. The FW was about 25.66% higher in the downward treatment condition than in the other treatment conditions. At 3 weeks, we tested the significance of the effect of air anion treatment on FW, and the p value was lower than 0.001. In week 4, the p value was lower than 0.05, indicating significance. However, only the downward treatment condition showed a significant difference against the control.
The DW was higher in the anion treatment conditions, and the growth rate was highest in the downward condition (Figure 3B). The results were more noticeable at 4 weeks than at 3. In week 3, the sideward and upward treatment conditions had similar or lower values than the control. However, at 4 weeks, the DW in the air anion conditions was about 25.34% higher than in the control. Moreover, the DW in the downward treatment condition was over 20% higher than in the control at both 3 and 4 weeks. The significance test at 3 weeks showed that the p value was lower than 0.05. However, at 4 weeks, no significance remained.
At 3 weeks, the LA values were similar in all conditions regardless of anion treatment, but at 4 weeks, the LA was higher with air anion treatment than in the control (Figure 3C). In particular, although the LA was highest in the downward treatment condition at both 3 and 4 weeks, the p value was higher than 0.05 in both weeks.
The LL followed a similar pattern to the LA. As shown in Figure 3D, although the LL in the downward treatment condition was higher than in the other conditions, the probability values at 3 and 4 weeks were higher than 0.05, indicating no significance.
Air anion treatment increased the LW, and, like the LL, the LW was also highest in the downward treatment condition, as shown in Figure 3E. Furthermore, the LWs in the anion treatment conditions were about 19.14% higher than in the control. The significance tests for LW at 3 and 4 weeks gave p values of less than 0.05, meaning the difference relative to the air anion generation position was significant.
As shown in Figure 3F, the anion treatment caused no significant difference in SPAD. At 4 weeks, the SPAD values for the upward and downward treatment conditions were about 16.28% lower than in the control. The p value was higher than 0.05 in week 3, but lower than 0.001 in week 4.

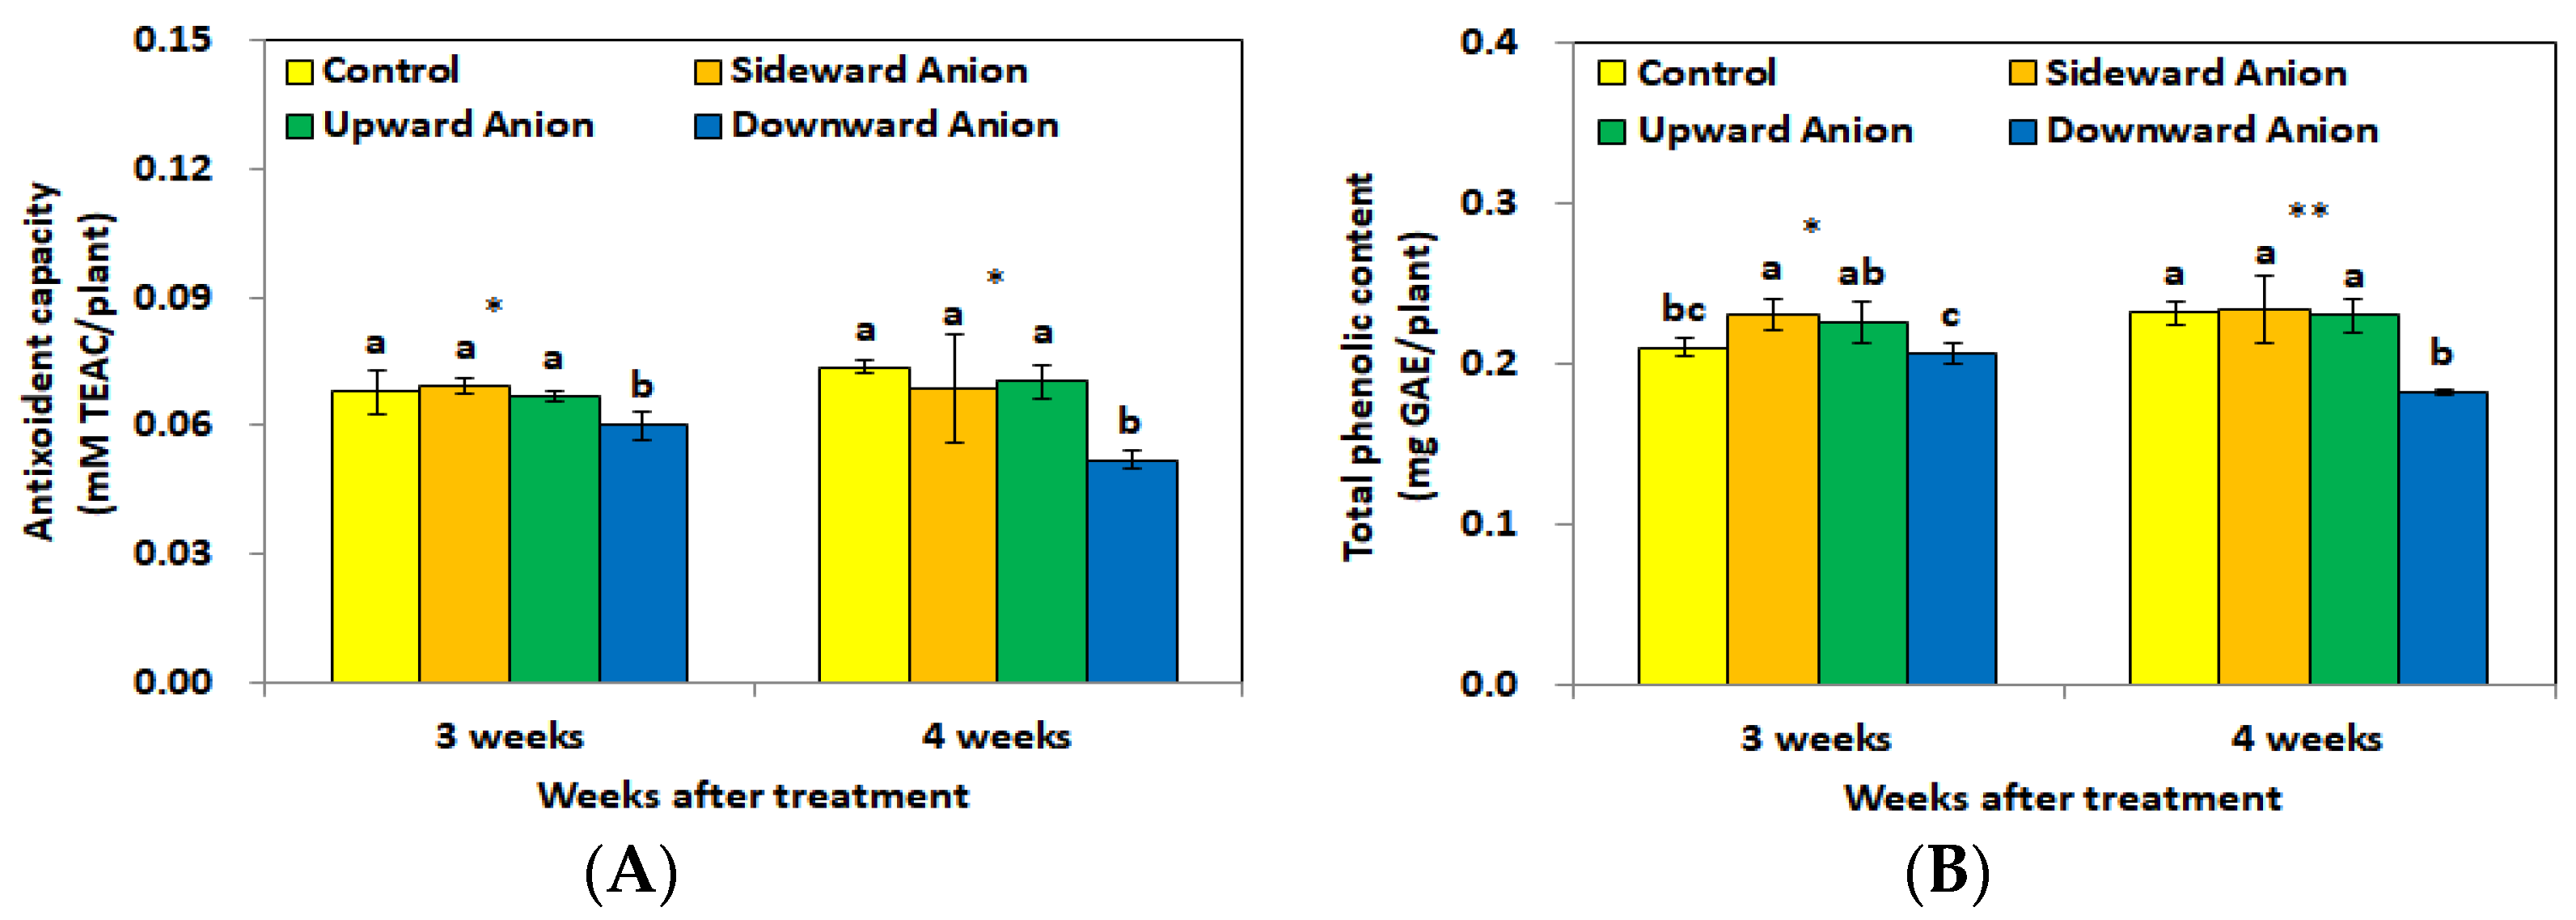
3.3. Antioxidant Capacity and Total Phenolic Content

Figure 4A shows the differences in antioxidant capacity between the air anion treatment conditions. As shown in Figure 4A, although the antioxidant capacities in the anion treatment conditions were lower than in the control, the differences were not significant. When we tested the significance of the antioxidant capacity at 3 and 4 weeks, the p values were lower than 0.05 in all conditions, indicating significance.
Figure 4B shows the differences in total phenol content between the air anion treatment conditions. Although the total phenol contents for the upward and sideward treatment conditions were about 8.29% higher than in the control at 3 weeks, we found no significant difference at 4 weeks. The total phenol content in the downward treatment condition was more than 10% lower than in the other conditions at both 3 and 4 weeks. In the significance test for total phenol content at 3 and 4 weeks, the p values for all conditions were lower than 0.05, indicating significance.

4. Discussion

Applying air anions to lettuce improved its physical characteristics by about 17%, including FW, DW, and LW, compared to the control. DW improved the most, by about 25.34%. We expected those results, because applying air anions affects the growth of lettuce and improves photosynthesis and respiration [5,8,15]. Exposing plants to air anions negatively charges the leaf surface to form an electric field with cations inside the plants. Most ions passively migrate along the gradient and move their respective poles in the electric field [16]. Therefore, air anions applied from outside the plants can directly affect the polar transport of cations. In a previous study, air anion treatment increased the accumulation of cations, potassium accumulation in the leaves, and stomatal conductivity, and promoted photosynthesis and transpiration in kale and spinach plants [9,17]. We observed the strongest effect of air anion generation position in the downward treatment condition, where the physical characteristics improved by about 30% compared with the control. The sideward treatment condition gave the least improvement in physical characteristics, at about 5% compared with the control. We expected those results because the air anions in the downward treatment condition were relatively uniformly distributed and could reach plants at suitable concentrations (Figure 2C). The low improvement in the sideward treatment condition was likely because of the nonuniform distribution of air anions concentrated on the side (Figure 2A). Moreover, a downward air anion treatment also most increased the growth characteristic values in a closed-type plant factory using a fluorescent lamp as a light source [5]. This was because the air anions in the downward condition were relatively uniformly supplied in suitable concentrations. Contrastively, in the sideward treatment condition, the distribution of air anions was uneven, so that the growth effect was small. Therefore, we determined that the optimal air anion generation position for the lettuce (Lactuca sativa L. cv.) growth system using LEDs (red/green/blue = 8:1:1) as the light source was downward. Additionally, we observed rapid increases in FW and DW between weeks 3 and 4. Previous research supports these results, as does lettuce’s short growth period, which follows a sigmoid-shaped curve [8,9,18,19]. We measured lower antioxidant capacity, total phenol content, and SPAD values in the downward treatment condition compared to the other conditions. Growing lettuce while using air anions affected the physical characteristics, but had small adverse effects on the chemical characteristics, decreasing the values of the chemical properties calculated per unit area or weight. The upward and sideward treatment conditions with the lower physical characteristic values showed higher values in the chemical characteristics than the downward treatment condition. However, using blue LEDs as a light source rather than red LEDs can increase chemical characteristics such as antioxidant capacity, total phenol content, and SPAD values [20,21]. We combined air anions and red-centered LEDs, but, in follow-up research, we think a combination of air anions and blue LEDs may be beneficial for balancing the physical and chemical improvements. Therefore, we must conduct follow-up research, because the optimal air anion concentration or generation position may vary depending on the type of crop, LED composition, and cultivation environment.

Author Contributions

J.-H.W. and B.-H.C. as first authors planned the experiments and wrote the manuscript. Y.-H.K. helped the research and revised the manuscript. J.-H.L. led the overall research as a corresponding author and helped revised the manuscript. All authors have read and agreed to the published version of the manuscript.

Funding

This research received no external funding.

Data Availability Statement

The data presented in this study are available on request from the corresponding author. The data are not publicly available due to privacy reasons.

Conflicts of Interest

The authors declare no conflict of interest.

References

  1. Cho, B.H.; Kang, T.H.; Han, C.S.; Lee, J.H.; Lee, D.I.; Noh, H.K. Estimation of lettuce growth characteristics under different LED intensities in a closed-type plant factory. Hortic. Sci. Technol. 2018, 36, 350–361. [Google Scholar] [CrossRef]
  2. Lee, R.J.; Bhandari, S.R.; Lee, G.; Lee, J.G. Optimization of temperature and light, and cultivar selection for the production of high-quality head lettuce in a closed-type plant factory. Hortic. Environ. Biotechnol. 2019, 60, 207–216. [Google Scholar] [CrossRef]
  3. Kelly, N.; Choe, D.; Meng, Q.; Runkle, E.S. Promotion of lettuce growth under an increasing daily light integral depends on the combination of the photosynthetic photon flux density and photoperiod. Sci. Hortic. 2020, 272, 109565. [Google Scholar] [CrossRef]
  4. Kozai, T.; Niu, G. Plant factory as a resource-efficient closed plant production system. In Plant Factory; Toyoki, K., Genhua, N., Michiko, T., Eds.; Academic Press: Cambridge, MA, USA, 2016; pp. 69–90. [Google Scholar] [CrossRef]
  5. Won, J.H.; Lee, J.H.; Cho, B.H.; Han, C.S.; Kang, T.H. Growth characteristics, antixoident capacity and total phenolic content of lettuce according to generation position of air anion in a closed-type plant factory. Hortic. Sci. Technol. 2018, 36, 820–830. [Google Scholar] [CrossRef]
  6. Wachter, S.L.; Widmer, R.E. The effects of negative air ions on plant growth [Ornamentals, vegetables]. HortScience 1976, 11, 576–578. [Google Scholar]
  7. Pohl, H.A. Electroculture. J. Biol. Phys. 1977, 5, 3–23. [Google Scholar] [CrossRef]
  8. Song, M.J.; Kang, T.H.; Han, C.S.; Oh, M.M. Air anions enhance lettuce growth in plant factories. Hortic. Environ. Biotechnol. 2014, 55, 293–298. [Google Scholar] [CrossRef]
  9. Lee, S.R.; Kang, T.H.; Han, C.S.; Oh, M.M. Air anions improve growth and mineral concentration of kale in a plant factory. Korean J. Hortic. Sci. Technol. 2015, 32, 41. [Google Scholar] [CrossRef] [Green Version]
  10. Brown, C.S.; Schuerger, A.C.; Sager, J.C. Growth and photomorphogenesis of pepper plants under red light-emitting dioes with supplemental blue or far-red lighting. J. Am. Soc. Hortic. Sci. 1995, 120, 808–813. [Google Scholar] [CrossRef] [PubMed] [Green Version]
  11. Choi, C.S.; Lee, J.G.; Jang, Y.A.; Lee, S.G.; Oh, S.S.; Lee, H.J.; Um, Y.C. Effect of artificial light sources on growth and quality characteristics of leaf lettuce in closed plant factory system. J. Agric. Life Sci. 2013, 47, 23–32. [Google Scholar] [CrossRef] [Green Version]
  12. Cha, M.K.; Cho, J.H.; Cho, Y.Y. Growth of leaf lettuce as affected by light quality of LED in closed-type plant factory system. Protected horticulture and Plant Factory. Korean Soc. Bio-Environ. Control 2013, 22, 291–297. [Google Scholar] [CrossRef]
  13. Lee, M.J.; Son, J.E.; Oh, M.M. Increase in biomass and bioactive compounds in lettuce under various ratios of red to far-red LED light supplemented with blue LED light. Hortic. Environ. Biotechnol. 2016, 57, 139–147. [Google Scholar] [CrossRef]
  14. Lee, M.J.; Son, J.E.; Oh, M.M. Growth and phenolic content of sowthistle grown in a closed-type plant production system with a UV-A or UV-B lamp. Hortic. Environ. Biotechnol. 2013, 54, 492–500. [Google Scholar] [CrossRef]
  15. Elkiey, T.M.; Bhartendu, S.; Barthakur, N. Air ion effect on respiration and photosynthesis of barley and Antirrhinum majus. Int. J. Biometeorol. 1985, 29, 285–292. [Google Scholar] [CrossRef]
  16. Taiz, L.; Zeiger, E. Plant Physiology, 4th ed.; Sinauer Associates: Sunderland, MA, USA, 2006. [Google Scholar]
  17. An, J.I.; Lee, S.R.; Oh, M.M. Air anions promote the growth and mineral accumulation of spinach (Spinacia oleracea) cultivated in greenhouses. Hortic. Sci. Technol. 2021, 30, 332–342. [Google Scholar] [CrossRef]
  18. Scaife, M.A. The early relative growth rates of six lettuce cultivars as affected by temperature. Ann. Appl. Biol. 1973, 74, 119–128. [Google Scholar] [CrossRef]
  19. Shimizu, H.; Kushida, M.; Fujinuma, W. A growth model for leaf lettuce under greenhouse environments. Environ. Control Biol. 2008, 46, 211–219. [Google Scholar] [CrossRef] [Green Version]
  20. Son, K.H.; Oh, M.M. Leaf shape, growth, and antioxidant phenolic compounds of two lettuce cultivars grown under various combinations of blue and red Light-emitting diodes. HortScience 2013, 48, 988–995. [Google Scholar] [CrossRef]
  21. Son, K.H.; Park, J.H.; Kim, D.I.; Oh, M.M. Leaf shape index, growth, and phytochemicals in two leaf lettuce cultivars grown under monochromatic light-emitting diodes. Korean J. Hortic. Sci. Technol. 2012, 30, 664–672. [Google Scholar] [CrossRef]
Figure 1. The anion generation system: ➀ case, ➁ anion generator, and ➂ fan.
Horticulturae 08 00346 g001
Figure 2. Air anion concentration by generation position: (A) sideward, (B) upward, and (C) downward.
Horticulturae 08 00346 g002
Figure 3. Comparison of the growth characteristics of lettuce relative to air anion generation position: (A) FW, (B) DW, (C) LA, (D) LL, (E) LW, and (F) SPAD. Values are mean ± standard error (n = 3). *, **, and ** indicate that correlations are significant at the 0.05, 0.01, and 0.001 probability levels, respectively.
Horticulturae 08 00346 g003
Figure 4. Comparison of (A) antioxidant capacity and (B) total phenol content of lettuce relative to air anion generation position. Values are mean ± standard error (n = 3). * and ** indicate correlations are significant at the 0.05 and 0.01 levels, respectively.
Horticulturae 08 00346 g004
Publisher’s Note: MDPI stays neutral with regard to jurisdictional claims in published maps and institutional affiliations.

