Article

Mitigation of Salinity Stress on Pomegranate (Punica granatum L. cv. Wonderful) Plant Using Salicylic Acid Foliar Spray

by
Hoda A. Khalil
1,*,
Diaa O. El-Ansary
1 and
Zienab F. R. Ahmed
2,*
1
Department of Pomology, Faculty of Agriculture (El-Shatby), Alexandria University, Alexandria 21545, Egypt
2
Integrative Agriculture Department, College of Agriculture and Veterinary Medicine, United Arab Emirates University, Al Ain 15551, United Arab Emirates
*
Authors to whom correspondence should be addressed.
Horticulturae 2022, 8(5), 375; https://doi.org/10.3390/horticulturae8050375
Submission received: 10 March 2022 / Revised: 22 April 2022 / Accepted: 23 April 2022 / Published: 25 April 2022

Abstract

:
Salt stress significantly impacts plant morphological structure and physiological processes, resulting in decreased plant growth. Salicylic acid (SA) is a key signal molecule that protects plants from the negative impacts of salinity. Under natural conditions, the pomegranate plant generally exhibits salt-tolerant characteristics. The objective of this study was to elucidate the salt-tolerance level of pomegranate (Punica granatum L. cv. Wonderful) and the effect of the regulating strategy of SA foliar spray on growth, morphological structure, and physiological processes. SA levels were 0, 0.25, 0.50, and 1 mM in the presence of salinity levels of 10, 35, and 70 mM NaCl, respectively. Vegetative growth indices, including stem cross-sectional area, leaf area, and total dry weight, were lowered by salinity treatments. However, SA applications greatly improved morphological characteristics and plant growth under salt stress. The effects of salinity were effectively reversed by SA treatment at 1 mM compared to control and other treatments. Interestingly, SA applications enhanced the chlorophyll, total phenolic, carbohydrate, and proline contents of leaves while decreasing electrolyte leakage (EL), Na, and Cl levels. Moreover, the foliar SA treatments enhanced the nutrient content in the leaves and increased the activities of peroxidase (POD) and catalase (CAT), with a decrease in malondialdehyde (MDA) content. This study suggests that the alleviation of the salinity stress by SA may be due to the activation of the antioxidant enzymatic mechanism and decrease in the lipid peroxidation of the pomegranate plant.

Graphical Abstract

1. Introduction

Salinity as abiotic stress is a persistent and serious hazard to agriculture around the world and generally includes morphological (for example, decreased growth and production), physiological (for example, reduced gas exchange indices), and biological (e.g., oxidative stress with responses to high ROS levels) changes [1,2,3]. In addition, there is an absence of Na+ and Cl in salinity stress conditions. This can cause ionic imbalance, ionic toxicity, and physiological problems [4]. Among abiotic stresses, salinity is recognized as one of the major limiting factors, causing a reduction in growth and biomass, changes in water status, chlorophyll degradation, changes in transpiration and respiration, malfunctions in stomatal functions, and ion ratio disequilibrium [5]. Furthermore, under saline conditions, plants produce cytotoxically activated oxygen, which may seriously disrupt healthy metabolisms due to oxidative damage to proteins, lipids, and nucleic acids [6]. Salinity stress may also result in an increase in the intracellular production of ROS, such as hydroxyl radicals and superoxide radicals [7]. Plants respond to this oxidative stress by developing a variety of defense mechanisms, which include antioxidant enzymes that alleviate potentially cytotoxic forms of activated oxygen [8]. Several approaches have been taken to mitigate the negative effects of salt on plants, including plant breeding, as well as the use of transgenic plants [4], chemical primers [9], salicylic acid [10], and microorganisms [11,12,13].
Salicylic acid (SA) is considered a hormone that acts as a common signaling compound in plants, protecting them against a range of biotic and abiotic challenges [14]. It was revealed that SA regulates several physiological processes in plants, such as photosynthetic rate, cell membrane permeability, pigment content, and ion uptake [15,16]. Spraying plants with salicylic acid is important as a possible growth regulator in enhancing plant tolerance to severe salt stress [17]. Several studies have found that SA affects water content and gas exchange indices [18], enhances phenolic accumulation and proline content [19], improves oxidative stress resistance [20], and may reduce osmotic stress [1].
Pomegranate (Punica granatum L.) is among the most widely grown edible fruit crops, possessing several nutritive and medicinal properties [21]. The majority of pomegranate plants are planted in dry and semiarid environments in which salinization may have evolved as a result of irrigation [22,23]. In general, pomegranates are salt-tolerant plants [24]; however, cultivars exhibit a considerable difference. Pomegranate was shown to be moderately sensitive to salt, and water for irrigation of fruit trees should not exhibit an electrical conductivity (EC) greater than two dSm−1 (20 mM) [22]. Previous research has demonstrated that salt stress inhibits pomegranate development and growth [22]. Naeini et al. [25] found that salty water decreased leaf surface, stem length, internode number, and length of “Alak Torsh” and “Malas Torsh” pomegranate. Seven-year-old “Wonderful” pomegranate had greater growth reduction after saline water irrigation at 6.0 dSm−1 (60 mM) [26]. Sun et al. [27] reported that the chlorophyll content and the relative water content of pomegranate leaves reduced dramatically as soil salinity increased. Interestingly, irrigation with salty water can increase the antioxidant value, sugar content, acidity, and medicinal characteristics of salt-tolerant pomegranate fruits [28]. As a result, identifying salt-tolerant cultivars is critical in pomegranate production and breeding. However, to the best of our knowledge, the effect of SA foliar application on pomegranate growth, nutrient uptake, and salinity tolerance index under salinity conditions has not yet been investigated. Hence, a study was carried out to elucidate whether foliar salicylic acid treatments may mitigate salt stress in pomegranate plants. We investigated the effect of foliar SA application on plant growth, chlorophyll, activities of plant defense-related enzymes, electrolyte leakage, and mineral content in pomegranate cultivated under salinity stress. In addition, the salt tolerance index was screened for all analyzed traits to determine whether the trait(s) could be used as indicators of salt resistance in pomegranate plants.

2. Materials and Methods

2.1. Plant Material and Growth Conditions

The experiment was conducted on an experimental plot at the Faculty of Agriculture, University of Alexandria, Egypt, during the 2019 and 2020 growing seasons. The experimental plants were one-year-old ‘Wonderful’ pomegranate (Punica granatum, L.). On 28 March, 60 uniform plants were randomly distributed to 5 blocks containing 12 plants in each season. The plants were individually planted in black plastic bags containing approximately 4 kg of sandy soil. The soil was treated with 5 mL/L commercial fertilizer (11% N:6% P:8% K), and each pot received 500 mL of the nutrient solution. A 50 cm wide strip area encircled the plastic bags to prevent overlap of foliar spray treatment. A volume of 500 mL per plant of salty water was used to irrigate the plants twice a week (every 3–4 days) for 90 days. Three salt treatments were used: 10 mM (control), 35, and 70 mM NaCl. After a week of salt applications, a foliar spray was applied once a week using a handgun sprayer in concentrations of 0 (control), 0.25, 0.50, and 1 mM (3 L in volume) until drop off [29] for 11 weeks.

2.2. Growth Parameters

At the end of the experiment, the total growth of the experimental plants was determined. The stem circumference at the soil surface was determined, and each plant’s stem cross-sectional area (SCSA) was calculated. The leaf area of ten leaves at the middle of the branches of each experimental plant was measured using a planimeter (PLACOM, KP-90N, Heijima, Nagaoka-shi, Niigata, Japan). Finally, the plants were carefully harvested, and the leaves, stems, and roots were detached and dried in an oven at 70 °C for 48 h before recording the dry weights.

2.3. Chlorophyll, Phenol, Carbohydrate, and Proline Content and Peroxidase, and Catalase Activities

A sample of five leaves was taken to determine total leaf chlorophyll content according to Moran [30]. A volume of 5 mL of N-N dimethylformamide was added to 1 g of fresh pomegranate leaves and placed in a refrigerator for 24 h. Following centrifugation at 4000× g for 15 min, the optical density was calculated using a spectrophotometer at 647 and 664 nm. Total phenolics were measured in leaves using the Folin–Ciocalteau method; 1 mL of the sample was combined with 1 mL of Folin–Ciocalteu’s phenol reagent. After 5 min, 10 mL of sodium carbonate (7.5%) solution was added to the mixture, followed by 13 mL of deionized distilled water, and thoroughly mixed. The mixture was kept in the dark for 90 min at 23 °C before measuring the absorbance at 750 nm. Total phenolics were calculated from a standard curve of gallic acid and expressed as a percentage on a dry-weight basis [31,32]. Total carbohydrates were quantified in a half gram of dried leaf material from each plant. The total carbohydrates were estimated using the Nelson–Somogyi technique in oven-dried samples, as reported by Thimmaiah [33]. The proline was measured spectrophotometrically according to Bates [34]. A plant sample (0.5 g) was extracted in sulfosalicylic acid (5%), followed by centrifugation at 10,000× g for 7 min. The supernatants were diluted with water, mixed with 2 mL of ninhydrin and 2 mL of glacial acetic acid, heated at 100 °C for one hour, and then cooled. Toluene (4 mL) was then added to the mixture, and the upper aqueous phase was spectrophotometrically assayed at 520 nm. CAT and POD activities were measured in fresh leaf samples. For CAT, fresh leaf samples (0.05 g) were homogenized in 2 mL phosphate buffer (100 mmol L−1, pH 6.8) and centrifuged for 15 min at 17,000× g. A volume of 100 μL of the supernatant was added to a 3 mL reaction mixture containing 50 mmol L−1 phosphate buffer (pH 6.8) and 15 mmol L−1 H2O2 as substrate. The decrease in absorbance at 240 nm was measured for 2 min. Enzyme activity was expressed as μmol H2O2 decomposed g−1 FW min−1 [35]. For POD, the 3 mL reaction mixture contained 25 mmol L−1 phosphate buffer (pH 6.8), 40 mmol L−1 H2O2, 20 mmol L−1 guaiacol, and 10 μL of the enzyme extract. The reaction was started by the addition of H2O2, and changes in the absorbance at 470 nm were measured for 2 min. [35,36].

2.4. Malondialdehyde (MDA) Content, Electrolyte Leakage (EL), and Mineral Content in Leaves

Malondialdehyde (MDA) content (lipid peroxidation level) was estimated using a method described by Guidi et al. [37], and its concentration was expressed as mol g−1. Approximately 0.5 g was homogenized in 1.5 mL of 0.1% trichloroacetic acid (TCA). After centrifuging the homogenate for 10 min at 12,000× g, 1 mL supernatant was added to 4 mL 20% TCA and 0.025 mL 0.5% TBA. The reaction was stopped by placing the reaction tubes in an ice-water bath after 30 min of incubation at 90 °C in a water bath. After centrifuging the samples at 12,000× g for 10 min, the absorbance of the supernatant was measured at 532 nm. Membrane permeability was estimated by determining electrolyte leakage (EL) at the end of the experiment using mature leaves and the method of Ahmed and Palta and Khalil et al. [38,39]. Leaves (0.2 g) were cleaned with distilled water before being immersed in a test tube with 30 mL of distilled water for 12 h. The test tubes were incubated in a water bath at 32 °C for 2 h, and the initial electrical conductivity (EC1) of the medium was measured. All the samples were autoclaved at 121 °C for 20 min and cooled to 25 °C. Subsequently, the final electrical conductivity (EC2) was measured using a conductometer (GLP 31, CRISON, EEC). EL was calculated using the following formula (Dionisio-Sese and Tobita, 1998): EL% = EC1/EC2 × 100.
Mineral elements were determined by digesting 0.1 g of dried ground material from each plant’s leaf tissue with H2SO4 and H2O2, as reported by Evenhuis and Dewaard [40]. Total N and P were calorimetrically determined in this digested solution using a spectrophotometer, as described by Evenhuis [40] and Murphy and Riley [41], respectively. A flame photometer was used to assess plant K and Na levels, and a Perkin Elmer atomic absorption spectrophotometer was used to evaluate the Ca and Mg contents. Cl was measured using Jackson and Brown’s [42] silver nitrate technique. The contents of Na, P, K, Ca, Mg, Na, and Cl were expressed as percentages.

2.5. Salt Tolerance Index (STI)

The percentage of salt tolerance index (STI) for all the investigated characters was calculated using the following formula:
STI = (Tsalt/Tcont.) ∗ 100
where Tsalt is the mean value of the character under the highest utilized salinity level (70 mM), and Tcont is the mean value of the character under the control treatment (10 mM) [43].

2.6. Statistical Analysis

A split-plot experimental design was used, with salinity levels representing the main plot and the salicylic acid doses representing the subplot. The data from different salinity levels and salicylic acid sprays from the years 2019 and 2020 were analyzed using analysis of variance (ANOVA), as implemented in SPSS, V.18 PASW. The least significant differences (LSD) at a probability level of 0.05 were used to determine treatment differences.

3. Results

3.1. Morphological Performance

The use of tap water (control) containing 10 mM (control) NaCl for irrigation and three spray dosages of SA (0.25, 0.50, and 1 mM) revealed that SA had a positive influence on all evaluated morphological indices in the two seasons, as compared to the control treatment (0 mM SA and 10 mM NaCl) (Table 1 and Table 2).
Salt stress at 35 and 70 mM NaCl caused a significant decrease in stem cross-sectional area, leaf area, and total dry weight in pomegranate plants compared with the control (10 mM). For example, in the first season, the leaf area was lowered from 25.8 to 15.8 cm2 when the salinity level (NaCl) was increased from 10 mM (control) to 70 mM NaCl without the use of SA (0 mM SA). SA treatments significantly mitigated the morphological stress impacts of salt in both seasons by increasing stem cross-sectional area, leaf area, and total dry weight (Table 2). Elevated SA dosages (0.50 and 1 mM) were more efficient in improving overall morphological indices under salt stress (35 and 70 mM NaCl). For example, in the second season, leaf area increased from 30.1 to 53.3 cm2 and from 24.1 to 50.2 cm2 when sprayed with 1 mM SA, whereas 0.25 mM SA resulted in lower values in both seasons. Furthermore, the stem cross-sectional area significantly increased after SA treatments in both seasons under salinity conditions. Total dry weight followed a similar pattern to those of stem cross-sectional area and leaf area.

3.2. Chlorophyll, Phenol, Carbohydrate, and Proline Content

The results concerning the effect of saline irrigation and SA foliar spray on the chlorophyll, phenol, carbohydrate, and proline content of pomegranate plants are presented in Table 1 and Table 3. Compared to plants that were not treated with SA, total chlorophyll content increased considerably after spraying SA at 0.25–1 mM under 10, 35, and 70 mM NaCl (Table 3) conditions. Plants exposed to 10 mM NaCl and 0.50–1 mM SA showed the highest chlorophyll levels in both seasons. Furthermore, 0 mM SA treatments resulted the lowest chlorophyll content values compared to plants treated with SA at 10, 35, and 70 mM. In the first and second seasons, plants irrigated with 70 mM NaCl and treated with 0 mM SA had 151.7 and 131.2 mg g−1 FW of leaf total chlorophyll content, respectively, compared to 170.3 and 168.9 mg g−1 FW in the 0.50 mM SA treatment. SA spraying at 0.25–1 mM significantly improved the phenolic content of treated plants in both experimental seasons compared to 0 mM SA in the control treatment (10 mM NaCl). Compared to control plants, the phenolic content was increased by a saline treatment at 35 mM NaCl. Under salinity stress treatment (35 mM NaCl), SA treatments at 0.50 and 1 mM significantly increased phenolic contents in comparison to plants exposed to 35 mM NaCl and 0 mM SA.
Furthermore, at 70 mM NaCl salinity, SA sprays at 0.25–1 mM increased phenolic content compared to 70 mM NaCl and 0 mM SA-treated plants. Foliar treatments of 0.50 and 1 mM SA were shown to be the optimum treatments in both seasons for increasing total carbohydrates in the leaves of pomegranate plants grown under 10, 35, and 70 mM NaCl compared to 0 mM SA-treated plants. According to the mean values shown in Table 3, salt levels significantly increased the proline content of pomegranate leaves, reaching a peak when plants were raised under 70 mM NaCl in the two seasons. With 10, 35, and 70 mM NaCl and 1 mM SA, the proline content of the leaves increased significantly in both seasons compared to 0, 0.25, and 0.50 mM SA-treated plants.

3.3. Activities of Key Plant Defense-Related Enzymes

According to the mean values presented in Figure 1 and Figure 2, increased salt levels considerably increased the activity of the CAT and POD enzymes, which peaked when pomegranate plants were grown under 70 mM NaCl in both experimental seasons. Activities of POD and CAT showed significant increases following SA treatments at 0.25, 0.50, and 1 mM (Figure 1 and Figure 2). SA sprays at 1 mM resulted in the highest enzyme activity compared to lower dosages (0, 0.25, and 0.50 mM SA).

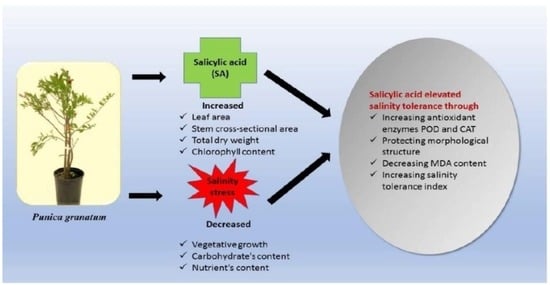
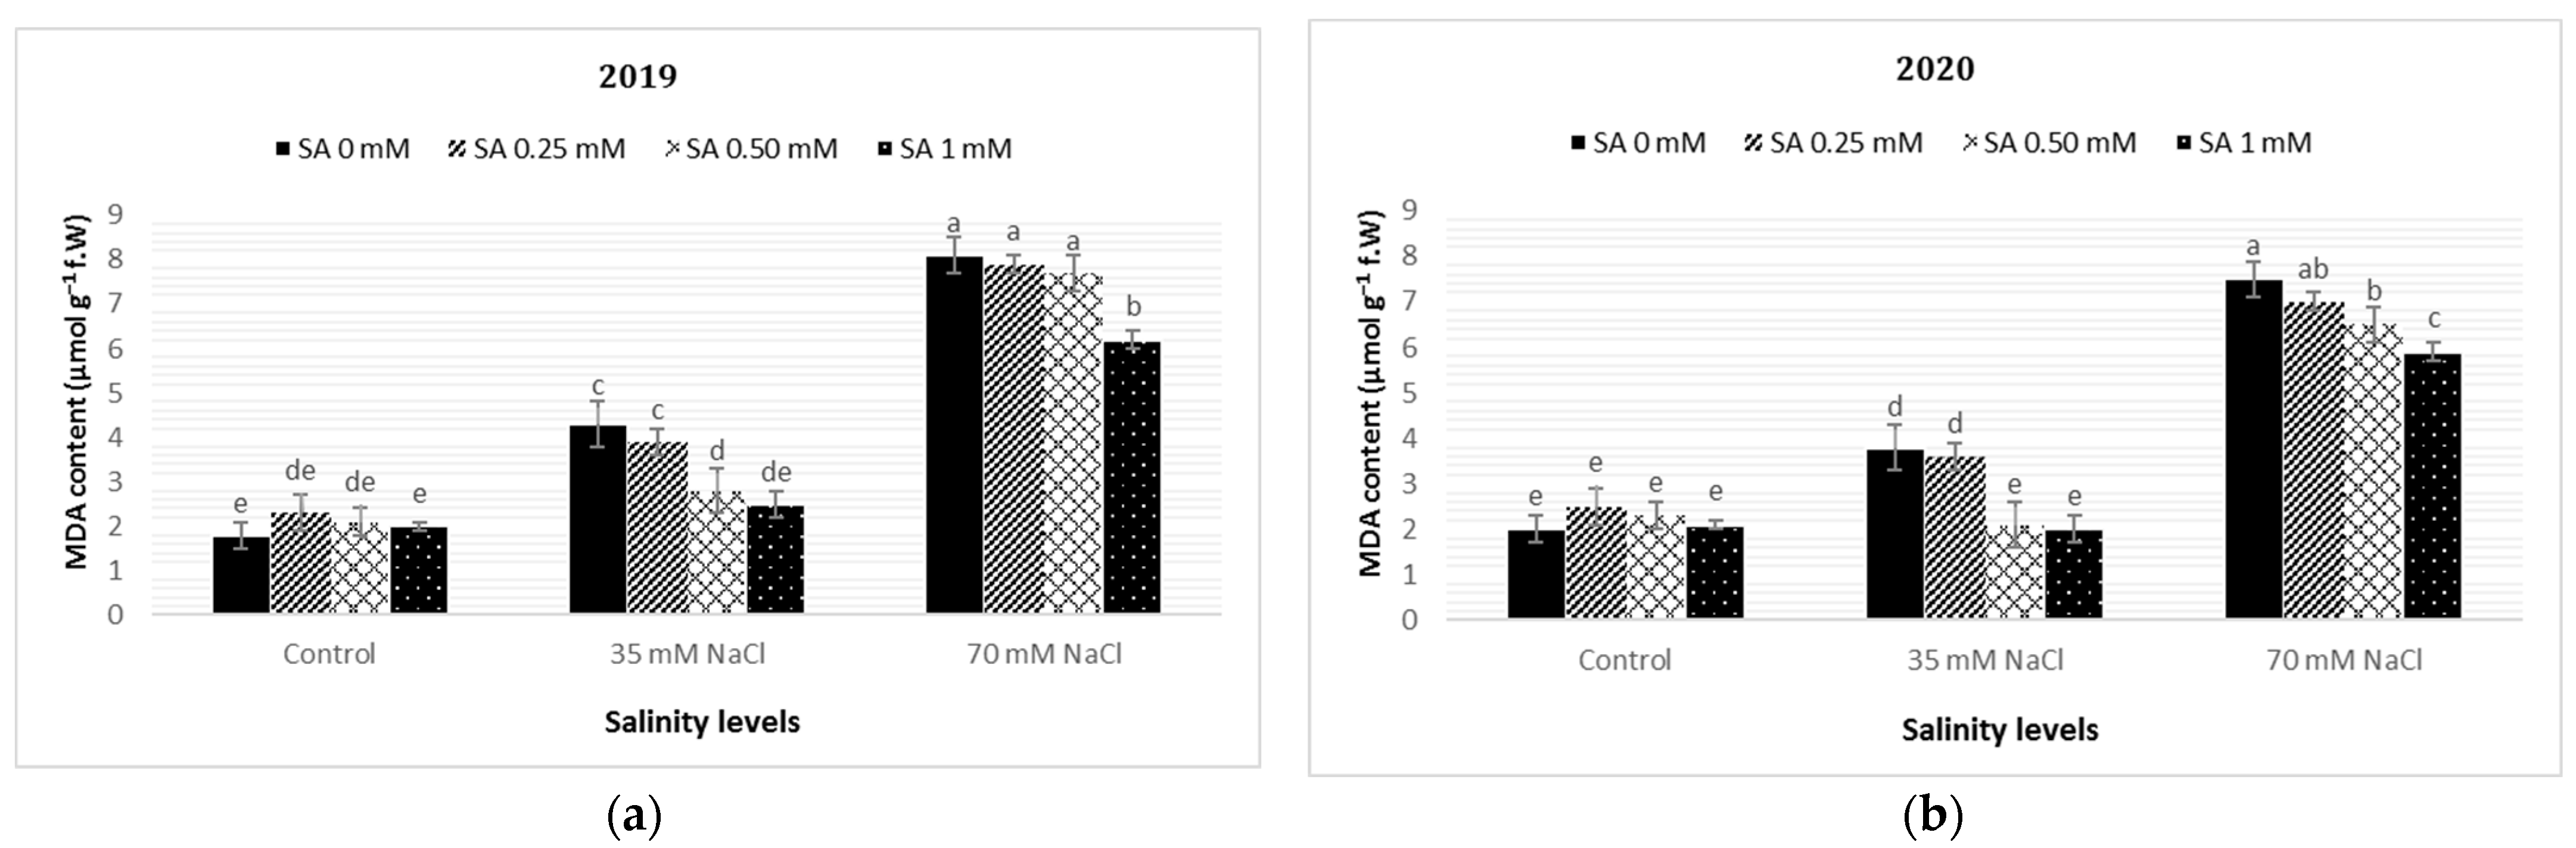
3.4. Malondialdehyde (MDA) Content, Electrolyte Leakage (EL), and Mineral Content in Leaves

Figure 3 shows salinity stress-induced membrane lipid peroxidation damage in pomegranate leaves. For instance, in the first season, the malondialdehyde (MDA) content increased by 138.8 and 350.0% under the 35 mM and 70 mM NaCl conditions, respectively. Malondialdehyde content decreased significantly following SA spraying at 0.25–1 mM under 35 and 70 mM NaCl compared to plants untreated with SA. MDA content did not differ significantly amongst SA treatments and water-treated (without SA) plants under non-saline conditions (Figure 3).
Salt levels of 35 and 70 mM NaCl significantly increased electrolyte leakage compared to the control (10 mM NaCl). Foliar SA-treated plants had lowered EL values compared to untreated plants. The EL values of foliar SA-treated plants were lower than those of untreated plants. Compared to the control (0 mM SA), the 0.25, 0.50, and 1 mM SA applications decreased EL. Under non-saline conditions, there were no significant differences between treatments regarding EL (Table 1 and Table 4).
The concentrations of some plant nutrients in pomegranate leaves in response to SA treatments are shown in Table 1, Table 4 and Table 5. In both experimental seasons, the sodium and chloride content of the leaves differed significantly among treatments (Table 4). In both seasons, there was a marked decline in sodium and chloride contents in plants grown under 10 mM NaCl and 0.50–1 mM SA in comparison with the control treatment (0 mM SA). Salicylic acid treatments at 0.50–1 mM considerably lowered Na+ and Cl contents in the leaves under 35 and 70 mM NaCl saline conditions compared to SA treatments at 0 and 0.25 mM. Salt stress decreased the mineral content (N, P, K, Ca, and Mg) in leaves of pomegranate plants regardless of SA treatment. Mineral concentrations in pomegranate leaves were higher in SA-treated plants than in untreated plants (Table 5). Generally, the most significant mineral content (N, P, K, Ca, and Mg) values were obtained from 0.50 and 1 mM SA treatments across the two seasons. The leaves of pomegranate plants treated with SA had higher N and P levels under non-saline conditions, although K, Ca, and Mg concentrations were unaffected by SA treatments.

3.5. Salt Tolerance Index (STI) Percentage

Table 6 shows the salt tolerance index percentages of all examined features in the two seasons compared to the mean values under non-saline conditions and the mean values under the highest salinity level (70 mM). When compared to salt stress index percentages of other characteristics, electrolyte leakage was the most responsive trait to salinity stress, with values of 343.72% and 275.27% in 2019 and 2020, respectively (Table 6). Sodium and chloride content in both seasons and CAT in the second season were in second place for salt tolerance index percentages (salinity response), with no statistically significant changes. Furthermore, proline and phenolic composition responded to salt in the same way, followed by CAT and POD in the first season and total dry weight and magnesium in the second season. Moreover, stem cross-sectional area, leaf area, total dry weight, chlorophyll, carbohydrate, N, P, K, Ca, and Mg did not differ significantly terms of the salt tolerance index. The lowest salt tolerance index percentages in response to salinity stress were leaf area and phosphorus content.

4. Discussion

Pomegranate plant growth was significantly decreased when salt levels increased. This decline can be related to salt accumulation in plant tissues and reduced vegetative growth; this is in line with previous results [44,45,46]. In the current study, salinity had a detrimental impact on stem cross-sectional area, leaf area, and total dry weight (Table 1), and this might be due to a decrease in chlorophyll, N, P, and K content with increased leaf sodium content (Table 3 and Table 4). Salt stress limits plant development and morphology by affecting several features of physiology and biochemistry, including photosynthesis, antioxidant responses, proline metabolism, and osmolyte accumulation [47,48]. Under the influence of saline stress, plants activate several mechanisms that provide a level of resistance to these stresses. Such mechanisms include increasing the amount of certain osmotic substances, such as proline, and enhancing the osmotic pressure and activity of cells’ oxygen-oxidizing enzymes [49], which play an important role in reactive oxygen species (ROS) scavenging, among the most significant indicators of oxidation caused by saline stress [50,51]. This is consistent with the findings of the present study (Table 3 and Figure 1 and Figure 2). The enhanced vegetative growth of numerous crops as a result of SA treatments has been well documented [48,52,53]. Yildrimi et al. [52] reported that foliar SA treatments at various doses (0.25–1 mM) were effective in improving shoot diameter, leaf number per plant, fresh and dry weights, and the plant’s total growth in cucumber seedlings under salt stress conditions. Irrigation of pomegranate plants with saline water (35–70 mM NaCl) resulted in considerable increases in leaf proline, phenol, Na+, and Cl contents. Surprisingly, SA applications at 0.50–1 mM alleviated the effects of salinity stress, leading to a considerable increase in chlorophyll, carbohydrates, total phenolic composition, leaf proline contents, N, P, K, Ca, and Mg, as well as reductions in electrolyte leakage, Cl, and Na+ (Table 1, Table 2, Table 3 and Table 4).
In the present investigation, SA-treated plants had significantly higher chlorophyll content attributes than untreated plants. These findings are in line with those of El-Tayeb [54], Yildirim et al. [52], and Khokon [55]. These authors found that applying SA to barley and maize leaves increased their chlorophyll content under salinity conditions. Khodary [56] found that the concentrations of chlorophyll a and b and carotenoids increased after foliar SA application, which increased photosynthesis under salinity stress. According to previous studies, the phenolic content of pomegranate leaves is enhanced in response to salt and SA treatments [4,57]. In artichoke plants, salt and SA may enhance flavonoid content (phenolic substance) and the activity of antioxidants [57]. The increase in carbohydrates after SA treatments under salinity treatment reflects improved stress tolerance, consistent with earlier findings that revealed that carbohydrate buildup can serve as an index of osmotic adjustment, scavenging as an indicator of ROS, and plant stress resistance [4,58]. Furthermore, SA application increased proline content in the leaves, a well-known osmolyte that increases under stressed conditions [59]. An enhancement in the activity of the antioxidant system in plants is typically connected with improved stress tolerance [60]. Under salt stress conditions, several antioxidant enzymes, including CAT and POD, showed increased activity in response to SA treatments [1,18,61,62]. This might be the first study to indicate that SA can increase antioxidant enzyme activity in salinized pomegranate plants (CAT and POD). These findings are consistent with those of He and Zhu [63], who observed that exogenous SA treatments reduce NaCl toxic effects while enhancing the antioxidant enzyme activity (CAT and POD) of tomatoes. In our study, salt stress significantly increased electrolyte leakage (EL). However, SA treatments reduced EL in pomegranate plants (Table 3). Malonaldehyde (MDA) content is typically considered an essential indication of lipid peroxidation [64]. In this study, saline conditions (35 mM NaCl) dramatically increased the MDA concentration in pomegranate plants, indicating that salt stress-induced significant oxidative injury in the lipid membranes of these plant (Figure 3). SA enhanced CAT and POD activities, lowering ROS and, which enhanced CAT and POD activities and, consequently, reduced oxidative injury to membranes. These study results are consistent with previous reports [48,64,65].
Previous research found that exogenous SA treatments might reduce membrane damage in plants subjected to saline conditions, suggesting that SA contributes to the maintenance of membrane function [18,66]. According to El-Tayeb [54], the reduction in membrane damage in plants exposed to salinity, drought, or cold in reaction to exogenous SA is probably due to the stimulation of antioxidant mechanisms that protect the plant against oxidation stress. In our study, SA increased Ca concentration in pomegranate leaves compared to the control when subjected to salinity stress (Table 4). Calcium is essential for functions that preserve plant membrane structural and functional integrity and cell wall structure, control selectivity and ion transport, and regulate ion-exchange behavior and the activity of cell membrane enzymes [67]. Our findings demonstrate that salt stress increased Na+ and Cl levels while decreasing N, P, K, Ca, and Mg in pomegranate plant leaves independent of SA treatment. (Table 3 and Table 4). These results are in agreement with those reported in previous studies [46,68,69]. However, SA treatments reduced plant Na+ and Cl absorption under salt stress conditions while increasing plant N, P, K, Ca, and Mg uptake. (Table 3 and Table 4). Lowering the Na+ and Cl levels in SA applications may result in less membrane damage, a higher water content, and dry matter formation. These findings are consistent with those reported by El-Tayeb, Maan et al. [54,70], who showed that SA treatment lowered sodium and increased phosphorus, potassium, and calcium levels in leaves of barley seedlings subjected to salinity stress. Salicylic acid can regulate the intake of numerous plant-beneficial elements, such as N, P, K, Ca, and Mg, hence reducing oxidative stress [71,72], increasing the photosynthesis process [73], and maintaining higher K+/Na+ and Ca2+/Na+ ratios [74] under abiotic stress. With regards to salinity tolerance index percentage, the investigated characteristics can be categorized into two groups based on salinity tolerance index values (Table 5). The first category includes characteristics with salinity tolerance index percentages more than 100%, such as ion leakage, Na content, Cl content, proline, CAT, and POD, which decreased in the two seasons of the investigation. The second group includes characteristics that exhibited a salinity tolerance index percent less than 100% in both seasons of investigation, such as SCSA, leaf area, total dry weight, chlorophyll, carbohydrate content, N, P, K, Ca, and Mg. According to high salinity tolerance index values for ion leakage and Na and Cl contents, it could be suggested that such characteristics could be used as precise indications of pomegranate plants’ response to salt stress. No research papers have examined the salinity tolerance index as a salinity-response indication in pomegranate plants. Therefore, this study represents the first time that STI percentage has been determined in a variety of pomegranate plant traits, which might be helpful for plant breeders.

5. Conclusions

This research indicates the negative effects of increasing salinity levels on inhibiting growth traits and bioactivity of pomegranate plants. Furthermore, it was revealed that foliar application of SA might be considered a valuable treatment for mitigating the deleterious effects of salinity stress by enhancing antioxidant enzyme activity, mineral nutrient uptake, chlorophyll content, total phenolic composition, and proline and carbohydrate compositions of leaves, as well as decreasing sodium, chloride, and membrane injuries of pomegranate plants. In addition, according to the STI percent values, the level of electrolyte leakage and sodium and chloride content of the leaves might be good indications of the pomegranate plant’s response to salt stress.

Author Contributions

Conceptualization, H.A.K., D.O.E.-A. and Z.F.R.A.; methodology and investigation, H.A.K.; data curation, H.A.K. and Z.F.R.A.; writing—original draft preparation, H.A.K.; writing—review and editing, H.A.K.; review and editing, Z.F.R.A.; supervision, H.A.K. and Z.F.R.A.; funding acquisition, H.A.K. and Z.F.R.A. All authors have read and agreed to the published version of the manuscript.

Funding

This research was funded by the Science & Technology Development Fund, STDF-IRD Joint Innovation Projects, Fund No. 4652, Egypt, with partial funding from UAE University, Fund No G00003332.

Institutional Review Board Statement

Not applicable.

Informed Consent Statement

Not applicable.

Data Availability Statement

Not applicable.

Acknowledgments

The authors are grateful to the project: Collective action and agricultural productivity in Egypt’s new lands (Nasr canal area); Science & Technology Development Fund, STDF-IRD Joint Innovation Projects for providing the fund equipment and laboratory activities for this study. The gratitude is extended to the College of Agriculture and veterinary Medicine, United Arab Emirates University, for partly funding this project.

Conflicts of Interest

The authors declare that no conflict of interest and that they have no known competing financial interests or personal relationships that could have appeared to influence the work reported in this paper.

References

  1. Nazar, R.; Iqbal, N.; Syeed, S.; Khan, N.A. Salicylic acid alleviates decreases in photosynthesis under salt stress by enhancing nitrogen and sulfur assimilation and antioxidant metabolism differentially in two mungbean cultivars. J. Plant Physiol. 2011, 168, 807–815. [Google Scholar] [CrossRef]
  2. Khan, M.I.R.; Asgher, M.; Khan, N.A. Alleviation of salt-induced photosynthesis and growth inhibition by salicylic acid involves glycinebetaine and ethylene in mungbean (Vigna radiata L.). Plant Physiol. Biochem. 2014, 80, 67–74. [Google Scholar] [CrossRef]
  3. Acosta-Motos, J.R.; Ortuño, M.F.; Bernal-Vicente, A.; Diaz-Vivancos, P.; Sanchez-Blanco, M.J.; Hernandez, J.A. Plant responses to salt stress: Adaptive mechanisms. Agronomy 2017, 7, 18. [Google Scholar] [CrossRef] [Green Version]
  4. Gupta, B.; Huang, B. Mechanism of salinity tolerance in plants: Physiological, biochemical, and molecular characterization. Int. J. Genom. 2014, 2014, 701596. [Google Scholar] [CrossRef]
  5. El-Esawi, M.A.; Alayafi, A.A. Overexpression of Rice Rab7 Gene Improves Drought and Heat Tolerance and Increases Grain Yield in Rice (Oryza sativa L.). Genes 2019, 10, 56. [Google Scholar] [CrossRef] [Green Version]
  6. Elkelish, A.A.; Alnusaire, T.S.; Soliman, M.H.; Gowayed, S.; Senousy, H.H.; Fahad, S. Calcium availability regulates antioxidant system, physio-biochemical activities and alleviates salinity stress mediated oxidative damage in soybean seedlings. J. Appl. Bot. Food Qual. 2019, 92, 258–266. [Google Scholar]
  7. Al Hassan, M.; Chaura, J.; Donat-Torres, M.P.; Boscaiu, M.; Vicente, O. Antioxidant responses under salinity and drought in three closely related wild monocots with different ecological optima. AoB Plants 2017, 9, plx009. [Google Scholar] [CrossRef]
  8. Mahmud, J.A.; Bhuyan, M.; Anee, T.I.; Nahar, K.; Fujita, M.; Hasanuzzaman, M. Reactive oxygen species metabolism and antioxidant defense in plants under metal/metalloid stress. In Plant Abiotic Stress Tolerance; Springer: Berlin/Heidelberg, Germany, 2019; pp. 221–257. [Google Scholar]
  9. Savvides, A.; Ali, S.; Tester, M.; Fotopoulos, V. Chemical priming of plants against multiple abiotic stresses: Mission possible? Trends Plant Sci. 2016, 21, 329–340. [Google Scholar] [CrossRef] [Green Version]
  10. Samy, M.; Shaimaa, F.; Hoda, A.K. Effect of salicylic acid on growth and physiological status of salt stressed sour orange seedlings (Citrus aurantium L.). Alex. J. Agric. Sci. 2015, 60, 229–239. [Google Scholar] [CrossRef]
  11. Khalil, H.; El-Ansary, D. Morphological, physiological and anatomical responses of two olive cultivars to deficit irrigation and mycorrhizal inoculation. Eur. J. Hortic. Sci. 2020, 85, 51–62. [Google Scholar] [CrossRef] [Green Version]
  12. Khalil, H.A. Influence of vesicular-arbuscula mycorrhizal fungi (Glomus spp.) on the response of grapevines rootstocks to salt stress. Asian J. Crop Sci. 2013, 5, 393–404. [Google Scholar] [CrossRef] [Green Version]
  13. Khalil, H.A.; Eissa, A.M.; El-Shazly, S.M.; Nasr, A.M.A. Improved growth of salinity-stressed citrus after inoculation with mycorrhizal fungi. Sci. Hortic. 2011, 130, 624–632. [Google Scholar] [CrossRef]
  14. Hara, M.; Furukawa, J.; Sato, A.; Mizoguchi, T.; Miura, K. Abiotic Stress and Role of Salicylic Acid in Plants. In Abiotic Stress Responses in Plants: Metabolism, Productivity and Sustainability; Ahmad, P., Prasad, M.N.V., Eds.; Springer: New York, NY, USA, 2012; pp. 235–251. [Google Scholar]
  15. Per, T.S.; Fatma, M.; Asgher, M.; Javied, S.; Khan, N.A. Salicylic Acid and Nutrients Interplay in Abiotic Stress Tolerance. In Salicylic Acid: A Multifaceted Hormone; Nazar, R., Iqbal, N., Khan, N.A., Eds.; Springer: Singapore, 2017; pp. 221–237. [Google Scholar]
  16. Hayat, S.; Ahmad, A. Salicylic Acid-A Plant Hormone; Springer Science & Business Media: Berlin/Heidelberg, Germany, 2007. [Google Scholar]
  17. Hussein, M.; Rezk, A.; AB, E.-N.; HM, M. Nutritional and growth response of canola plants to salicylic acid under salt stress conditions. Int. J. ChemTech Res. 2015, 8, 574–581. [Google Scholar]
  18. Stevens, J.; Senaratna, T.; Sivasithamparam, K. Salicylic acid induces salinity tolerance in tomato (Lycopersicon esculentum cv. Roma): Associated changes in gas exchange, water relations and membrane stabilisation. Plant Growth Regul. 2006, 49, 77–83. [Google Scholar]
  19. Kováčik, J.; Grúz, J.; Bačkor, M.; Strnad, M.; Repčák, M. Salicylic acid-induced changes to growth and phenolic metabolism in Matricaria chamomilla plants. Plant Cell Rep. 2009, 28, 135–143. [Google Scholar] [CrossRef]
  20. Li, T.; Hu, Y.; Du, X.; Tang, H.; Shen, C.; Wu, J. Salicylic acid alleviates the adverse effects of salt stress in Torreya grandis cv. Merrillii seedlings by activating photosynthesis and enhancing antioxidant systems. PLoS ONE 2014, 9, e109492. [Google Scholar] [CrossRef] [PubMed]
  21. da Silva, J.A.T.; Rana, T.S.; Narzary, D.; Verma, N.; Meshram, D.T.; Ranade, S.A. Pomegranate biology and biotechnology: A review. Sci. Hortic. 2013, 160, 85–107. [Google Scholar] [CrossRef]
  22. Bhantana, P.; Lazarovitch, N. Evapotranspiration, crop coefficient and growth of two young pomegranate (Punica granatum L.) varieties under salt stress. Agric. Water Manag. 2010, 97, 715–722. [Google Scholar] [CrossRef]
  23. Li, J.-G.; Pu, L.-J.; Zhu, M.; Zhang, R. The present situation and hot issues in the salt-affected soil research. Acta Geogr. Sin. 2012, 67, 1233–1245. [Google Scholar]
  24. Tavousi, M.; Kaveh, F.; Alizadeh, A.; Babazadeh, H.; Tehranifar, A. Effects of drought and salinity on yield and water use efficiency in pomegranate tree. J. Mater. Environ. Sc.i 2015, 6, 1975–1980. [Google Scholar]
  25. Naeini, M.; Khoshgoftarmanesh, A.; Fallahi, E. Partitioning of chlorine, sodium, and potassium and shoot growth of three pomegranate cultivars under different levels of salinity. J. Plant Nutr. 2006, 29, 1835–1843. [Google Scholar] [CrossRef]
  26. El-Khawaga, A.S.; Zaeneldeen, E.M.A.; Yossef, M.A. Response of Three Pomegranate Cultivars (Punica granatum L.) to Salinity Stress. Middle East J. Agric. Res. 2013, 1, 64–75. [Google Scholar]
  27. Sun, Y.; Niu, G.; Masabni, J.G.; Ganjegunte, G. Relative salt tolerance of 22 pomegranate (Punica granatum) cultivars. HortScience 2018, 53, 1513–1519. [Google Scholar] [CrossRef] [Green Version]
  28. Borochov-Neori, H.; Judeinstein, S.; Tripler, E.; Holland, D.; Lazarovitch, N. Salinity effects on colour and health traits in the pomegranate (Punica granatum L.) fruit peel. Int. J. Postharvest Technol. Innov. 2014, 4, 54–68. [Google Scholar] [CrossRef]
  29. Khalil, H.A.; Eldin, R.M.B. Chitosan improves morphological and physiological attributes of grapevines under deficit irrigation conditions. J. Hortic. Res. 2021, 29, 9–22. [Google Scholar] [CrossRef]
  30. Moran, R. Formulae for determination of chlorophyllous pigments extracted with N, N-dimethylformamide. Plant Physiol. 1982, 69, 1376–1381. [Google Scholar] [CrossRef] [Green Version]
  31. Singleton, V.L.; Rossi, J.A. Colorimetry of total phenolics with phosphomolybdic-phosphotungstic acid reagents. Am. J. Enol. Vitic. 1965, 16, 144–158. [Google Scholar]
  32. Ahmed, Z.F.R.; Alnuaimi, A.K.H.; Askri, A.; Tzortzakis, N. Evaluation of Lettuce (Lactuca sativa L.) Production under Hydroponic System: Nutrient Solution Derived from Fish Waste vs. Inorganic Nutrient Solution. Horticulturae 2021, 7, 292. [Google Scholar] [CrossRef]
  33. Thimmaiah, S.K.T.S.K. Standard Methods of Biochemical Analysis; Kalyani Pub.: New Delhi, India, 1999. [Google Scholar]
  34. Bates, L.S.; Waldren, R.P.; Teare, I. Rapid determination of free proline for water-stress studies. Plant Soil 1973, 39, 205–207. [Google Scholar] [CrossRef]
  35. Kar, M.; Mishra, D. Catalase, peroxidase, and polyphenoloxidase activities during rice leaf senescence. Plant Physiol. 1976, 57, 315–319. [Google Scholar] [CrossRef] [Green Version]
  36. Chen, L.-M.; Lin, C.C.; Kao, C.H. Copper toxicity in rice seedlings: Changes in antioxidative enzyme activities, H2O2 level, and cell wall peroxidase activity in roots. Bot. Bull. Acad. Sin. 2000, 41, 90–103. [Google Scholar]
  37. Guidi, L.; Tonini, M.; Soldatini, G.F. Effects of high light and ozone fumigation on photosynthesis in Phaseolus vulgaris. Plant Physiol. Biochem. 2000, 38, 717–725. [Google Scholar] [CrossRef]
  38. Ahmed, Z.F.; Palta, J.P. Lysophosphatidylethanolamine, a natural phospholipid, may retard senescence and improve the shelf life of banana fruit. HortScience 2010, 45, S66. [Google Scholar]
  39. Khalil, H.A.; Abdelkader, M.F.; Lo’ay, A.; El-Ansary, D.O.; Shaaban, F.K.; Osman, S.O.; Shenawy, I.E.; Osman, H.-E.H.; Limam, S.A.; Abdein, M.A. The Combined Effect of Hot Water Treatment and Chitosan Coating on Mango (Mangifera indica L. cv. Kent) Fruits to Control Postharvest Deterioration and Increase Fruit Quality. Coatings 2022, 12, 83. [Google Scholar] [CrossRef]
  40. Evenhuis, B.; de Waard, P. Paper 15 Principles and Practices in Plant Analysis. Soil Plant Test. Anal. 1980, 38, 152. [Google Scholar]
  41. Murphy, J.; Riley, J.P. A modified single solution method for the determination of phosphate in natural waters. Anal. Chim. Acta 1962, 27, 31–36. [Google Scholar] [CrossRef]
  42. Jackson, R.K.; Brown, J.G. Ante on the Potentionmetric Determination of Chloride; HortScience: Washington, DC, USA, 1955; pp. 65–178. [Google Scholar]
  43. Sbei, H.; Shehzad, T.; Harrabi, M.; Okuno, K. Salinity tolerance evaluation of Asian barley accessions (Hordeum vulgare L.) at the early vegetative stage. J. Arid Land Studies 2014, 24, 183–186. [Google Scholar]
  44. Mastrogiannidou, E.; Chatzissavvidis, C.; Antonopoulou, C.; Tsabardoukas, V.; Giannakoula, A.; Therios, I. Response of pomegranate cv. wonderful plants tο salinity. J. Soil Sci. Plant Nutr. 2016, 16, 621–636. [Google Scholar]
  45. Khayyat, M.; Tehranifar, A.; Davarynejad, G.H.; Sayyari-Zahan, M. Vegetative growth, compatible solute accumulation, ion partitioning and chlorophyll fluorescence of ‘Malas-e-Saveh’and ‘Shishe-Kab’pomegranates in response to salinity stress. Photosynthetica 2014, 52, 301–312. [Google Scholar] [CrossRef] [Green Version]
  46. Liu, C.; Zhao, X.; Yan, J.; Yuan, Z.; Gu, M. Effects of salt stress on growth, photosynthesis, and mineral nutrients of 18 pomegranate (Punica granatum) cultivars. Agronomy 2020, 10, 27. [Google Scholar] [CrossRef] [Green Version]
  47. Roussos, P.A.; Gasparatos, D.; Kyriakou, C.; Tsichli, K.; Tsantili, E.; Haidouti, C. Growth, nutrient status, and biochemical changes of sour orange plants subjected to sodium chloride stress. Commun. Soil Sci. Plant Anal. 2013, 44, 805–816. [Google Scholar] [CrossRef]
  48. Ma, X.; Zheng, J.; Zhang, X.; Hu, Q.; Qian, R. Salicylic acid alleviates the adverse effects of salt stress on Dianthus superbus (Caryophyllaceae) by activating photosynthesis, protecting morphological structure, and enhancing the antioxidant system. Front. Plant Sci. 2017, 8, 600. [Google Scholar] [CrossRef] [PubMed]
  49. Läuchli, A.; Grattan, S. Plant growth and development under salinity stress. In Advances in Molecular Breeding toward Drought and Salt Tolerant Crops; Springer: Berlin/Heidelberg, Germany, 2007; pp. 1–32. [Google Scholar]
  50. Parihar, P.; Singh, S.; Singh, R.; Singh, V.P.; Prasad, S.M. Effect of salinity stress on plants and its tolerance strategies: A review. Environ. Sci. Pollut. Res. 2015, 22, 4056–4075. [Google Scholar] [CrossRef] [PubMed]
  51. Zhang, M.; Smith, J.A.C.; Harberd, N.P.; Jiang, C. The regulatory roles of ethylene and reactive oxygen species (ROS) in plant salt stress responses. Plant Mol. Biol. 2016, 91, 651–659. [Google Scholar] [CrossRef]
  52. Yildirim, E.; Turan, M.; Guvenc, I. Effect of foliar salicylic acid applications on growth, chlorophyll, and mineral content of cucumber grown under salt stress. J. Plant Nutr. 2008, 31, 593–612. [Google Scholar] [CrossRef]
  53. Youssef, R.A.; El-Azab, M.E.; Mahdy, H.A.; Essa, E.M.; Mohammed, K. Effect of salicylic acid on growth, yield, nutritional status and physiological properties of sunflower plant under salinity stress. Int. J. Pharm. Phytopharm. Res. 2017, 7, 54–58. [Google Scholar]
  54. El-Tayeb, M. Response of barley grains to the interactive e. ect of salinity and salicylic acid. Plant Growth Regul. 2005, 45, 215–224. [Google Scholar] [CrossRef]
  55. Khokon, M.A.R.; Okuma, E.; Hossain, M.A.; Munemasa, S.; Uraji, M.; Nakamura, Y.; Mori, I.C.; Murata, Y. Involvement of extracellular oxidative burst in salicylic acid-induced stomatal closure in Arabidopsis. Plant Cell Environ. 2011, 34, 434–443. [Google Scholar] [CrossRef]
  56. Khodary, S. Effect of salicylic acid on the growth, photosynthesis and carbohydrate metabolism in salt stressed maize plants. Int. J. Agric. Biol. 2004, 6, 5–8. [Google Scholar]
  57. Bagherifard, A.; Bagheri, A.; Sabourifard, H.; Bagherifard, G.; Najar, M. The effect of salicylic acid on some morphological and biochemistry parameters under salt stress in herb artichoke (Cynara scolymus L.). Res. J. Fish. Hydrobiol. 2015, 10, 745–750. [Google Scholar]
  58. Yin, Y.-G.; Kobayashi, Y.; Sanuki, A.; Kondo, S.; Fukuda, N.; Ezura, H.; Sugaya, S.; Matsukura, C. Salinity induces carbohydrate accumulation and sugar-regulated starch biosynthetic genes in tomato (Solanum lycopersicum L. cv.‘Micro-Tom’) fruits in an ABA-and osmotic stress-independent manner. J. Exp. Bot. 2010, 61, 563–574. [Google Scholar] [CrossRef]
  59. Hayat, S.; Hayat, Q.; Alyemeni, M.N.; Wani, A.S.; Pichtel, J.; Ahmad, A. Role of proline under changing environments: A review. Plant Signal. Behav. 2012, 7, 1456–1466. [Google Scholar] [CrossRef] [PubMed] [Green Version]
  60. Wang, L.-J.; Li, S.-H. Thermotolerance and related antioxidant enzyme activities induced by heat acclimation and salicylic acid in grape (Vitis vinifera L.) leaves. Plant Growth Regul. 2006, 48, 137–144. [Google Scholar] [CrossRef]
  61. Szalai, G.; Páldi, E.; Janda, T. Effect of salt stress on the endogenous salicylic acid content in maize (Zea mays L.) plants. Acta Biol. Szeged. 2005, 49, 47–48. [Google Scholar]
  62. Khan, M.I.R.; Fatma, M.; Per, T.S.; Anjum, N.A.; Khan, N.A. Salicylic acid-induced abiotic stress tolerance and underlying mechanisms in plants. Front. Plant Sci. 2015, 6, 462. [Google Scholar] [CrossRef] [PubMed] [Green Version]
  63. He, Y.; Zhu, Z. Exogenous salicylic acid alleviates NaCl toxicity and increases antioxidative enzyme activity in Lycopersicon esculentum. Biol. Plant. 2008, 52, 792. [Google Scholar] [CrossRef]
  64. Shen, C.; Hu, Y.; Du, X.; Li, T.; Tang, H.; Wu, J. Salicylic acid induces physiological and biochemical changes in Torreya grandis cv. Merrillii seedlings under drought stress. Trees 2014, 28, 961–970. [Google Scholar] [CrossRef]
  65. Ahmed, Z.F.R.; Alblooshi, S.S.; Kaur, N.; Maqsood, S.; Schmeda-Hirschmann, G. Synergistic effect of preharvest spray application of natural elicitors on storage life and bioactive compounds of date palm (Phoenix dactylifera L., cv. Khesab). Horticulturae 2021, 7, 145. [Google Scholar] [CrossRef]
  66. Parida, A.K.; Das, A.B. Salt tolerance and salinity effects on plants: A review. Ecotoxicol. Environ. Saf. 2005, 60, 324–349. [Google Scholar] [CrossRef]
  67. Grattan, S.; Grieve, C. Salinity–mineral nutrient relations in horticultural crops. Sci. Hortic. 1998, 78, 127–157. [Google Scholar] [CrossRef]
  68. Silva, E.; Silveira, J.; Rodrigues, C.; Viégas, R. Physiological adjustment to salt stress in J atropha curcas is associated with accumulation of salt ions, transport and selectivity of K+, osmotic adjustment and K+/N a+ homeostasis. Plant Biol. 2015, 17, 1023–1029. [Google Scholar] [CrossRef]
  69. Ibrahim, H.I. Tolerance of two pomegranates cultivars (Punica granatum L.) to salinity stress under hydroponic culture conditions. J. Basic. Appl. Sci. Res 2016, 6, 38–46. [Google Scholar]
  70. Maan, A.A.; Ahmed, Z.F.R.; Khan, M.K.I.; Riaz, A.; Nazir, A. Aloe vera gel, an excellent base material for edible films and coatings. Trends Food Sci. Technol. 2021, 116, 329–341. [Google Scholar] [CrossRef]
  71. Wang, C.; Zhang, S.; Wang, P.; Hou, J.; Qian, J.; Ao, Y.; Lu, J.; Li, L. Salicylic acid involved in the regulation of nutrient elements uptake and oxidative stress in Vallisneria natans (Lour.) Hara under Pb stress. Chemosphere 2011, 84, 136–142. [Google Scholar] [CrossRef] [PubMed]
  72. Ahmed, Z.F.R.; Al Shaibani, F.Y.Y.; Kaur, N.; Maqsood, S.; Schmeda-Hirschmann, G. Improving Fruit Quality, Bioactive Compounds, and Storage Life of Date Palm (Phoenix dactylifera L., cv. Barhi) Using Natural Elicitors. Horticulturae 2021, 7, 293. [Google Scholar] [CrossRef]
  73. Syeed, S.; Anjum, N.A.; Nazar, R.; Iqbal, N.; Masood, A.; Khan, N.A. Salicylic acid-mediated changes in photosynthesis, nutrients content and antioxidant metabolism in two mustard (Brassica juncea L.) cultivars differing in salt tolerance. Acta Physiol. Plant. 2011, 33, 877–886. [Google Scholar] [CrossRef]
  74. Tufail, A.; Arfan, M.; Gurmani, A.R.; Khan, A.; Bano, A. Salicylic acid induced salinity tolerance in maize (Zea mays). Pak. J. Bot 2013, 45, 75–82. [Google Scholar]
Figure 1. Catalase (CAT) activity in pomegranate plants cv. “Wonderful” subjected to different salicylic acid (SA) treatments under salinity stress conditions in (a) 2019 and (b) 2020 seasons. The vertical bars with different letters are statistically different, indicating an interactive effect of salicylic acid treatments and salinity levels according to LSD test (p < 0.05). Vertical bars indicate the mean ± SE.
Horticulturae 08 00375 g001
Figure 2. Peroxidase (POD) activity in pomegranate plants cv. “Wonderful” subjected to different salicylic acid (SA) treatments under salinity stress conditions in 2019 (a) and 2020 (b) seasons. The vertical bars with different letters are statistically different, indicating an interactive effect of salicylic acid treatments and salinity levels according to LSD test (p < 0.05). Vertical bars indicate the mean ± SE.
Horticulturae 08 00375 g002
Figure 3. Malondialdehyde (MDA) content in pomegranate plants cv. “Wonderful” subjected to different salicylic acid (SA) treatments under salinity stress conditions in 2019 (a) and 2020 (b). The vertical bars with different letters are statistically different, indicating an interactive effect of salicylic acid treatments and salinity levels according to LSD test (p < 0.05). Vertical bars indicate the mean ± SE.
Horticulturae 08 00375 g003
Table 1. Results of the analysis of variance with mean square testing the effects of salinity levels (S), salicylic acid (SA), and their interactions on stem cross-sectional area (SCSA), leaf area (LA), total dry weight (TDW), chlorophyll content (Chl), total phenol content (TPC), leaf total carbohydrates (LTC), leaf proline content (LPC), catalase activity (CAT), peroxidase (POD), sodium (Na), chloride (Cl), nitrogen (N), phosphorus (P), potassium (K), calcium (Ca), and magnesium (Mg) in 2019 and 2020 seasons.
2019SCSALATDWChlLTCLPCTPCELCATPODNaClNPCaMg
Salinity (S)0.25 ***665.6 **18.34 **9012.7 **15.93 **144.18 **9.95 ***2305.48 *9.03 ***0.43 ***0.16 ***0.190.68 *0.04 *0.03 *0.01 ***
SA0.04 ***4066.0 *2.95 ***2886.03 *18.74 **30.83 ***17.64 **532.38 **2.97 ***14.96 **0.09 ***0.28 *0.07 *0.01 *0.007 *0.002 **
S X SA0.004 **20.70 *0.77 ***715.43 **2.14 *3.83 *0.45NS160.12 **0.05 NS0.18 **0.01 ***0.02 *0.06 *6.58 *4.91 *2.41 ***
2020SCSALATDWChlLTCLPCTPCELCATPODNaClNPCaMg
Salinity (S)0.37 ***315.2 **1404.9 *5457.07 *4.42 ***38.78 ***9.78 ***1443.92 *17.37 **0.69 ***0.23 ***0.31 *0.92 *0.11 *0.05 **0.07 ***
SA0.28 ***1078.2 *105.69 *7383.19 *50.76 **61.38 ***16.54 **256.22 **5.07 ***16.15 **0.05 ***0.09 *0.37 *0.01 *0.009 *0.07 ***
S X SA0.02 NS7.79 *7.47 ***708.88 **0.64 ***2.58 ***0.68 ***59.63 ***0.1 NS0.1 NS0.002 **0.01 *0.14 *4.82 *7.91 **0.02 ***
NS, *, **, *** non-significant or significant at p = 0.05, 0.01, an 0.001, respectively.
Table 2. Means of stem cross-sectional area (SCSA), leaf area, and total dry weight (TDW) of pomegranate plants in response to foliar salicylic acid (SA) treatments under salinity stress conditions.
Salinity
Levels
(mM) NaCl
SA
Levels
(mM)
SCSA
(Cm2)
Leaf Area
(Cm2)
TDW
(g)
201920202019202020192020
1000.84 ± 0.2 de0.86 ± 1.1 de25.8 ± 0.3 g32.1 ± 0.2 fg37.98 ± 0.5 b41.60 ± 0.1 d
0.250.92 ±0.3 c1.15 ± 0.2 bc43.5 ± 0.1 e45.6 ± 0.1 d38.25 ±0.2 a43.80 ± 0.7 c
0.500.98 ± 0.5 b1.26 ± 0.7 b56.7 ± 0.2 c50.8 ± 0.3 c38.32 ± 0.1 a48.60 ±0.5 b
11.10 ± 1.0 a1.50 ± 0.3 a78.4 ± 1.1 a59.3 ± 0.9 a38.34 ± 1.1 a52.90 ± 0.5 a
3500.75 ± 0.5 f0.84 ± 1.2 de21.2 ± 0.7 g30.1 ± 0.4 g35.87 ± 0.9 e30.10 ± 0.1 g
0.250.82 ± 0.7 e0.92 ± 0.5 cd29.8 ± 0.2 f41.2 ± 0.2 e36.90 ± 0.3 d32.60 ± 0.3 f
0.500.88 ± 0.2 cd0.95 ± 0.3 cd50.1 ± 0.5 d46.3 ± 0.2 d36.95 ± 0.3 cd36.10 ± 0.8 e
10.89 ± 0.8 cd1.20 ± 0.3 b70.2 ± 0.1 b53.3 ± 0.8 b37.15 ± 0.5 c35.90 ± 0.5 e
7000.62 ± 0.3 h0.70 ± 0.5 e15.8 ± 1.1 h24.1 ± 0.7 h34.75 ± 0.3 e22.10 ± 0.7 k
0.250.66 ± 0.2 gh0.79 ± 0.2 e25.1 ± 0.3 g32.9 ±0.2 f34.91 ± 0.2 e 24.30 ± 0.3 j
0.500.69 ± 0.5 g0.89 ± 1.1 d43.3 ± 0.1 e42.6 ± 0.2 e36.59 ± 0.1 cd27.00 ± 0.3 i
10.71 ± 0.8 fg0.98 ± 0.1 c60.1± 0.5 c50.2 ± 0.3 c36.73 ± 0.5 cd27.60 ± 0.5 h
Means with different letters within the same column have significant difference at p ≤ 0.05.
Table 3. Means of total chlorophyll content, leaf total phenolic composition, total carbohydrates, and proline contents of pomegranate plants in response to foliar salicylic acid (SA) treatments under salinity stress conditions.
Salinity
Levels
(mM) NaCl
SA
Levels
(mM)
Total Chlorophyll Content
(mg−1 100 g DW)
Total Phenolic Composition
(% of DW)
Total Carbohydrate Contents
(% of DW)
Leaf Proline Content
(mg−1 100 g DW)
20192020201920202019202020192020
100177.2 ± 0.03 g155.6 ± 0.5 i5.12 ± 0.01 f5.42 ± 0.01 h10.92 ± 0.2 c10.88 ± 0.6 e12.71 ± 0.6 f15.31 ± 0.3 h
0.25200.1 ± 0.05 c206.3 ± 0.3 d7.11 ± 0.00 de6.60 ± 0.01 g10.98 ± 0.5 c10.90 ± 0.5 e12.75 ± 0.1 f15.35 ±0.5 h
0.50252.6 ± 0.04 a228.2 ± 0.1 b7.92 ± 0.01 cde7.81 ±0.01 de14.80 ± 0.5 a15.13 ± 0.5 b12.74 ± 0.5 f16.81 ± 0.5 f
1242.8 ± 0.05 b235.1 ± 0.2 a8.11 ± 0.01 cd7.95 ± 0.02 d14.86 ± 0.3 a15.60 ± 0.3 a17.81 ± 0.3 de19.23 ± 0.2 c
350173.1 ± 0.02 h141.6 ± 0.5 j6.80 ± 0.02 e6.54 ± 0.00 g10.60 ± 0.1 cd9.70 ± 0.1 f16.11 ± 0.2 e16.11 ± 0.1 g
0.25184.2 ± 0.05 f178.9 ± 0.5 f8.20 ± 0.01 cd6.80 ± 0.02 fg10.88 ± 0.3 c10.89 ± 0.3 e17.24 ± 0.4 de17.93 ± 0.2 e
0.50195.6 ± 0.02 d206.1 ± 0.4 d9.71 ± 0.00 ab8.11 ± 0.02 d12.70 ± 0.5 b13.50 ± 0.3 d19.81 ± 0.3 bc18.16 ± 0.4 e
1190.1 ± 0.03 e213.1 ± 0.5 c9.92 ± 0.02 ab8.96 ± 0.02 c12.81 ± 0.2 b14.90 ± 0.4 b20.50 ± 0.5 bc22.51 ± 0.2 b
700151.7 ± 0.01 j131.2 ± 0.3 k6.98 ± 0.01 de6.92 ± 0.02 f9.20 ± 0.1 d9.35 ± 0.3 g19.11 ± 0.4 cd18.15 ± 0.5 e
0.25161.8 ± 0.03 i164.1 ± 0.5 h8.10 ± 0.01 cd7.60 ± 0.02 e10.50 ± 0.5 cd10.86 ± 0.6 e20.95 ± 0.1 abc18.50 ± 0.3 d
0.50170.3 ± 0.05 h168.9 ± 0.4 g8.93 ± 0.02 bc9.50 ± 0.01 b11.98 ± 0.3 bc13.68 ± 0.3 cd21.23 ± 0.3 ab19.10 ± 0.5 c
1170.9 ± 0.04 h190.1 ± 0.1 e10.5 ± 0.02 a10.90 ± 0.01 a10.66 ± 0.3 cd13.96 ± 0.5 c22.60 ± 0.3 a25.30 ± 0.3 a
Means with different letters within the same column have significant difference at p ≤ 0.05.
Table 4. Means of leaf sodium content (Na), leaf chloride content (Cl), and electrolyte leakage (EL) of pomegranate plants in response to foliar salicylic acid (SA) treatments under salinity stress conditions.
Salinity
Levels
(mM)
SA
Levels
(mM)
Na
(% DW)
Cl
(% DW)
EL
(%)
201920202019202020192020
1000.52 ± 0.01 ef0.61 ± 0.02 f0.71 ± 0.05 de0.85 ± 0.05 cd20.1 ± 0.1 h18.2 ± 0.5 h
0.250.50 ± 0.05 fg0.59 ± 0.01 f0.70 ± 0.04 ef0.80 ± 0.03 d19.2 ± 0.3 hi15.1 ± 0.2 i
0.500.45 ± 0.03 h0.47 ± 0.04 g0.53 ± 0.03 gh0.60 ± 0.03 e15.5 ± 0.4 j15.3 ± 0.4 i
10.46 ± 0.01 h0.42 ± 0.05 lh0.50 ± 0.03 g0.56 ± 0.01 e18.5 ± 0.3 i18.4 ± 0.1 h
35 00.70 ± 0.05 c0.79 ± 0.06 bc0.92 ± 0.05 b1.02 ± 0.05 b40.5 ± 0.5 b39.6 ± 0.1 c
0.250.69 ± 0.01 c0.71 ± 0.03 d0.86 ± 0.02 bc0.90 ± 0.02 f30.2 ± 0.2 e29.1 ± 0.3 f
0.500.50 ± 0.02 fg0.69 ± 0.02 d0.69 ± 0.01 ef0.90 ± 0.05 bcd28.1 ± 0.1 f25.2 ± 0.4 g
10.48 ± 0.04 gh0.65 ± 0.03 e0.55 ± 0.05 gh0.88 ± 00.6 bcd26.1 ± 0.5 g25.1± 0.3 g
7000.89 ± 0.03 a0.92 ± 0.02 a1.20 ± 0.03 a1.18 ± 0.01 a69.1 ± 0.3 a50.1 ± 0.2 a
0.250.82 ± 0.05 b0.80 ± 0.01 b0.95 ± 0.02 b1.0 ± 0.03 bc 40.2 ± 0.4 b40.1 ± 0.5 b
0.500.60 ± 0.02 d0.77 ± 0.03 c0.80 ± 0.05 cd0.98 ± 0.02 bc38.5 ± 0.4 c33.2 ± 0.1 d
10.55 ± 0.01 e0.70 ± 0.05 d0.61 ± 0.01 fg0.91 ± 0.05 bcd36.3 ± 0.5 d30.7 ± 0.3 e
Means with different letters within the same column have significant difference at p ≤ 0.05.
Table 5. Means of leaf nitrogen (N), phosphorus (P), potassium (K), calcium (Ca), and magnesium (Mg) of pomegranate plants in response to foliar salicylic acid (SA) treatments under salinity stress conditions.
Salinity
Levels
(mM)
NaCl
SA
Levels
(mM)
N
(% DW)
P
(% DW)
K
(% DW)
Ca
(% DW)
Mg
(% DW)
2019202020192020201920202019202020192020
1002.4 ± 0.01 c2.4 ± 0.03 ab0.54 ± 0.05 c0.45 ± 0.04 b1.8 ± 0.03 a1.6 ± 0.03 a1.8 ±0.06 a1.4 ± 0.01 a1.7 ± 0.01 a1.7 ± 0.01 a
0.252.5 ± 0.05 c2.4 ± 0.08 a0.55 ± 0.03 bc0.55 ± 0.03 a1.8 ± 0.05 a1.6 ± 0.05 a1.9 ± 0.03 a1.4 ± 0.02 a1.7 ± 0.02 a1.7 ± 0.02 a
0.503.4 ± 0.04 b2.4 ± 0.08 a0.58 ± 0.03 b0.56 ± 0.03 a1.8 ± 0.02 a1.6 ± 0.05 a1.7 ± 0.02 a1.4 ± 0.04 a1.7 ± 0.03 a1.7 ± 0.03 a
13.9 ± 0.03 a2.4 ± 0.07 a0.68 ± 0.02 a0.61 ± 0.04 a1.8 ± 0.02 a1.6 ± 0.05 a1.9 ± 0.01 a1.4 ± 0.05 a1.7 ± 0.05 a1.7 ± 0.02 a
3502.4 ± 0.06 c1.9 ± 0.08 cd0.34 ± 0.05 c0.37 ± 0.03 c1.2 ± 0.02 b1.2 ± 0.03 b1.3 ± 0.05 c1.2 ± 0.02 c1.6 ± 0.01 b1.5 ± 0.04 b
0.252.7 ± 0.05 b2.1 ± 0.09 c0.39 ± 0.03 bc0.42 ± 0.04 b1.6 ± 0.05 a1.6 ± 0.02 a1.5 ± 0.01 b1.3 ± 0.01 bc1.6 ± 0.03 a1.6±0.05 ab
0.502.9 ± 0.3 b2.2 ± 0.08 b0.49 ± 0.03 b0.41 ± 0.05 b1.7 ± 0.02 a1.7 ± 0.01 a1.6 ± 0.01 b1.3 ± 0.02 b1.6 ± 0.01 a1.6 ± 0.01 a
13.7 ± 0.09 a2.3 ± 0.07 b0.62 ± 0.04 a0.44 ± 0.05 b1.8 ± 0.03 a1.8 ± 0.03 a1.7 ± 0.04 b1.3 ± 0.01 b1.6 ± 0.05 a1.7 ± 0.05 a
7001.8 ± 0.08 c1.8 ± 0.08 d0.36 ± 0.05 b0.30± 0.05 d1.1 ± 0.03 c1.1 ± 0.02 c1.3 ± 0.01 d1.2 ± 0.03 c1.5 ± 0.03 b1.5 ± 0.05 b
0.252.1 ± 0.06 bc1.8 0.05 d0.40 ± 0.02 a0.35 ± 0.02 c1.3 ± 0.05 b1.4 ± 0.01 b1.3 ± 0.03 bc1.2 ± 0.05 c1.6 ± 0.01 a1.5± 0.05 ab
0.502.4 ± 0.05 ab1.9 ± 0.09 c0.40 ± 0.02 a0.37 ± 0.05 c1.3 ± 0.03 b1.5 ± 0.02 b1.4 ± 0.01 bc1.3 ± 0.03 b1.6 ± 0.02 ab1.6± 0.05 ab
12.7 ± 0.05 a2.1 ± 0.08 c0.40 0.03 a0.40 ± 0.03 c1.7 ± 0.05 a1.6 ± 0.01 a1.4 ± 0.05 b1.3 ± 0.01 b1.6 ± 0.01 a1.7 ± 0.05 a
Means with different letters within the same column have significant difference at p ≤ 0.05.
Table 6. Salt tolerance index (STI) of all the studied traits of pomegranate cv. “Wonderful” during 2019 and 2020 seasons.
TraitSTI (%)
20192020
Stem cross-sectional area (SCSA)73.80 ± 0.9 ef81.39 ±1.1 de
Leaf area61.24 ± 1.2 f75.07 ± 1.2 ef
Total dry weight91.49 ± 1.1 e92.18 ± 1.1 d
Chlorophyll85.60 ± 0.5 ef84.31 ± 0.9 de
Phenolic composition136.32 ± 0.3 c127.67 ± 0.05 c
Carbohydrates84.24 ± 0.9 ef85.93 ± 0.05 de
Proline150.35 ± 0.2 c118.54 ± 0.01 c
Catalase (CAT)128.84 ± 0.05 d141.17 ± 0.02 b
Peroxidase (POD)110.25 ± 0.06 d115.00 ± 0.01 c
Na (%)171.15 ± 0.05 b150.81 ± 0.02 b
Cl (%)169.01 ± 0.02 b138.82 ± 0.02 b
Electrolyte leakage (EL)343.78 ± 0.05 a275.27 ± 0.08 a
N (%)75.40 ± 0.08 ef74.15 ± 0.05 ef
P (%)66.66 ± 0.05 f66.67 ± 0.02 f
K (%)59.44 ± 0.03 f72.25 ± 0.01 ef
Ca (%)70.65 ± 0.02 ef90.73 ± 0.02 d
Mg (%)90.47 ± 0.01 e88.30 ± 0.01 de
Means with different letters within the same column have significant difference at p ≤ 0.05.
Publisher’s Note: MDPI stays neutral with regard to jurisdictional claims in published maps and institutional affiliations.

