Article

An Integrated Analysis of Transcriptome and Metabolism Reveals an Inhibitory Effect of Low Light on Anthocyanin Biosynthesis in Purple cai-tai (Brassicarapa L. var. purpurea)

1
Vegetable Research Institute, Guangdong Key Laboratory for New Technology Research of Vegetables, Guangdong Academy of Agricultural Sciences, Guangzhou 510640, China
2
College of Horticulture, South China Agricultural University, Guangzhou 510642, China
3
College of Coastal Agricultural Sciences, Guangdong Ocean University, Zhanjiang 524088, China
*
Authors to whom correspondence should be addressed.
Horticulturae 2022, 8(7), 566; https://doi.org/10.3390/horticulturae8070566
Submission received: 11 May 2022 / Revised: 8 June 2022 / Accepted: 16 June 2022 / Published: 22 June 2022

Abstract

:
Low light caused by industrial development and environment change has become a limitation in crop production. This condition inhibits the petiole anthocyanin synthesis and even its tastes in purple cai-tai (Brassica rapa L. var. purpurea); however, the molecular basis of the inhibitory effects by low light on anthocyanin synthesis in purple cai-tai petiole is less reported. In this study, we performed an integrated analysis of transcriptomes and metabolisms to decipher key genes and/or metabolites that responsible for low light acclimation in a purple cai-tai cultivar, XH1. Results shows that anthocyanin is obviously repressed by low light treatment, and consistently the structural genes related to the anthocyanin biosynthesis pathway is significantly enriched in the list of differentially expressed genes according to both GO and KEGG analysis. Furthermore, the amounts of some metabolites related to anthocyanin are dramatically decreased under low light treatment, such as cyanindin 3-O-glucoside chloride, cyanindin O-syringic acid, and cyanidin 3-O-rutinoside. In addition, we found that five transcription factors in TCP gene family especially BrTCP15 is substantially downregulated by low light treatments. The expression pattern of BrTCP15 in response to low light treatment was further confirmed by qPCR. This study reports the inhibitory effects of the anthocyanin biosynthesis pathway and BrTCP15 by low light treatments, and extends our knowledge on regulatory mechanism of the anthocyanin biosynthetic pathway in response to low light in B. rapa L.

1. Introduction

Brassica rapa L (Brassica) comprises a variety of vegetables. Among them, Chinese cabbage (Brassica rapa L. ssp. pekinensis) and pakchoi (Brassica rapa L. ssp. chinensis) are the two most consumed vegetables in China and throughout East Asia. Brassica vegetables provide dietary fiber, vitamin C, and anti-cancer glucosinolates [1], and also serve as various dietary flavonols [2]. Therefore, plants of the Brassicaceae family are important sources of natural biologically active substances–enzymes, pigments, vitamins, as well as anthocyanin [3]. However, the production of these natural biologically active substances is always affected by many environmental factors.
Low light represents one of most important environmental factors that affects crop production [4]. This issue exacerbates especially in some regions characterized with regular precipitation and cloudy cover, for example, in Sichuan, a province in Southwest China. Therefore, the low light environment has become one of the main constraints to rice or other crop production [5,6]. In addition, low light leads to the changes of other agronomic traits, including canopy architecture, photosynthetic physiology, biomass accumulation, and crop quality [6,7,8]. During past decades, effects of low light on molecular profilings, such as secondary metabolites, including flavonol, anthocyanin, and phenylalanine has attracted considerable attention [9]. Anthocyanin is an important natural biologically active substance, and it is inhibited under low light condition [10]. Therefore, exploring key genes/metabolites could help to provide indicators for precise molecular breeding in the improvements of anthocyanin production in adaption to low light.
The anthocyanin biosynthetic pathway has been extensively reported. It begins with the chalcone synthase (CHS) mediated synthesis of naringenin chalcone from 4-coumaroyl-CoA and malonyl-CoA. Then, naringenin chalcone can be isomerized by chalcone isomerase (CHI) to naringenin. In addition, the anthocyanin biosynthetic pathway constitutes an extension of the global flavonoid pathway, mainly regulated by MYB–bHLH–WD40 (MBW) transcription complexes [11]. In Arabidopsis, there are four MYBs subgroups, three IIIf bHLHs subgroups, and a TTG1 protein [12,13]. To fully decipher the regulatory mechanism of anthocyanin biosynthetic pathway, uncovering other transcription factors collaborated with the MBW complex is needed responsible for this process.
Currently, multiple-omics studies encompassing metabolome, transcriptome and proteome have been extensively reported in plants. These studies are helpful to better understand the reprogrammed biological pathways related to the anthocyanin biosynthetic pathway by heat, drought and salt stress, etc. [14,15,16]. However, studies on low light effects on the degradation of anthocyanin especially in purple cai-tai petiole were less reported.
In the current study, we hypothesized that there should be other key transcription factors in addition to MBW complexes involved in the anthocyanin biosynthetic pathway purple cai-tai. In order to uncover the key biological pathways and/or genes responsible for the degradation of anthocyanin under low light in purple cai-tai petioles, we performed a combined analysis of transcriptomes and non-targeted metabolism in a petiole of purple cai-tai species, Xianghong 1 (XH1). Enriched biological pathways in the list of differentially expssed genes induced by low light were analyzed. The expression levels of key transcription factors such as BrTCP15 in response to low light were further confirmed. The relationship between anthocyanin regulation and BrTCP15 expression was discussed. This study could extend our knowledge on the regulatory mechanism of anthocyanin biosynthetic pathway in response to low light in B. rapa L.

2. Materials and Methods

2.1. Materials and Growth Condition

A purple cai-tai commercial variety, XH1, was used in this study. XH1 is a very early maturity variety with ~45 days from sowing to first harvest. This variety has features of both heat-resistant and disease-resistant. The petiole of XH1 are green at the seedling stage and turns red when exposed to high light for several days. This variety was sown in pots in growth chamber with 25 °C air temperature and 14/10 h photoperiod. One plant was grown in each pot. Long photoperiod (14/10 h) is used to promote the growth and flowering. Plants were grown in the pot (12 L volume) containing commercial peat soil (Pindstrup Substrate no. 4, Pindstrup Horticulture Ltd., Shanghai, China). During the growth period, plants were irrigated daily. Fertilizers were applied twice per two weeks.

2.2. Low Light Treatment

Two light conditions were applied, i.e., normal growth light of 500 μmol m−2s−1 Photosynthetic Photon Flux Density (PPFD) (CK) and low light (100 μmol m−2s−1 PPFD, ST) starting from 15 days after sowing. The light intensity was estimated at 30 cm distance from Light-Emitting Diode (LED) light source via light meter (Quantitherm light meter, Hansatech, Manchester, UK). LED source (SANANBIO Corp. Ltd. Shenzhen, China) with a broad band 529–624 nm and a peak at 568 nm was used. There are three biological replicates (pots) for each light treatment.
Around 5 g petiole of the cai-tai seedlings exposed to 10 days low light treatment was sampled, and immediately frozen in liquid nitrogen and then stored at −80 °C for transcriptome and metabolism determinations.

2.3. RNA Extraction

The Total RNA was extracted from the tissue using TRIzol Reagent according to the instructions of manufacturer (Invitrogen, Solon, OH, USA) and genomic DNA was removed with DNase I (Takara, Beijing, China). RNA quality was determined by 2100 Bioanalyser (Agilent) and quantified using the NanoDrop ND-2000 (NanoDrop Technologies, Solon, OH, USA). In this study, only the high-quality RNA sample (OD260/280 = 1.8~2.2, RIN > 6.5, 28S:18S > 1.0) was used to construct the sequencing library.

2.4. Library Preparation and Illumina Hiseq4000 Sequencing

Around 5 μg of total RNA was used to construct the transcriptome library with TruSeq RNA sample preparation Kit (Illumina, San Diego, CA, USA) as documented previously [17]. Shortly, mRNA was first isolated by oligo(dT) beads, and double-stranded cDNA was synthesized with a SuperScript double-stranded cDNA synthesis kit (Invitrogen, CA). Then the cDNA was synthesized to end-repair following the standard protocol of Illumina’s library construction. After we obtained the cDNA for each sample, a 3-adapter random primer was used to reverse the first-strand cDNA. The resultant cDNA fragments with 200–400 bp were selected for the library. Phusion DNA polymerase (Thermo Scientific, Waltham, MA, USA) was used for polymerase chain reaction (PCR) with at least 15 PCR cycles. The detailed conditions of PCR were referred as previously reported [18]. Paired-end RNA-seq library was finally sequenced via the Illumina HiSeq 4000 platform.

2.5. Read Mapping and Differential Expression Analysis

For read mapping step, the raw paired-end reads were first quality controlled by FastQC software https://github.com/s-andrews/FastQC (accessed on 16 December 2020) with default parameters. Then, we aligned the clean reads and mapped them to the reference genome using HISAT2software https://github.com/DaehwanKimLab/hisat2 (accessed on 18 October 2020) [19]. To identify differentially expressed genes (DEGs) induced by low light, a Transcript Per Million (TPM) method was used to calculate the expression abundance of each transcript. This method takes the gene length for normalization, and it is typically reported to be an appropriate tool for sequencing [20]. In addition, we used RSEM software http://deweylab.biostat.wisc.edu/rsem/ (accessed on 5 December 2020) to estimate the abundances of the gene [21]. R statistical package software EdgeR (http://www.bioconductor.org (accessed on 16 December 2020) was finally applied to perform the differential expression analysis as documented earlier [22].

2.6. GO and KEGG Analysis

To identify the changed biological pathways induced by low light, we used an in-house Perl script UniProtKB GOA file (ftp.ebi.ac.uk/pub/databases/GO/goa (accessed on 16 December 2020) to perform gene ontologies (GO) annotation. In addition, for Kyoto Encyclopedia of Genes and Genomes (KEGG) analysis, KOBAS (KEGG Orthology Based Annotation System, v2.0) was applied to identify reprogrammed biochemical pathways caused by low light as previously reported [23].

2.7. Non-Targeted Metabolism Analysis

To perform the changes of metabolites induced by low light, ~2 g petioles of XH1 cai-tai seedlings were extracted using pre-cooled metal beads in a 2 mL Eppendorf tube, at 30 Hz for 3 min [24]. We then dissolved the extracted powder with 1.3 mL methanol/chloroform, followed by the incubation of the powder at −20 °C for 4 h, and centrifuged the sample at 2000× g, 4 °C for 10 min. The sample was then filtered using 0.43 μm organic phase medium (GE Healthcare, Waltham, MA, USA), and finally 10 μL sample was loaded to HPLC for analysis. Mobile phase: 15% buffer A (95% H2O and 5% ACN, pH = 9.5) + 85% buffer B (100% ACN). Ultra-high-performance liquid chromatography (HPLC) equipped with tandem mass spectrometry (MS/MS) (Applied Biosystems 4500 QTRAP, Waltham, MA, USA) was used to determine the non-targeted metabolism. HPLC: column, Waters ACQUITY UPLC HSS T3 C18 (1.8 µm, 2.1 mm × 100 mm); solvent system, water (0.04% acetic acid): acetonitrile (0.04% acetic acid); gradient program, 100:0 v/v at 0 min, 5:95 v/v at 11.0 min, 5:95 v/v at 12.0 min, 95:5 v/v at 12.1 min, 95:5 v/v at 15.0 min; flow rate, 0.35 mL/min; temperature, 40 °C; injection volume: 4 μL. Analyst 1.6.3 software was used to analyze the detected data. MultiaQuant software was used to integrate and calibrate the mass spectrometry results to finally obtain the different metabolites. The size of the peak area represented the relative content of metabolites. Three biological replicates were conducted for non-targeted metabolic measurements.

2.8. q-RT-PCR Analysis

Total RNA (~2 μg) [25] was isolated from XH1 petioles with Ultra-Pure RNA Kit (cwbiotech, Beijing, China) following the instructions of manufacturer, and cDNA was synthesized using ExScript RT kit (Takara, Beijing, China). We performed q-RT-PCR on a Realplex 4 Master Cycler using SYBR Green kit (TIANGEN, Shanghai, China) with 10 μM final concentration for each primer. The samples were analyzed using a Real-Time PCR System (ABI StepOnePlus, Applied Biosystems) with the following cycling parameters: 95 °C for 10 s, 55 °C for 20 s, and 72 °C for 20 s. The specific primers for q-RT-PCR were designed using Primer Prime Plus 5 Software Version 3.0 (Applied Biosystems, Waltham, MA, USA). The primer sequences are displayed in the Table S1. Calculation of relative gene expression was followed as reported previously [26], where actin1 gene was used as a reference. Three biological replicates with three technical replicates for each biological replicate were performed.

2.9. Statistical Analysis

Analyses for gene expression analysis were carried out using GraphPad Prism 6 (GraphPad Software, Inc., La Jolla, CA, USA). The significant levels of gene expression differences were determined between control and low light treated samples using student t-test, at p < 0.01, and 0.001 indicated by “**” and “***”, respectively.

3. Results

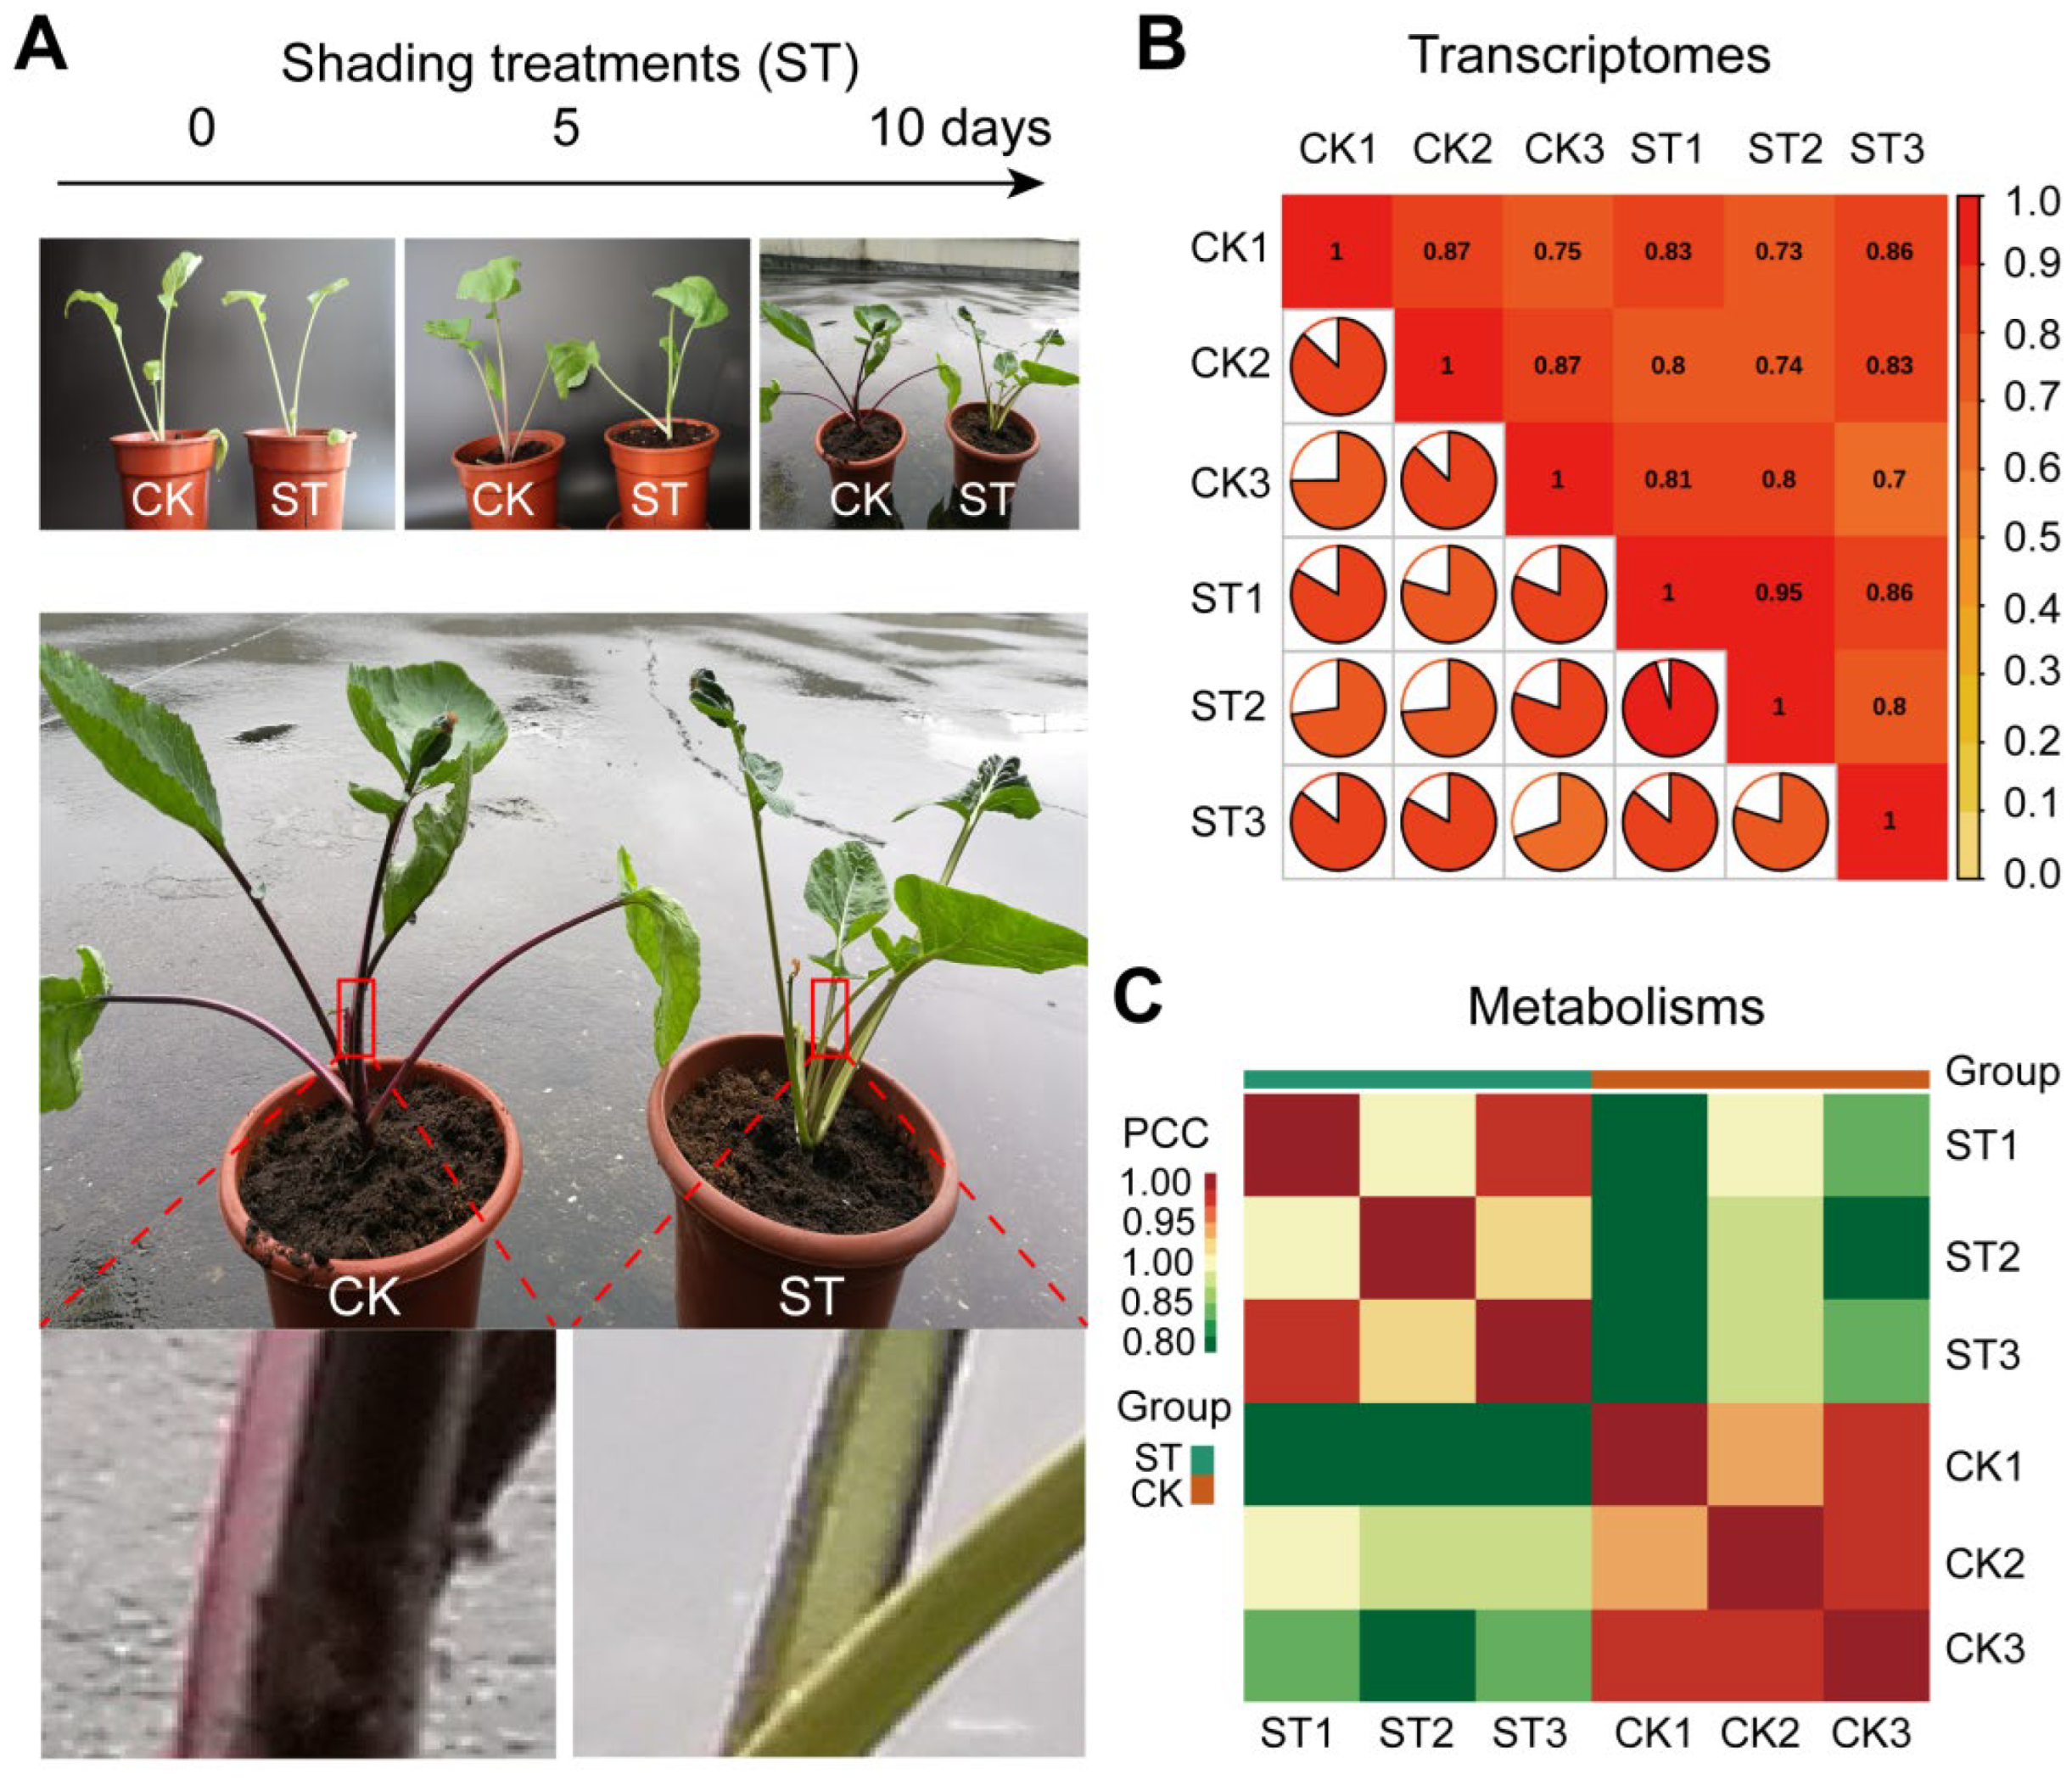
3.1. Anthocyanin Is Inhibited by Low Light in Petiole of XH1 cai-tai Seedlings

Based on previous observations, we found that low light inhibited dramatically anthocyanin biosynthesis following 10 days low light treatments, as clearly shown in petiole of XH1 cai-tai seedlings (Figure 1A). Therefore, we performed an integrated analysis of transcriptomes and metabolism to decipher the potential molecular mechanism that is responsible for anthocyanin accumulation in XH1 cai-tai seedlings petiole. Results reveal that the samples within the same treatment perform well repeatability for both transcriptome and metabolism (Figure 1B,C).

3.2. Scaffolds Assemble and Quality Control of Transcriptomes

Based on transcriptome analysis, we found 46,836,588 raw reads and 44,703,004 clean reads, with 47% GC content, 98% Q20 and 96% Q30 values across different samples (Table S2). The mapped reads and the unique reads account 87.9% and 85.6% for total reads, respectively (Table S3). The reads error rates maintain around 2% (Figure S1A). The equal distribution for the four bases (A, T, C and G) with 25% for each base was observed along with the reads of different length (Figure S1B). The frequencies of both A and T bases were higher than C and G (Figure S1B). After reads assemble, clean reads account for 95%, while only 3% events were characterized with low quality (Figure S1C). For reads alignments, we found that the coverage depths across different chromosomes were 20× (Figure S2A), and 80% percentile covers at the downstream part of gene body (Figure S2B). There are 98% reads mapped to the exon of genes and only 2% reads mapped to the intergenic region (Figure S2C). After the gene annotation process, we found that more than 4000 genes are related to general function prediction only, post-translational modification, protein turnover, and signal transduction mechanisms (Figure S3A). In addition, more than 70% genes are annotated to Brassica rapa #28437, while only 22% are successfully mapped to Brassica napus #8961 and only 0.6% are mapped to Arabidopsis thaliana according to NR database (Figure S3B). The values of TPM across global genes exert a normal distribution (Figure S4B).

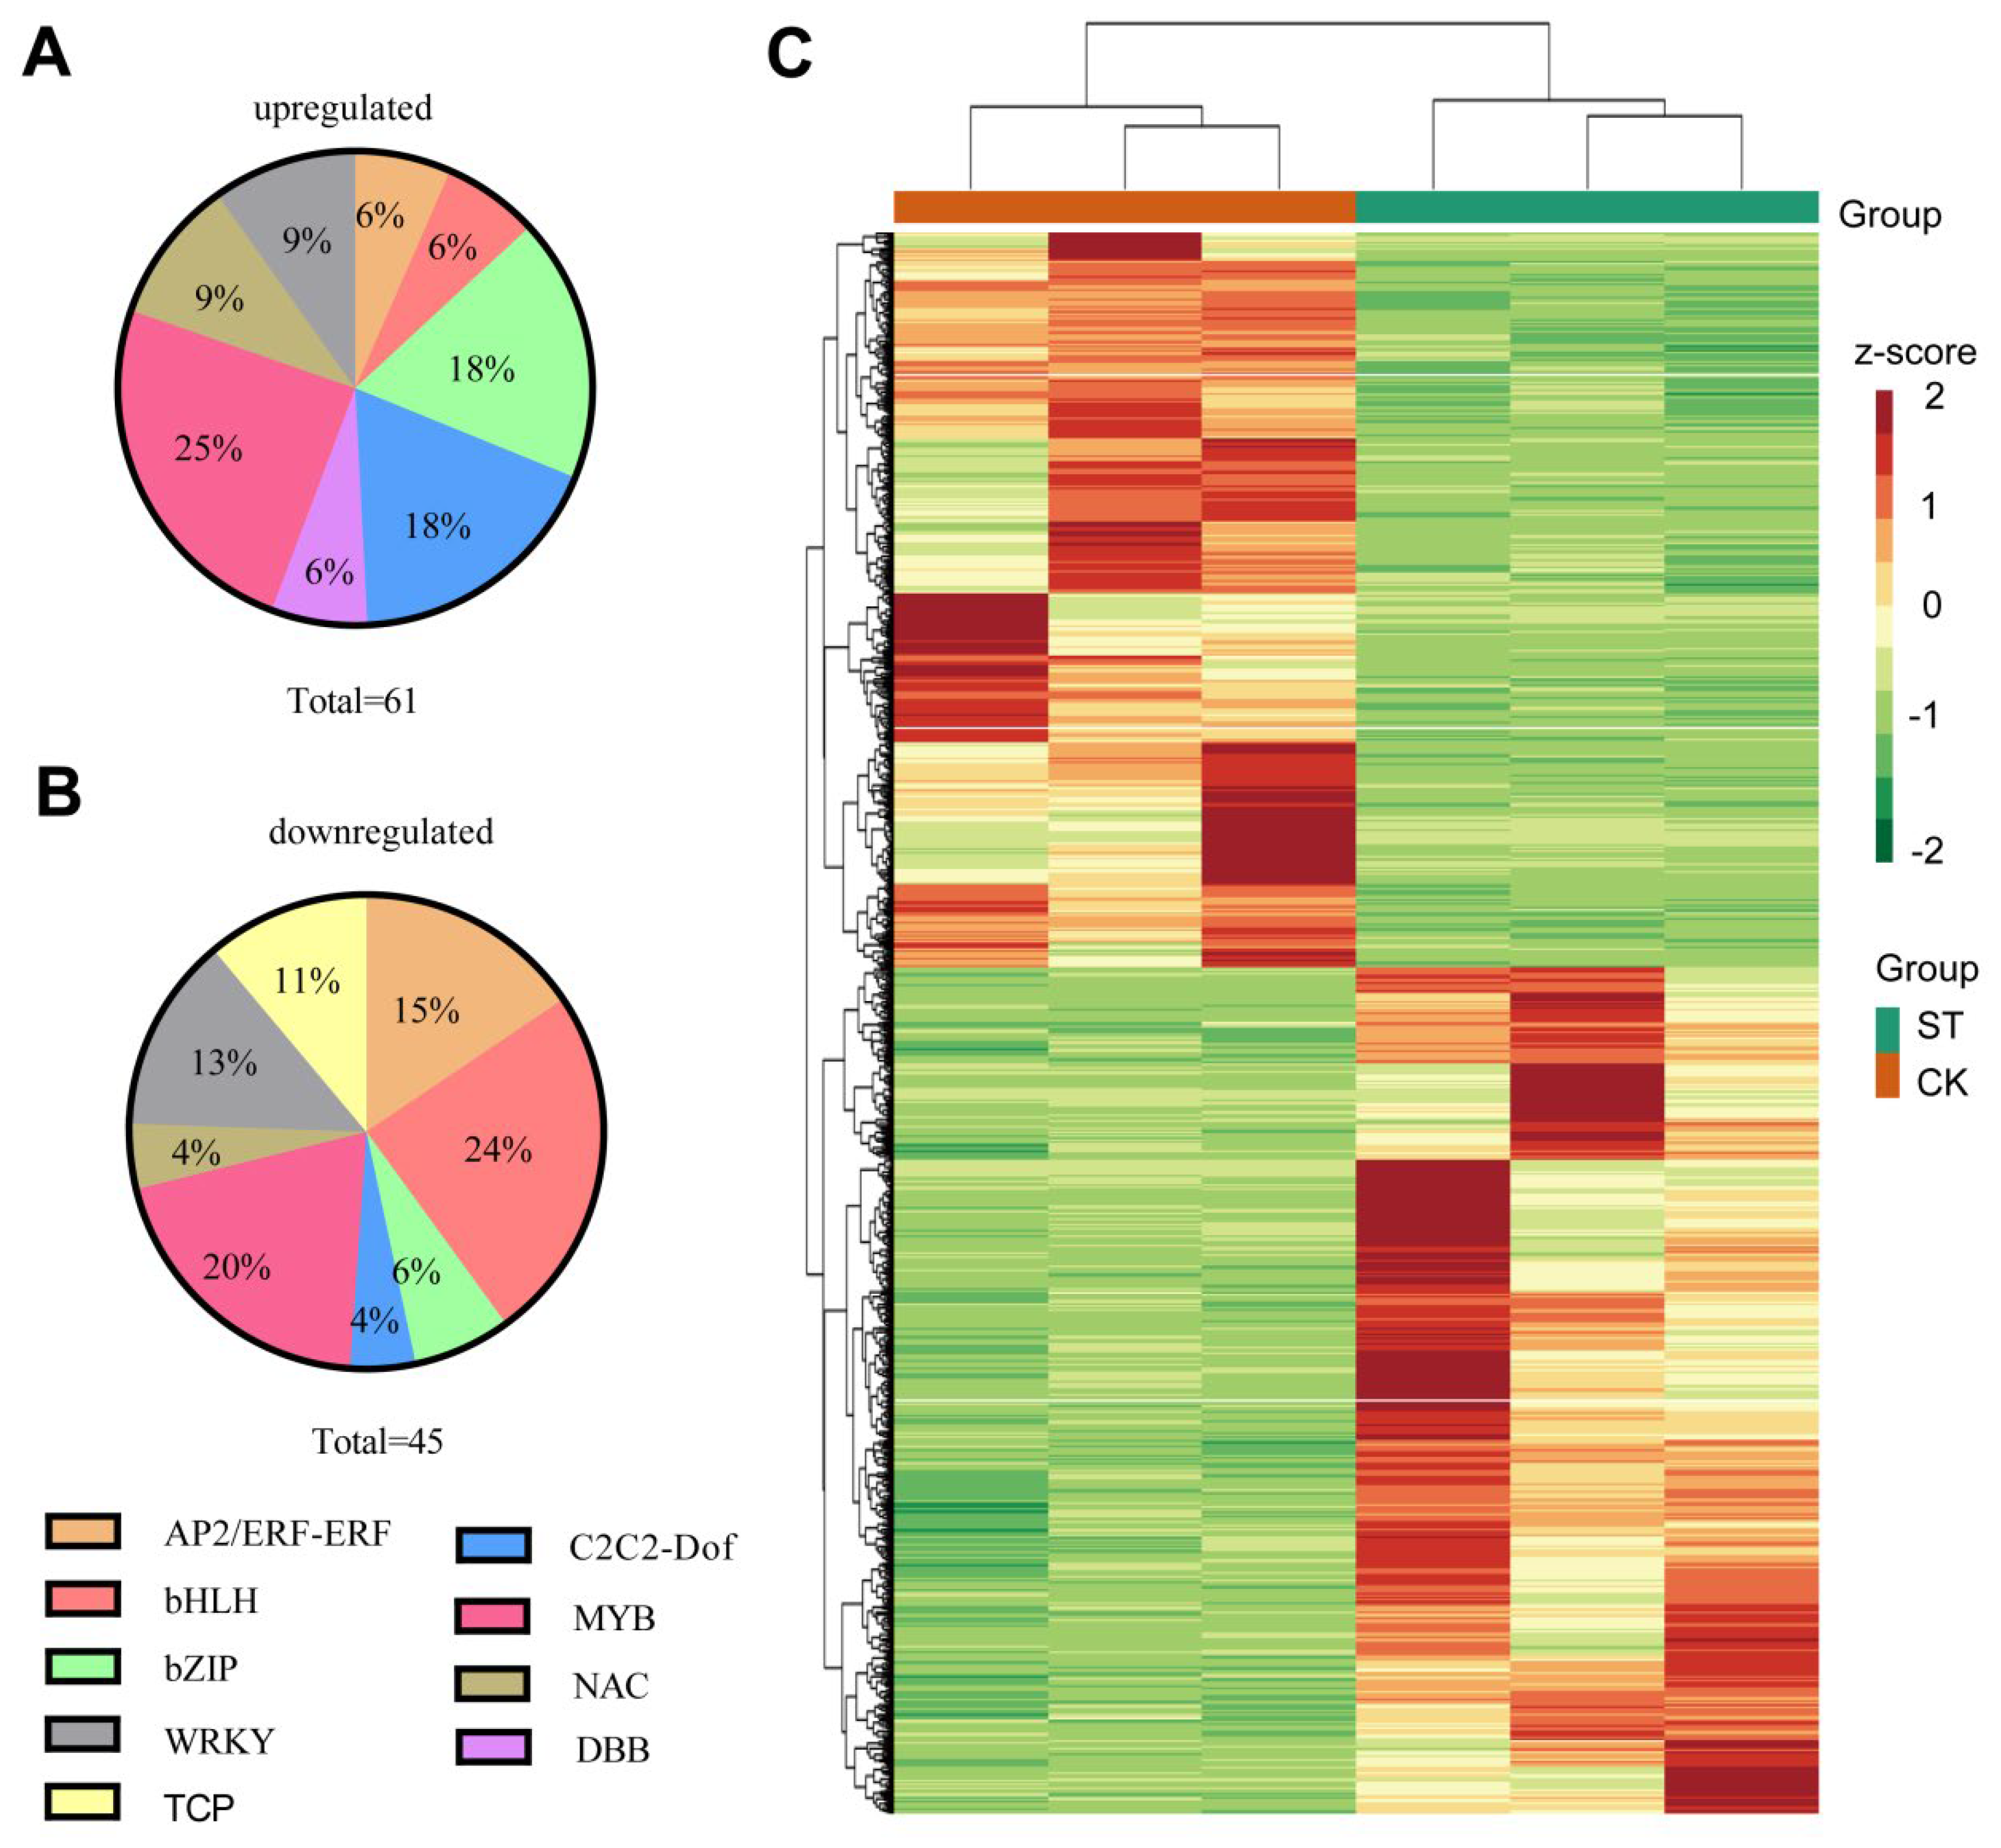
3.3. Global Gene Expression Induced by Low Light Treatments

Principal component (PC) analysis shows that the samples within either control or low light treatments were clustered closely, and the explanation rates for top PC1 and PC2 are 29.7% and 27.4%, respectively (Figure 2A). In addition, we found that there were 1906 significantly differently expressed genes (DEGs) in total (two-fold up or down). Among these genes, 884 DEGs were upregulated and 1022 DEGs were downregulated caused by low light treatments in the petiole of XH1 cai-tai seedlings (Figure 2B and Table S4).
GO analysis shows that the pathways of circadian rhythm, rhythmic process, cellular response to light stimulus, detection of light stimulus, pigment biosynthetic process, response to gibberellin, starch catabolic process, and anthocyanin-containing compound biosynthetic process are significantly enriched in the list of DEGs caused by low light (Figure 3A). From KEGG enrichments analysis, we found that metabolic pathways of zeatin biosynthesis, circadian rhythm, biosynthesis of secondary metabolites, anthocyanin biosynthesis and plant hormone signal transduction were significantly enriched in the list of DEGs caused by low light (Figure 3B).
Furthermore, we found that there were 236 transcription factors with differential expression due to low light effects, such as AP2/ERF, bHLH, bZIP, C2C2-Dof, MYB, NAC, WRKY, TCP and DBB gene family (Figure 4A,B and Table S5). The numbers of transcription factors in the list of upregulated DEGs account for 25% and 18% for bHLH and C2C2-Dof gene family, respectively (Figure 4A). By contrast, the numbers of transcription factors in the 1020 downregulated DEGs account for 24% and 20% for MYB and bHLH gene family, respectively (Figure 4B). Importantly, five TCP genes detected by transcriptome analysis were all downregulated due to low light treatments, including Bra001710, Bra004407, Bra005984, Bra007875 and Bra016090 (Figure 4B and Table S5).
Moreover, we analyzed the expression levels of the known genes related to anthocyanin biosynthesis pathway in response to low light treatments (Figure 4C and Table S6). Results show that eight DEGs related to anthocyanin biosynthetic pathway were downregulated under low light condition such as Bra009101, Bra012862, Bra023441, Bra013652, Bra019350, Bra027457, Bra036208 and Bra038445, respectively (Table S6).
To confirm the expression levels of some key genes in response to low light treatment, we conducted q-RT-PCR experiments. The expression levels of four DEGs related to anthocyanin biosynthetic pathway were determined, including BrLDOX (Bra019350), BrDFR (Bra027457), Br5MAT (Bra036208) and BrUGT75C1 (Bra038445), together with two transcription factors, i.e., BrTCP15b (Bra004407) and BrTCP15 (Bra007875). Results show that the expression levels of genes related to anthocyanin biosynthetic pathway including BrLDOX, BrDFR, Br5MAT and BrUGT75C1 were inhibited by 2–4 times. In contrast, the expression level of two TCP genes, i.e., BrTCP15 and BrTCP15b were substantially inhibited. In particular, the expression levels of BrTCP15 were inhibited by up to two times (Figure 5A–F). These results suggest that low light inhibits the expression of genes related to anthocyanin biosynthesis as well as the expression of some TCP genes.

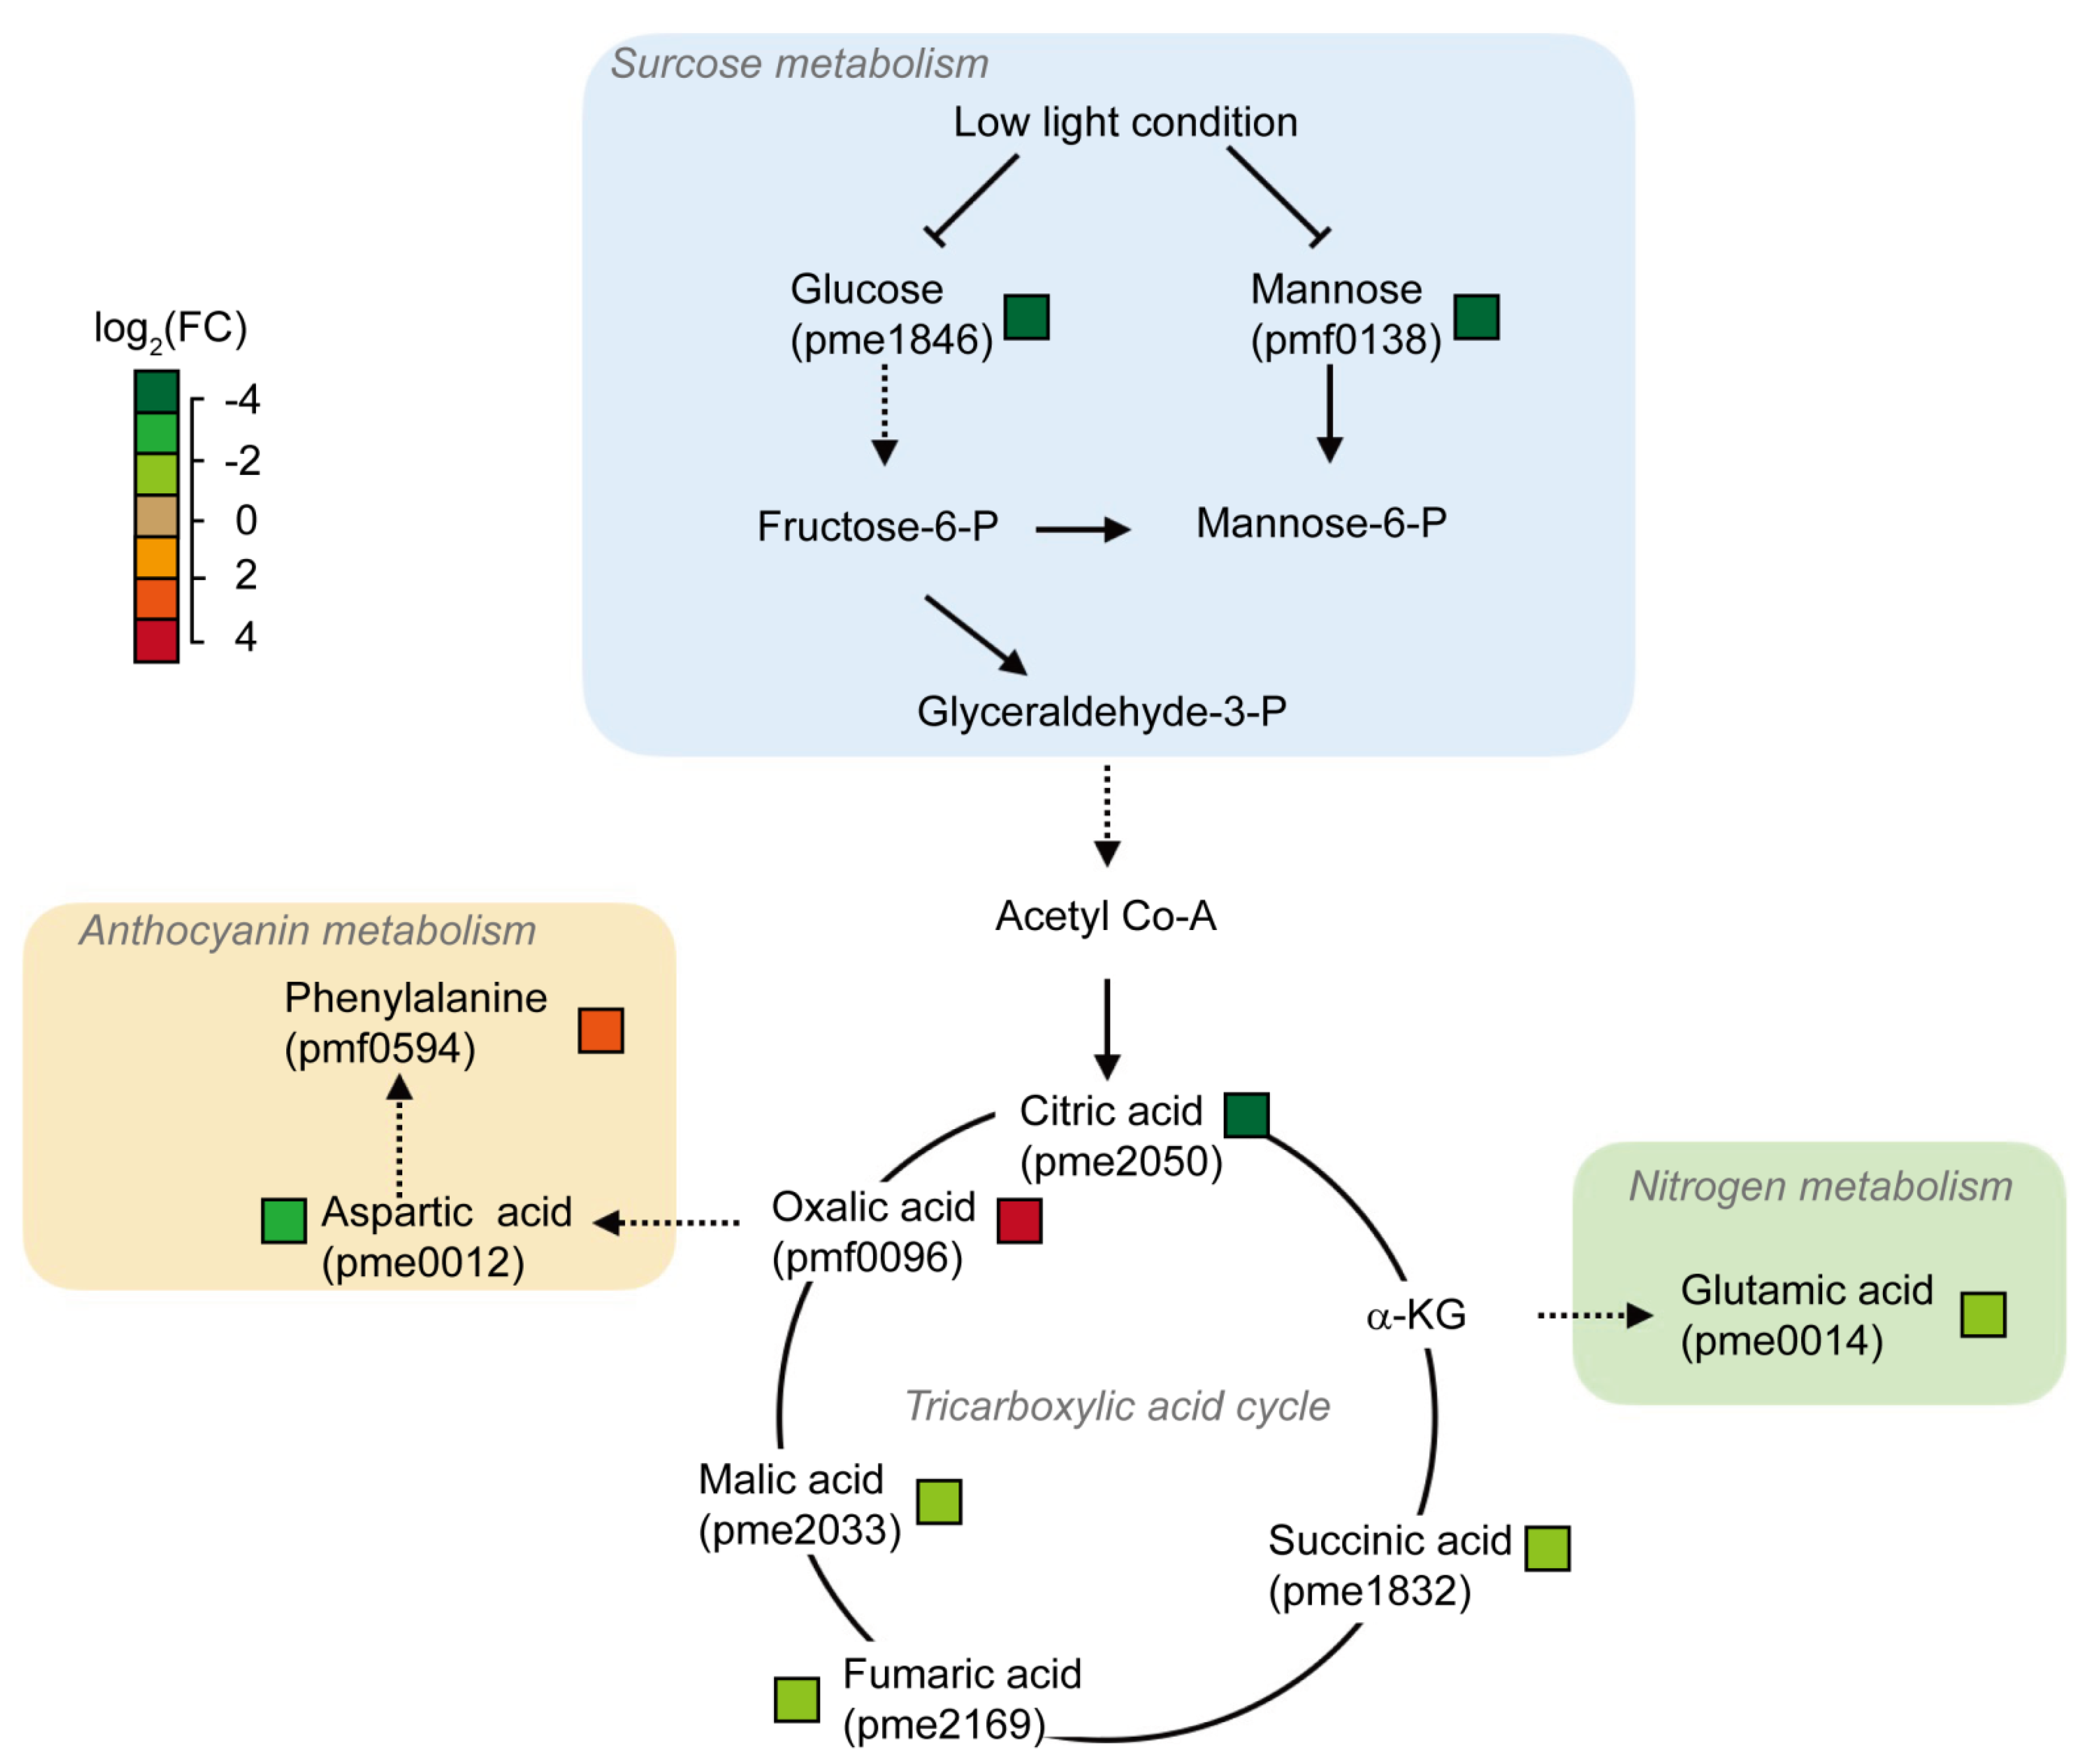
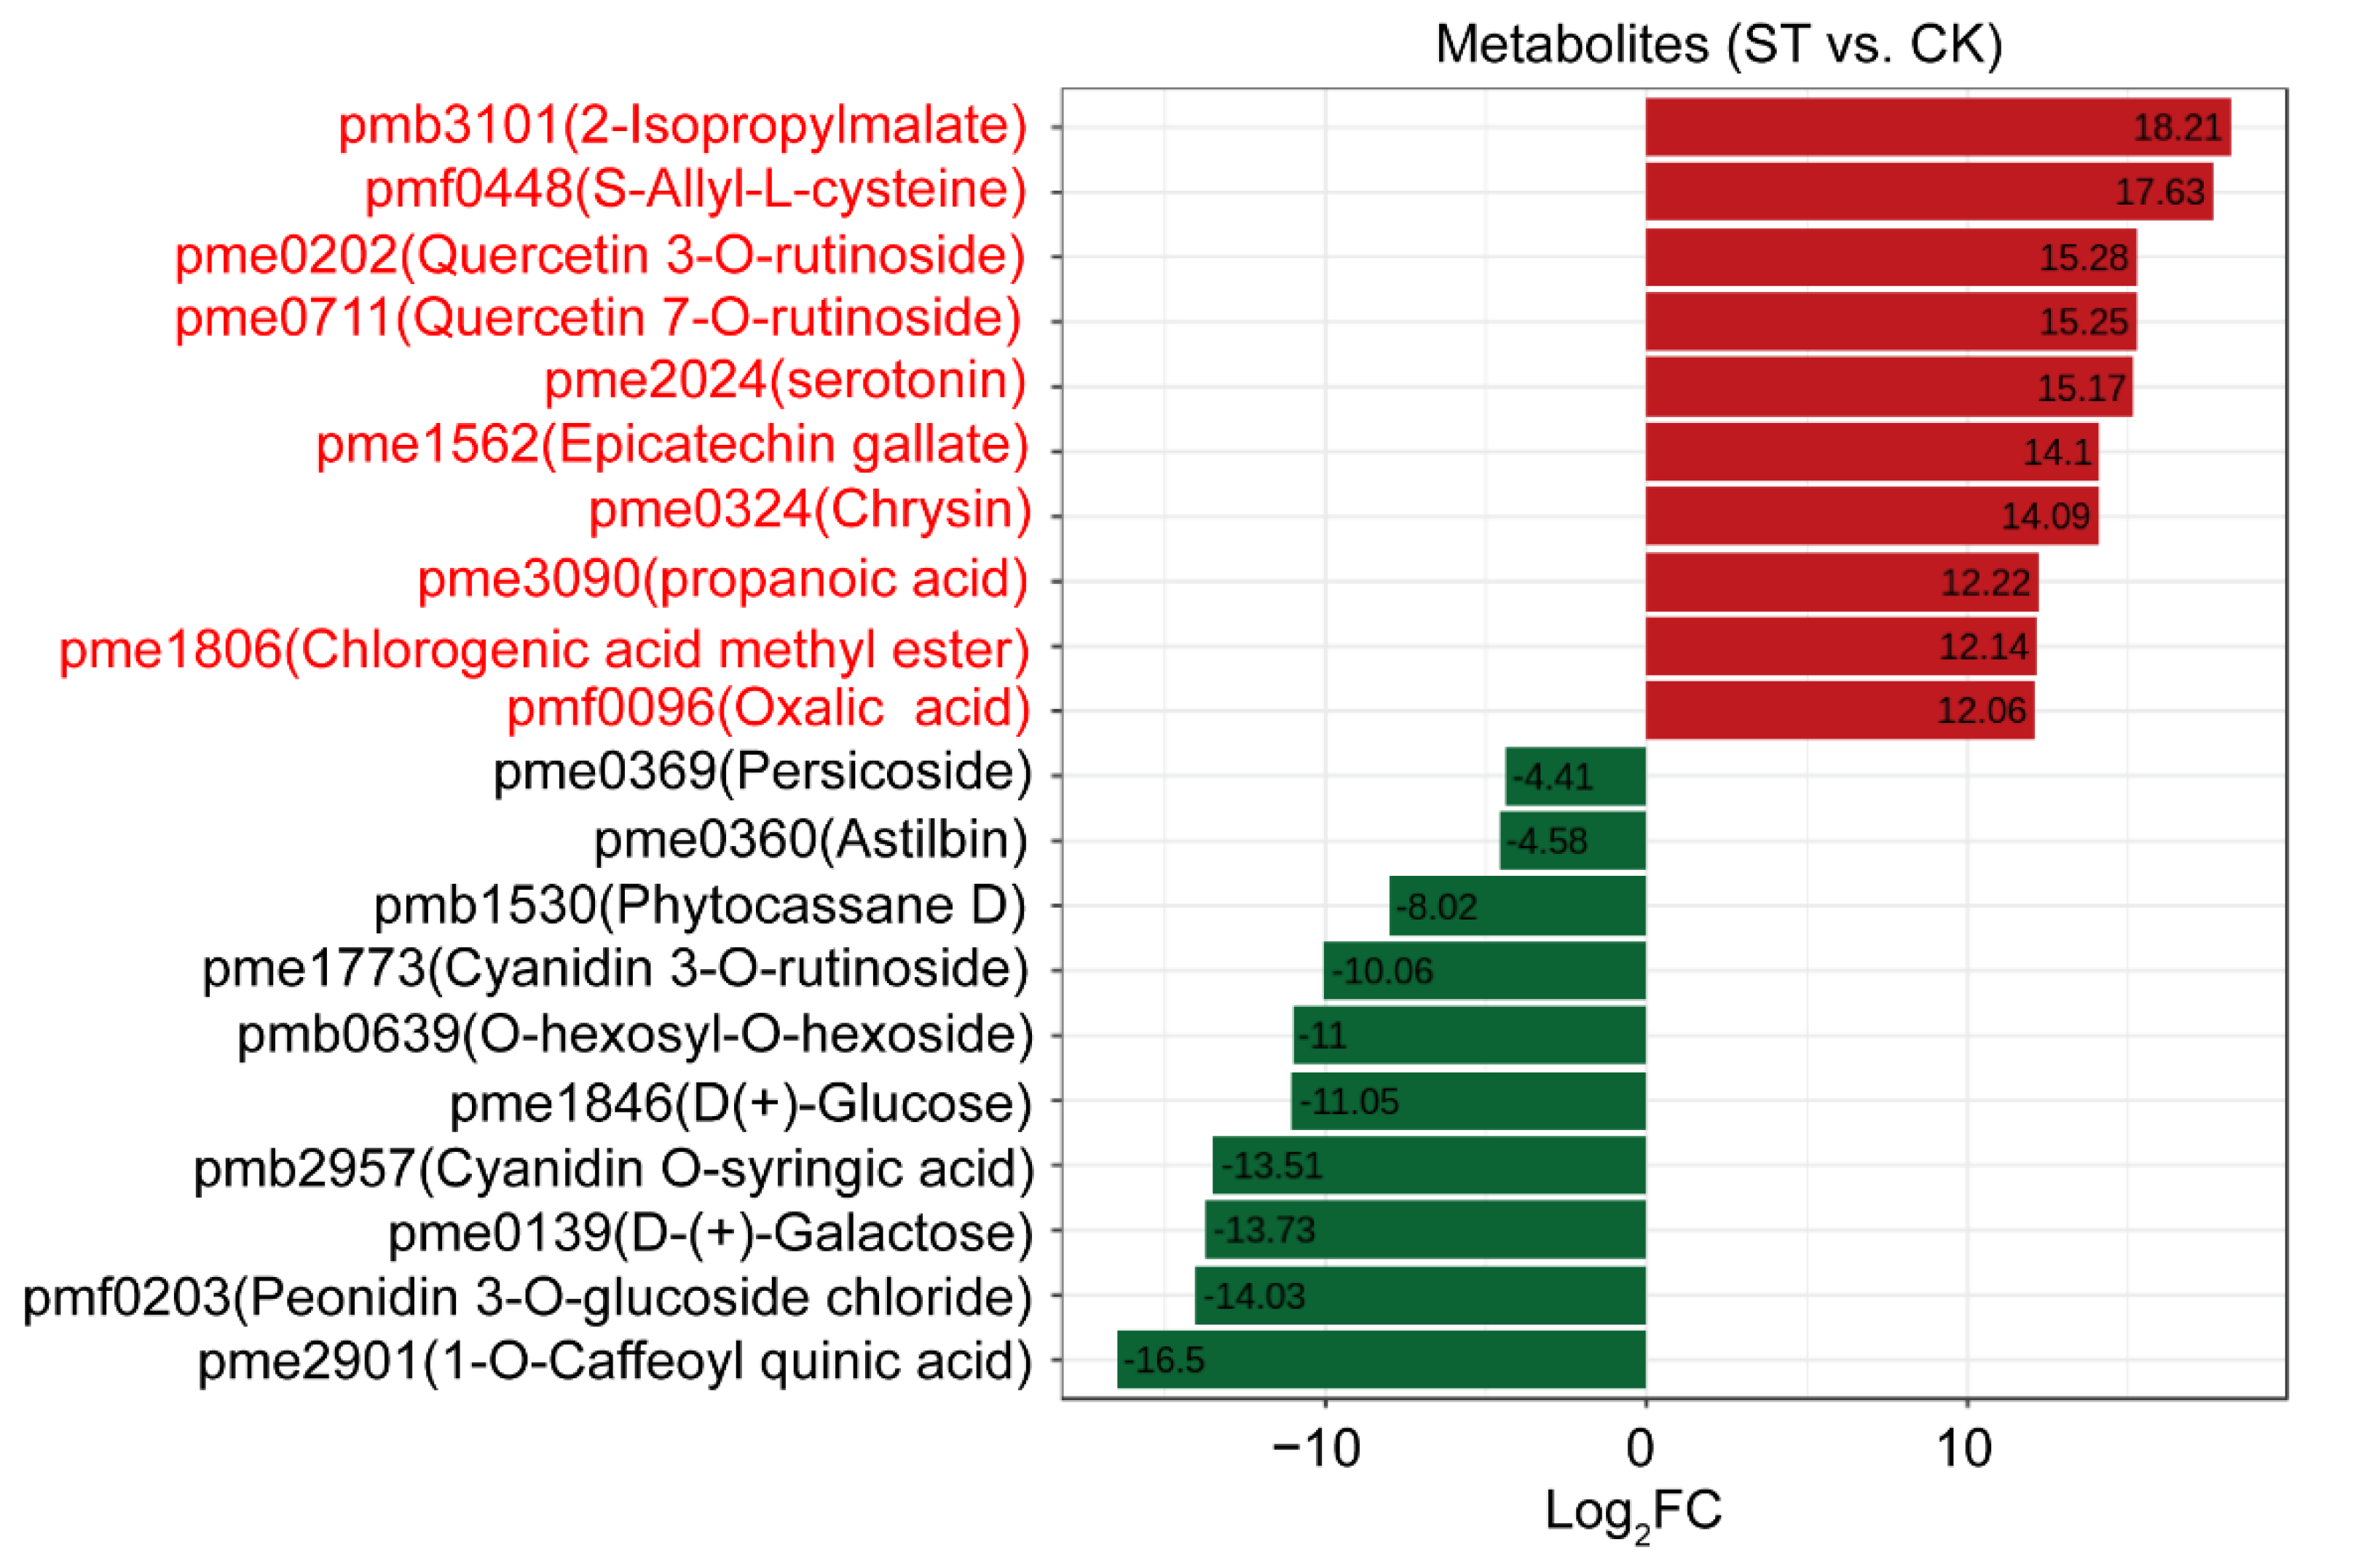
3.4. Extremely Differentially Abundant Metabolites Due to Low Light Effects

PCA shows that samples within the same treatment were tightly closed and the explanation rates for top PC1 and PC2 are 45.71% and 18.83%, respectively (Figure 6A). There are 290 differentially abundant metabolites (DAMs), among them, 118 and 172 were down and up-regulated, respectively (Figure 6B,C and Table S7). According to KEGG classification analysis, we found that the pathways of biosynthesis of secondary metabolites, phenylalanine metabolism, lysine degradation, glutathione metabolism, fructose and mannose metabolism, flavone and flavanol biosynthesis, citrate cycle, anthocyanin biosynthesis were significantly enriched in the list of DAMs (Figure 6D).
The responses of sucrose metabolism and citrate acid cycle pathways to low light in XH1 cai-tai seedling were further analyzed based on the metabolism analysis. Results show that eight metabolites related to sucrose metabolism and tricarboxylic acid cycle (TCA) cycle were downregulated by low light, with the log2(fold changes) ranged from -15 to -1.5 (Figure 7 and Table S7). By contrast, oxalic acid and phenylalanine were up-regulated by 4 and 1.4 times, respectively (Figure 7 and Table S7).
For DAMs related to anthocyanin biosynthesis pathway according to GO analysis, we identified 19 DAMs in total from anthocyanins, flavanone, terpene, amino acids and derivatives classes (Figure 8 and Table S8). In particular, both peonidin 3-O-glucoside chloride and cyanindin O-syringic acid were upregulated, while Cyanidin 3-O-rutinoside, Quercetin 7-O-rutinoside and rutin were all downregulated due to low light effects (Figure 8 and Table S8).

4. Discussion

Brassica is a typical vegetable and it is very famous in China, while it is very sensitive to light intensity. Low light not only induces the reduction in anthocyanin, but also influences fruit quality [27]. Therefore, understanding the molecular mechanism underlying low light acclimation is essential for the improvement of high-quality Brassica breeding. In this study, we performed an integrated analysis of transcriptome and metabolism in the petiole of a purple cai-tai, XH1 exposed to 10 days low light treatments. Here we discussed the potential roles of some key DEGs in altered anthocyanin biosynthesis caused by low light, with aiming towards gene engineering of high-anthocyanin Brassica in breeding.
Recently, the draft genome sequence of Brassica was completed, which is an important resource for genetic research of Brassica [28] and the genome sequence was updated later [29]. For the Brassica transcriptome, 45 GB clean reads of data were generated and assembled into 40 GB high-quality unique reads and Q30% were all 95% (Tables S2 and S3). In the current study, around 78% mapped reads were aligned with the Brassica rapa genome reference sequence (Version 1.2, http://brassicadb.org (accessed on 13 October 2020), which is very similar as reported previously [30]. Many genes related to photosynthetic process were inhibited by low light treatments from bioinformatic analysis upon the transcriptome dataset, such as proton gradient regulation 5 (PGR5, Bra000757) (Table S4). PGR5 plays an important role in photoprotection by increasing cyclic electron flow and ΔpH across the thylakoid membrane [31,32], and it transiently activates non-photochemical quenching at the onset of low light levels [33]. In addition, the expression of glyceraldehyde-3-phosphate dehydrogenase (Bra008416) involved in Calvin cycle is dramatically down-regulated due to low light effects (Table S4), which supports the observations that this gene could promote the shading tolerance in rice as observed in its overexpression lines [34].
Metabolomics and transcriptomics were extensively used to uncover the effects of different light regimes on anthocyanin synthesis in horticultural plants. Anthocyanin was accumulated in the light as reported in many horticultural plants including blood orange, purple pomelo lemon fruits, and purple aloes [35,36]. In particular, purple aloes do not synthesize anthocyanin in dark environments, but it can rapidly restore the synthesis of purple pigments under light conditions [36], which is also observed in the current study in petiole of XH1 cai-tai seedlings (Figure 1A). In terms of DEGs in purple aloe under dark versus light condition, the expression levels of genes encoding bHLH protein and MYB family were identified to be closely related to anthocyanin contents [36]. These genes together with WD40 protein form a MBW complex regulating anthocyanin biosynthesis [11]. Importantly, the abundances of these genes are also altered by low light treatments as observed in our study (Table S5). These findings confirm that the anthocyanin regulatory genes are crucial for anthocyanin accumulation in petiole of XH1 cai-tai seedlings. Notably, some transcription factors are also reported as negative regulators, such as MYB3, MYBL2 and CPC for anthocyanin accumulation [37,38] (Table S6).
Generally, anthocyanin is synthesized with an anthocyanin synthase (ANS) in its biosynthesis pathway [39]. In this study, we found that the abundance of ANS gene in Brassica rapa, i.e., BrLDOX (Bra019350) was decreased almost five times based on transcriptome (Table S6), suggesting anthocyanin biosynthetic pathway is dramatically inhibited by low light. In addition, the expression of some structural genes related to flavones biosynthesis pathway were also downregulated, such as chalcone synthase 3 (Bra023441), flavonone isomerase (Bra009101), flavanone 3-hydroxylase (Bra012862), dihydroflavonol-4-reductase (Bra027457), and 2-oxoglutarate 3-dioxygenase (Bra036828) with fold change ranged from two to eight (Figure 9A and Table S6). Gene expression levels of leucoanthocyanidin dioxygenase (Bra013652), dihydroflavonol-4-reductase (Bra027457), anthocyanidin 5-O-glucoside (Bra036208) and anthocyanin 5-O-glucosyltransferase (Bra038445) were further tested by q-RT-PCR (Figure 5B–F and Table S6). For DAMs related to anthocyanin biosynthesis pathway, we also found that 80% metabolites are downregulated, including naringenin 7-O-glucoside (pme0371), Naringenin(pme0376), phloretin (pme1201), quercetin (pme0199), kaempferol 3-O-rutinoside (pme0370), except for quercetin 3-O-rutinoside (pmb0711) (Table S8). This is also observed in other studies under other abiotic stress, such as ABA treatments [40], heat stress [41] and drought stress [42].
Many transcription factors were reported to be involved in regulation of anthocyanin biosynthetic process, such as R2R3-MYB, bZIP, and bHLH [43,44]. The TCP transcription factor represents a plant-specific gene family and acts on multiple functions in controlling plant growth, development, stress response, and the circadian clock [45]. In this study, we found that the expression of all five TCPs genes detected in transcription factor list were downregulated by low light treatment (Table S5). In particular, the expression level of a transcription factor, BrTCP15 in TCP gene family is dramatically inhibited by low light treatment based on both transcriptomes and q-RT-PCR results (Figure 5A and Table S4). Interestingly, TCP15 is reported as a negative regulator in anthocyanin accumulation [41]. BrTCP15 gene expression level and anthocyanin contents were simultaneously decreased under low light condition (Figure 1A and Figure 5A), which could be attributed to two aspects:
(1)
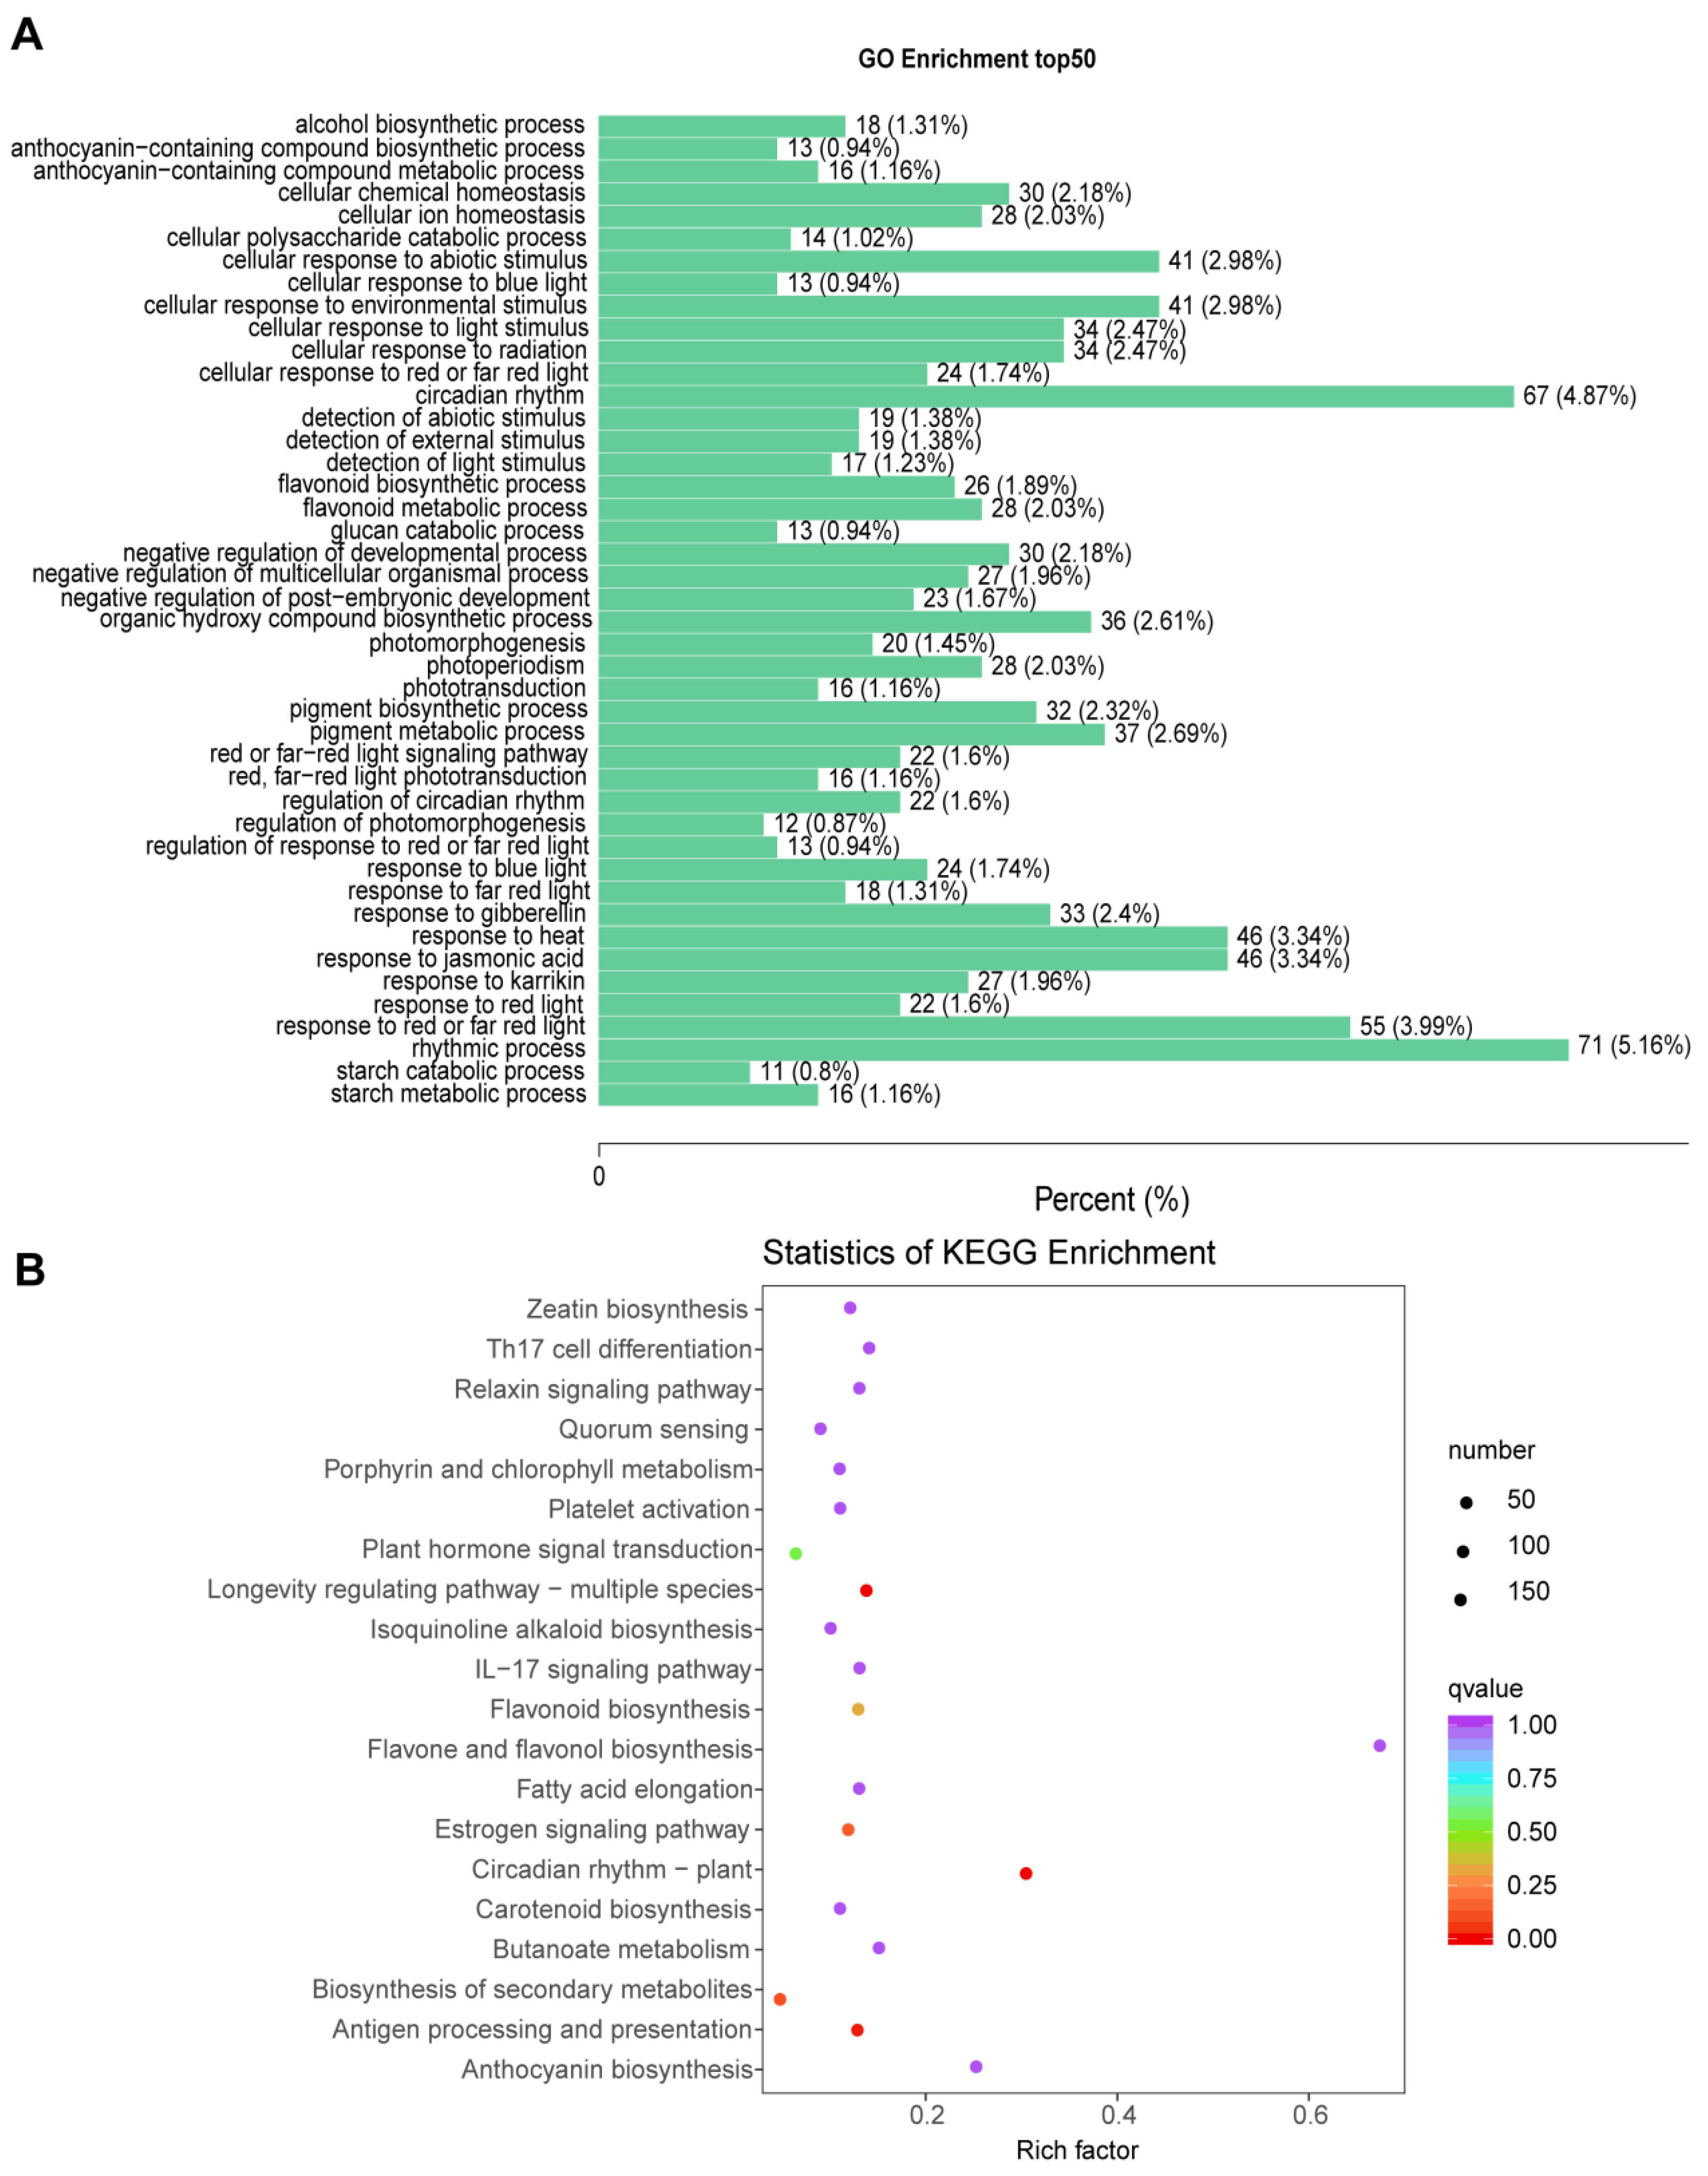
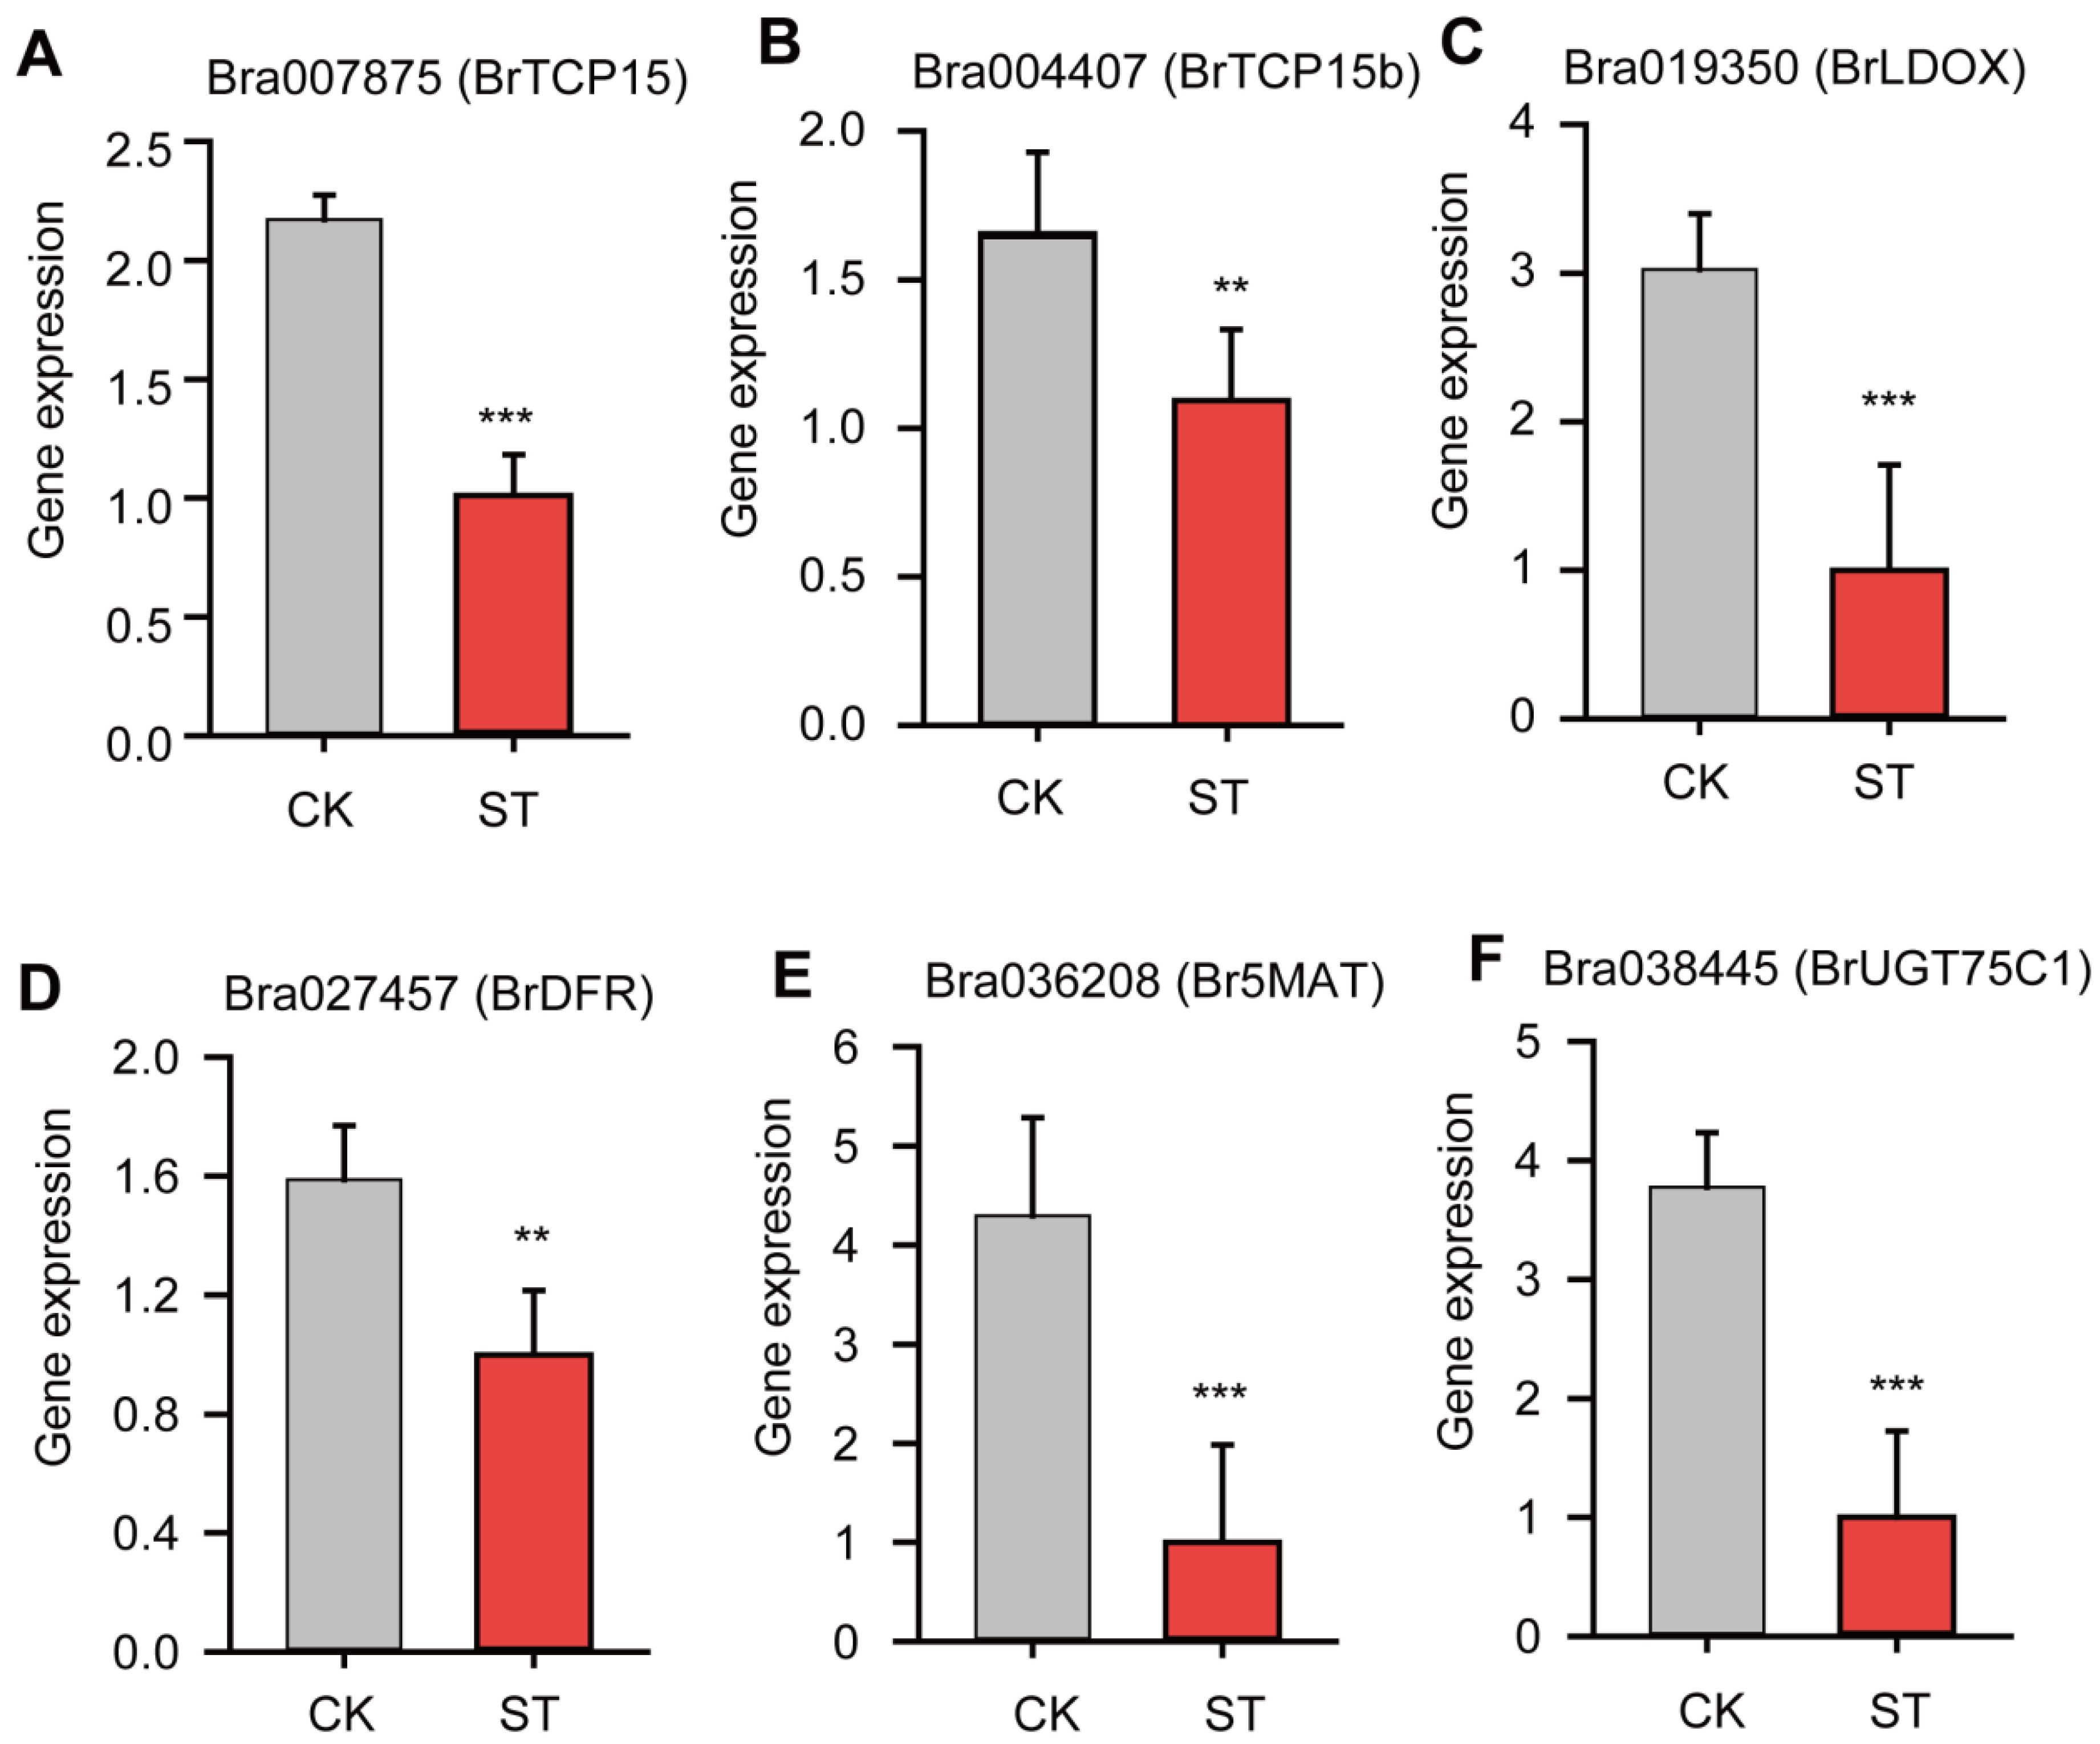
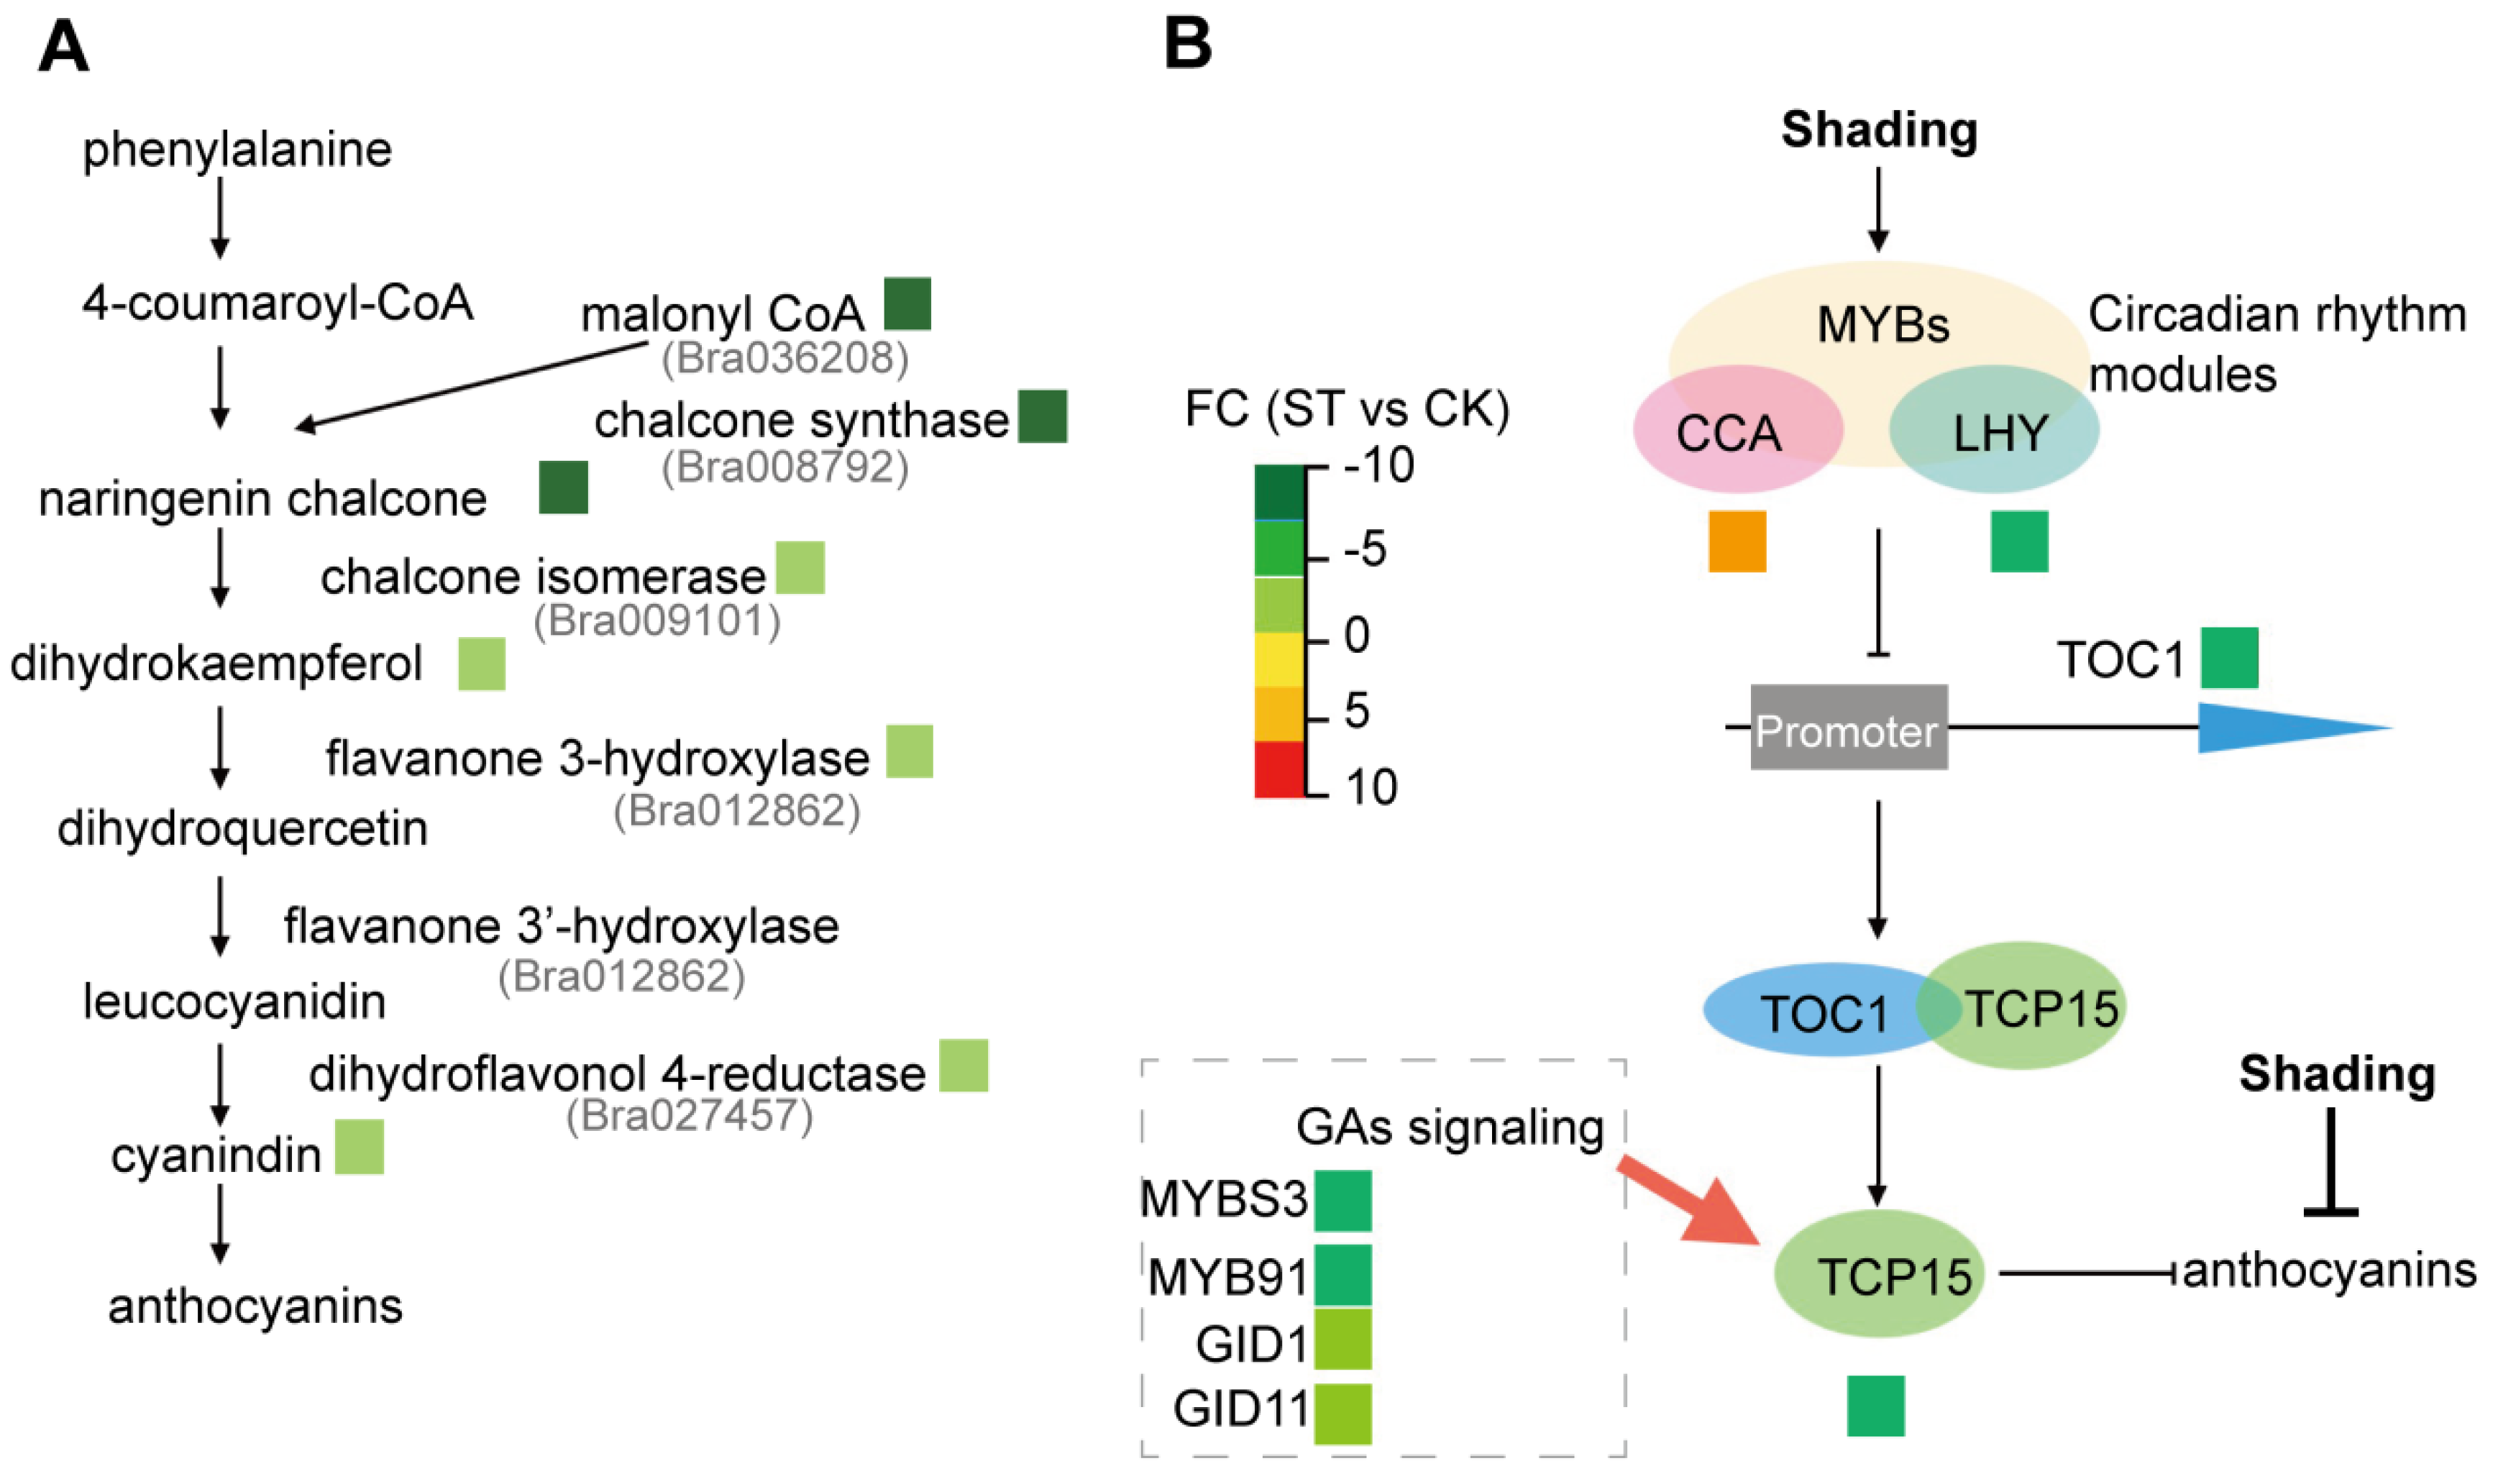
TCP15 was reported to be related to circadian rhythm pathway [42]. Consistently, circadian rhythm pathway was the most significantly enriched in the list of DEGs according to both GO and KEGG analysis (Figure 3A,B). In Arabidopsis, there is much known about the molecular basis of the circadian clock [44,45]. The key loop includes two partially overlapped MYB domain transcription factors, CIRCADIAN CLOCK ASSOCAITED1 (CCA1) and LATE ELONGATED HYPOCOTYL (LHY). These three proteins form a negative arm that binds to TIMING OF CAB EXPRESSION1 (TOC1) promoter [44]. TOC1 could interact with CCA1 HIKING EXPENITION (CHE, i.e., BrTCP15 reported in our study), hence leads to decreased BrTCP15 gene expression [12].
(2)
The decreased BrTCP15 gene expression could be also related to downregulated expression of some genes involved in the gibberellin (GA) signaling pathway, such as Bra002790, Bra005177, Bra005899 and Bra009207 (Figure 9B and Table S9). TCP15 participates in the GA-signaling pathway, responded to abiotic stresses and hormone signals, for example, in Fraxinus mandshurica Rupr [45]. Therefore, low light probably inhibits the GA signaling process and hence suppresses BrTCP15 gene expression. The anthocyanin degradation under low light condition is mainly ascribed to inhibitory effects on gene expression involved in the anthocyanin biosynthetic pathway, rather than regulatory effects by BrTCP15.

5. Conclusions

In summary, based on an integrated analysis of transcriptome and metabolism, we found 1022 downregulated and 884 upregulated genes by low light treatment in petiole of XH1 cai-tai seedlings. Flavone and anthocyanin biosynthesis pathways were significantly enriched in the DEG list induced by low light. Five TCP gene expression abundances were confirmed to be downregulated by low light especially for BrTCP15. This study reports an inhibitory effect of low light on anthocyanin accumulation in petiole of XH1 cai-tai seedlings, and this inhibitory effect is closely related to BrTCP15 regulation.

Supplementary Materials

The following supporting information can be downloaded at: https://www.mdpi.com/article/10.3390/horticulturae8070566/s1, Figure S1: Quality control of transcriptome analysis; Figure S2: Statistical analysis on reads alignments; Figure S3: Summary of gene annotation; Figure S4: FPKM analysis from transcriptome; Table S1: Primer list used in this study; Table S2: Quality control for transcriptome data from low light treatments of the petiole of XH1 (Brassica rapa L.); Table S3: Reads numbers statistical analysis from transcriptome analysis from low light treatments of the petiole of XH1 (Brassica rapa L.); Table S4: All differentially expressed genes induced by low light treatments in petiole of XH1 (Brassica rapa L.); Table S5: Transcription factors with differential expression induced by low light treatments in petiole of XH1 (Brassica rapa L.); Table S6: Differentially expressed genes related to anthocyanin biosynthesis induced by low light treatments in petiole of XH1 (Brassica rapa L.); Table S7: All detected metabolites with differential abundance induced by low light treatments in petiole of XH1 (Brassica rapa L.); Table S8: Metabolites with differential abundance related to anthocyanin biosynthesis induced by low light treatments in petiole of XH1 (Brassica rapa L); Table S9: Differentially expressed genes related to circadian rhythm induced by low light treatments in petiole of XH1 (Brassica rapa L.).

Author Contributions

Conceptualization, J.G., T.W. (Tingqin Wang) and Y.K.; methodology, T.W. (Tingqin Wang), T.W. (Tingquan Wu) and M.F.; investigation, T.W. (Tingqin Wang), T.W. (Tingquan Wu), M.F., G.L. and W.L.; statistical analysis, M.F., G.L., W.L. and Y.K.; writing, J.G. and T.W. (Tingqin Wang); funding acquisition, J.G., T.W. (Tingqin Wang) and Y.K.; resources, J.G. and T.W. (Tingqin Wang), supervision, J.G., T.W. (Tingqin Wang) and Y.K. All authors have read and agreed to the published version of the manuscript.

Funding

This research was funded by Projects of the Department of Agriculture of Guangdong Province (Project No. 2022KJ122); Guangdong Science and Technology Department (Project No.2018A0303130316).

Institutional Review Board Statement

Not applicable.

Informed Consent Statement

Not applicable.

Data Availability Statement

The sequencing data generated in this study have been deposited in the NCBI GEO (Gene Expression Omnibus) database under accession code SRR18150630.

Acknowledgments

The authors would like to thank Zhongkang Omics Biotech. Co., Ltd. for technical service on bioinformatics analysis.

Conflicts of Interest

The authors declare no conflict of interest.

References

  1. Melim, C.; Lauro, M.R.; Pires, I.M.; Oliveira, P.J.; Cabral, C. The Role of Glucosinolates from Cruciferous Vegetables (Brassicaceae) in Gastrointestinal Cancers: From Prevention to Therapeutics. Pharmaceutics 2022, 14, 190. [Google Scholar] [CrossRef]
  2. Rochfort, S.J.; Imsic, M.; Jones, R.; Trenerry, V.C.; Tomkins, B. Characterization of Flavonol Conjugates in Immature Leaves of Pak Choi [Brassica rapa L. Ssp. chinensis L. (Hanelt.)] by HPLC-DAD and LC-MS/MS. J. Agric. Food Chem. 2006, 54, 4855–4860. [Google Scholar] [CrossRef]
  3. Guo, N.; Cheng, F.; Wu, J.; Liu, B.; Zheng, S.; Liang, J.; Wang, X. Anthocyanin Biosynthetic Genes in Brassica rapa. BMC Genom. 2014, 15, 426. [Google Scholar] [CrossRef] [Green Version]
  4. Bell, G.E.; Danneberger, T.K.; McMahon, M.J. Spectral Irradiance Available for Turfgrass Growth in Sun and Shade. Crop Sci. 2000, 40, 189–195. [Google Scholar] [CrossRef]
  5. Chen, H.; Li, Q.-P.; Zeng, Y.-L.; Deng, F.; Ren, W.-J. Effect of Different Shading Materials on Grain Yield and Quality of Rice. Sci. Rep. 2019, 9, 9992. [Google Scholar] [CrossRef]
  6. Wang, L.; Deng, F.; Ren, W.-J.; Yang, W.-Y. Effects of Shading on Starch Pasting Characteristics of Indica Hybrid Rice (Oryza sativa L.). PLoS ONE 2013, 8, e68220. [Google Scholar] [CrossRef] [Green Version]
  7. Möller, M.; Assouline, S. Effects of a Shading Screen on Microclimate and Crop Water Requirements. Irrig. Sci. 2007, 25, 171–181. [Google Scholar] [CrossRef]
  8. Mu, H.; Jiang, D.; Wollenweber, B.; Dai, T.; Jing, Q.; Cao, W. Long-Term Low Radiation Decreases Leaf Photosynthesis, Photochemical Efficiency and Grain Yield in Winter Wheat. J. Agron. Crop Sci. 2010, 196, 38–47. [Google Scholar] [CrossRef]
  9. Fukuoka, N.; Suzuki, T.; Minamide, K.; Hamada, T. Effect of Shading on Anthocyanin and Non-Flavonoid Polyphenol Biosynthesis of Gynura Bicolor Leaves in Midsummer. HortScience 2014, 49, 1148–1153. [Google Scholar] [CrossRef] [Green Version]
  10. Zhu, H.; Xiaofeng, L.; Zhai, W.; Liu, Y.; Gao, Q.; Liu, J.; Ren, L.; Chen, H.; Zhu, Y. Effects of Low Light on Photosynthetic Properties, Antioxidant Enzyme Activity, and Anthocyanin Accumulation in Purple Pak-Choi (Brassica campestris Ssp. Chinensis Makino). PLoS ONE 2017, 12, e0179305. [Google Scholar] [CrossRef]
  11. Ramsay, N.A.; Glover, B.J. MYB-BHLH-WD40 Protein Complex and the Evolution of Cellular Diversity. Trends Plant Sci. 2005, 10, 63–70. [Google Scholar] [CrossRef]
  12. Zhang, F.; Gonzalez, A.; Zhao, M.; Payne, C.T.; Lloyd, A. A Network of Redundant BHLH Proteins Functions in All TTG1-Dependent Pathways of Arabidopsis. Development 2003, 130, 4859–4869. [Google Scholar] [CrossRef] [Green Version]
  13. Gonzalez, A.; Zhao, M.; Leavitt, J.M.; Lloyd, A.M. Regulation of the Anthocyanin Biosynthetic Pathway by the TTG1/BHLH/Myb Transcriptional Complex in Arabidopsis Seedlings. Plant J. 2008, 53, 814–827. [Google Scholar] [CrossRef]
  14. Li, J.; Essemine, J.; Shang, C.; Zhang, H.; Zhu, X.; Yu, J.; Chen, G.; Qu, M.; Sun, D. Combined Proteomics and Metabolism Analysis Unravels Prominent Roles of Antioxidant System in the Prevention of Alfalfa (Medicago sativa L.) against Salt Stress. Int. J. Mol. Sci. 2020, 21, 909. [Google Scholar] [CrossRef] [Green Version]
  15. Qu, M.; Chen, G.; Bunce, J.; Zhu, X.; Sicher, R. Systematic Biology Analysis on Photosynthetic Carbon Metabolism of Maize Leaf Following Sudden Heat Shock under Elevated CO2. Sci. Rep. 2018, 8, 7849. [Google Scholar] [CrossRef]
  16. Wang, N.; Shu, X.; Zhang, F.; Zhuang, W.; Wang, T.; Wang, Z. Comparative Transcriptome Analysis Identifies Key Regulatory Genes Involved in Anthocyanin Metabolism During Flower Development in Lycoris radiata. Front. Plant Sci. 2021, 12, 761862. [Google Scholar] [CrossRef]
  17. Wagner, G.P.; Kin, K.; Lynch, V.J. Measurement of MRNA Abundance Using RNA-Seq Data: RPKM Measure Is Inconsistent among Samples. Theory Biosci. 2012, 131, 281–285. [Google Scholar] [CrossRef]
  18. Li, B.; Dewey, C.N. RSEM: Accurate Transcript Quantification from RNA-Seq Data with or without a Reference Genome. BMC Bioinform. 2011, 12, 323. [Google Scholar] [CrossRef] [Green Version]
  19. Robinson, M.D.; McCarthy, D.J.; Smyth, G.K. EdgeR: A Bioconductor Package for Differential Expression Analysis of Digital Gene Expression Data. Bioinformatics 2010, 26, 139–140. [Google Scholar] [CrossRef] [Green Version]
  20. Xie, C.; Mao, X.; Huang, J.; Ding, Y.; Wu, J.; Dong, S.; Kong, L.; Gao, G.; Li, C.-Y.; Wei, L. KOBAS 2.0: A Web Server for Annotation and Identification of Enriched Pathways and Diseases. Nucleic Acids Res. 2011, 39, W316–W322. [Google Scholar] [CrossRef] [Green Version]
  21. Livak, K.J.; Schmittgen, T.D. Analysis of Relative Gene Expression Data Using Real-Time Quantitative PCR and the 2(-Delta Delta C(T)) Method. Methods 2001, 25, 402–408. [Google Scholar] [CrossRef] [PubMed]
  22. Jaakola, L.; Zoratti, L.; Giongo, L.; Karppinen, K.; Uleberg, E.; Martinussen, I.; Häggman, H. Influence of Light and Temperature Conditions on Anthocyanin Accumulation in Vaccinium Spp. Berries. In Proceedings of the Acta Horticulturae; International Society for Horticultural Science (ISHS), Leuven, Belgium, 25 November 2017; pp. 321–326. [Google Scholar]
  23. Wang, X.; Wang, H.; Wang, J.; Sun, R.; Wu, J.; Liu, S.; Bai, Y.; Mun, J.-H.; Bancroft, I.; Cheng, F.; et al. The Genome of the Mesopolyploid Crop Species Brassica rapa. Nat. Genet. 2011, 43, 1035–1039. [Google Scholar] [CrossRef] [Green Version]
  24. Cai, C.; Wang, X.; Liu, B.; Wu, J.; Liang, J.; Cui, Y.; Cheng, F.; Wang, X. Brassica rapa Genome 2.0: A Reference Upgrade through Sequence Re-Assembly and Gene Re-Annotation. Mol. Plant 2017, 10, 649–651. [Google Scholar] [CrossRef] [PubMed] [Green Version]
  25. Chen, J.; Pang, W.; Chen, B.; Zhang, C.; Piao, Z. Transcriptome Analysis of Brassica rapa Near-Isogenic Lines Carrying Clubroot-Resistant and -Susceptible Alleles in Response to Plasmodiophora brassicae during Early Infection. Front. Plant Sci. 2015, 6, 1183. [Google Scholar] [CrossRef] [PubMed] [Green Version]
  26. Munekage, Y.; Hojo, M.; Meurer, J.; Endo, T.; Tasaka, M.; Shikanai, T. PGR5 Is Involved in Cyclic Electron Flow around Photosystem I and Is Essential for Photoprotection in Arabidopsis. Cell 2002, 110, 361–371. [Google Scholar] [CrossRef] [Green Version]
  27. Johnson, G.N. Physiology of PSI Cyclic Electron Transport in Higher Plants. Biochim. Biophys. Acta 2011, 1807, 384–389. [Google Scholar] [CrossRef]
  28. Wolf, B.-C.; Isaacson, T.; Tiwari, V.; Dangoor, I.; Mufkadi, S.; Danon, A. Redox Regulation of PGRL1 at the Onset of Low Light Intensity. Plant J. 2020, 103, 715–725. [Google Scholar] [CrossRef]
  29. Liu, Y.; Pan, T.; Tang, Y.; Zhuang, Y.; Liu, Z.; Li, P.; Li, H.; Huang, W.; Tu, S.; Ren, G.; et al. Proteomic Analysis of Rice Subjected to Low Light Stress and Overexpression of OsGAPB Increases the Stress Tolerance. Rice 2020, 13, 30. [Google Scholar] [CrossRef]
  30. Huang, D.; Yuan, Y.; Tang, Z.; Huang, Y.; Kang, C.; Deng, X.; Xu, Q. Retrotransposon Promoter of Ruby1 Controls Both Light- and Cold-Induced Accumulation of Anthocyanins in Blood Orange. Plant. Cell Environ. 2019, 42, 3092–3104. [Google Scholar] [CrossRef]
  31. Dong, T.; Han, R.; Yu, J.; Zhu, M.; Zhang, Y.; Gong, Y.; Li, Z. Anthocyanins Accumulation and Molecular Analysis of Correlated Genes by Metabolome and Transcriptome in Green and Purple Asparaguses (Asparagus officinalis, L.). Food Chem. 2019, 271, 18–28. [Google Scholar] [CrossRef]
  32. Dubos, C.; Le Gourrierec, J.; Baudry, A.; Huep, G.; Lanet, E.; Debeaujon, I.; Routaboul, J.-M.; Alboresi, A.; Weisshaar, B.; Lepiniec, L. MYBL2 Is a New Regulator of Flavonoid Biosynthesis in Arabidopsis thaliana. Plant J. 2008, 55, 940–953. [Google Scholar] [CrossRef] [PubMed]
  33. Zhu, H.-F.; Fitzsimmons, K.; Khandelwal, A.; Kranz, R.G. CPC, a Single-Repeat R3 MYB, Is a Negative Regulator of Anthocyanin Biosynthesis in Arabidopsis. Mol. Plant 2009, 2, 790–802. [Google Scholar] [CrossRef]
  34. Broun, P. Transcriptional Control of Flavonoid Biosynthesis: A Complex Network of Conserved Regulators Involved in Multiple Aspects of Differentiation in Arabidopsis. Curr. Opin. Plant Biol. 2005, 8, 272–279. [Google Scholar] [CrossRef] [PubMed]
  35. Zhu, M.; Assmann, S.M. Metabolic Signatures in Response to Abscisic Acid (ABA) Treatment in Brassica napus Guard Cells Revealed by Metabolomics. Sci. Rep. 2017, 7, 12875. [Google Scholar] [CrossRef] [PubMed] [Green Version]
  36. de Leonardis, A.M.; Fragasso, M.; Beleggia, R.; Ficco, D.B.M.; de Vita, P.; Mastrangelo, A.M. Effects of Heat Stress on Metabolite Accumulation and Composition, and Nutritional Properties of Durum Wheat Grain. Int. J. Mol. Sci. 2015, 16, 30382–30404. [Google Scholar] [CrossRef] [Green Version]
  37. Naing, A.H.; Kim, C.K. Abiotic Stress-Induced Anthocyanins in Plants: Their Role in Tolerance to Abiotic Stresses. Physiol. Plant. 2021, 172, 1711–1723. [Google Scholar] [CrossRef] [PubMed]
  38. Stracke, R.; Ishihara, H.; Huep, G.; Barsch, A.; Mehrtens, F.; Niehaus, K.; Weisshaar, B. Differential Regulation of Closely Related R2R3-MYB Transcription Factors Controls Flavonol Accumulation in Different Parts of the Arabidopsis thaliana Seedling. Plant J. 2007, 50, 660–677. [Google Scholar] [CrossRef] [Green Version]
  39. Zhou, B.; Leng, J.; Ma, Y.; Fan, P.; Li, Y.; Yan, H.; Xu, Q. BrmiR828 Targets BrPAP1, BrMYB82, and BrTAS4 Involved in the Light Induced Anthocyanin Biosynthetic Pathway in Brassica rapa. Int. J. Mol. Sci. 2020, 21, 4326. [Google Scholar] [CrossRef]
  40. Liang, N.; Zhan, Y.; Yu, L.; Wang, Z.; Zeng, F. Characteristics and Expression Analysis of FmTCP15 under Abiotic Stresses and Hormones and Interact with DELLA Protein in Fraxinus mandshurica Rupr. Forests 2019, 10, 343. [Google Scholar] [CrossRef] [Green Version]
  41. Viola, I.L.; Camoirano, A.; Gonzalez, D.H. Redox-Dependent Modulation of Anthocyanin Biosynthesis by the TCP Transcription Factor TCP15 during Exposure to High Light Intensity Conditions in Arabidopsis. Plant Physiol. 2016, 170, 74–85. [Google Scholar] [CrossRef] [Green Version]
  42. Kim, J.A.; Kim, H.-S.; Choi, S.-H.; Jang, J.-Y.; Jeong, M.-J.; Lee, S.I. The Importance of the Circadian Clock in Regulating Plant Metabolism. Int. J. Mol. Sci. 2017, 18, 2680. [Google Scholar] [CrossRef] [PubMed] [Green Version]
  43. McClung, C.R. Comes a Time. Curr. Opin. Plant Biol. 2008, 11, 514–520. [Google Scholar] [CrossRef] [PubMed]
  44. Harmer, S.L. The Circadian System in Higher Plants. Annu. Rev. Plant Biol. 2009, 60, 357–377. [Google Scholar] [CrossRef] [PubMed] [Green Version]
  45. Pruneda-Paz, J.L.; Breton, G.; Para, A.; Kay, S.A. A Functional Genomics Approach Reveals CHE as a Component of the Arabidopsis Circadian Clock. Science 2009, 323, 1481–1485. [Google Scholar] [CrossRef] [Green Version]
Figure 1. Transcriptome and metabolic analysis in low light treated petiole of XH1 cai-tai seedlings. (A) Images of XH1 exposed to low light treatments (ST) for different days and enlarged images showing the differences of anthocyanin accumulation in the petiole of XH1. Pearson correlation of biological samples for transcriptome (B) and metabolism (C). Different colors represent the ranged values of Pearson correlation coefficient between samples.
Horticulturae 08 00566 g001
Figure 2. Low light treatment induced gene expression in the petiole of XH1 cai-tai seedlings. (A) Principal component analysis. (B) Volcano plot representing the differentially expressed genes induced by low light treatment.
Horticulturae 08 00566 g002
Figure 3. Bioinformatic analysis on differentially expressed genes induced by low light treatments in the petiole of XH1 cai-tai seedlings. (A) Top 50 terms based on Gene Ontologies (GO) enrichment analysis. (B) Top 20 terms based on Kyoto Encyclopedia of Genes and Genomes (KEGG) analysis.
Horticulturae 08 00566 g003
Figure 4. Distribution of transcription factors gene family with differential expression induced by low light treatments. (A) Upregulated. (B) Downregulated. (C) Heatmap representing the differentially expressed genes related to the anthocyanin biosynthesis pathway induced by low light treatment (ST) and control (CK).
Horticulturae 08 00566 g004
Figure 5. Differential expression of key genes induced by low light treatments in XH1 cai-tai seedlings. (AF) q-RT-PCR testing the expression levels of genes, including Bra007875, Bra004407, Bra019350, Bra027457, Bra036208 and Bra038445, respectively. The q-RT-PCR experiments were conducted with three biological replicates, and three technical replicates for each biological replicate. The significant levels were determined between control and low light treated samples using t-test, at p < 0.01, and 0.001 indicated by “**” and “***”, respectively. The primer of each gene was listed in Table S1.
Horticulturae 08 00566 g005
Figure 6. Differentially abundant metabolites induced by low light treatments in the petiole of XH1 cai-tai seedlings. (A) Principal component analysis across samples. (B) Volcano plot representing the differentially abundant metabolites (DAMs). (C) Heatmap showing DAM induced by low light treatments. (D) KEGG analysis on DAMs induced by low light treatments.
Horticulturae 08 00566 g006
Figure 7. Metabolic pathways of sucrose degradation and tricarboxylic acid cycle in response to low light in XH1 cai-tai seedlings. FC: fold change of the abundance of each metabolite determined in XH1 in low light versus high light.
Horticulturae 08 00566 g007
Figure 8. Heatmap representing the changes of metabolites related to anthocyanin metabolic pathway in response to low light treatments. The detailed abundance of metabolites was referred to in Table S8.
Horticulturae 08 00566 g008
Figure 9. Working model showing anthocyanin metabolic pathway in response to low light treatments. (A) Anthocyanin biosynthetic pathway in response to low light treatments in XH1. (B) Proposed molecular mechanism that low light inhibits anthocyanin biosynthesis through stimulating BrTCP15 gene expression coordinated with some other pathways such as circadian rhythm. The gene ID of MYBS3, MYB91, GID1 and GID11 are Bra002790, Bra005177, Bra005899 and Bra009207, respectively. CCA, LHY and TOC1 are Bra004503, Bra028258 and Bra035933, respectively. All the differentially expressed genes were listed in Table S9.
Horticulturae 08 00566 g009
Publisher’s Note: MDPI stays neutral with regard to jurisdictional claims in published maps and institutional affiliations.

