Abstract
The importance of inorganic fertilizers in squash crop productivity is enormous. However, the continuous use of inorganic fertilizers constitutes a serious problem to the environment and human health due to nitrate accumulation. Thus, two seasons (2020 and 2021) of field trials were carried out to investigate the effects of bio-organic amendments on squash under arid land conditions in Saudi Arabia. The bio-organic amendments were comprised of humic acid (HA) at three levels (0, 50 and 100 L/ha), inoculation of a cellulose-decomposing bacterium (CDB; Geobacillus stearothermophilus SSK-2018) and wheat straw at four levels (0, 20 and 30 t/ha and NPK 20:20:20 at 600 kg/ha as a positive control). A randomized split-split plot design replicated three times was used in laying out the field trials. The independent application of HA, CDB and wheat straw significantly (p ≤ 0.05) improved squash growth, yield and water-use efficiency in both seasons. Furthermore, HA significantly (p ≤ 0.05) reduced fruits’ nitrate content. HA (100 L/ha) reduced nitrate content in squash fruits by 87% and 71.6% compared to the control in 2020 and 2021, respectively. The application of 20 t/ha of wheat straw significantly (p ≤ 0.05) reduced nitrate accumulation in fruits compared to the positive control (NPK) by 5.9% and 13.6% in 2019/20 and 2020/21, respectively. Regression analysis shows that increased nitrate accumulation in fruits results in decreased squash growth and fruit yield. This study demonstrates the significance of bio-organic amendments in improving squash growth and yield while reducing nitrate accumulation in fruits.
1. Introduction
Squash (Cucurbita pepo L.) is a horticultural crop cultivated for its fruit and vegetable parts containing several nutritive components of high value in human’s dietary needs [1,2]. Squash is a short-duration crop (2 to 3 months growing period) with a tendency to accumulate a high amount of nutrients (including nitrates and other elements which may be toxic at high concentrations) from the soil [2,3]. Squash can be grown in the open field or in controlled environments under different climate conditions [4,5]. Due to its tolerance to drought and salinity stress, this high-value vegetable crop is widely cultivated in the Kingdom of Saudi Arabia, and about 15,309 tons were produced on 189 ha of land in 2013 [6,7]. Therefore, squash can be considered one of the most important crops that could be exploited in the different parts of the world to attain increased global food security.
To improve squash yield, several studies have explored the use of inorganic, biological and organic sources of nutrients [3,8,9]. A study has demonstrated that the appropriate applications of organic and mineral sources of nutrients have a great potential in improving the productivity of squash cultivated in arid land conditions [10]. Due to the positive attributes of organic agriculture, especially when used in combination with beneficial microbes, there seems to be an increasing demand for organic farm products worldwide. Hence, this scenario opens up an opportunity for continuous studies aimed at testing and validating the use of different locally available organic materials in crop production. Straw incorporation on dry land has been shown to significantly increase soil enzyme activities and nutrient contents, including N, P and K, as well as soil organic carbon [11]. Soil incorporation of straw can also lead to reduced soil temperature, evaporation and increased soil moisture conservation under arid land conditions [12].
The utilization of nitrogen (N)-containing fertilizers in crop production is highly impactful but with potential consequences on human health and the environment. Inadequate N fertilization has been observed as one of the constraints hampering the optimum productivity of squash crops as it affects the distribution of photoassimilates between the reproductive and vegetative parts of the plant [8]. However, among the great consequences of the excessive use of N fertilizers is the accumulation of nitrate (NO3−) in groundwater and fresh agricultural produce such as fruits and vegetables. Nitrate is the dominant form of N taken up by plants from the soil solution and easily lost to the environment [13]. If taken up in excess amounts through crop consumption by human beings, nitrate metabolizes into nitrite and other intermediates, which have negative effects on human health, such as cancer and blue baby syndrome [14,15]. Other problems associated with excessive use of N-containing fertilizers include soil acidification and eutrophication, as well as lower N-use efficiency [16,17]. Likewise, the determination of water-use efficiency of crops in Saudi Arabia is important as there is a shortage of water for agricultural purposes, and most agricultural production is carried out by irrigation. Therefore, some knowledge on the water-use efficiency of squash aided by the application of bio-organic amendments would inform farmers of what types of organic resources can be used to maximize crop productivity under arid land conditions. Irrigation practices with the application of mulching materials such as straw have been demonstrated to improve water--use efficiency under arid land conditions [18].
Unlike inorganic fertilizers, such as NPK, which present plant nutrients in a readily available form, most of the nutrients in straw are unavailable for uptake unless decomposed to the mineral forms. This decomposition in the soil is mostly aided by microbes called cellulose-decomposing bacteria. The inoculation of CDB in conjunction with soil incorporation of wheat straw can increase the rate of straw decomposition. The joint utilization of different sources of nutrients and soil conditioners, mostly of an environmentally-friendly origin such as organic (humic acid and straw) and biological (microorganisms) origins, in crop production is what is known as bio-organic amendments [19]. It is suggested that the use of both biological (CDB) and organic (HA and straw) amendments would not only reduce the amount of nitrate accumulated in fruits compared to using inorganic fertilizers but also improve the quality of squash fruit and vegetable parts. Thus, this study’s objective was to examine the effects of humic acid, a cellulose-decomposing bacterium (Geobacillus stearothermophilus SSK-2018), and wheat straw as bio-organic amendments on squash growth, fruit yield, water-use efficiency and nitrate accumulation in squash fruits cultivated under an arid land condition.
2. Materials and Methods
2.1. Planting Material, Field Preparation, Experimental Layout and Design
Two years of field cultivation of squash crops were carried out from January to April of 2020 and 2021, respectively. The planting material used in this study was the hybrid seeds of the Lebanese variety of squash (Modesto Seed CO., Inc., California, NA, USA). The field experiment was conducted at Hada Al-Sham on the Research Farm at King Abdulaziz University, Saudi Arabia. This experimental site has been described as having harsh weather due to the extremely high daytime temperature of above 25 °C and 40 °C in winter and summer, respectively [20]. The preliminary analysis of the experimental field soil has indicated that the soil has a pH of 7.2, EC of 5.06 dS/m, organic matter of 0.605%, bulk density of 1.51 g/cm3, particle density of 3 g/cm3 and the texture is sandy loam.
The field experiment was laid out using a split-split plot design with three replicates. Before planting, the field was prepared by plowing, followed by harrowing and leveling. The treatments used in this field study comprised humic acid (HA) as the main treatment, cellulose-decomposing bacterium as the sub-treatment and soil incorporation of wheat straw as the sub-sub-treatment (Figure S1). The main treatment was applied in three levels comprising 0, 50 and 100 L/ha of HA, respectively, and the sub-treatment was in two levels, with or without the inoculation of cellulose-decomposing bacterium (CDB). The CDB used in this study was previously identified as Geobacillus stearothermophilus SSK-2018 with the accession number MW785874.1 with the NCBI website, and it is available online at https://www.ncbi.nlm.nih.gov/nuccore/MW785874 (accessed on 25 June 2022). The sub-sub-treatment included three levels of soil incorporation of wheat straw at 0, 20 and 30 t/ha, as well as a rate of inorganic fertilizer, which was 600 kg/ha of NPK 20:20:20. At the sub-sub-treatment level, 0 t/ha of wheat straw and 600 kg/ha of NPK 20:20:20 were deployed as negative and positive controls, respectively, to give higher precision in the evaluation of the effect of wheat straw soil incorporation on squash fruit yield and nitrate content. Therefore, the prepared field was divided into 72 plots accounting for 3 levels of HA, 2 levels of CDB inoculation, 4 levels of wheat straw incorporation, including NPK 20:20:20 application and 3 replications for each treatment (Figure S1). The size of each plot was 6 m2 in accordance with the required plant spacing for squash.
2.2. Soil Incorporation of Wheat Straw
At the completion of field preparation and experimental plot layout, wheat straw was incorporated into the respective plots from the topsoil to a depth of about 30 cm. Water was added to the wheat straw-incorporated plots to allow for proper mixing of the soil with straw and prevent wind from blowing wheat straw particles around the field. Thereafter, two days after wheat straw incorporation, CDB inoculum prepared in the laboratory was diluted with water and field inoculated using sprayers and care was taken to avoid the drift of the spray to plots that were not to be inoculated with CDB. On a weekly basis, the wheat straw incorporated plots were turned upside down with hoes, and water was added to aid a fast decomposition rate before planting. Briefly, the organic carbon content of the wheat straw was determined to be 88.41% using the loss-on-ignition method at 600 °C. The wheat straw also contained 130 mg/kg Ca++, 36 mg/kg Mg++, 303 mg/kg K+ and 146 mg/kg Na+, as determined using an ICPE-900 machine after extraction with 2:1 nitric acid (HNO3) to perchloric acid (HClO4).
2.3. Planting, Crop Irrigation and Other Cultural Practices
Planting was completed one month after wheat straw incorporation in the field. The plant spacing used in this study was 100 cm spacing between rows and 50 cm between plants. Squash seeds were planted at 3 seeds per hole, and replanting was conducted for seeding stands that did not germinate 1 week after planting. At about 2 to 3 weeks after initial planting, one plant per stand was maintained throughout the plots. The drip irrigation system was adopted for use in this study to conserve water and potentially increase the water-use efficiency of the crops. The amount of irrigation water applied was based on the crop water requirement for squash. The irrigation water had a pH of 7.51, electrical conductivity (EC) of 2.4 dS/m, total dissolved solids (TDS) of 1197.7 ppm, sodium chloride (NaCl) content of 4.2% and nitrate concentration of 15.5 mg/L. Weed and pest control was carried out accordingly using standard recommended methods.
2.4. Application of Humic Acid and NPK Fertilizer
The application of HA and NPK were split into four similar doses that were carried out at 15, 30, 45 and 60 days after planting, respectively. Both humic acid and NPK 20:20:20 were diluted in water and sprayed on the respective plots at each time of application. The HA used in this study was in liquid form and was purchased at the agricultural market in Jeddah. The brand name of the HA product is Humacare®; it contains 12% (w/w) humic acid derived from leonardite, according to the claims of the manufacturer. Leonardite is derived from brown coal, which is naturally very rich in humic acid. In the second year, 2021, of this trial, efforts were made to maintain the same plots for each treatment as in the first year, 2020, of the trial.
2.5. Determination of Squash Water-Use Efficiency
The water-use efficiency of squash crops in the field was determined by dividing the fruit yield obtained per treatment by the total amount of irrigation water applied during the field trial (Equation (1)). The total amount of water applied during the field trial in each year (2020 and 2021) was 5376 m3/ha, as calculated from the squash crop coefficients at the different stages of growth, evapotranspiration and intervals of irrigation [21].
2.6. Nitrate Determination in Squash Fruits
Squash fruits’ nitrate contents were determined using the cadmium reduction method with the aid of NitraVer® Nitrate 5 Reagent powder pillows (Permachem® Reagents) after the preparation of fruits’ juice at 2:1 of distilled water to fruit sample (i.e., 30 g of squash fruit blended 60 mL of distilled water). Actual concentrations of nitrate content in fruits were measured with DR 3900 laboratory spectrophotometer machine (Hach Company/Hach Lange GmbH, Loveland, CO, USA) at 400 nm using the 353 Nitrate program following the protocol provided by the manufacturer. Briefly, 1 mL of squash fruit juice was diluted in 9 mL of distilled water in the machine’s sample cell, the content of 1 nitrate reagent powder pillow was emptied into the sample cell and the mixture was shaken for 1 min; thereafter, kept in the machine for 5 min before the final reading of nitrate was taken. The development of amber color with different intensities indicates the presence of nitrate. The content of 1 NitraVer® Nitrate 5 Reagent powder pillow includes benzenesulfonic acid, 4-amino-benzoic acid, 2,5-dihydroxy-copper, [propanedioato(2-)-O,O]-cadmium phosphoric acid, potassium salt (1:1), 2-propanamide and homopolymer (9003-05-8).
2.7. Data Collection
Data on the yields, including fruit yield per plant, total fruit yield, fresh and dry biomass yield, leaf area, water-use efficiency and nitrate concentration in fruits, were taken during the field trials in both the 2020 and 2021 planting seasons. Fruits were collected at different times during the growing period, and final yields per treatment were calculated at the end of the field trial. The total fruit yields from each plot were extrapolated on a kilogram per hectare basis. Fresh biomass yield of squash plants was simultaneously accessed at harvest by taking the weight of the whole plant, excluding only the fruits. The fresh biomasses were then oven-dried at 105 °C for 72 h, after which the dry biomass yield data were collected. Leaf area estimation was determined at harvest using the leaf disk method [22]. Ten (10) leaf disks were taken per plant with the aid of a cylindrical soil core (19.625 cm2). The fresh and dry weight of the 10 leaf disks were taken, and the final leaf area per plant was calculated according to the following equation:
where n = area of one disk.
2.8. Statistical Analysis
Collected raw data were processed using Excel, and analysis of variance was carried out on the obtained data with the use of SAS 9.3 Software [23]. Differences between treatment means were determined using LSD at the 95% significance level. Graphical presentations were carried out using GraphPad Prism, and the graphs were plotted with the ±standard error bars to display visual statistical differences between the treatment means. Correlation analysis and graphical visualization were carried out with the ggplot2 package using the R program, version 4.1.2 [24]. Simple linear regression analysis was also carried out with R using the following linear model (Model 1) in Equation (3) below:
Model 1
where: Y is the dependent variable;
b0 is the intercept of the regression line;
b1 is the slope of the regression line;
X is the independent variable or the predictor;
e is the error term; ‘e’ was considered as zero (0) in the current model.
3. Results
3.1. Effect of Humic Acid, Geobacillus stearothermophilus SSK-2018 and Wheat Straw on Leaf Area, Fresh and Dry Biomass Yield of Squash
Table S1 (Supplementary Materials) shows the treatment structure and analysis of variance of the field trial for leaf area and fresh and dry biomass yield. Replications did not have a significant effect on any of the measured plant parameters indicating that the field trial was laid out appropriately across the fertility gradient and thus not having a significant influence on the results obtained from individual treatments. In both tested seasons, 2020 and 2021, HA, CDB and wheat straw applications significantly (p ≤ 0.05) affected leaf area and fresh and dry biomass yield. The 2-way interaction of HA * CDB significantly (p ≤ 0.05) affected leaf area and dry biomass yield in the 2021 season. The 3-way interaction (HA * CDB * wheat straw) only had a significant (p ≤ 0.05) effect on fresh biomass yield in the 2020 season. All other treatment combinations had no significant effect on the measured parameters (Table S1). In Table 1, 100 L/ha of HA significantly (p ≤ 0.05) increased leaf area compared to 50 L/ha of HA and the control (0 L/ha) in both the 2020 and 2021 seasons. In the 2020 season, 50 L/ha of HA also significantly increased leaf area compared to the control, but there was no significant difference in the 2021 planting season. The inoculation of CDB in the 2020 and 2021 seasons significantly (p ≤ 0.05) increased leaf area by 27% and 16.7%, respectively, compared to the uninoculated treatment. In the sub-sub plots, 20 t/ha wheat straw, 30 t/ha wheat straw and NPK all significantly (p ≤ 0.05) increased leaf area in the 2020 and 2021 seasons compared to the control (0 t/ha of wheat straw). In addition, in both the 2020 and 2021 planting seasons, NPK significantly increased leaf area compared to both 20 and 30 t/ha wheat straw applications. Similarly, 30 t/ha of wheat straw increased leaf area compared to 20 t/ha of wheat straw (Table 1).

Table 1.
Effects of humic acid, cellulose-decomposing bacterium and wheat straw levels on the leaf area, fresh and dry biomass yield of squash during the 2020 and 2021 planting seasons.
Humic acid at 100 and 50 L/ha both significantly (p ≤ 0.05) increased fresh biomass yield compared to the control (0 L/ha) in both the 2020 and 2021 seasons. The fresh biomass yield was also significantly (p ≤ 0.05) increased by 100 L/ha of HA compared to 50 L/ha of HA in both the 2020 and 2021 seasons. Similarly, 100 L/ha of HA significantly increased fresh biomass yield by 64.5% and 58% compared to the control in both 2020 and 2021, respectively. In both seasons, 50 L/ha of HA also significantly increased fresh biomass yield by 30.5% and 27.8% compared to the control in both the 2020 and 2021 planting seasons, respectively. The inoculation of CDB, in the 2020 and 2021 seasons, significantly (p ≤ 0.05) increased fresh biomass yield compared to the uninoculated treatment. In the sub-sub-plot treatments, 20 and 30 t/ha of wheat straw, as well as NPK, all significantly (p ≤ 0.05) increased fresh biomass yield in the 2020 and 2021 seasons compared to the control (0 t/ha of wheat straw). In the 2020 planting season, NPK, 30 and 20 t/ha of wheat straw increased fresh biomass yield by 50.47%, 33.18% and 17.33%, respectively, compared to the control (0 t/ha wheat straw). Similarly, in the 2021 planting season, NPK, 30 and 20 t/ha of wheat straw significantly increased fresh biomass yield by 23.71%, 16.27% and 12.03%, respectively, compared to the control (Table 1). In the 2020 planting season, 30 t/ha of wheat straw significantly (p ≤ 0.05) increased fresh biomass yield compared to 20 t/ha of wheat straw. However, in the 2021 planting season, there were no significant differences in the fresh biomass yield of 20 t/ha and 30 t/ha of wheat straw.
The results obtained on the effect of treatments on the dry biomass yield squash followed a similar pattern as fresh biomass yield (Table 1). Meanwhile, 100 and 50 L/ha of HA both significantly (p ≤ 0.05) increased dry biomass yield compared to the control (0 L/ha) in both the 2020 and 2021 seasons. Although, 100 L/ha of wheat straw significantly (p ≤ 0.05) increased dry biomass yield compared to 50 L/ha of HA. Furthermore, 100 L/ha of HA increased dry biomass yield by 63.22% and 64.32% compared to the control (0 L/ha) in both the 2020 and 2021 seasons, respectively. Likewise, the dry biomass yield was significantly (p ≤ 0.05) increased by the application of 50 L/ha of HA compared to the control by 25.37% and 28.18% in the 2020 and 2021 seasons, respectively. The inoculation of CDB, in the 2020 and 2021 seasons, significantly (p ≤ 0.05) increased the dry biomass yield by 21.62% and 19.36%, respectively, compared to the uninoculated treatment. In the sub-sub-plot treatments, 20 and 30 t/ha of wheat straw, as well as NPK, all significantly (p ≤ 0.05) increased dry biomass yield in both the 2020 and 2021 seasons compared to the control (0 t/ha of wheat straw). In the 2020 planting season, NPK, 30 and 20 t/ha of wheat straw increased dry biomass yield by 69.04%, 44.95% and 23.10%, respectively, compared to the control (0 t/ha wheat straw). Similarly, in the 2021 planting season, NPK, 30 and 20 t/ha of wheat straw significantly increased dry biomass yield by 59.43%, 35.71% and 18.20%, respectively, compared to the control (Table 1). NPK application caused a significant (p ≤ 0.05) increase in the dry biomass yield of squash compared to the application of 30 and 20 t/ha of wheat straw in both the 2020 and 2021 planting seasons. Furthermore, in the 2020 and 2021 planting seasons, 30 t/ha of wheat straw significantly (p ≤ 0.05) increased dry biomass yield by 17.75% and 14.81%, respectively, compared to 20 t/ha of wheat straw. Across the two years, there was no statistical significance between the performance of each treatment, although results obtained in 2021 were slightly higher than those of the 2020 planting season.
Among the interaction of treatments, only the combinations of HA and CDB, as well as the three-way interaction of HA, CDB and wheat straw, had a significant (p ≤ 0.05) effect on the measured parameters (Table 1). Figure 1 shows that HA application at the rate of 100 L/ha in conjunction with the inoculation of Geobacillus stearothermophilus SSK-2018 caused a significant (p ≤ 0.05) increase in leaf area compared to the control plots (0 L/ha HA and without CDB inoculation), and the inoculation of CDB alone without HA application (Figure 1). The application of 50 L/ha of HA in conjunction with the inoculation of Geobacillus stearothermophilus SSK-2018 did not, however, cause a significant increase in squash’s leaf area compared to the control. For the three-way interaction effects of HA, CDB and wheat straw on fresh biomass yield in the 2020 planting season, 100 L/ha of HA combined with the inoculation of CDB and NPK or 30 t/ha of wheat straw application had the most significant (p ≤ 0.05) effect compared to other treatments combination rates, including the control (Figure 2). Generally, compared to the uninoculated plots, the inoculation of CDB in conjunction with HA, NPK and wheat straw application caused an increase in fresh biomass yield. The application of 50 or 100 L/ha of HA either with or without the inoculation of CDB in the presence of NPK or straw was not statistically different from each other except for the combination of 100 L/ha of HA with CDB inoculation and 30 t/ha wheat straw, which significantly increased fresh biomass yield compared to the combination of 50 L/ha of HA combined with CDB and 30 t/ha of wheat straw (Figure 2). Further result interpretation shows that at 0 t/ha of wheat straw, 100 L/ha of HA with CDB inoculation significantly increased fresh biomass yield compared to the control having 0 L/ha of HA with CDB inoculation. A similar observation was observed with 100 L/ha of HA application in combination with CDB inoculation on plots receiving 30 t/ha of wheat straw. Interestingly, it was observed that in the absence of CDB inoculation, none of the HA combinations with wheat straw application had a significant effect on fresh biomass yield (Figure 2).
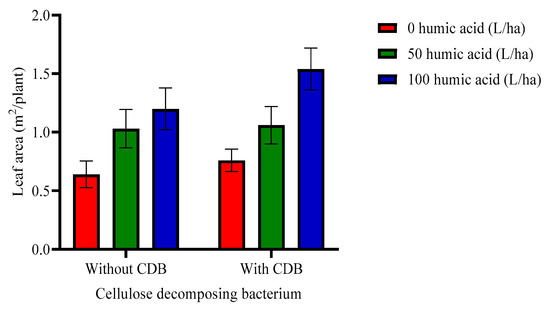
Figure 1.
Interaction effects of humic acid levels with and without cellulose-decomposing bacterium on the leaf area of squash plant in 2021 planting season. Bars indicate ± standard error, and error bars that are not overlapping each other indicate that the means are significantly (p ≤ 0.05) different from each other.
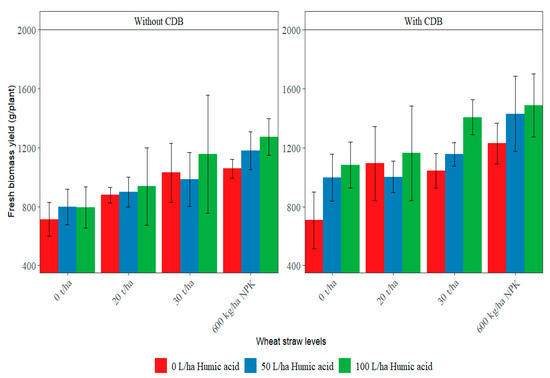
Figure 2.
Three-way interaction effect of humic acid, cellulose-decomposing bacterium and wheat straw on the fresh biomass yield of squash in 2020 planting season. Bars indicate ± standard error, and error bars that are not overlapping each other indicate that the means are significantly (p ≤ 0.05) different from each other.
Figure 3 gives a presentation of the interaction effects of HA and CDB on the dry biomass yield of squash in the 2021 planting season. HA application at the rate of 100 L/ha in conjunction with the inoculation of Geobacillus stearothermophilus SSK-2018 caused a significant (p ≤ 0.05) increase in the dry biomass yield compared to the control plots (0 L/ha HA and without CDB inoculation), inoculation of CDB alone and the inoculation of CDB with 50 L/ha of wheat straw (Figure 3). This increment was in the order of 102.2%, 64.9% and 34.25%, respectively. Likewise, the application of 50 L/ha of HA in conjunction with the inoculation of Geobacillus stearothermophilus SSK-2018 significantly (p ≤ 0.05) increased the dry biomass yield compared to the inoculation of Geobacillus stearothermophilus SSK-2018 alone.
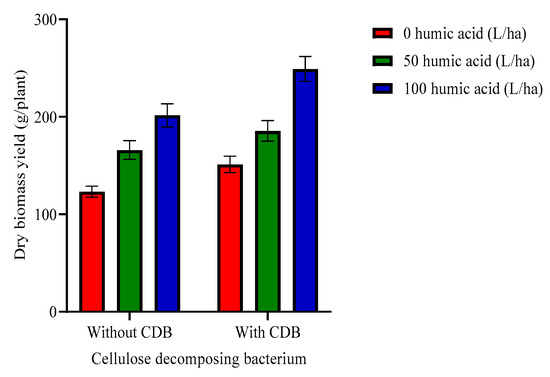
Figure 3.
Interaction effects of humic acid levels with and without cellulose-decomposing bacterium on the dry biomass yield of squash plant in 2021 planting season. Bars indicate ± standard error, and error bars that are not overlapping each other indicate that the means are significantly (p ≤ 0.05) different from each other.
3.2. Effect of Humic Acid, Geobacillus stearothermophilus SSK-2018 and Wheat Straw on Fruit Yield and Water-Use Efficiency of Squash
Table S2 shows the treatment structure and analysis of variance of the field trial for fruit yield, water-use efficiency and squash fruit’s nitrate content. In both tested seasons, 2020 and 2021, HA, CDB and wheat straw applications had significant (p ≤ 0.05) effects on fruit yield and water-use efficiency (Table S2). For nitrate, HA had a highly significant (p ≤ 0.01) effect in both the 2020 and 2021 seasons, CDB inoculation only had a significant (p ≤ 0.01) effect in the 2021 season, while wheat straw had a significant (p ≤ 0.05) effect in the 2020 season alone. Both 2-way and 3-way interactions of all treatments (HA, CDB and wheat straw) had no significant (p > 0.05) effect on the yield of squash fruits and water-use efficiency. The combination of HA and wheat straw, however, had a significant (p ≤ 0.01) effect on fruit’s nitrate content in both the 2020 and 2021 seasons (Table S2). In the 2020 season, 100 L/ha and 50 L/ha of HA significantly (p ≤ 0.05) increased fruit yield (g/plant) by 32.5% and 16.6%, respectively, compared to the control (0 L/ha), as shown in Table 2. A similar trend was also observed in the 2021 planting season. Likewise, the inoculation of CDB in the 2020 and 2021 seasons had a significant (p ≤ 0.05) increment effect on the total yield of fruits by 10.32% and 5.4%, respectively, compared to plots that were uninoculated. In the sub-sub-plots, NPK and 30 t/ha wheat straw applications significantly (p ≤ 0.05) increased fruit yield in 2020 by 26% and 17.9%, respectively, compared to the control (0 t/ha of wheat straw). In the 2021 planting season, NPK and 30 t/ha wheat straw applications also increased fruit yield by 17.2% and 10.6%, respectively, compared to the control. In addition, wheat straw application at the rate of 20 t/ha increased all measured parameters compared to the control plots (Table 2). Water-use efficiency also followed the same trend as fruit yield for all treatments. In addition, there were no significant differences in the results obtained on the effect of treatments on fruit yield, total fruit yield and water-use efficiency in both 2020 and 2021.
Table 2.
Effects of humic acid, cellulose-decomposing bacterium and wheat straw levels on the yield of squash fruit and water-use efficiency during 2020 and 2021 planting seasons.
3.3. Effect of Humic Acid, Geobacillus stearothermophilus SSK-2018 and Wheat Straw on Nitrate Accumulation in Squash Fruits
In both seasons, squash fruit nitrate concentration was found to be significantly (p ≤ 0.05) high in plots that did not receive HA (0 L/ha) compared to those that received 50 L/ha and 100 L/ha of HA (Table 3). HA (100 L/ha) had the lowest fruit nitrate accumulation in 2020 (40.32 mg/L) and 2021 (43.17 mg/L), followed by 50 L/ha of HA in 2020 (55.73 mg/L) and 2021 (57.64 mg/L). This could be an indication that HA reduces the potential of nitrate accumulation in squash fruit, which is an indication of good fruit quality. In the 2020 planting season, inoculation of CDB did not cause a significant increase in squash fruit’s nitrate accumulation compared to the uninoculated control (Table 3). However, the inoculation of CDB significantly (p ≤ 0.05) affected squash nitrate content in the 2021 planting season compared to the uninoculated control. In the sub-sub-plots, the application of 20 t/ha of wheat straw had less of an effect on nitrate accumulation in squash fruits. Nitrate accumulations in squash fruits in the 2020 planting season were statistically similar between those obtained in the control plots (0 t/ha of wheat straw) and 20 t/ha of wheat straw.
Table 3.
Effects of humic acid, cellulose-decomposing bacterium and wheat straw levels on squash nitrate accumulation during 2020 and 2021 planting seasons.
In the 2021 planting season, nitrate accumulation in fruits obtained from 20 t/ha of wheat straw plots was only slightly significantly higher than that obtained from the control plots by 10.3%. However, NPK application significantly (p ≤ 0.05) increased the fruits’ nitrate content compared to the control (0 t/ha of wheat straw) in both the 2020 and 2021 seasons (Table 3). In 2020, the application of 30 t/ha of wheat straw had no significant effect on fruits’ nitrate content compared to 20 t/ha of wheat straw but was significantly (p ≤ 0.05) higher than the control (0 t/ha of wheat straw). However, in 2021, the application of 30 t/ha of wheat straw significantly (p ≤ 0.05) increased fruits’ nitrate content compared to both 20 t/ha of wheat straw and the control (0 t/ha of wheat straw). In the same year, 2021, 20 t/ha of wheat straw also significantly increased fruits’ nitrate content compared to the control. In both the 2020 and 2021 planting seasons, HA, in combination with wheat straw application, had a significant effect on fruits’ nitrate content. Meanwhile, other treatment combinations did not significantly affect nitrate accumulation in squash fruits.
In the interactions of HA and wheat straw applications during the 2020 planting season, the combination of HA at 100 L/ha with the application of 600 kg/ha NPK significantly reduced nitrate accumulation in squash fruits compared to when NPK was applied alone (Figure 4a). The potential ability of 100 L/ha of HA to reduce nitrate accumulation in squash fruits was further demonstrated when plots receiving only HA, in the absence of wheat straw application (0 t/ha), were evaluated. Overall, the application of NPK and wheat straw, in the absence of HA application, increased fruits’ nitrate accumulation and could be potentially reversed with the application of HA (Figure 4a). At the HA and wheat straw interaction level in the 2020/2019 planting season, the combination of 600 kg/ha NPK and 0 L/ha of HA (i.e., the application of NPK alone) caused a significant (p ≤ 0.05) increase in nitrate content compared to the interactions of NPK with 50 and 100 L/ha of HA, respectively (Figure 4b). A similar trend was also observed for the combination of 30 t/ha wheat straw with L/ha of HA. Throughout all the combinations involving HA and wheat straw, 100 L/ha of HA with or without wheat straw significantly (p ≤ 0.05) reduced nitrate accumulation in squash fruits (Figure 4a). This consistently shows the potential of the application of HA to reduce nitrate accumulation in vegetable fruits. When combined with NPK application, 100 L/ha significantly (p ≤ 0.05) reduced nitrate accumulation by 76.7% compared to the application of NPK without HA application (0 L/ha HA).
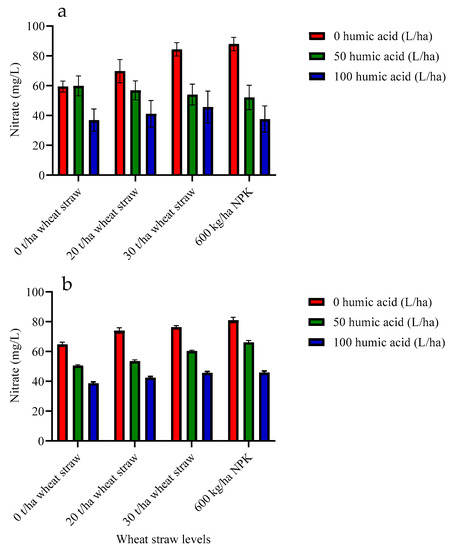
Figure 4.
Interaction effects of wheat straw and humic acid levels on squash fruit’s nitrate content in (a) 2020 and (b) 2021 planting seasons. Bars indicate ± standard error, and error bars that are not overlapping each other indicate that the means are significantly (p ≤ 0.05) different from each other.
3.4. Correlation Analysis
The correlation analysis for measured plant parameters followed the same trend in both 2020 and 2021. The results indicated that fruit yield and water-use efficiency were both positively significantly (p ≤ 0.0001) correlated with fresh biomass yield (R = 0.73), dry biomass yield (R = 0.71) and leaf area (R = 0.83) in 2020 (Figure 5). Fresh biomass yield was positively significantly (p ≤ 0.0001) correlated with dry biomass yield (R = 0.74) and leaf area (R = 0.83). Dry biomass yield was also positively significantly (p ≤ 0.0001) correlated with leaf area at R = 0.75. On the other hand, nitrate accumulation in squash fruits was negatively significantly (p ≤ 0.001) correlated with fruit yield (R = −0.49), water-use efficiency (R = −0.49), fresh biomass yield (R = −0.43), dry biomass yield (R = −0.37) and leaf area (R = −0.59); Figure 5. The correlation analysis of measured plant parameters in the 2021 season is presented in Figure S2 and shows that fruit yield was positively significantly (p ≤ 0.0001) correlated with fresh biomass yield (R = 0.97), dry biomass yield (R = 0.94) and leaf area (R = 0.38). Nitrate also negatively significantly (p ≤ 0.001) correlated with fruit yield (R = −0.56), water-use efficiency (R = −0.56), fresh biomass yield (R = −0.64), dry biomass yield (R = −0.48) and leaf area (R = −0.35), as depicted in Figure S2. These correlation results imply that as plant growth, fruit yield and water-use efficiency increase, nitrate accumulation in fruits decreases and vice versa, when nitrate accumulation increases, growth, yield and water-use efficiency decreases.
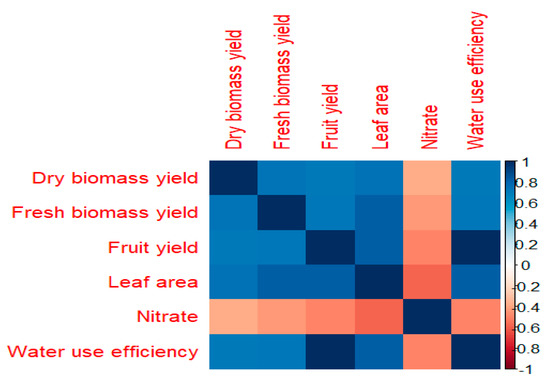
Figure 5.
Correlation heatmap of measured plant parameters in 2020 planting season.
The blue color on the correlation map signifies positive correlation, the red color signifies negative correlation and the correlation coefficient (R) is as indicated on the −1 to +1 color scale on the right side of the correlation heatmap.
3.5. Regression Analysis
Regression analysis further demonstrated the positive and negative relationships, pairwise, between the yield parameters and nitrate accumulation. In the 2020 simple linear regression, when there was zero nitrate accumulation in fruits, a total fruit yield of 8258.48 kg/ha could be obtained as a result of the bio-organic amendments, as shown in Equation (4) (Model 2). However, for every 1 mg/L increase in nitrate, total fruit yield could be potentially decreased by 32.66 times. For the 2021 season, Model 3 (Equation (5)) shows that when there is zero nitrate accumulation in fruits, a total fruit yield of 8814.2 kg/ha can be obtained in the current study. However, for every 1 mg/L increase in nitrate, yield could be potentially decreased by 40.04 times. The results obtained between the two years highlight that while fruit yield can potentially increase from 8258.48 kg/ha in 2020 to 8814.2 kg/ha in 2021 (6.7% increase), fruit nitrate content also increased by 23% in 2021 compared to 2020. Figure 6a,c shows and confirms the decreasing trend of the total fruit yield in kg/ha in 2020 and 2021, respectively, and this negative relationship was statistically significant at p ≤ 0.001. As nitrate increases from about 25 mg/L to over 90 mg/L, total fruit yield decreases from >8500 kg/ha to <4500 kg/ha (Figure 6a,c).
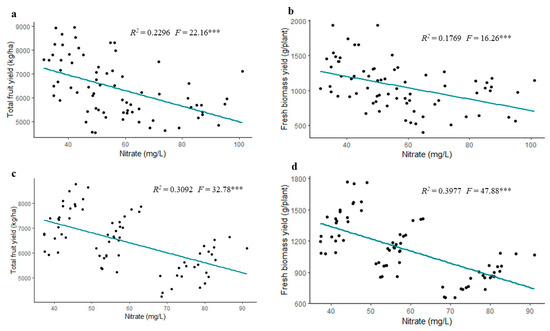
Figure 6.
Regression plots showing the linear relationship between total fruit yield (fresh weight) and nitrate accumulation in squash fruits in (a) 2020 and (c) 2021 and between fresh biomass yield and nitrate accumulation in squash fruits in (b) 2020 and (d) 2021. R2, regression coefficient of determination; F, calculated F-statistic value; ***, significant at p ≤ 0.001.
Likewise, regression analysis shows that the fresh biomass yield of squash decreased as nitrate increased in 2020 (Figure 6b) and 2021 (Figure 6d). Model 4 (Equation (6)) shows that in the 2020 season when there was zero nitrate accumulation in fruits, fresh biomass yield of squash could potentially reach up to 1528.4 g/plant in the current study. However, for every 1 mg/L increase in nitrate, fresh biomass yield can be potentially decreased by over eight times. The regression equation (Model 5; Equation (7)) shows that in 2021, with the absence of nitrate accumulation in fruits, the fresh biomass yield of squash could potentially reach up to 1808.2 g/plant. However, for every 1 mg/L increase in nitrate, the fresh biomass yield can be potentially decreased by 11.7 times (Model 5; Equation (7)). Similar to the results obtained between fruit yield and nitrate accumulation, fresh biomass yield also increased from 1528.4 g/plant in 2020 to 1808.2 g/plant in 2021 (18.3% increase), and fruit nitrate content also increased by 46.3% in 2021 compared to 2020. Further regression analysis shows that as nitrate increased from about 25 mg/L to over 90 mg/L, fresh biomass yield decreased from >1800 g/plant to <500 g/plant in both the 2020 and 2021 seasons (Figure 6b,d, respectively). This negative relationship between fresh biomass yield and nitrate accumulation was also statistically significant at p ≤ 0.001.
Model 2; 2020
where Y is total fruit yield (kg/ha), and X is nitrate (mg/L).
Model 3; 2021
where Y is total fruit yield (kg/ha), and X is nitrate (mg/L).
Model 4; 2020
where Y is fresh biomass yield (g/plant), and X is nitrate (mg/L).
Model 5; 2021
where Y is fresh biomass yield (g/plant), and X is nitrate (mg/L).
In the 2020 and 2021 seasons, regression analysis shows that water-use efficiency decreases as nitrate increases (Figure 7a,c). Model 6 (Equation (8)) shows that, in the 2020 season, when there was zero nitrate accumulation in fruits, the water-use efficiency of squash could potentially reach up to 1.536 kg/m3 in the current study. However, for every 1 mg/L increase in nitrate, water-use efficiency could be potentially decreased by 0.006 times. In the 2021 planting season, the regression equation (Model 7; Equation (9)) shows that when there was zero nitrate accumulation in fruits, the water-use efficiency of squash could reach up to 1.640 kg/m3 in the current study. However, for every 1 mg/L increase in nitrate, water-use efficiency could be potentially decreased by 0.007 times. Water-use efficiency was observed to decrease from > 1.5 kg/m3 to < 0.5 kg/m3 as nitrate increased from 25 mg/L to > 90 mg/L in both the 2020 and 2021 seasons (Figure 7a,c, respectively). This negative relationship between water-use efficiency and nitrate accumulation was statistically significant at p ≤ 0.001.
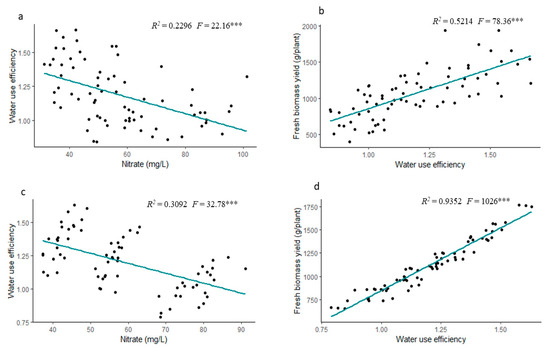
Figure 7.
Regression plots showing the linear relationship between water-use efficiency and nitrate accumulation in squash fruits in (a) 2020 and (c) 2021 and between fresh biomass yield and water-use efficiency in (b) 2020 and (d) 2021. R2, regression coefficient of determination; F, calculated F-statistic value; ***, significant at p ≤ 0.001.
In the 2020 and 2021 seasons, regression analysis showed that fresh biomass yield increased as water-use efficiency increased (Figure 7b,d). Model 8 (Equation (10)) shows that, in the 2020 season, an increase in water-use efficiency of squash by 1101 times could potentially cause an increase in fresh biomass yield up to 246.4 g/plant. However, if water-use efficiency is zero, fresh biomass yield can be potentially decreased by 246.4 g/plant. In the 2021 planting season, the regression equation (Model 9; Equation (11)) shows that when water-use efficiency of squash increased by 1349.07 times as a result of the bio-organic amendments used in this study, fresh biomass yield could potentially reach up to 502.04 g/plant. Following the same trend, if water-use efficiency is zero, fresh biomass yield can be potentially decreased by 502.04 g/plant. Further regression analysis elicited that as water-use efficiency increased from < 0.5 kg/m3 to > 1.5 kg/m3, fresh biomass yield also increased from < 500 g/plant to > 1800 g/plant in both the 2020 and 2021 seasons (Figure 7b,d, respectively). This positive relationship between the fresh biomass yield and water-use efficiency was statistically significant at p ≤ 0.001. Models 10 and 11, corresponding to Equations (12) and (13), respectively, show that there was a positive relationship between fruit yield and water-use efficiency in 2020 and 2021, respectively. The linear regression line shows that there was a perfect relationship between fruit yield and water-use efficiency at R2 = 1. Figure S3 (in Supplementary Materials) indicates that as fruit yield increases, water-use efficiency also increases. This is as expected as the water-use efficiency was a derivative of fruit yield (Equation (1)).
Model 6; 2020
where Y is water-use efficiency (kg/m3), and X is nitrate (mg/L).
Model 7; 2021
where Y is water-use efficiency (kg/m3), and X is nitrate (mg/L).
Model 8; 2020
where Y is fresh biomass yield (g/plant), and X is water-use efficiency (kg/m3).
Model 9; 2021
where Y is fresh biomass yield (g/plant), and X is water-use efficiency (kg/m3).
Model 10; 2020
where Y is fruit yield (g/plant), and X is water-use efficiency (kg/m3).
Model 11; 2021
where Y is fruit yield (g/plant), and X is water-use efficiency (kg/m3).
Simple linear regression analysis shows that in the 2020 and 2021 seasons, a positive relationship existed between fruit yield and leaf area (Model 12 and 13). In the 2020 season, t for every 1 m2 increase in leaf area per plant, fruit yield can be potentially increased by 234 g/plant (Model 12; Equation (14)). Similarly, the regression equation for the 2021 season indicates that for every 1 m2 increase in leaf area per plant, fruit yield could potentially increase by 287 g/plant (Model 13; Equation (15)). The trend of this positive relationship is presented in Figure 8a for the 2020 season and Figure 8c for the 2021 season; the relationships were significant at p ≤ 0.001. The graphical presentation illustrates that as the leaf area increased from <0.25 m2/plant to >2.5 m2/plant, fruit yield also increased from <200 g/plant to >400 g/plant in both the 2020 and 2021 seasons (Figure 8a,c, respectively). Models 14 and 15 (Equations (16) and (17), respectively) also show the positive relationship between leaf area and water-use efficiency. The trend of this positive relationship is presented in Figure 8b for 2020 and Figure 8d for 2021; the relationships were significant at p ≤ 0.001. Further regression analysis illustrates that as the leaf area increased from <0.25 m2/plant to >2.5 m2/plant, water-use efficiency also increased from <0.5 kg/m3 to> 1.5 kg/m3 in both the 2020 and 2021 seasons (Figure 8b,d, respectively).
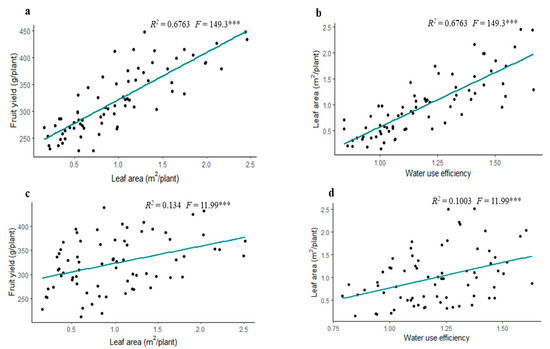
Figure 8.
Regression plots showing the linear relationship between fruit yield (fresh weight) and leaf area in (a) 2020 and (c) 2021 and leaf area with water-use efficiency in (b) 2020 and (d) 2021. R2, regression coefficient of determination; F, calculated F-statistic value; ***, Significant at p ≤ 0.001.
Model 12; 2020
where Y is fruit yield (g/plant), and X is leaf area (m2/plant).
Model 13; 2021
where Y is fruit yield (g/plant), and X is leaf area (m2/plant).
Model 14; 2020
where Y is leaf area (m2/plant), and X is water-use efficiency (kg/m3).
Model 15; 2021
where Y is leaf area (m2/plant), and X is water-use efficiency (kg/m3).
4. Discussion
The use of bio-organic amendments under arid land conditions can potentially improve soil properties and plant conditioning for better performance [19]. Assessment of plant leaf area suggests the growth and yield potential of plants by determining the amount of photosynthesis a plant can carry out and how photoassimilates are distributed within the plants to form the plant’s biomass [25]. The leaf disk method used in this study to access the leaf area of squash due to bio-organic treatment application has been suggested to be one of the most efficient methods [26]. Thus, the results obtained in this study reliably infer that bio-organic amendments, including HA, Geobacillus stearothermophilus SSK-2018 and wheat straw improved squash’s leaf area and, subsequently, squash’s growth. Humic acid and fluvic acid are among the major components of soil organic matter and therefore play crucial roles in promoting plant growth [27]. Similarly, CDB can also promote plant growth through the release of plant growth-promoting hormones and enzymes. Likewise, wheat straw application improves soil conditioning for better plant performance through increased soil moisture conservation and slow release of nutrients for plant uptake. Fresh and dry biomass yields of squash were also improved due to the applications of bio-organic amendments and NPK 20:20:20 fertilizer at the sub-sub-plots. Youssef and colleagues [9] study on squash also demonstrated that wheat straw incorporation, bacterial inoculation (Azolla pinnata) and N, P and K inorganic fertilizers significantly increased dry biomass yield and leaf chlorophyll content. Closely related bacteria to Geobacillus stearothermophilus, including Bacillus pumilus, Bacillus subtilis and Bacillus polymexa have also been reported to improve squash yield and growth in addition to the suppression of squash powdery mildew disease [22].
In the present study, fruit yield and water-use efficiency were improved with the individual applications of each treatment. These results indicate that HA, CDB, wheat straw and NPK can independently promote plant growth and yield. Surprisingly, none of the treatment interactions increased fruit yield and water-use efficiency. This may suggest that further studies need to be carried out to determine the most efficient treatment combinations that could increase fruit yield coupled with a better understanding of the effects of the bio-organic amendments at the soil–plant interface. Through an improvement of soil biological, chemical, and physical qualities, organic amendments are expected to enhance plant growth and yield under arid land conditions [28]. The use of organic amendments such as HA, straw and biofertilization has the tendency to furnish plants with required N nutrition, just as in the use of N fertilizers. HA has been described to contain organically active functional groups such as the amino, carboxyl, phenolic, hydroxyl, ketone and quinine groups, which play different roles in the soil–plant interface, including the chelation of macro and micronutrients for enhanced uptake by plants that subsequently leads to increased crop yield [29,30,31]. The use of HA in crop production causes increased phosphate uptake, photosynthesis, elongation of root cells, oxygen uptake and the activity of beneficial soil microbes [29,32]. N fertilization of squash and other related crops has been shown to consistently improve crop yields [8,33]. Increases in fruit yield due to soil incorporation of wheat straw in this study can be attributed to the potential mineralization that may have occurred during the field trial. This is in tandem with the study of [18] on squash, where rice straw was demonstrated to increase fruit yield under arid land conditions. Wheat straw applied as mulch has also been recently shown to significantly improve squash yield in wooden boxes under open field conditions [9]. The addition of plant straw and other organic materials to soils increases the soil’s carbon sequestration potential, nutrient availability for root uptake, aeration and water retention capacity, which all lead to better plant performance [34,35]. The increased water-use efficiency from wheat straw incorporation in the present study is similar to that of [18]. However, contrary to the study [18], there was no difference in the water-use efficiency of squash in both years that this study was conducted.
Vegetable crops have been described as one of the major sources of human exposure to nitrate intake [36]. Therefore, it is important to conduct different studies aimed at identifying agricultural inputs and practices that can reduce nitrate accumulation in fruit and vegetable crops. The range of nitrate concentrations in squash fruits (from >36 to <90 mg/L or mg/kg) in the present study was low and within the safe limit for human and animal consumption. A nitrate content of <200 mg/kg (fresh weight basis) in squash and other related crops has been categorized as very low and considered safe for consumption [37]. In addition, the nitrate content in squash fruits, as observed in the current study, is far below the maximum limit of nitrate (200 mg/kg) allowed in crop produce used in infant food, according to the European Union standard [38]. A study that also used the cadmium reduction method coupled with the use of a spectrophotometer to determine nitrate in squash fruits reported results in the range of 63.8 to 248.7 mg/kg, which also affirms that the nitrate accumulation obtained in the present study falls within the range of other scientific investigations [39]. Recently, another study also reported nitrate concentrations of 25.25 to 91.82 mg/kg in squash fruits using a similar methodology as the present study [40].
In the present study, HA was able to improve squash fruit quality by causing a decrease in nitrate accumulation. Nitrate accumulation in squash fruits decreased as the level of humic acid was increased. This is similar to the study of Türkmen et al. [27], which also demonstrated that the application of HA decreased nitrate content in lettuce plants. Although the inoculation of Geobacillus stearothermophilus SSK-2018 caused a slight increase in fruit’s nitrate accumulation in 2021, it was negligible in 2020. An increase in nitrate accumulation in squash fruits in the 2021 season may be attributed to the probable increase in the activity of Geobacillus stearothermophilus SSK-2018, compared to the 2020 season in the decomposition of soil organic materials during which nitrate may be released for plant’s uptake. However, a contrasting study showed that the inoculation of a biofertilizer comprising Azospirillum, Rhizobium, Bacillus megatarium and Azotobacter caused a reduction in nitrate accumulation in Anethum graveolens [41]. Despite that, NPK 20:20:20 and wheat straw application increased fruits nitrate accumulation compared to the negative control; 20t/ha and 30 t/ha wheat straw decreased nitrate accumulation in fruits compared to NPK. This infers that wheat straw incorporation into the soil could also cause nitrate to be taken up by plants during decomposition but at a lesser rate than N fertilizer application. Several studies have shown that N-containing fertilizers often result in the accumulation of nitrate in vegetable crops [16,17,27,42]. However, the interactions of HA with wheat straw and NPK results in the reduction of nitrate accumulation in squash fruits to further demonstrate the effectiveness of HA on nitrate accumulation in plants. A similar study also showed that HA combined with chemical N fertilizers reduced nitrate accumulation in lettuce plants compared to when the N fertilizers were applied alone [27]. The reduction of nitrate accumulation in plants due to the application of HA has been associated with the ability of HA to activate some key metabolic events in plants, such as the increased production of reductase enzymes [43,44]. In addition, the use of HA with chemical fertilizer application has been reported to have the potential to significantly improve soil fertility and crop yield [31,32]. Nitrate is made directly available for plant uptake on the application of N fertilizers, while it is only made available after the decomposition of organic materials such as composts, manures and crop straw [42]. Despite nitrate accumulation being high in the control plots of HA treatment, it was lowest in the control plots of CDB and wheat straw-applied plots (Table 3). This observation may call for future studies to explore the detailed dynamics of soil nitrate concentrations across the individual plots used in this study, as well as unravel the impacts of the bio-organic amendments on intracellular nitrate transport in squash plants. In addition to the reduction of nitrate accumulation in plants, bio-organic amendments such as biochar have also been demonstrated to reduce heavy metal accumulation in squash plants [3].
The heterogeneous nature of the field, coupled with the weather conditions, might have impacted the effectiveness of the interaction of treatments used in this study as the 3-way interaction of the treatments had no statistically significant effect on leaf area, dry biomass yield, fruit yield, water-use efficiency and fruit’s nitrate accumulation. This is dissimilar to the study [9], where straw mulching with the inoculation of beneficial bacteria was observed to maximally improve squash yield compared to the control. The interactions of HA, Geobacillus stearothermophilus SSK-2018 and wheat straw effectively improved the fresh biomass yield of squash in the present study. The interactions of different biological and organic sources of nutrients are expected to improve biological, physical and chemical properties of soils for maximal productivity of plants. Perhaps, the weather conditions (high temperature, low to no rainfall and high wind speed) during the field trial may have negatively impacted the overall effectiveness of the combination of the bio-organic amendments used in the present study. Mineralization of organic fertilizers can supply plants with sufficient nutrients; however, mineralization rate is affected by the properties of the soil, organic fertilizer decomposing microbes, moisture content, temperature and general management of the field [45]. It is also suggested that a longer continuous field trial would be required to see the positive impact of the treatment combinations used in this study.
The analysis of the relationship or association among the measured parameters revealed that leaf area was highly correlated with biomass and fruit yield, in agreement with other investigations [26]. However, further correlation and regression analyses indicated that attaining increased growth, plant biomass and fruit yield, as well as water-use efficiency, in squash can be hampered by the presence of nitrate. Similar studies have also demonstrated that nitrate concentration in plant tissues has a negative relationship with fresh biomass weight of vegetable crops such as lettuce and spinach [46]. The linear regression models show that although biomass and fruit yield increased in 2021 compared to 2020, nitrate accumulation also increased in squash fruits in 2021 compared to 2020. Furthermore, the regression analysis revealed that the negative effect of nitrate was greater on fruit yield compared to growth parameters such as leaf area. Overall, the regression analysis conducted in this study could give valuable insights into predicting and understanding the inter-relationships between the measured plant parameters. Finally, in the production of squash plants in a similar environment to the present study, careful attention should be given to finding ways of reducing nitrate accumulation in fruits.
5. Conclusions
The growth (leaf area and fresh biomass yield) and yield (fruit and dry biomass yield) parameters measured in this study demonstrated that bio-organic amendments, including HA, Geobacillus stearothermophilus SSK-2018 and wheat straw, could efficiently improve squash growth and yield under arid land conditions. In addition, the utilization of humic acid, Geobacillus stearothermophilus SSK-2018 and wheat straw also caused a reduction in nitrate accumulation in fruits. Among the bio-organic amendments, humic acid elicited a higher potential to increase total fruit yield and reduce nitrate accumulation in fruits. Wheat straw and NPK combination with humic acid further caused a reduction in nitrate accumulation in fruits in both 2020 and 2021 field trials to demonstrate the importance of humic acid in nitrate reduction in squash fruits. In view of this, it can be said that the application of HA along with NPK fertilizer may reverse some of the negative effects of inorganic fertilizers on crop quality under arid land conditions. This assumption would, however, need to be tested for other quality parameters of fruits and for more years under field conditions. Generally, the high efficacy of the HA used in this study may be associated with the direct availability of the active substances in HA, which can be directly utilized by plants like plant hormones while simultaneously improving soil conditioning for improved squash performance. Correlation and regression analyses further indicate that nitrate accumulation in squash fruits can potentially lead to reduced crop productivity in terms of yield and water-use efficiency. This study suggests that it is important to deploy the use of biological and organic materials with the potential to prevent or reduce nitrate accumulation in fruits when cultivating squash under arid land conditions. Importantly, a different combination of bio-organic amendments should be tested at varying ratios to understand their dynamics in improving squash yield and fruit quality under arid land conditions. Finally, the bio-organic amendments used in this study significantly reduced nitrate accumulation in squash fruits compared to the application of NPK fertilizer.
Supplementary Materials
The following supporting information can be downloaded at: https://www.mdpi.com/article/10.3390/horticulturae8070588/s1, Table S1: Analysis of variance, treatment structure and mean squares of treatment effects on squash fruit yield and water-use efficiency in the planting seasons. Table S2: Analysis of variance, treatment structure and mean squares of treatment effects on squash fruit yield and water-use efficiency in 2020 and 2021 planting seasons. Figure S1: Experimental layout of the field trial using split-split plot design. Figure S2: Correlation heatmap of measured plant parameters in 2020 planting season. Figure S3: Regression plots showing the relationship between water-use efficiency and fruit yield in (a) 2020 and (b) 2021.
Author Contributions
Conceptualization, S.K.B.; data curation, S.G.A.-S.; formal analysis, S.G.A.-S.; funding acquisition, S.G.A.-S. and K.A.M.A.-E.; investigation, S.K.B. and K.A.M.A.-E.; methodology, S.K.B.; resources, S.G.A.-S.; supervision, S.G.A.-S. and K.A.M.A.-E.; writing—original draft, S.K.B.; writing—review and editing, S.K.B. and K.A.M.A.-E. All authors have read and agreed to the published version of the manuscript.
Funding
This research received no external funding.
Data Availability Statement
Data for sequence of Geobacillus stearothermophilus (accession no. MW785874.1) are available at https://www.ncbi.nlm.nih.gov (accessed on 25 June 2022).
Acknowledgments
The authors would like to express gratitude to the Ministry of Education and King Abdulaziz University, Jeddah, Saudi Arabia for providing the scholarship for accomplishing this study. The authors would also like to acknowledge the technical support of Bassem A. Jamoussi of the Department of Environmental Science, King Abdul Aziz University, Saudi Arabia.
Conflicts of Interest
The authors declare no conflict of interest.
References
- Gichana, Z.; Liti, D.; Wakibia, J.; Ogello, E.; Drexler, S.; Meulenbroek, P.; Ondiba, R.; Zollitsch, W.; Waidbacher, H. Efficiency of pumpkin (Cucurbita pepo), sweet wormwood (Artemisia annua) and amaranth (Amaranthus dubius) in removing nutrients from a smallscale recirculating aquaponic system. Aquacult. Int. 2019, 27, 1767–1786. [Google Scholar] [CrossRef]
- Paksoy, M.; Aydin, C. Some physical properties of edible squash (Cucurbita pepo L.) seeds. J. Food. Eng. 2004, 65, 225–231. [Google Scholar] [CrossRef]
- Ibrahim, E.A.; El-Sherbini, M.A.A.; Selim, E.M. Effects of biochar on soil properties, heavy metal availability and uptake, and growth of summer squash grown in metal-contaminated soil. Sci. Hortic. 2022, 301, 111097. [Google Scholar] [CrossRef]
- Sarhan, T.Z.; Mohammed, G.H.; Teli, J.A. Effect of bio and organic fertilizers on growth yield and fruit quality of summer squash. Sarhad. J. Agric. 2011, 27, 377–383. [Google Scholar]
- Kuslu, Y.; Sahin, U.; Kiziloglu, F.M.; Memis, S. Fruit yield and quality, and irrigation water use efficiency of summer squash drip-irrigated with different irrigation quantities in a semi-arid agricultural area. J. Integr. Agric. 2014, 13, 2518–2526. [Google Scholar] [CrossRef]
- Siswoyo, W.M.B. Response of Squash Crop to Sulphur and Pozzolan as Soil Conditioners under Different Irrigation Water Salinity Levels. Master’s Thesis, King Abdulaziz University, Jeddah, Saudi Arabia, 2013. [Google Scholar]
- Ministry of Agriculture. Ministry of Agriculture Statistical Year Book for 2013, General Authority for Statistics Riyadh, Kingdom of Saudi Arabia; Ministry of Agriculture: Riyadh, Saudi Arabia, 2013. [Google Scholar]
- Alves, J.; Lima, A.; Suassuna, C.; Figueiredo, F.; da Silva, T.; Mesquita, E.; Cavalcante, L.; Mesquita, F. Growth and gas exchange of Cucurbita pepo L. under nitrogen and silicon fertilization. J. Agric. Sci. 2019, 11, 83. [Google Scholar] [CrossRef]
- Youssef, M.A.; AL-Huqail, A.A.; Ali, E.F.; Majrashi, A. Organic amendment and mulching enhanced the growth and fruit quality of squash plants (Cucurbita pepo L.) grown on silty loam soils. Horticulturae 2021, 7, 269. [Google Scholar] [CrossRef]
- Naeem, M.; Iqbal, J.; Ahmad, M.A. Comparative study of inorganic fertilizers and organic manures on yield and yield components of squash (Cucurpita pepo L.). J. Agric. Soc. Sci. 2006, 4, 227–229. [Google Scholar]
- Wei, T.; Zhang, P.; Wang, K.; Ding, R.; Yang, B.; Nie, J.; Jia, Z.; Han, Q. Effects of wheat straw incorporation on the availability of soil nutrients and enzyme activities in semiarid areas. PLoS ONE 2015, 10, e0120994. [Google Scholar] [CrossRef]
- Baumhardt, R.L.; Jones, O.R. Residue management and tillage effects on soil-water storage and grain yield of dry land wheat and sorghum for a clay loam in Texas. Soil. Till Res. 2002, 68, 71–82. [Google Scholar] [CrossRef]
- Crawford, N.M. Nitrate: Nutrient and signal for plant growth. Plant Cell 1995, 7, 859. [Google Scholar] [CrossRef] [PubMed][Green Version]
- Mensinga, T.T.; Speijers, G.J.A.; Meulenbelt, J. Health implications of exposure to environmental nitrogenous compounds. Toxicol. Rev. 2003, 22, 41–51. [Google Scholar] [CrossRef] [PubMed]
- EFSA. Opinion of the Scientific Panel on Contaminants in the Food Chain on a request for the European Commission to perform a scientific risk assessment on nitrate in vegetables. EFSA J. 2008, 689, 1–79. Available online: http://www.efsa.europa.eu/en/efsajournal/doc/689.pdf (accessed on 25 May 2022).
- Liu, C.W.; Sung, Y.; Chen, B.C.; Lai, H.Y. Effects of nitrogen fertilizers on the growth and nitrate content of lettuce (Lactuca sativa L.). Int. J. Environ. Res. Public Health 2014, 11, 4427–4440. [Google Scholar] [CrossRef]
- Bian, Z.; Wang, Y.; Zhang, X.; Li, T.; Grundy, S.; Yang, Q.; Cheng, R. A review of environment effects on nitrate accumulation in leafy vegetables grown in controlled environments. Foods 2020, 9, 732. [Google Scholar] [CrossRef]
- Abd El-Mageed, T.A.; Semida, W.M.; Abd El-Wahed, M.H. Effect of mulching on plant water status, soil salinity and yield of squash under summer-fall deficit irrigation in salt affected soil. Agric. Water Manag. 2016, 173, 1–12. [Google Scholar] [CrossRef]
- Bello, S.K.; Alayafi, A.H.; AL-Solaimani, S.G.; Abo-Elyousr, K.A. Mitigating Soil Salinity Stress with Gypsum and Bio-Organic Amendments: A Review. Agronomy 2021, 11, 1735. [Google Scholar] [CrossRef]
- Al-Solaimani, S.G.; Alghabari, F.; Ihsan, M.Z.; Fahad, S. Water deficit irrigation and nitrogen response of sudan grass under arid land drip irrigation conditions. Irrig. Drain. 2017, 66, 365–376. [Google Scholar] [CrossRef]
- Allen, R.G.; Pereira, L.S.; Raes, D.; Smith, M. Crop evapotranspiration guidelines for computing crop water requirements. Irrig. Drain. 1998, 56, 300. [Google Scholar]
- Hafez, Y.M.; El-Nagar, A.S.; Elzaawely, A.A.; Kamel, S.; Maswada, H.F. Biological control of Podosphaera xanthii the causal agent of squash powdery mildew disease by upregulation of defense-related enzymes. Egypt. J. Biol. Pest Control 2018, 28, 57. [Google Scholar] [CrossRef]
- Statistical Analysis System Institute Incorporation. SAS, Software Version 9.3; Statistical Analysis System Institute Incorporation: Cary, NC, USA, 2011. [Google Scholar]
- R Core Team. R: A Language and Environment for Statistical Computing; R Foundation for Statistical Computing: Vienna, Austria, 2021; Available online: https://www.R-project.org/ (accessed on 18 June 2022).
- Fontes, P.C.R.; Dias, E.N.; Solva, D.J.H. Dinâmica do crescimento, distribuição de matéria seca na planta e produção de pimentão em ambiente protegido. Hortic. Bras. 2005, 23, 94–99. [Google Scholar] [CrossRef]
- Junior, C.P.; Kawakami, J. Efficiency of the leaf disc method for estimating the leaf area index of soybean plants. Acta Sci. 2013, 35, 487–493. [Google Scholar] [CrossRef]
- Türkmen, Ö.; Bozkurt, M.A.; Yıldız, M.; Çimrin, K.M. Effects of nitrogen and humic acid applications on the head weight, nutrient and nitrate contents in lettuce. Adv. Food Sci. 2004, 26, 59–63. [Google Scholar]
- Al-Solaimani, S.G.; El-Nakhlawy, F.S.; Al-Fassi, F.A.; Dazzo, F.B.; Gomaa, A.M. Improving yield and decreasing leaf nitrate content of lettuce via application of the bio-organic agriculture. Wulfenia J. 2015, 22, 566–575. [Google Scholar]
- Russo, R.O.; Berlyn, G.P. The use of organic biostimulants to help low input sustainable agriculture. J. Sustain. Agric. 1990, 1, 19–42. [Google Scholar] [CrossRef]
- Khan, H.A.; Mirwise, M.; Ahmed, N.; Shah, S.A. Effect of humic acid on fruit yield attributes, yield and leaf nutrient accumulation of apple trees under calcareous Soil. Indian J. Sci. Technol. 2018, 11, 1–8. [Google Scholar] [CrossRef]
- Guo, Y.; Ma, Z.; Ren, B.; Zhao, B.; Liu, P.; Zhang, J. Effects of humic acid added to controlled-release fertilizer on summer maize yield, nitrogen use efficiency and greenhouse gas emission. Agriculture 2022, 12, 448. [Google Scholar] [CrossRef]
- Purwanto, B.H.; Wulandari, P.; Sulistyaningsih, E.; Utami, S.N.H.; Handayani, S. Improved corn yields when humic acid extracted from composted manure is applied to acid soils with phosphorus fertilizer. Appl. Environ. Soil. Sci. 2021, 2021, 8838420. [Google Scholar] [CrossRef]
- Li, Z.; Zhang, R.; Xia, S.; Wang, L.; Liu, C.; Zhang, R.; Fan, Z.; Chen, F.; Liu, Y. Interactions between N, P and K fertilizers affect the environment and the yield and quality of satsumas. Glob. Ecol. Conserv. 2019, 19, e00663. [Google Scholar] [CrossRef]
- Chattopadhyaya, N.; Mukherjee, D. Effect of mulching on the changes in the microbial population in soil and nodulation of lentil (Lens culinaris). Environ. Ecol. 1990, 8, 435–437. [Google Scholar]
- Abou El-Magd, M.M.; Zaki, M.F.; Abou-Hussein, S.D. Effect of organic manure and different levels of saline irrigation water on growth: Green yield and chemical content of sweet fennel. Aust. J. Basic Appl. Sci. 2008, 2, 90–98. [Google Scholar]
- Salehzadeh, H.; Maleki, A.; Rezaee, R.; Shahmoradi, B.; Ponnet, K. The nitrate content of fresh and cooked vegetables and their healthrelated risks. PLoS ONE 2020, 15, e0227551. [Google Scholar] [CrossRef] [PubMed]
- Santamaria, P.; Eliab, A.; Seriob, F. Effect of solution nitrogen concentration on yield, leaf element content, and water and nitrogen use efficiency of three hydroponically-grown rocket salad genotypes. J. Plant Nutr. 2002, 25, 245–258. [Google Scholar] [CrossRef]
- Anon. Commission Regulation (EU) No 1258/2011 of 2 December 2011 amending Regulation (EC) No 1881/2006 as regards maximum levels for nitrates in foodstuffs. Off. J. Eur. Union 2011, L320, 15–17. [Google Scholar]
- Amro, A. Nitrate and nitrite content of some vegetables grown in central Jordan valley. Agric. Sci. 2000, 27, 410–419. [Google Scholar]
- Ali, R.A.; Muhammad, K.A.; Qadir, O.K. A survey of nitrate and nitrite contents in vegetables to assess the potential health risks in Kurdistan, Iraq. IOP Conf. Ser. Earth Environ. Sci. 2021, 910, 012065. [Google Scholar] [CrossRef]
- Elsayed, S.I.M.; Glala, A.A.; Abdalla, A.M.; El-Sayed, A.E.A.; Darwish, M.A. Effect of biofertilizer and organic fertilization on growth, nutrient contents and fresh yield of dill (Anethum graveolens). Bull. Natl. Res. Cent. 2020, 44, 122. [Google Scholar] [CrossRef]
- Weightman, R.M.; Hudson, E.M. Noxious or nutritious? Progress in controlling nitrate as a contaminant in leafy crop species. Food Energy Secur. 2013, 2, 141–156. [Google Scholar] [CrossRef]
- Vaughan, D.; Malcolm, R.E.; Ord, B.G. Influences of humic substances on biochemical process in plant. In Soil Organic Matter and Biological Activity; Vaughan, D., Malcolm, R.E., Eds.; Martinus Nijhoff/Junk W: Dordrecht, The Netherlands, 1985. [Google Scholar]
- Benedetti, A.; Figliolia, A.; Izza, C.; Canali, S.; Rossi, G. Some thoughts on the physiological effects of humic acid: Interactions with mineral fertilizers. Agrochimica 1996, 40, 229–240. [Google Scholar]
- Naserzadeh, Y.; Nafchi, A.M.; Mahmoudi, N.; Nejad, D.K.; Gadzhikurbanov, A.S. Effect of combined use of fertilizer and plant growth stimulating bacteria Rhizobium, Azospirillum, Azotobacter and Pseudomonas on the quality and components of corn forage in Iran. RUDN J. Agron. Anim. Indust. 2019, 14, 209–224. [Google Scholar] [CrossRef]
- Weightman, R.M.; Buxton, J.; Dyer, C.; Farrington, D. Investigation of sampling and sources of variation in nitrate levels in lettuce and spinach. In Final Report on Project CO3030 for the UK Food Standards Agency; UK Food Standards Agency: London, UK, 2005. [Google Scholar]


Publisher’s Note: MDPI stays neutral with regard to jurisdictional claims in published maps and institutional affiliations. |
© 2022 by the authors. Licensee MDPI, Basel, Switzerland. This article is an open access article distributed under the terms and conditions of the Creative Commons Attribution (CC BY) license (https://creativecommons.org/licenses/by/4.0/).