Article

Metabolome and Transcriptome Analyses Unravels Molecular Mechanisms of Leaf Color Variation by Anthocyanidin Biosynthesis in Acer triflorum

1
College of Forestry and Grassland, Jilin Agricultural University, Changchun 130118, China
2
State Key Laboratory of Tree Genetics and Breeding, Northeast Forestry University, Harbin 150040, China
3
Southern Swedish Forest Research Centre, Swedish University of Agricultural Sciences, P.O. Box 190, SE-234 22 Lomma, Sweden
*
Authors to whom correspondence should be addressed.
These authors contributed equally to this work.
Horticulturae 2022, 8(7), 635; https://doi.org/10.3390/horticulturae8070635
Submission received: 5 June 2022 / Revised: 5 July 2022 / Accepted: 11 July 2022 / Published: 14 July 2022
(This article belongs to the Special Issue Genomics and Bioinformatics Applications in Horticulture)

Abstract

:
Acer triflorum Komarov is an important ornamental tree, and its seasonal change in leaf color is the most striking feature. However, the quantifications of anthocyanin and the mechanisms of leaf color change in this species remain unknown. Here, the combined analysis of metabolome and transcriptome was performed on green, orange, and red leaves. In total, 27 anthocyanin metabolites were detected and cyanidin 3-O-arabinoside, pelargonidin 3-O-glucoside, and peonidin 3-O-gluside were significantly correlated with the color development. Several structural genes in the anthocyanin biosynthesis process, such as chalcone synthase (CHS), flavanone 3-hydroxylase (F3H), and dihydroflavonol 4-reductase (DFR), were highly expressed in red leaves compared to green leaves. Most regulators (MYB, bHLH, and other classes of transcription factors) were also upregulated in red and orange leaves. In addition, 14 AtrMYBs including AtrMYB68, AtrMYB74, and AtrMYB35 showed strong interactions with the genes involved in anthocyanin biosynthesis, and, thus, could be further considered the hub regulators. The findings will facilitate genetic modification or selection for further improvement in ornamental qualities of A. triflorum.

1. Introduction

Acer triflorum Komarov is a rare, endangered, deciduous tree species of the Aceraceae family (Acer Linn.) in China [1,2]. It is mainly distributed in Japan, Korea, Russia, Mongolia, and China, while in China it occurs in Heilongjiang, Jilin, and Liaoning provinces. The exfoliating barks of A. triflorum confer reddish and tan color, and, more attractively, the green leaves with three leaflets become bright red in autumn. As an excellent color-leaf ornamental tree species, it is used for landscaping projects, especially for the corridor forest landscape [3,4]. In addition, A. triflorum is beneficial to ecological protection of saline-alkali zones due to its strong cold tolerance and salt-alkali resistance [5]. Due to the ornamental characteristics and gardening application, researchers have studied the morphological and physiological traits suitable for developing propagation methods [6] and seed contents in A. triflorum [7]; however, relatively little is known about molecular mechanism of leaf color change. Generally, the causes of leaf color change during autumn are very complex and are dependent on the type and concentration of pigments. Anthocyanin is a water-soluble pigment, which provides the red color of autumn leaves of many plants [8,9]. Significantly decreased chlorophyll content and anthocyanin accumulation were found in several woody plants when the green leaves turn red [10,11]. Generally, biosynthesis of anthocyanin is a part of the flavonoid biosynthesis, which involves several transcription factors and structural genes. Classical structural genes responsible for anthocyanin biosynthesis in some model and horticultural plants include anthocyanin synthase (ANS), dihydroflavonol 4-reductase (DFR), UDP-glucose: flavonoid 3-O-glucosyltransferase (UFGT), phenylalanine ammonia-lyase (PAL), chalcone synthase (CHS), and 4-coumarate-CoA ligase (4CL) [12,13]. The expression levels of these structural genes are influenced by several transcription factors including MYB and bHLH, and MYB-bHLH-WD40 (MBW) has been shown to involve in anthocyanin biosynthesis [14,15].
With methodological advances, high-throughput transcriptome and metabolome analyses become a valuable tool for studying various aspects of plant growth and development. For instance, high-throughput transcriptome and metabolome technologies are used to examine genes related with transcription-regulation as well as metabolic pathways for many phenotypic indicators, providing the basis for molecular genetic improvement of tree species [16,17]. Similarly, multi-omics has been employed to explore the molecular mechanisms of variation in leaf color in Acer species [9]. For example, it has been shown that a significantly decreased chlorophyll content and an increased anthocyanin accumulation contribute to changes into red leaf color in Acer pictum subsp. In Acer pictum subsp. mono, CBL-interacting protein kinase genes (DFR, PAL1, and CIPKs) involved in the anthocyanin synthesis pathway were differentially expressed during leaf color change [18]. According to transcriptomic and metabolic analyses of various leaf color mutations in A. rubrum, a massive accumulation of cyanidin was observed in red-colored leaves; F3H (flavanone 3-hydroxylase), F3′H (flavanone 3′-hydroxylase), CHS, DFR, and UFGT are distinctively expressed in different colored leaves [19]. These studies indicated that the molecular mechanisms involved in variations in leaf color among different plant species are not identical, which is also confirmed by another study that showed that the regulatory mechanisms vary across plant species [20]. Thus, species-specific studies on the molecular mechanisms for leaf color change are necessary to guide genetic improvement of the species.
In this study, we conducted metabolome and transcriptome analyses of green, orange, and red leaves of A. triflorum with similar dimensions in different seasons to mine the genes and metabolites related to changes in leaf color, as well as profiling the association between genes and metabolites. The results will provide insightful ideas about genetic improvement of ornamental qualities of the species.

2. Materials and Methods

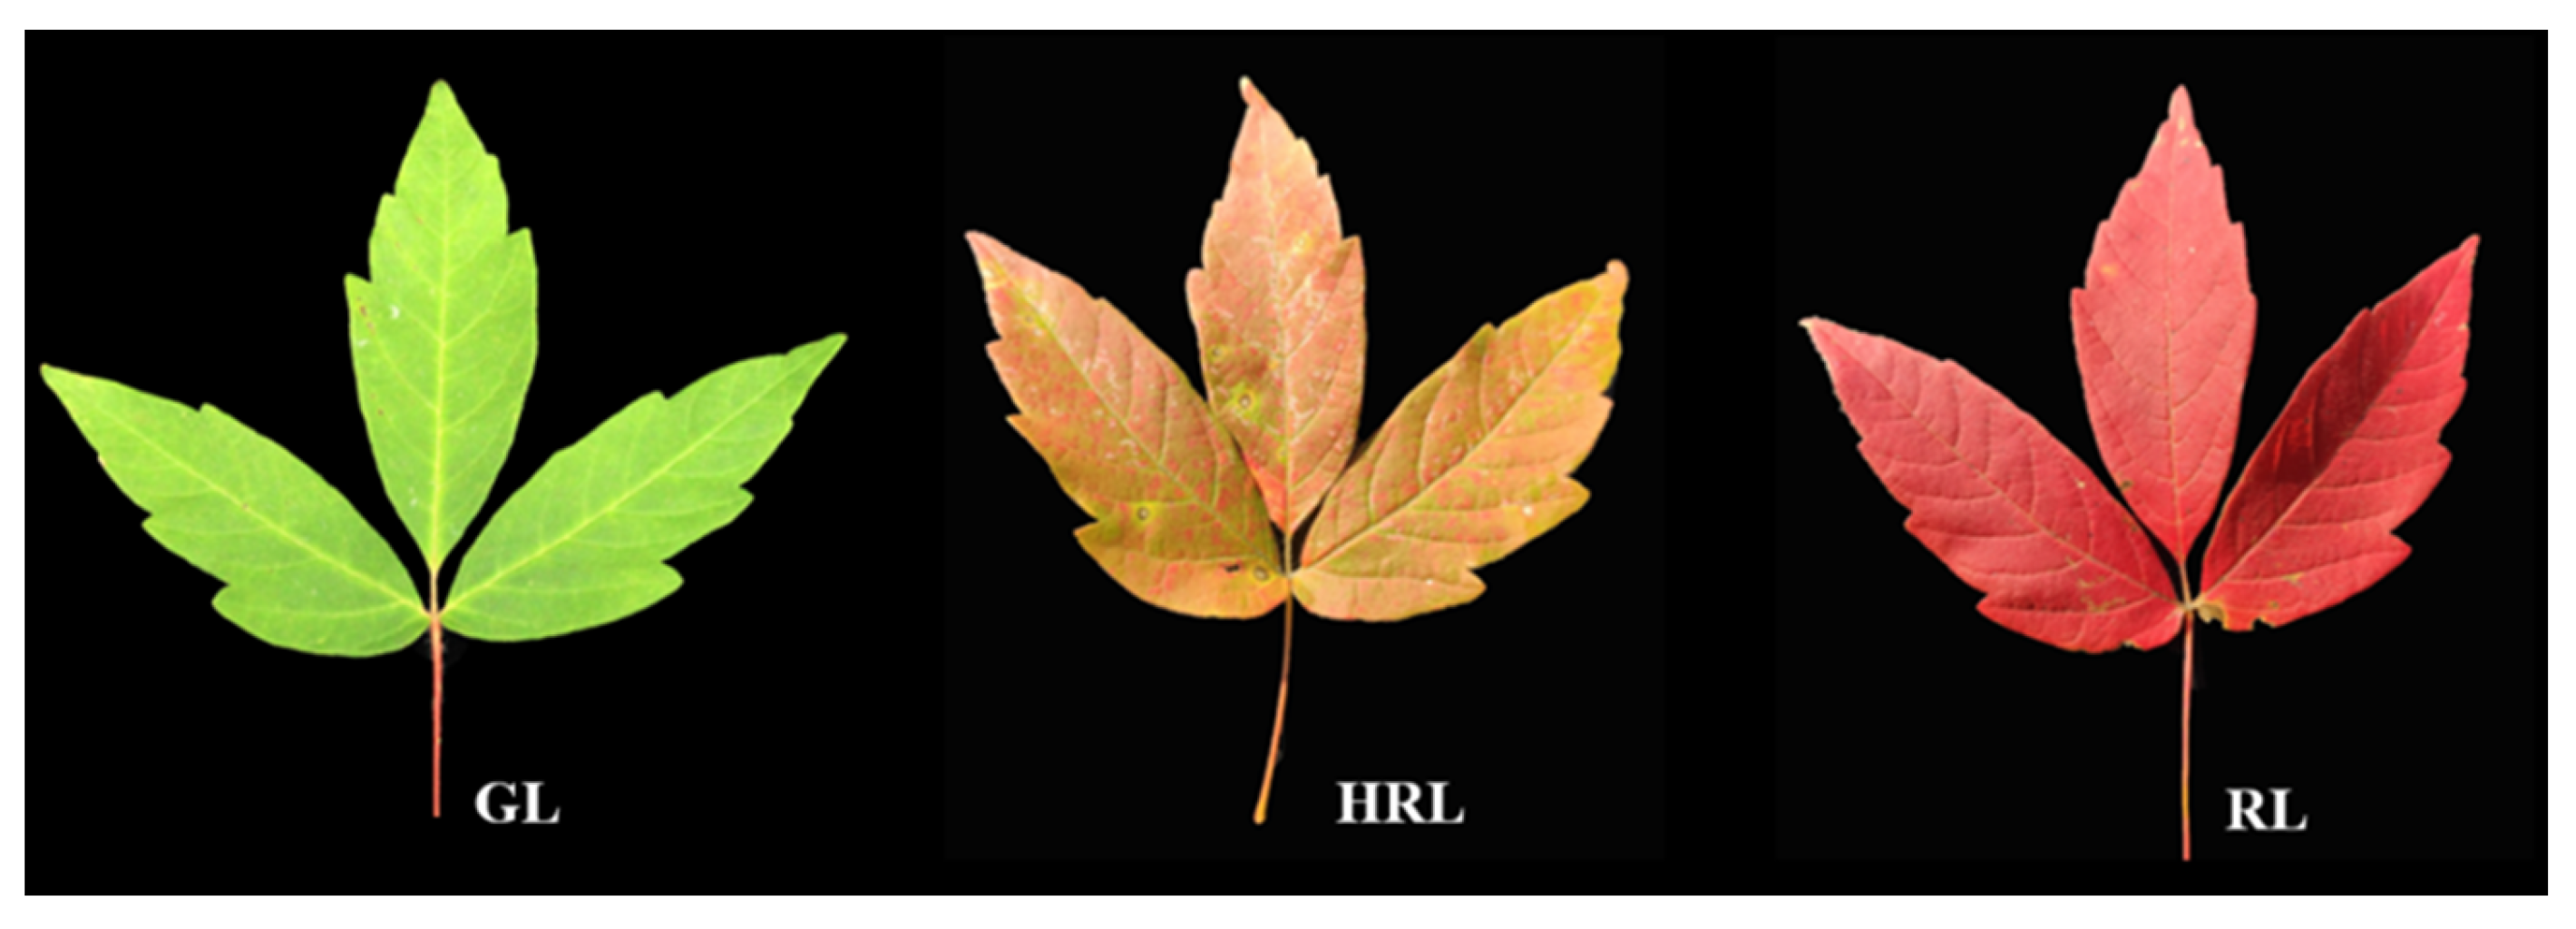
2.1. Plant Materials

Well-grown A. triflorum plants under natural conditions were selected as plant materials at the Shanhetun Forestry Bureau, Wuchang City, Heilongjiang Province (44°30′50.34″ N, 127°52′23.35″ E) located at an altitude of 252.8 m. Three key developmental periods with different leaf colors (green, orange, and red leaves (Figure 1)) were considered. For each color type, we collected six leaves comprising a single biological sample, and three independent replicates per color sample were used. The collected fresh leaf samples were immediately stored in a freezer at −80 °C in liquid nitrogen until metabolomic and transcriptomic analyses were performed.

2.2. Metabolite Extraction and Profiling

We followed previously described methods for preparation and extraction of metabolome samples [21]. Briefly, the freeze-dried leaves were crushed in mill (MM 400, Retsch), and the pulverized samples (50 mg) were extracted with 0.5 mL of 80% aqueous methanol (contained 0.1% hydrochloric acid). The mixture was vortexed for 10 min, sonicated for 10 min, and centrifuged at 12,000 r/min for 3 min. Finally, the supernatants were collected and filtered. The extracted samples of three different colored leaves were analyzed using Ultra Performance Liquid Chromatography (UPLC, ExionLCTMAD) and Tandem Mass Spectrometry (MS, Applied Biosystems 6500 Triple Quadrupole). The following conditions were employed: (a) chromatographic column: ACQUITY BEH C18 (1.7 μm, 2.1 × 100 mm); (b) mobile phase: pure water with 0.1% formic acid as solvent A and methanol with 0.1% formic acid as solvent B; (c) gradient program: 95% solvent A and 5% solvent B at 0 min with 5% increase in solvent A and 95% in solvent B within 12 min. The mixture was kept for 2 min before 95% solvent A and 5% solvent B were returned to at 14 min; then, the column was equilibrated for 2 min. (d) The flow velocity was 0.35 mL/min; the temperature of the column oven was 40 °C with 2 μL injection volume. The effluent was alternatively connected for quantification with linear trap and excellent identification in MRM Mode.
Linear ion trap and triple quadrupole scans were acquired on Q TRAP (API 6500 Q TRAP UPLC/MS/MS System), equipped with an ESI Turbo Ion-Spray interface, which operated in positive ion mode and was controlled using Analyst 1.6.3 software (AB Sciex). The operation parameters for the ESI source were turbo spray as the ion source with 550 °C source temperature and 5500 V ion spray voltage in a positive ion mode; and 35 psi curtain gas (CUR). We performed declustering potential (DP) and collision energy (CE) for individual multiple reaction monitoring (MRM) transitions with further optimization of DP and CE. The MRM transitions were monitored for each period based on the metabolites eluted within this period.

2.3. Qualitative and Quantitative Analysis of Metabolites

To obtain the original metabolite data, the mass spectrum data were analyzed using the MetWare database of MetWare Biotechnology Co., Ltd. (Wuhan, China) and R Programming language (https://www.r-project.org/, accessed on 2 June 2022). To identify the accumulation of metabolites, hierarchical cluster analysis (HCA) was used. Furthermore, the differentially accumulated metabolites were filtered using the criteria of fold change ≥ 2 or fold change ≤ 0.5 at p < 0.05.

2.4. RNA Extraction, Sequencing, and Transcriptome Data Analysis

To isolate the total RNA from leaf samples, we used the RNAprep Pure Plant Plus Kit (Tiangen, Beijing, China). We then generated nine cDNA libraries using the NEBNext®UltraTM RNA Library Prep Kit for Illumina® (NEB, Ipswich, MA, USA) following the recommendations of the manufacturer. The cDNA libraries were then sequenced on an Illumina HiSeqTM Xten platform, and the raw data with 150 bp paired-end reads were obtained for subsequent analysis.
The original image data were converted to raw reads by base calling and then the raw reads were filtered using fastp software (Version 0.12) to obtain high-quality clean sequences. We used Trinity software for de novo assembly, and the assembled transcript sequences were used as the reference sequences for subsequent analysis. The longest cluster sequences were generated as unigenes based on hierarchical clustering analysis using Corset [22]. Several public databases, such as Gene Ontology (GO), Kyoto Encyclopedia of Genes and Genomes (KEGG), Non-Redundant Protein Sequence Database (NR), euKaryotic Ortholog Groups (KOG), a manually annotated and reviewed protein sequence database (Swiss-Prot), protein family (Pfam), and Trembl database were used to annotate the unigenes. FPKM (fragments per kilobase of transcript per million fragments mapped) was calculated to determine the expression level of a transcript or gene. Differential expression analysis between different color groups was conducted using DESeq2 R package [23,24]. The Benjamini–Hochberg method for correcting p values was used to control the false discovery rate (FDR). The unigenes were selected by FDR < 0.05 as well as |log2 fold change (FC)| ≥ 1. Finally, the GO and KEGG enrichment analyses of DEGs were carried out using the GOseq R packages [25] and KOBAS 2.0 software [26].

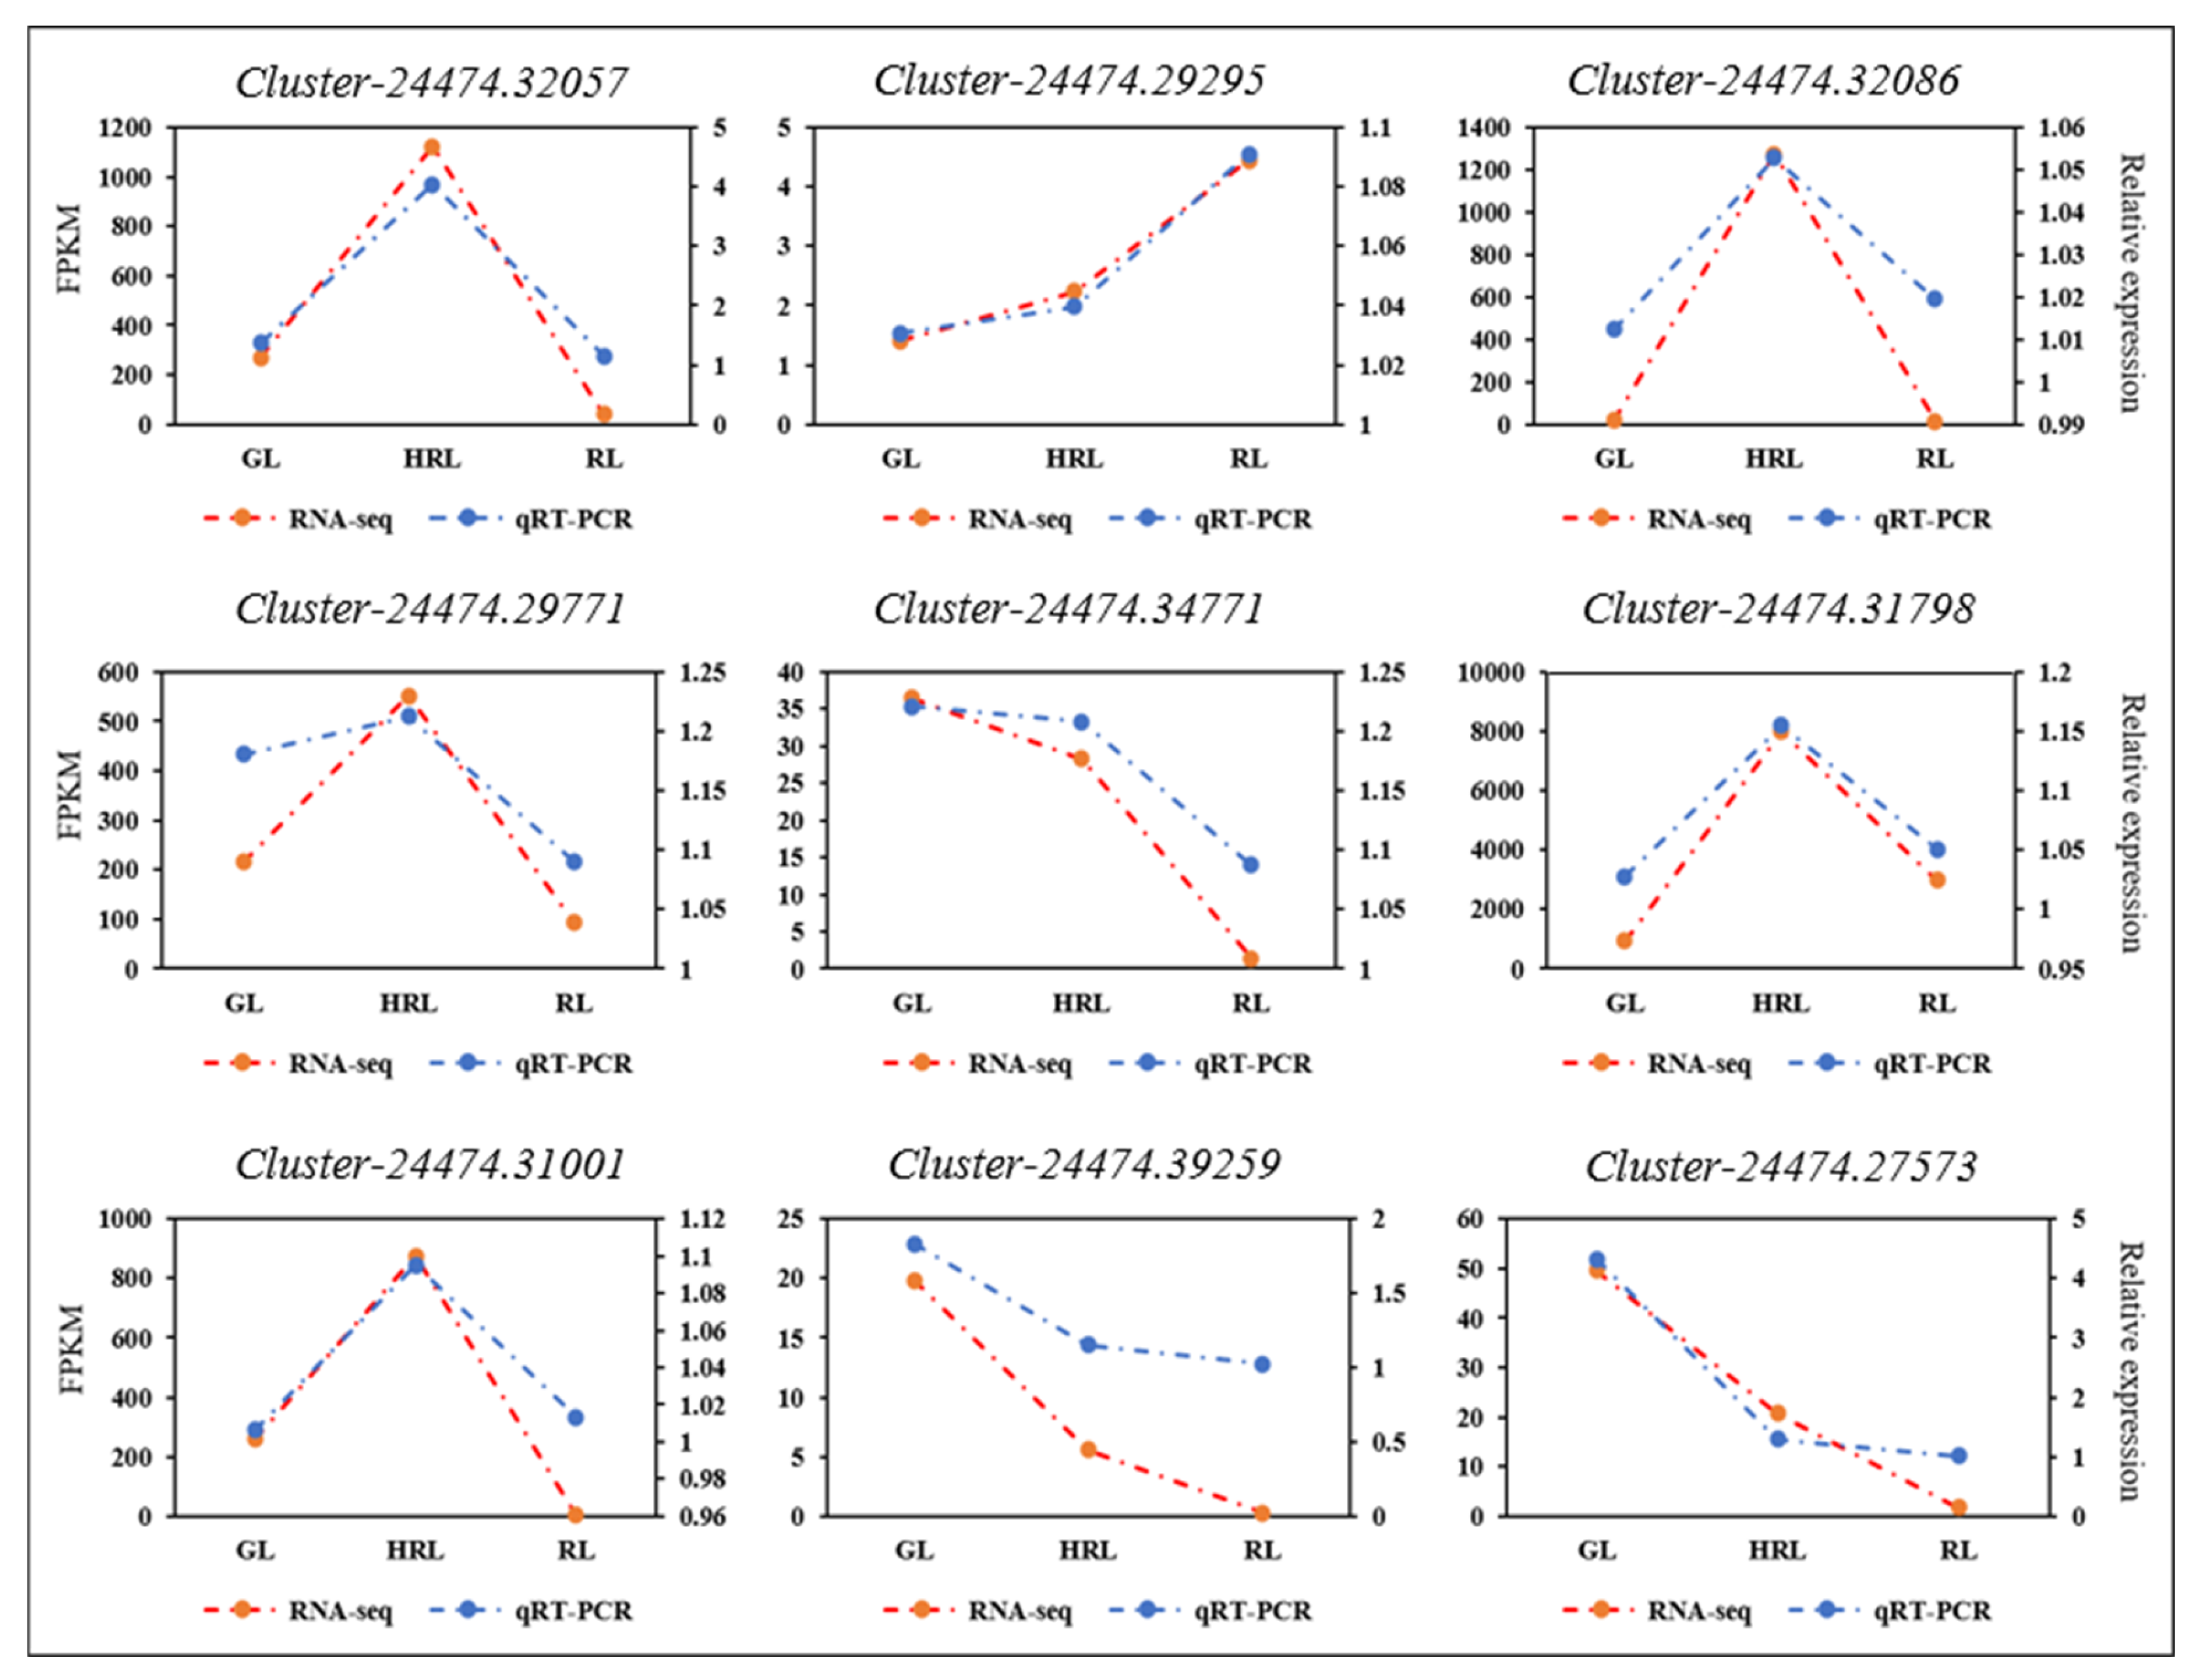
2.5. Quantitative Real-Time Polymerase Chain Reaction (qRT-PCR) Validation

Nine genes, identified in transcriptome analysis, that were related to flavonoid biosynthesis were selected for qRT-PCR analysis. The total RNA extraction was the same as described above. The cDNA was synthesized using the PrimeScript RT reagent Kit with gDNA Eraser (TaKaRa, Shiga, Japan), and the specific primers were designed using Primer 3 software and shown in Table S1. Finally, qRT-PCR was performed on TB Green® Premix Ex TaqTM II (TaKaRa, Shiga, Japan) in the ABI 7500 Fast Real-Time Detection System. All analyses had three biological replicates with three technical replicates each, and the gene expression levels were determined using the 2−ΔΔCt method.

2.6. Interaction Network Construction

To predict which AtrMYBs can regulate differentially expressed structural genes involved in anthocyanin synthesis, protein–protein interaction (PPI) networks were constructed on the STRING website (https://www.string-db.org/, accessed on 2 June 2022). Briefly, the amino acid sequences of AtrMYBs and anthocyanin synthesis structural genes were uploaded on the STRING website with default parameters. An interaction network of AtrMYBs and differentially expressed genes related to anthocyanin biosynthesis were constructed and the protein sets were mapped to homologous proteins in Arabidopsis. Thereafter, the protein interaction results were imported into Cytoscape software to acquire the top 40 regulatory nodes using cytoHubba. These genes in the interaction network were designated with new names for clear visualization (Table S2). The FPKM values of AtrMYB genes in the top 40 regulatory nodes were used to construct a heatmap using TBtools [27].

3. Results

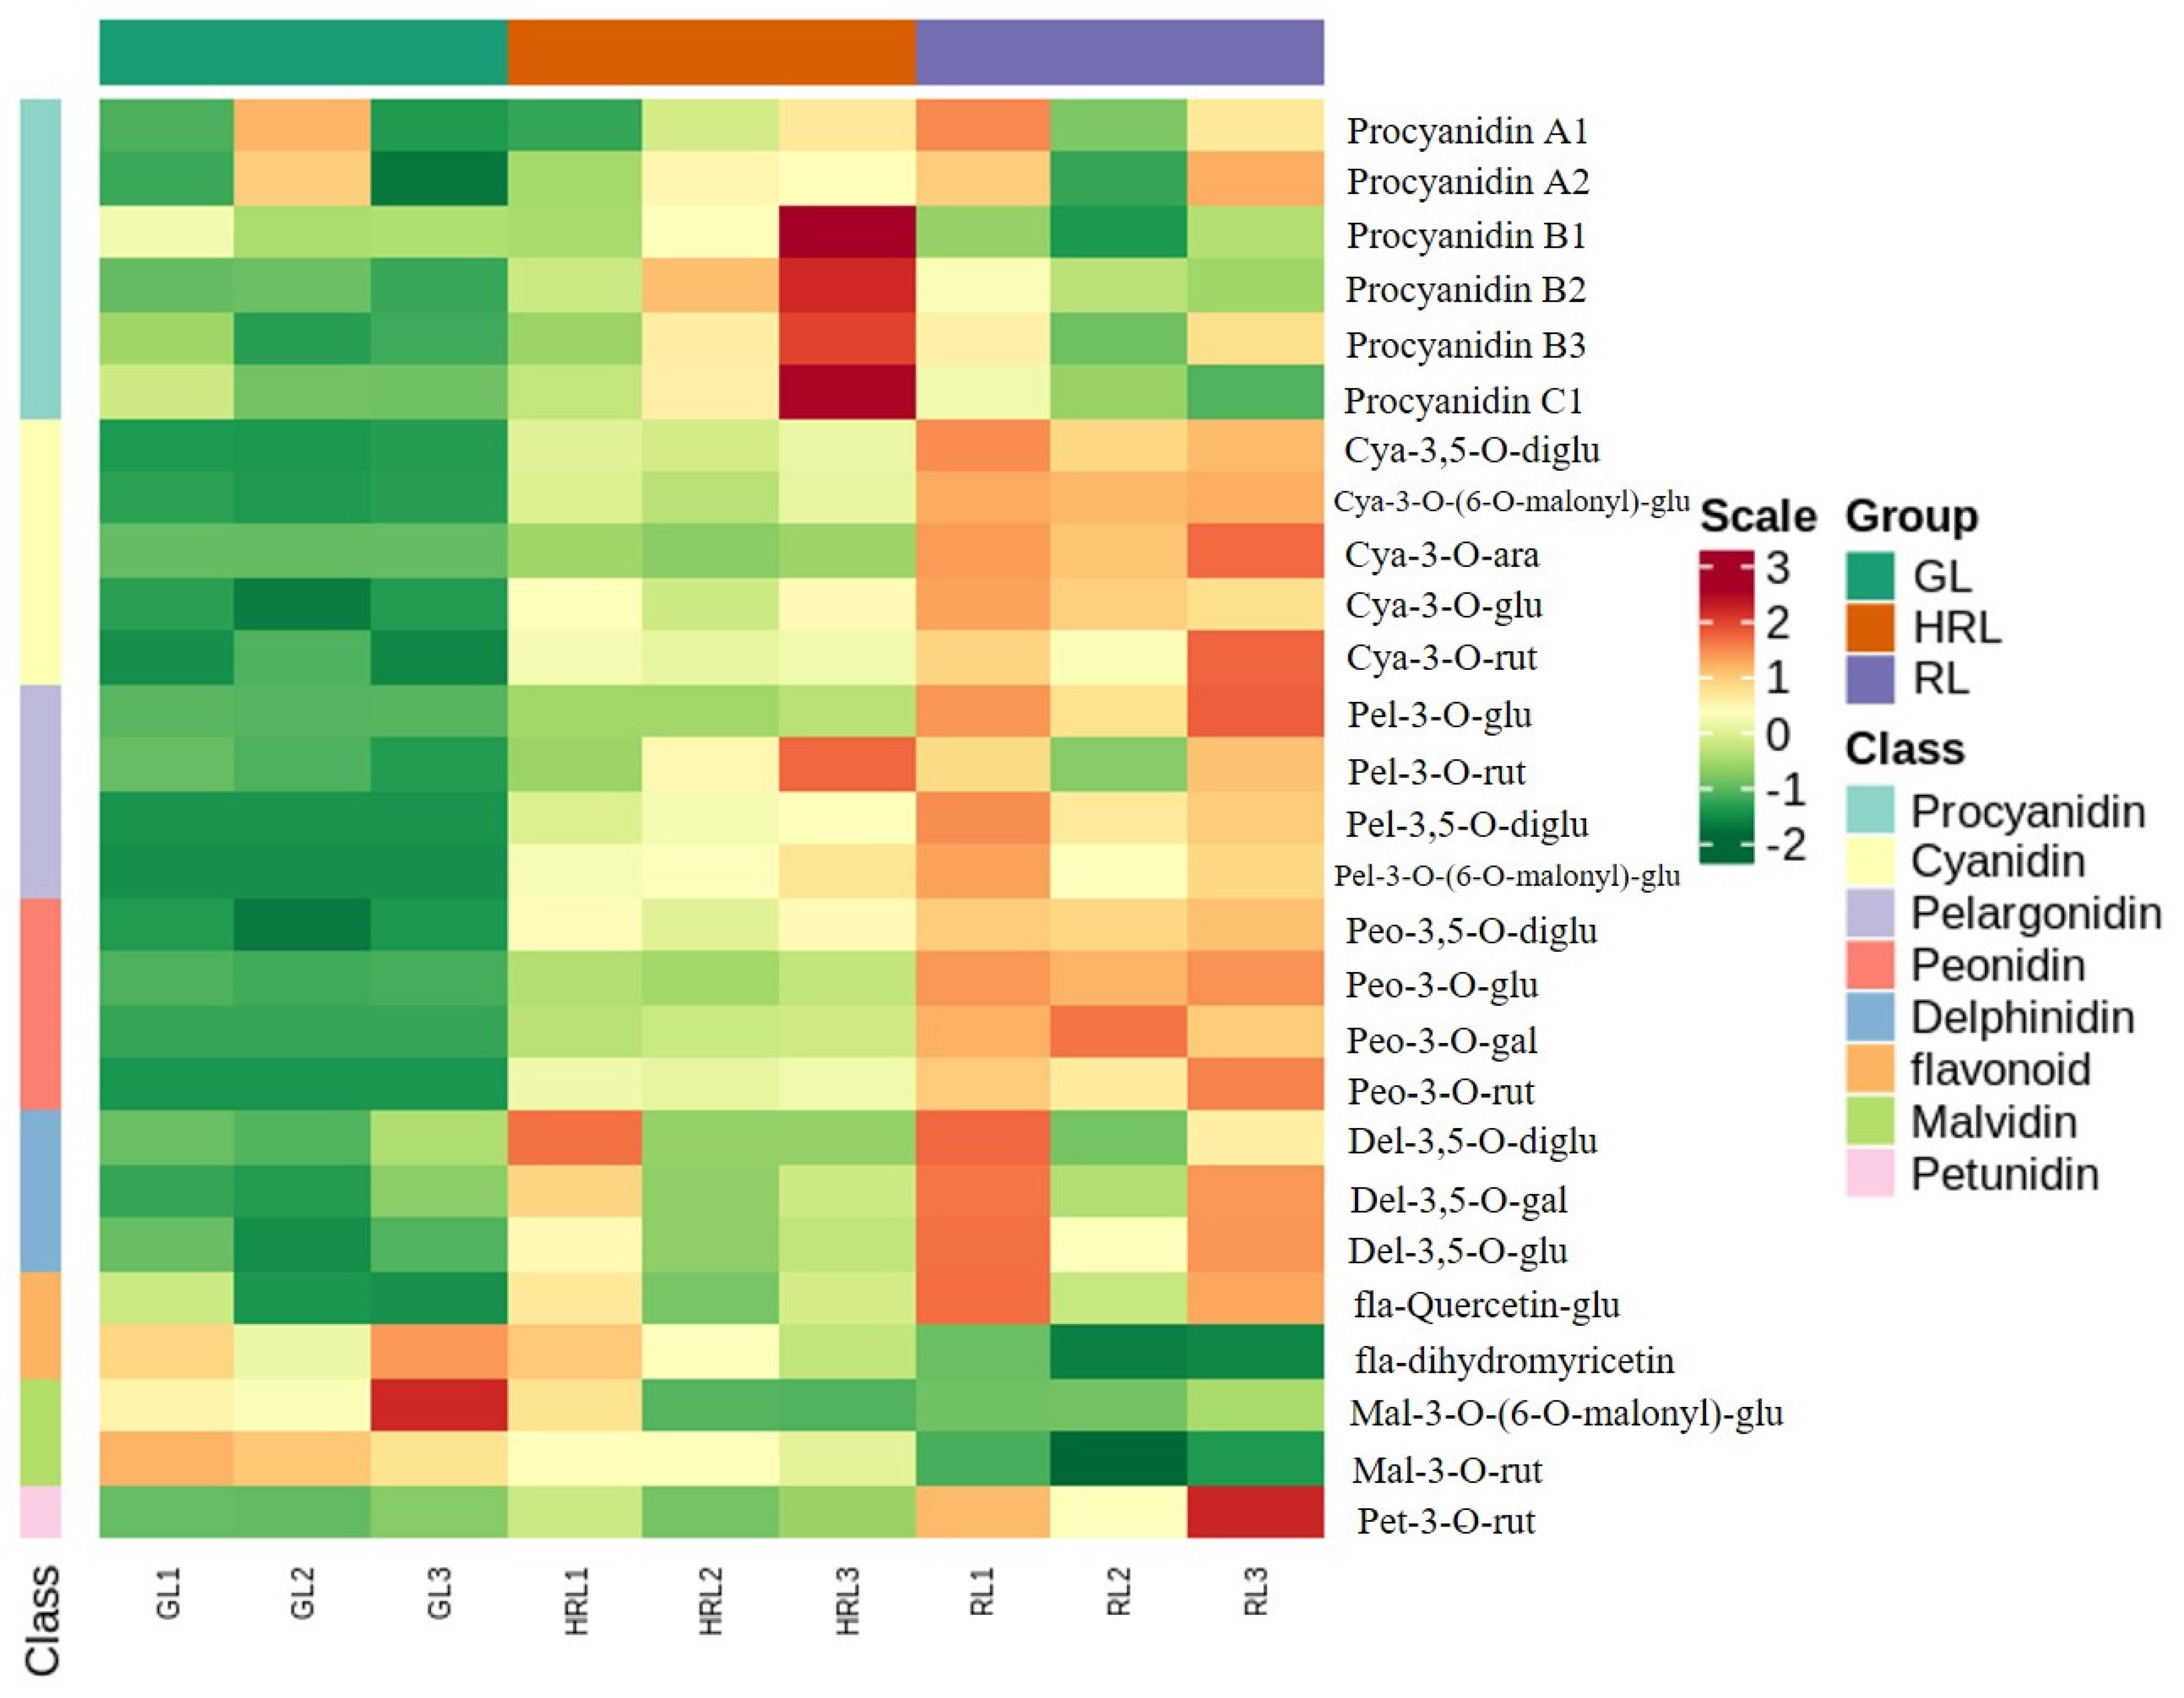
3.1. Metabolites in A. triflorum Leaves

A total of 27 metabolites involved in anthocyanin biosynthesis were identified in A. triflorum leaves, and grouped into 8 classes, including 5 cyanidins, 3 delphinidins, 2 malvidins, 4 pelargonidins, 4 peonidins, 1 petunidin, 6 procyanidins, and 2 flavonols (Supplementary Table S3 and Figure S2). From the hierarchical heatmap analysis of metabolite concentration data, most metabolites, such as cyanidins (cyanidin 3,5-O-diglucoside, cyanidin 3-O(6-O-malonyl-beta-d-glucoside), cyanidin 3-O-arabinoside, cyanidin 3-O-glucoside and cyanidin 3-O-rutinoside), pelargonidins (pelargonidin 3-O-(6-O-malonyl-beta-d-glucoside), pelargonidin 3-O-glucoside, pelargonidin 3-O-rutinoside and pelargonidin 3,5-o-diglucoside), peonidins (peonidin 3,5-O-diglucoside, peonidin 3-O-glucoside, peonidin 3,5-O-diglucoside, peonidin 3-O-galactoside, and peonidin 3-O-rutinoside), petunidin (petunidin 3-O-glucoside), and delphinidins (delphinidin 3,5-O-diglucoside (delphin), delphinidin 3-O-galactoside, and delphinidin 3-O-glucoside), were abundantly found in red leaves of A. triflorum (Figure 2). At the same time, clear separations between the different colored leaves were observed from the hierarchical cluster analysis (Supplementary Figure S3). The metabolite profiles in these samples were obviously distinct which were also classed into two main groups (green-colored and red-colored leaf samples) with contrasting accumulation levels.

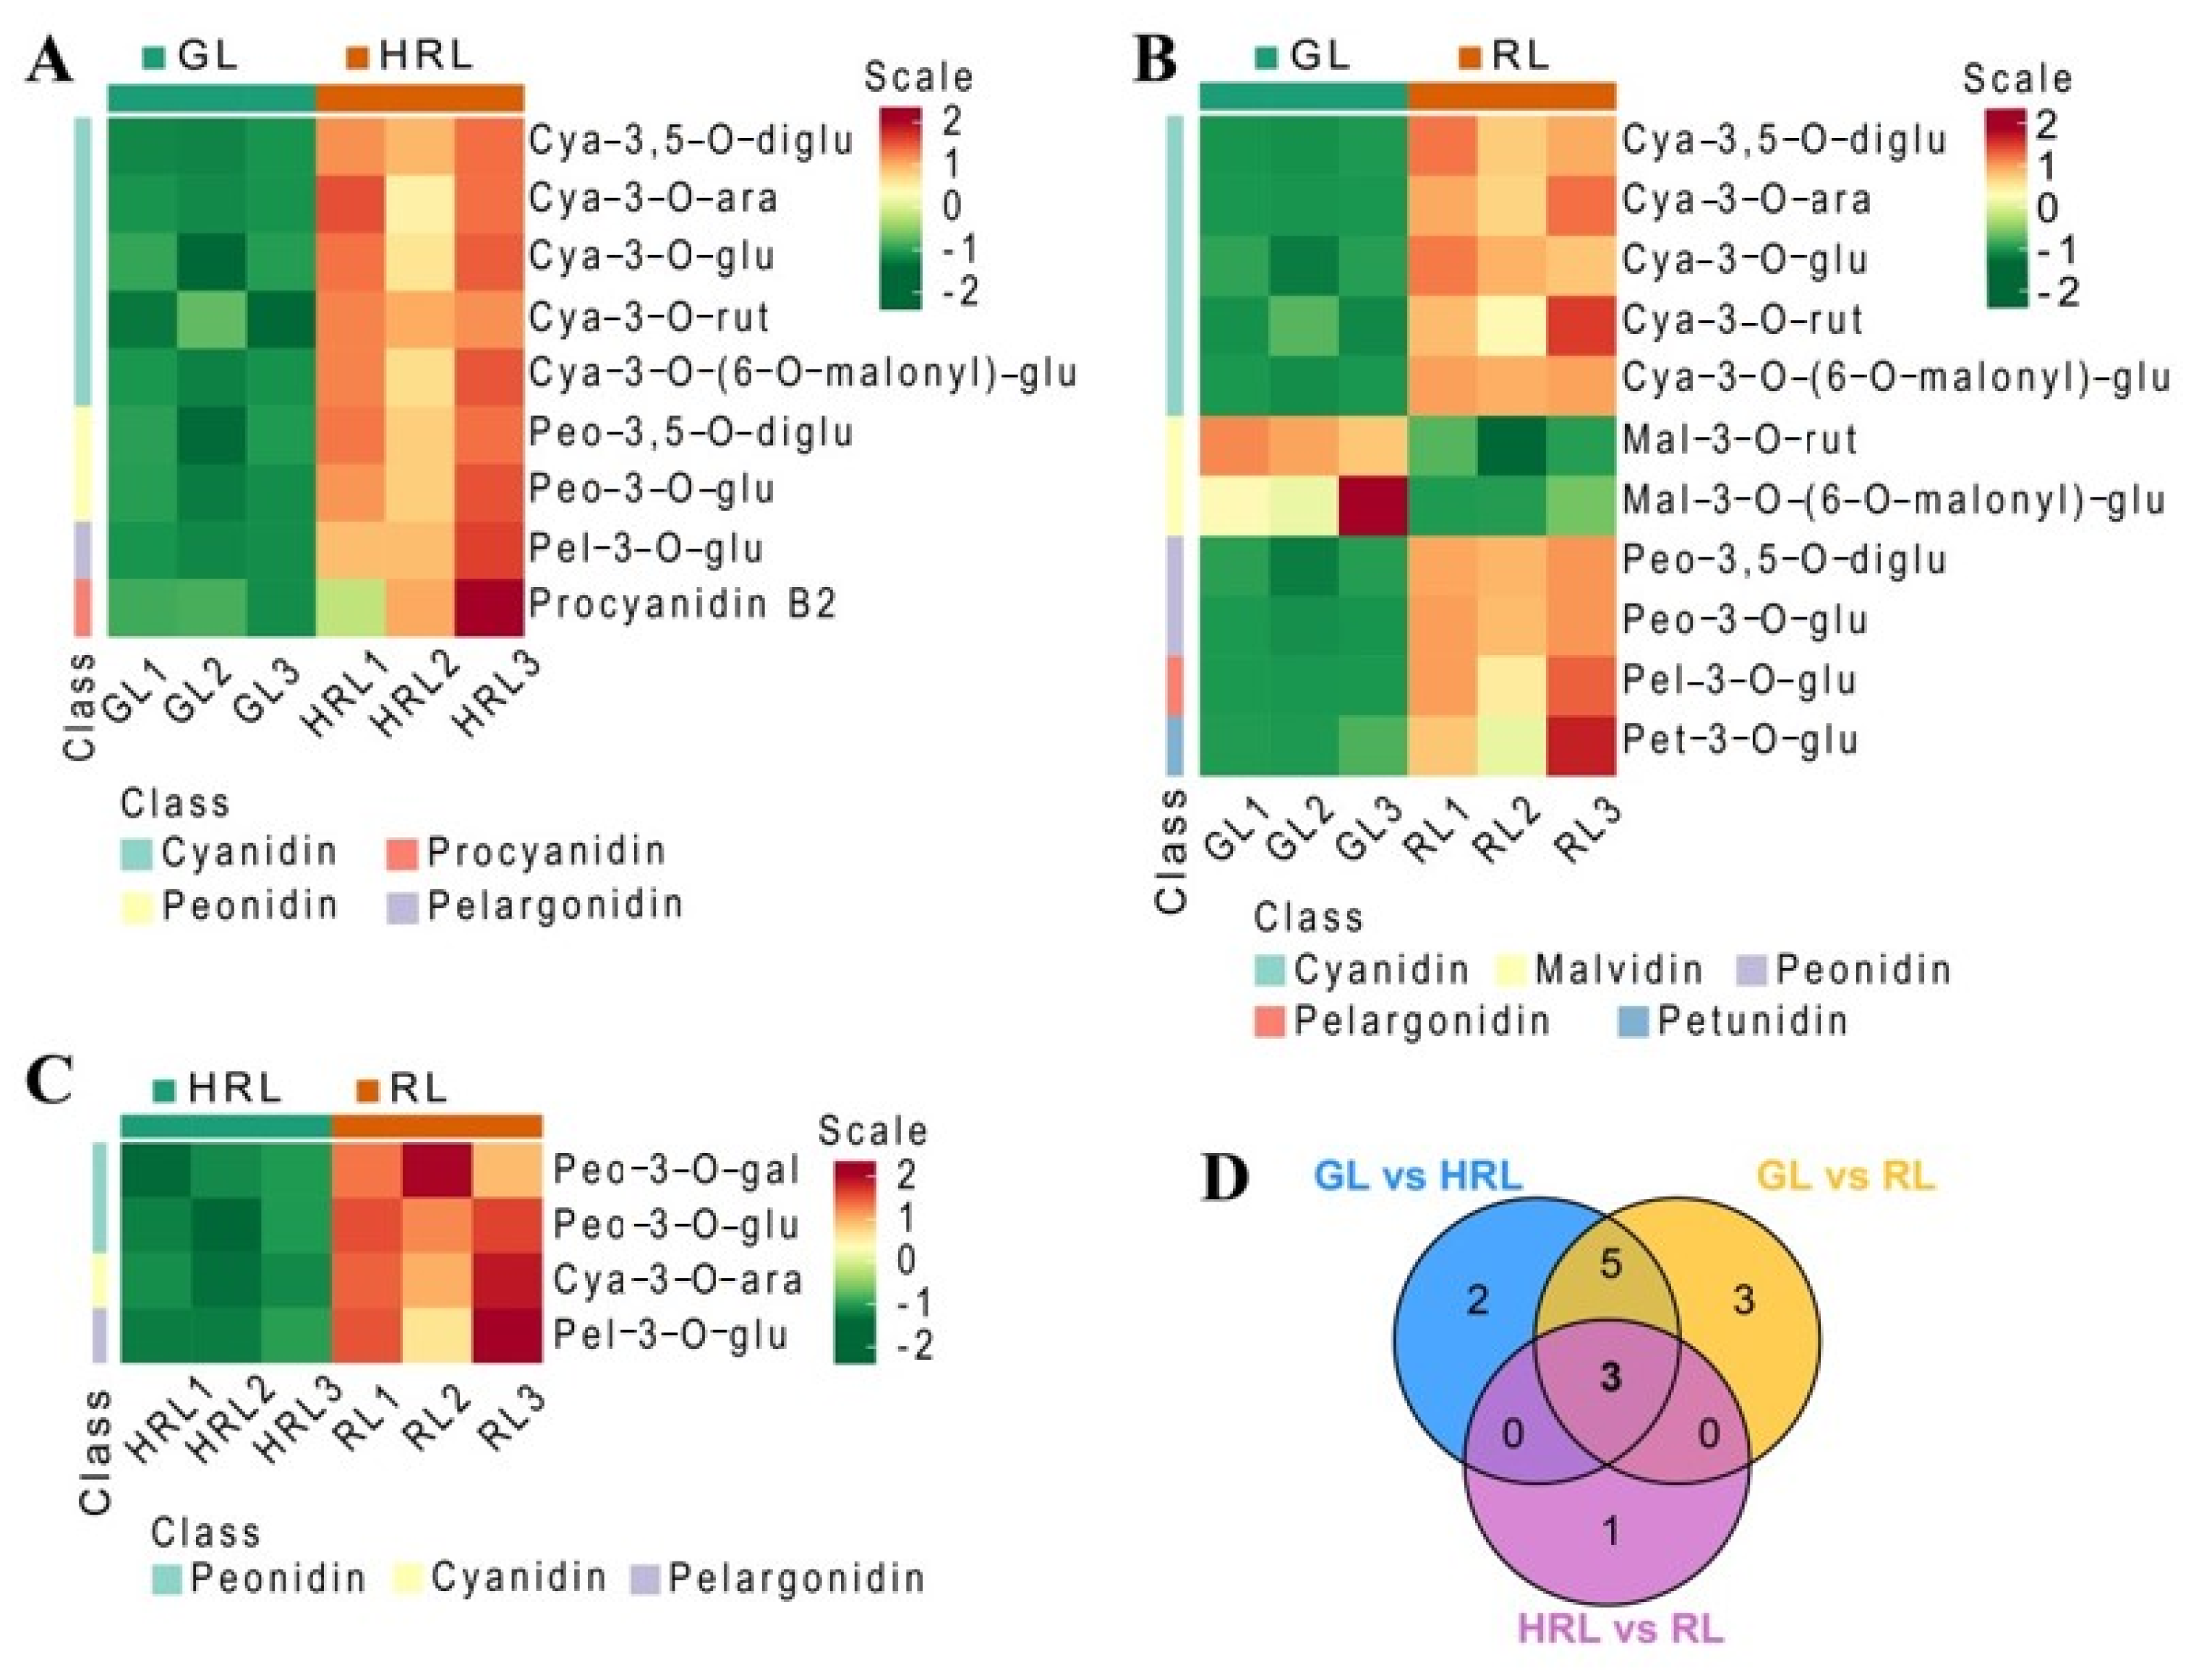
3.2. Differentially Accumulated Metabolites

To better select the final differential metabolites between the compared samples, fold change of metabolites ≥ 2 or ≤0.5 was employed as a screening criterium. The results showed some differentially accumulated metabolites (DAMs): 9 upregulated DAMs in green versus orange leaves, 9 upregulated and 2 downregulated DAMs in green versus red leaves, and 4 upregulated in orange versus red leaves were obtained (Figure 3A–C; Supplementary Table S4). Compared to green leaves, most DAMs in the anthocyanin biosynthesis pathway significantly increased in orange and red leaves, while the malvidins (mal-3-O-rut and mal-3-O-(6-O-malonyl)-glu) were gradually reduced as the leaves of A. triflorum became red. It indicated that cyanidin 3-O-glucoside, cyanidin 3,5-O-diglucoside, delphinidin 3-O-glucoside, peonidin 3,5-O-diglucoside, and dihydromyricetin played a crucial role in variation in color of A. triflorum leaves. The Venn diagram (Figure 3D) shows that 3 anthocyanins (cyanidin 3-O-arabinoside, pelargonidin 3-O-glucoside, and peonidin 3-O-gluside) were identified as the common metabolites among green versus orange leaves, green versus red leaves, and orange versus red leaves, as expected. These three metabolites were upregulated with increase in the redness in leaves and substantially enriched in the pathway of anthocyanin biosynthesis (ko00942), which were speculated as the vital metabolites for color formation of A. triflorum leaves.

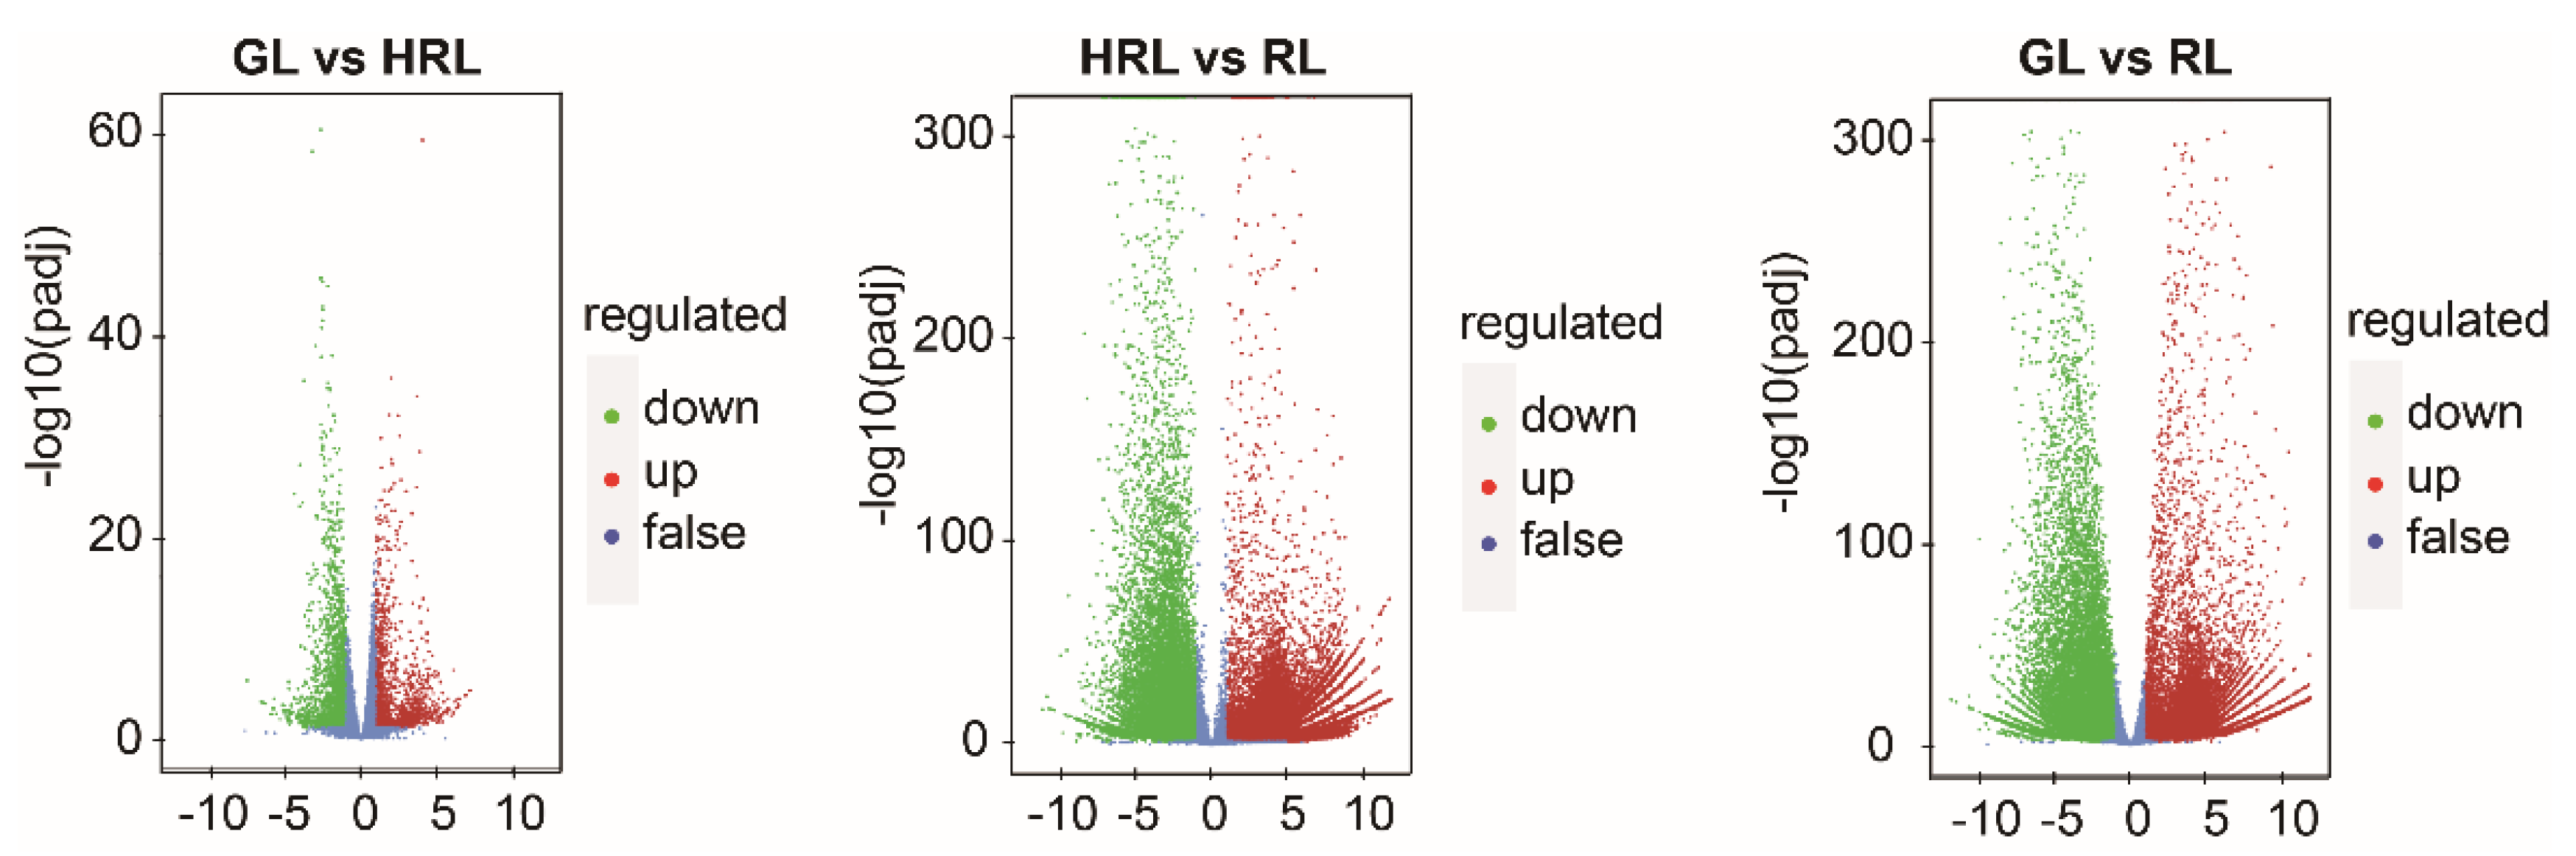
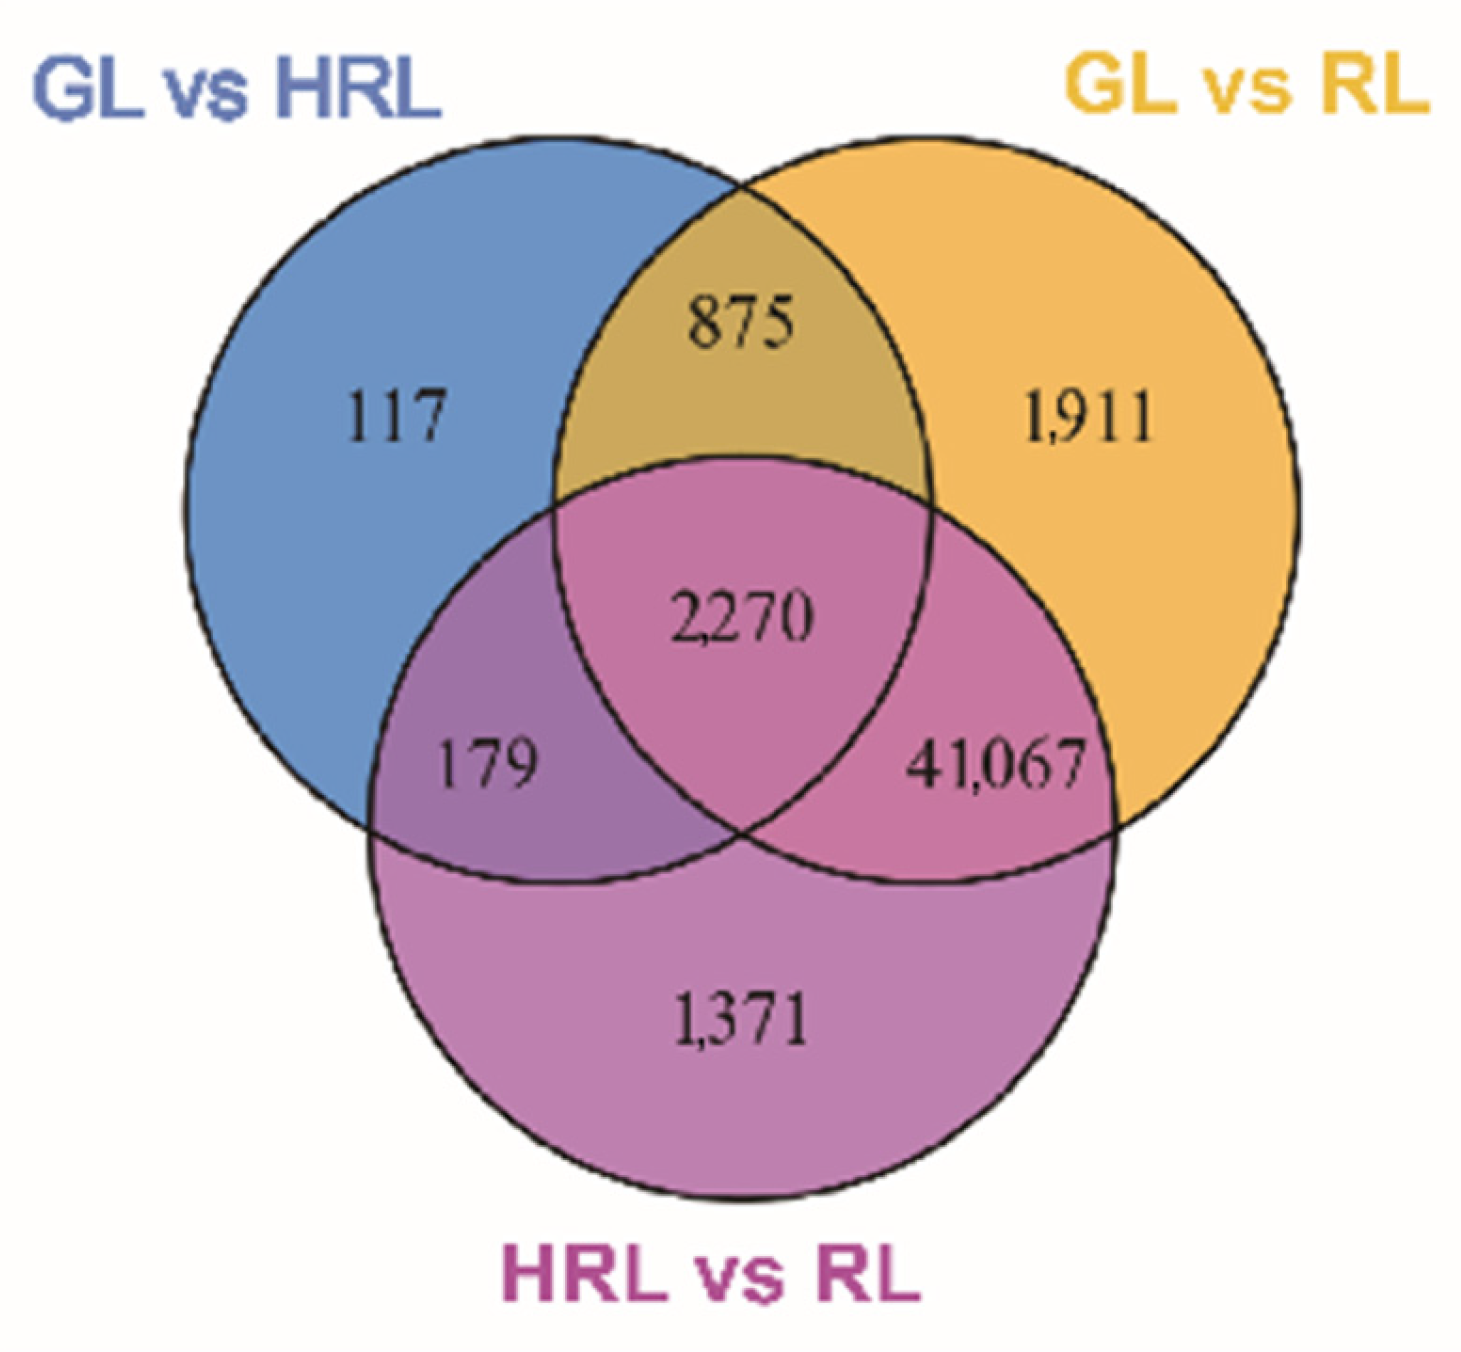
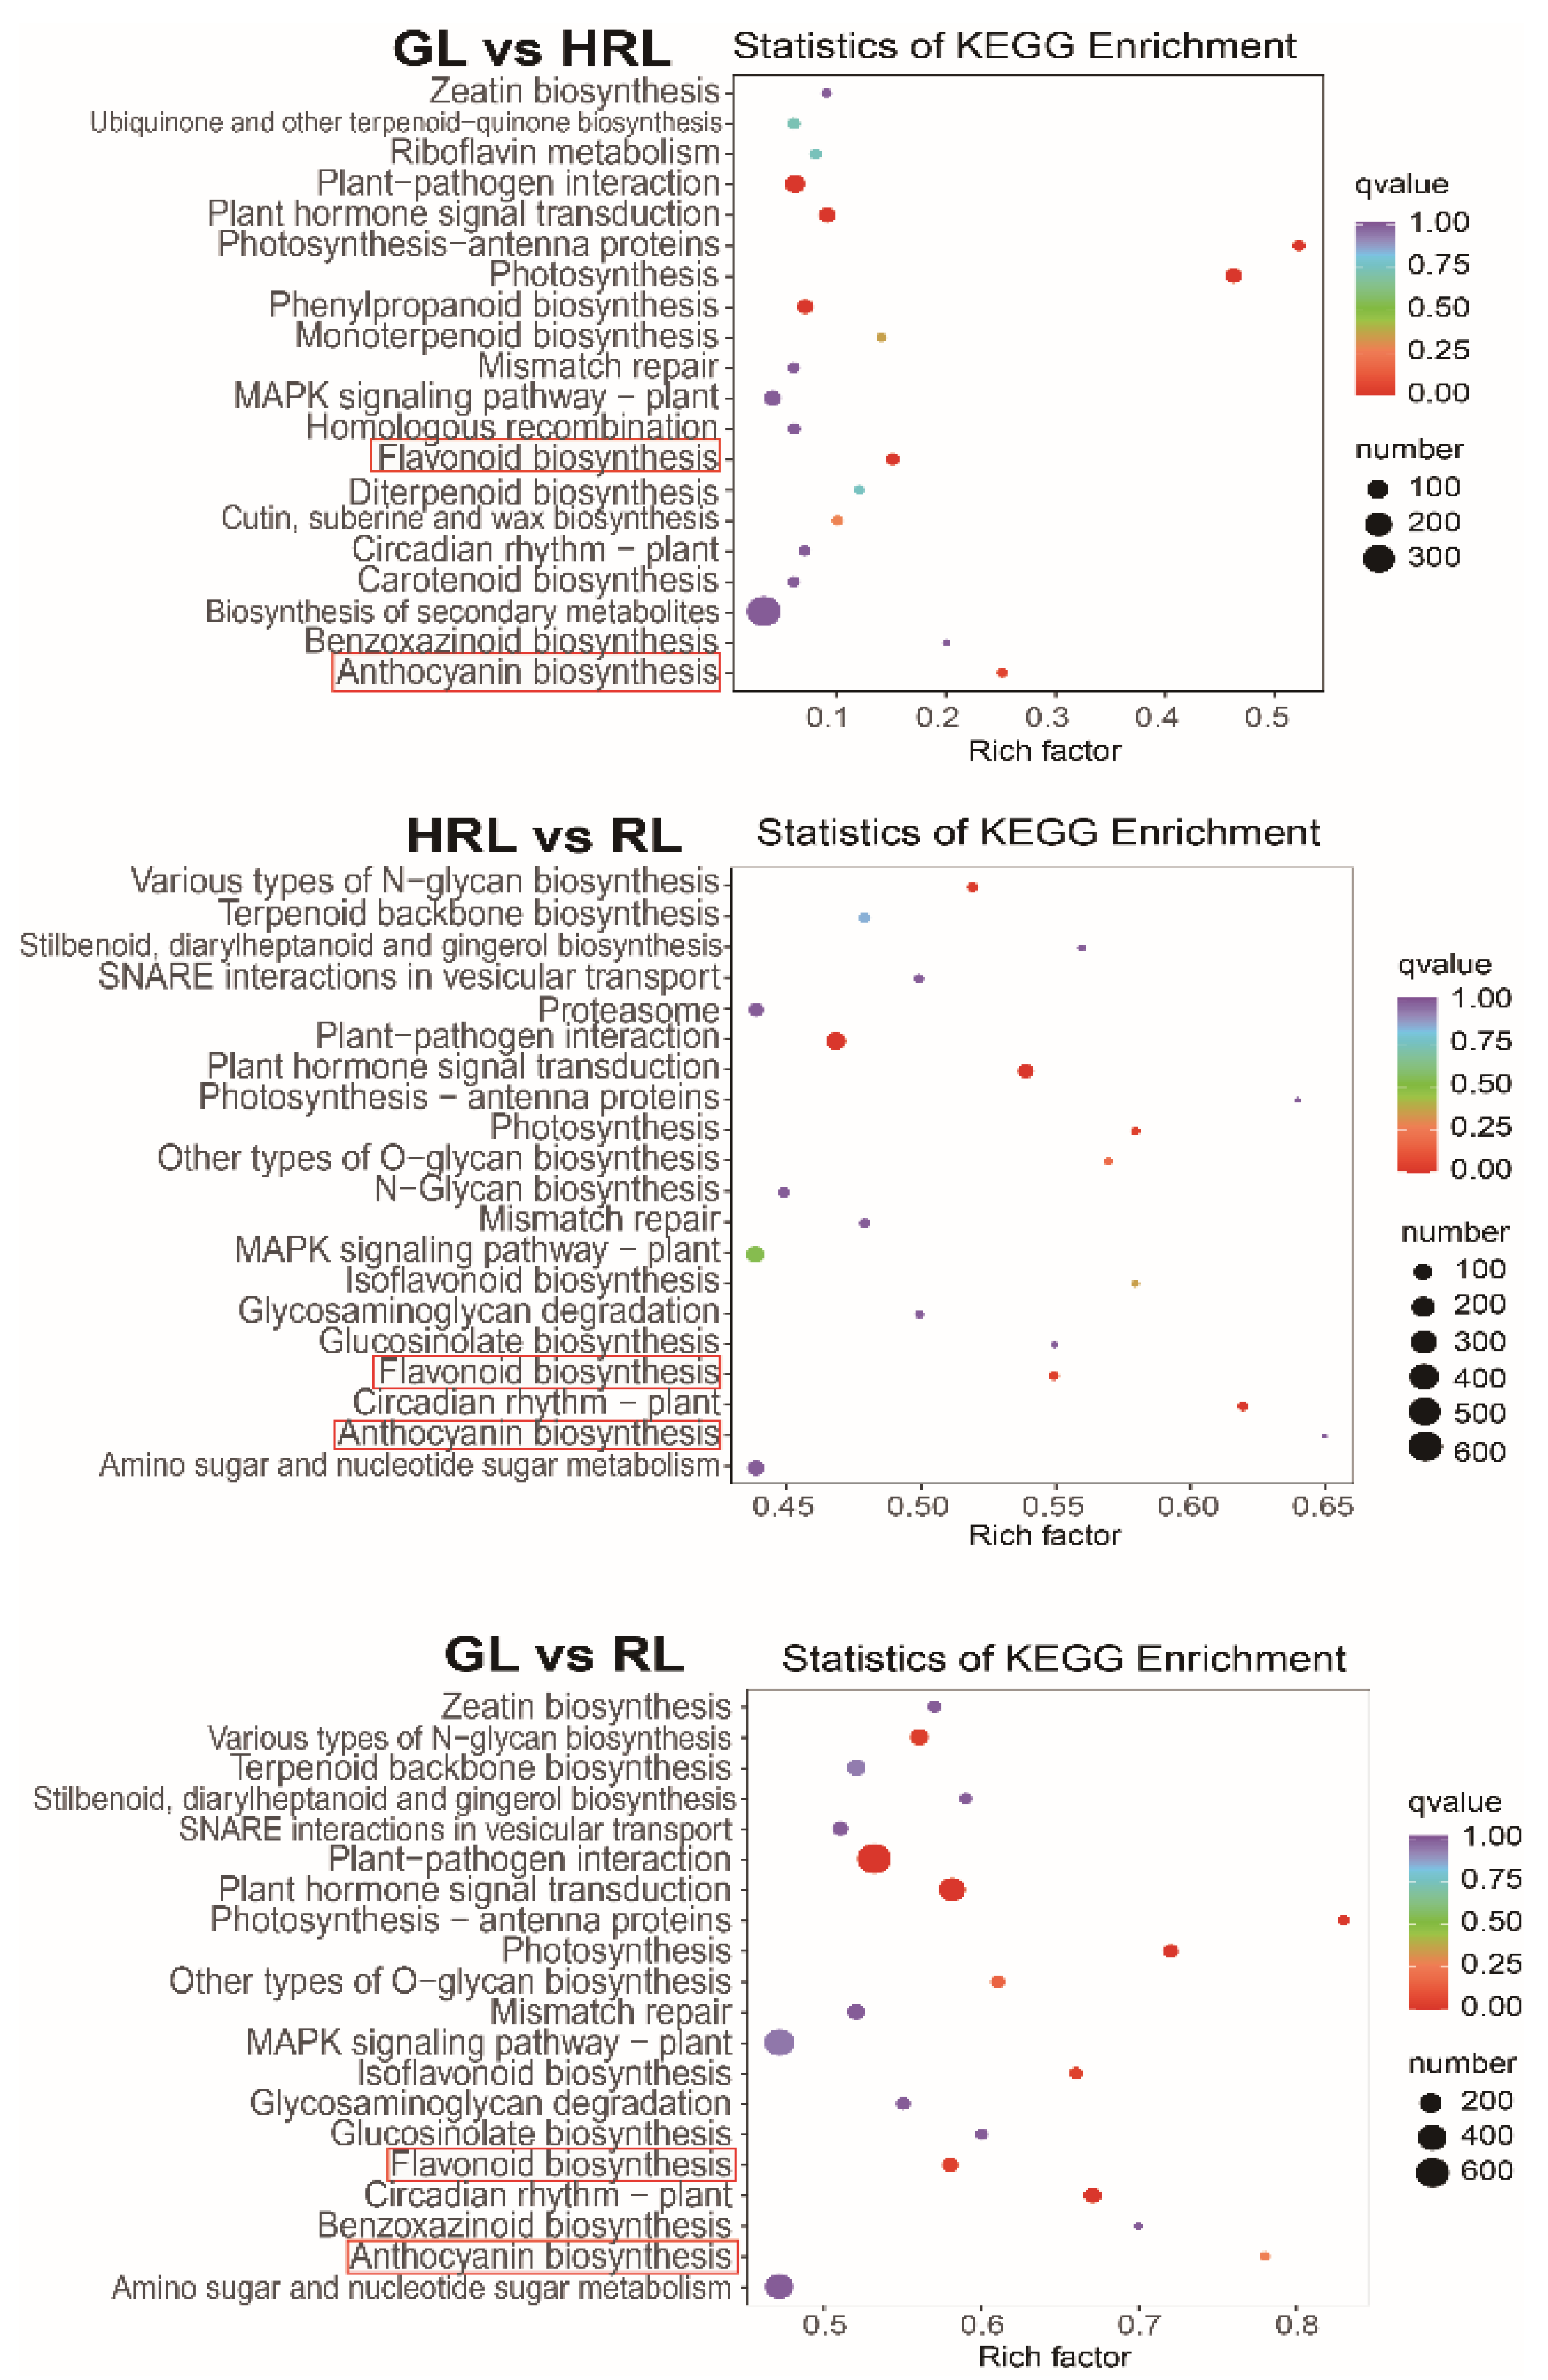
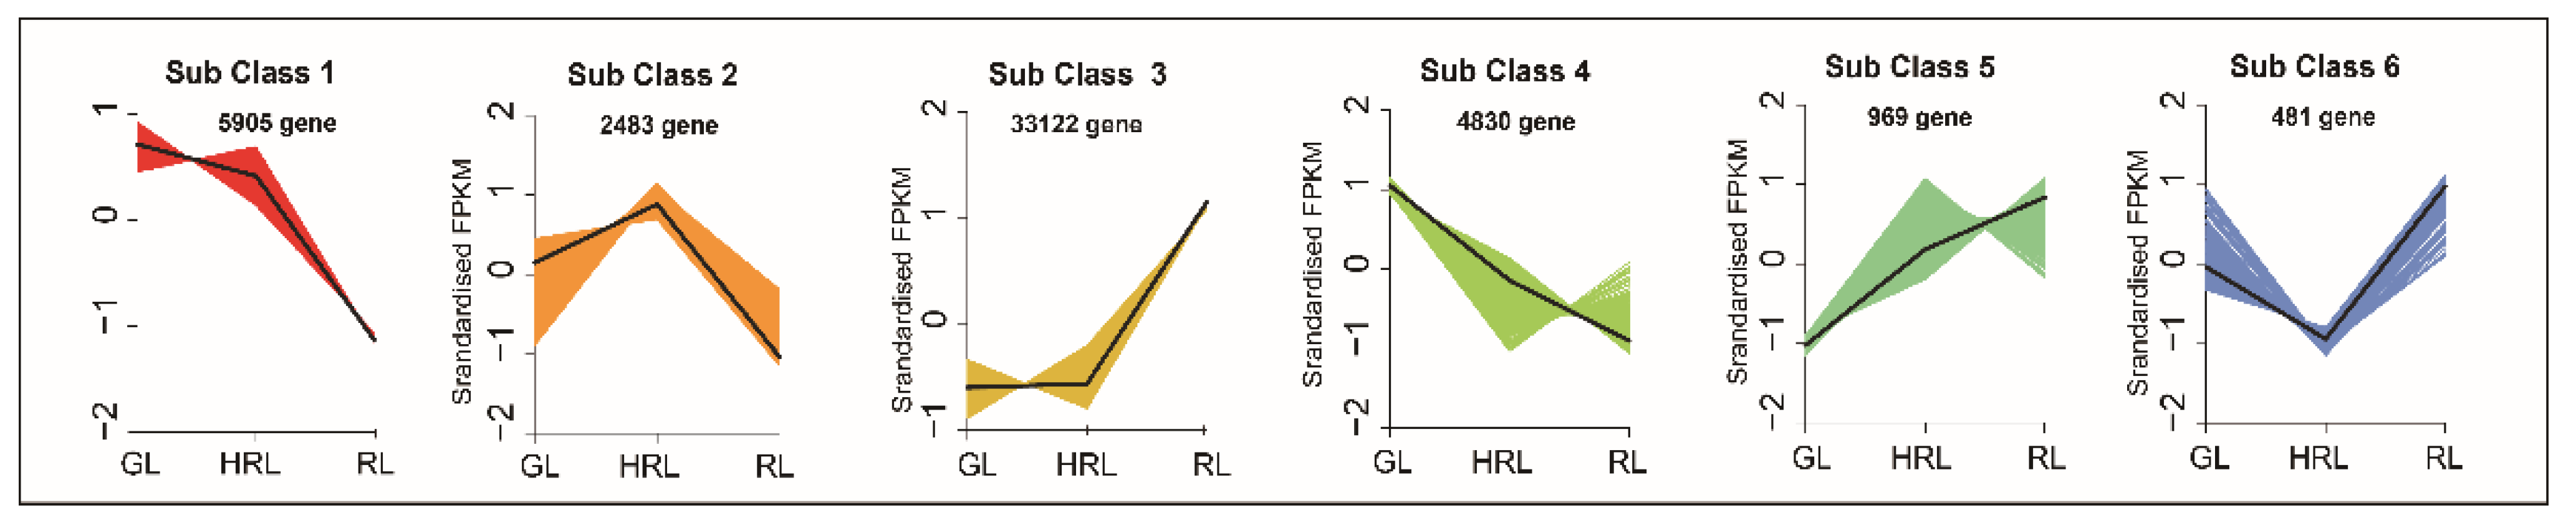
3.3. Transcriptomic Analysis of A. triflorum Leaves with Different Colors

To get a better understanding of the molecular mechanisms of anthocyanin biosynthesis in A. triflorum leaves, nine cDNA libraries (green, orange, and red leaves with three biological replicates per color stage) were constructed for transcriptomic analysis. A total of 393,824,706 raw reads and 379,582,208 clean reads were obtained, and the average Q20, Q30, and GC contents in the clean reads were 95.53, 89.67, and 35.56%, respectively (Supplementary Table S5). These high-quality reads guaranteed the preciseness of subsequent analysis. We assembled 155,647 unigenes, which were annotated with the GO, KEGG, KOG, and NR databases where 95,978 annotated unigenes were found in at least one database (Supplementary Table S6). Principal component analysis, based on the FPKM values, revealed that the green and orange leaf samples were obviously clustered together, while the red leaf samples were clearly distinguished from green and orange leaf samples (Supplementary Figure S3), indicating that there was a great difference in gene expression between the green/orange samples and the red sample.

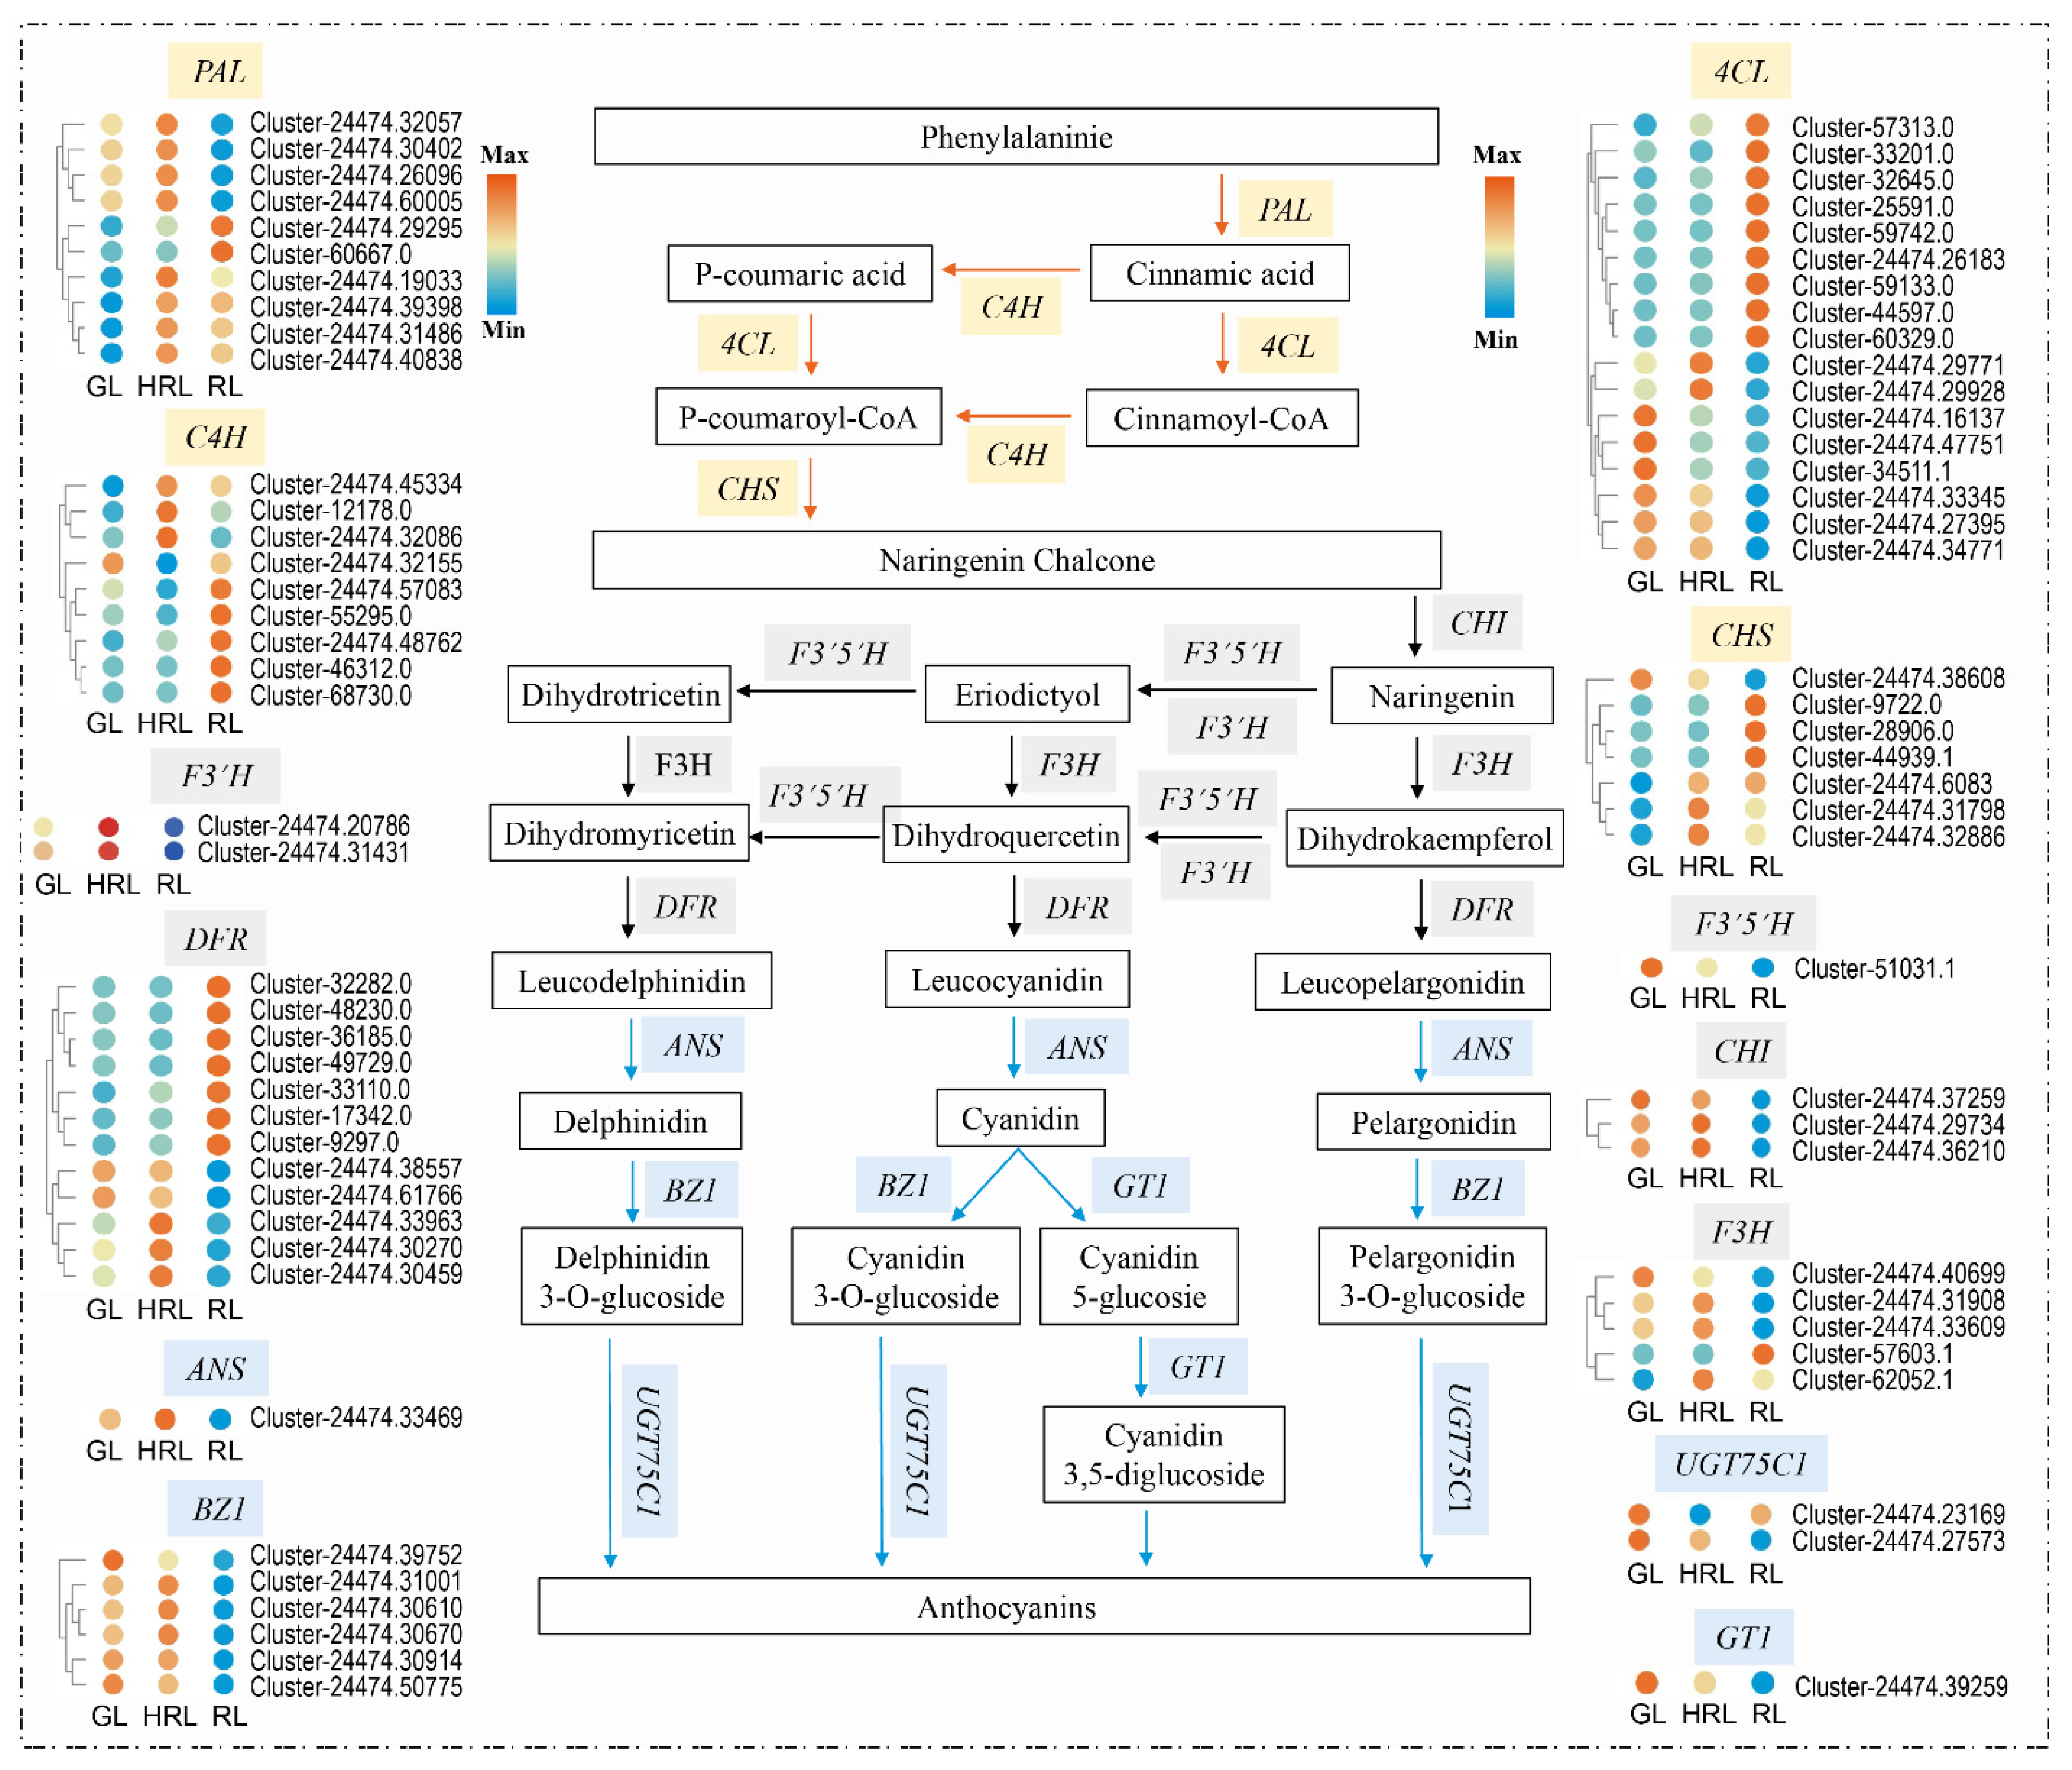
3.4. Differentially Expressed Genes in the Anthocyanin Biosynthesis Pathway

To identify differentially expressed genes (DEGs) in the A. triflorum leaves differing in color, pairwise transcriptomic comparisons were conducted using DESeq2. Genes with fold change ≥ 2 and FDR < 0.05 were defined as DEGs, and 47,790 DEGs were identified between sets of color groups (green versus orange leaves, orange versus red leaves, and green versus red leaves). There were 3441 DEGs (2042 down- and 1399 upregulated), 44,887 DEGs (11,568 down- and 33,319 upregulated), and 46,123 DEGs (11,730 down- and 34,393 upregulated) in green versus orange leaves, orange versus red leaves, and green versus red leaves, respectively (Supplementary Table S7). The volcano maps provided a visual view of DEGs distribution in comparison groups (Figure 4). The Venn diagram showed that there were 2270 identical DEGs in all three comparison groups (Figure 5), which might be related to changes in leaf color. GO enrichment analysis revealed three functional groups for the DEGs: molecular functions (MF), cellular components (CC), and biological processes (BP) (Figure S4). We analyzed the top 50 GO terms with the most significant enrichment in three comparison groups and identified two processes that may be directly involved in leaf color changes: including flavonoid metabolic process (GO: 0009812) and flavonoid biosynthetic process (GO: 0009813). Furthermore, KEGG pathway enrichment analysis from three comparison groups showed that these DEGs were mainly enriched in biosynthesis of secondary metabolites (ko01110), plant–pathogen interaction (ko04626), flavonoid biosynthesis (ko00941), and anthocyanin biosynthesis (ko00942) (Figure 6).
To obtain insights about the expression of DEGs under different color conditions, the k-means clustering analysis was used for categorizing the genes with the same or similar expression patterns (Figure 7). As a result, there were 969, 5909, 4822, 2487, 33,122, and 481 genes clustered in six sub-classes (sub-classes 1–6), respectively. Most notably, genes in sub-class 1 were significantly upregulated as the redness of leaves increased, displaying that they could be positively associated with the color formation and played a crucial role in flavonoid and anthocyanin biosynthesis pathways in A. triflorum. In contrast, the expression levels of sub-class 3 genes were gradually downregulated when the leaves became red, indicating might be a negative correlation between these genes and anthocyanin accumulation in A. triflorum. Crucially, some transcription factor (TF) genes were found in sub-class 1, mainly for C2H2, WRKY, AP2/ERF, NAC, bZIP, MYB, etc. (Supplementary Table S8).
The conjoint analysis between metabolome and transcriptome showed that a total of 38,619 DEGs were associated with 27 metabolites (r > 0.8). Most of the genes were collectively involved in biosynthesis of one or more anthocyanin metabolites, such as 32,957 genes in malvidin 3-O-rutinoside, 30,008 genes in dihydromyricetin, 28,520 genes in cyanidin 3-O-arabinoside, 28,349 genes in petunidin 3-O-glucoside, 18,916 genes in peonidin 3-O-glucoside, 17,979 genes in pelargonidin 3-O-glucoside, 13,533 genes in delphinidin 3-O-glucoside, 8249 genes in cyanidin 3-O-(6-O-malonyl-beta-D-glucoside), 7707 genes in cyanidin 3,5-O-diglucoside, 7611 genes in peonidin 3-O-galactoside, and 7332 genes in cyanidin 3-O-glucoside biosynthesis (Supplementary Table S9).

3.5. Candidate Genes Related with Anthocyanin Accumulation

KEGG enrichment analysis showed 75 DEGs involved in phenylpropanoid, flavonoid, and anthocyanidin biosynthesis pathways in A. triflorum (Figure 8, Supplementary Table S10). Indeed, expression levels of some key genes showed significant changes, such as PAL (6 genes), C4H (7 genes), 4CL (9 genes), CHS (6 genes), F3H (2 genes), and DFR (7 genes), which exhibited higher transcript abundances in the orange and red leaves than green leaves. The patterns of expression of these genes were related with high accumulation of anthocyanin in red and orange leaves, suggesting that these genes may regulate changes in leaf color from green to red in A. triflorum.
In addition, we also found that one F3′5′H gene (Cluster-51031.1), one CHI gene (Cluster-24474.37259), two BZ1 genes (Cluster-24474.39752 and Cluster-24474.50775), and one GT1 gene (Cluster-24474.39259) were clearly downregulated when the leaf turned red. On the contrary, one ANS gene (Cluster-24474.33469), two CHI genes (Cluster-24474.29734 and Cluster-24474.36210), two F3′H genes (Cluster-24474.20786 and Cluster-24474.31431), and three BZ1 genes (Cluster-24474.30610, Cluster-24474.30670, and Cluster-24474.31001) were highly expressed in orange compared to red leaves.

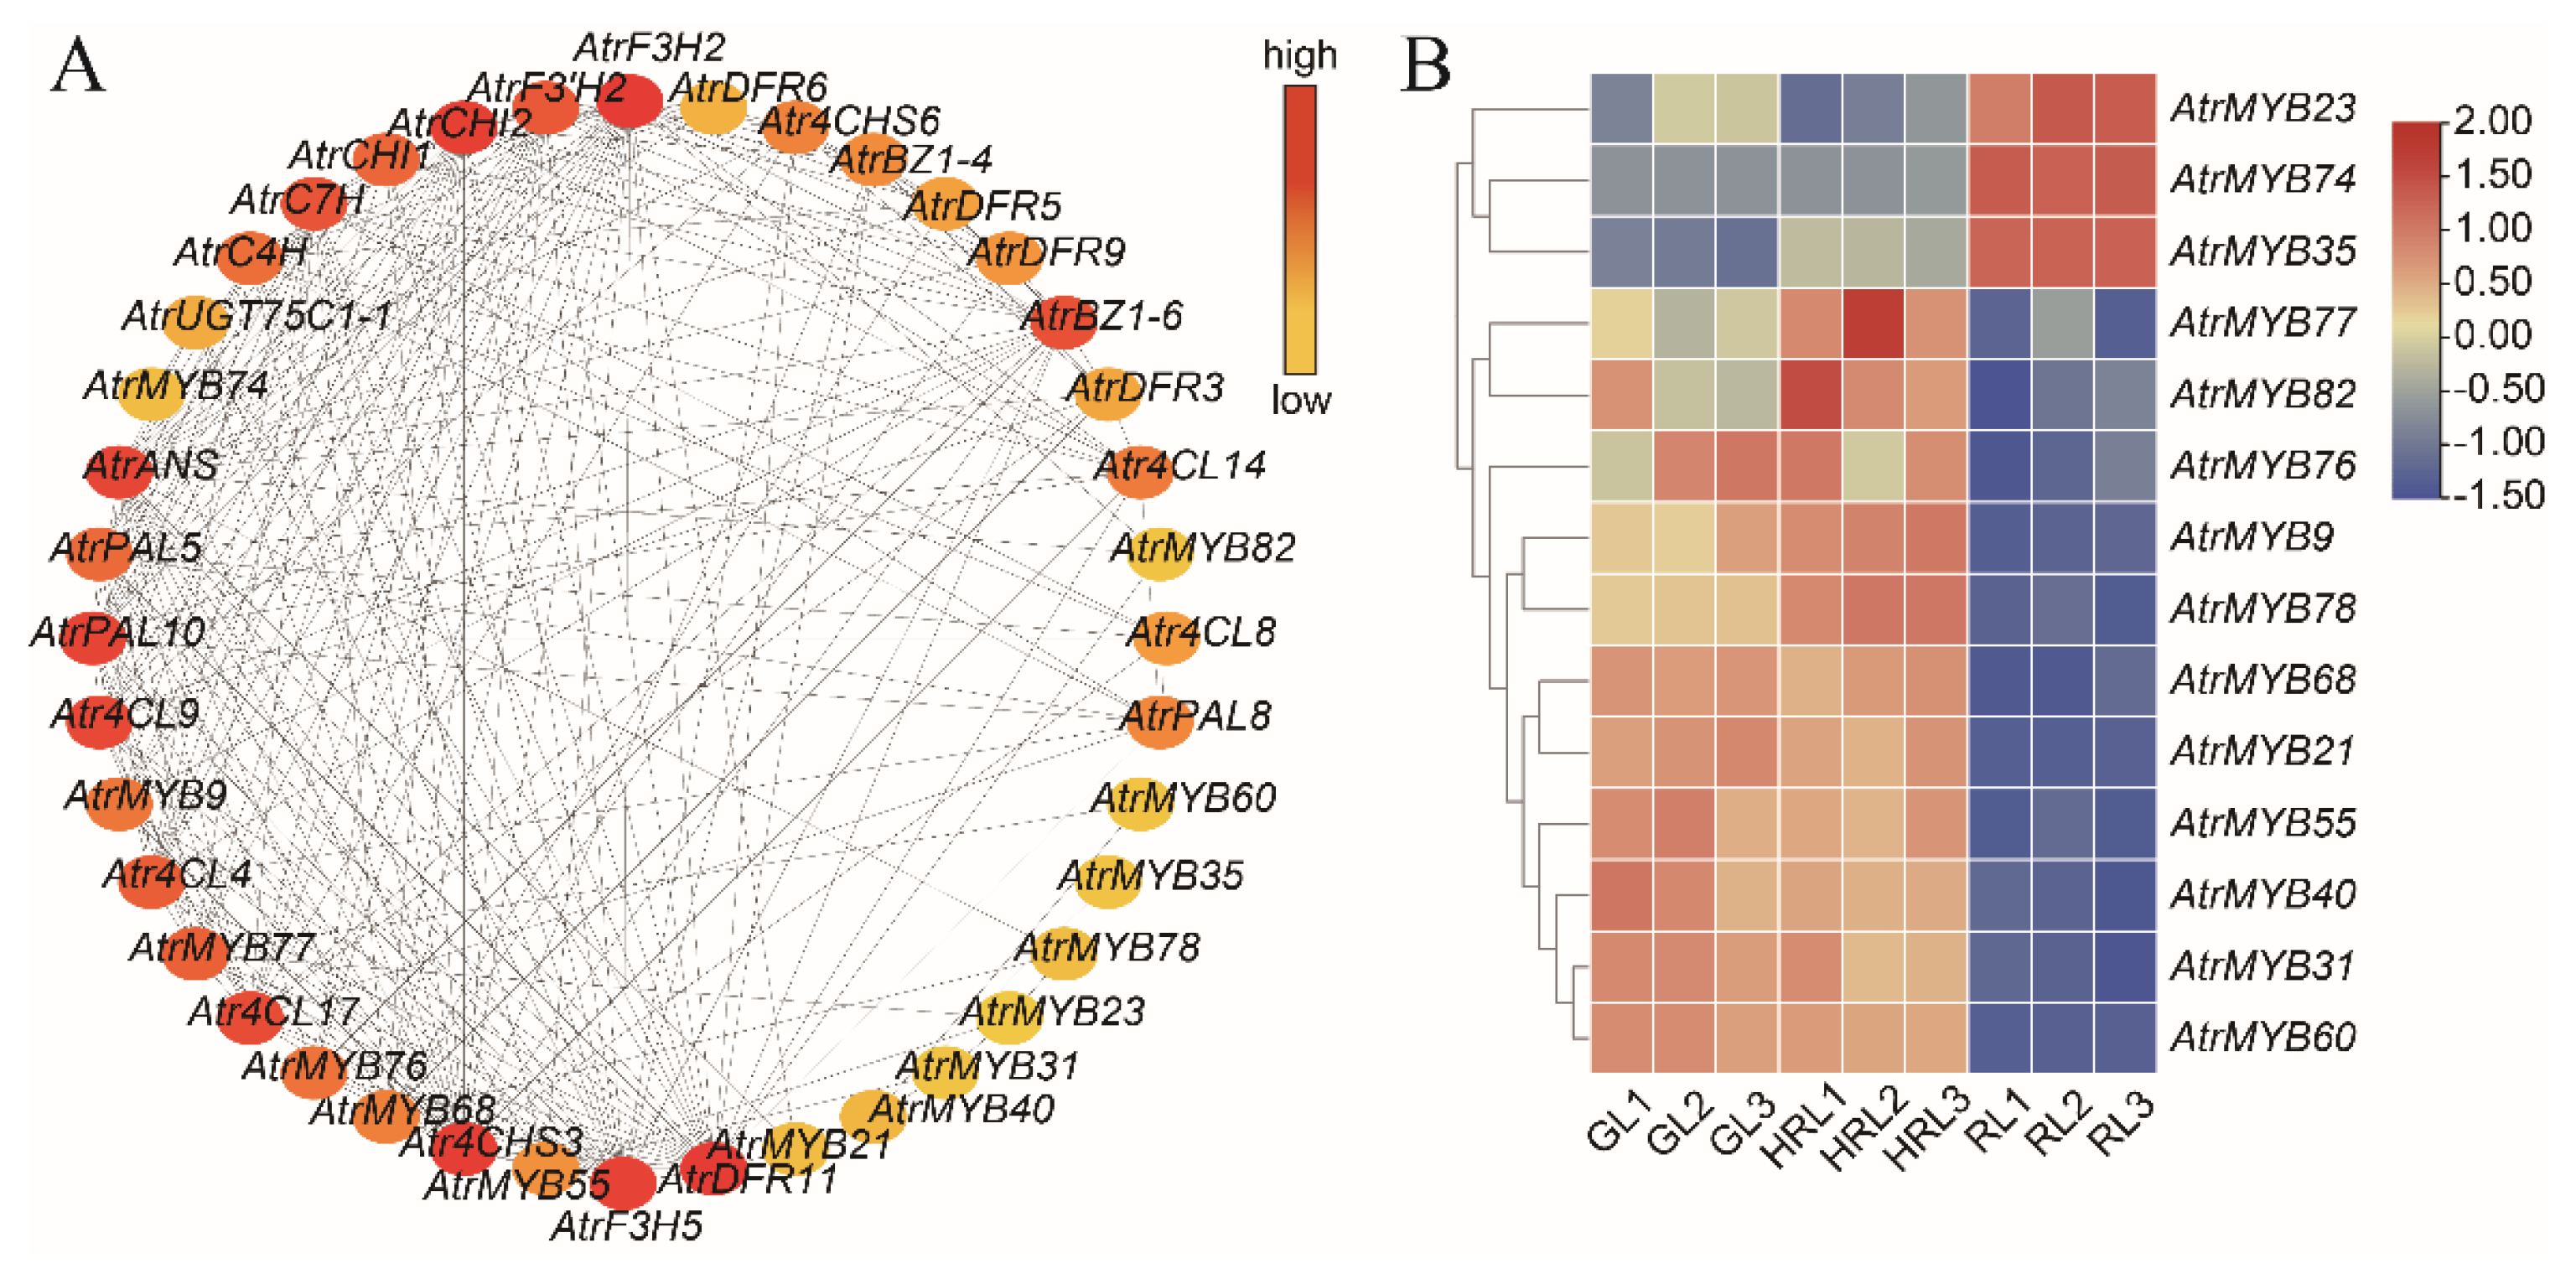
3.6. Analysis of Transcription Factors

Transcription factors also played a key role in the anthocyanin accumulation, some of which had been proved to regulate structural genes of flavonoid biosynthesis, such as MYB, bHLH, and WD40 [28]. Comparison of green versus orange leaves showed a total of 160 transcription factor genes (78 up- and 82 downregulated), which were coded as C2H2, NAC, WRKY, bZIP, and MYB. Among them, 7 MYB genes (6 up- and 1 downregulated) and 5 bHLH genes (5 downregulated) were differentially expressed. When comparing green versus red leaves, 31 MYB and 62 bHLH genes were significantly upregulated, whereas 24 MYB genes and 30 bHLH genes were significantly downregulated. In total, 13 MYB and 18 bHLH genes (log2 fold change > 4) were strikingly upregulated in red leaves, which might regulate expression of anthocyanin-related genes (Supplementary Table S11). Furthermore, there were 1463 (795 up- and 668 downregulated) TFs that were differentially expressed when comparing orange with red leaves, with 58 bHLH genes (28 upregulated) and 33 MYB genes of which 20 genes were upregulated (Supplementary Table S12).
Given the key regulatory role that MYB plays in anthocyanin synthesis, we constructed a PPI network of differentially expressed AtrMYBs and structural genes related to anthocyanin synthesis genes in the STRING database based on homologous proteins in Arabidopsis (Figure 9). The results showed that many differentially expressed AtrMYBs could directly or indirectly regulate some structural genes, including ANS, CHI, 4CL, and DFR. Furthermore, the top 40 regulatory nodes were found using Cytoscape software, which included 14 AtrMYB genes (Figure 10A). Compared to other AtrMYBs, the 14 AtrMYBs displayed stronger interactions with the structural genes involved in anthocyanin synthesis. Particularly, AtrMYB9 showed a consistently high interaction with nine structural genes, including CHS, ANS, DFR, and F3H. Among them, AtrMYB23, AtrMYB35, and AtrMYB74 showed higher expression levels in red leaves, which may regulate structural genes involved in anthocyanin biosynthesis positively (Figure 10B).
To further check the reliability and accuracy of transcriptome data, nine genes in the flavonoid biosynthetic pathway (Cluster-24474.32057, Cluster-24474.29295, Cluster-24474.32086, Cluster-24474.29771, Cluster-24474.34771, Cluster-24474.31798, Cluster-24474.31001, Cluster-24474.39259, and Cluster-24474.27573) were selected for qRT-PCR analysis. Most of these genes displayed similar patterns of expression between transcriptomic data sets and results from qRT-PCR (Figure 11).

4. Discussion

4.1. Anthocyanin Contents of Different Colored A. triflorum Leaves

Leaf color is a trait that influences the ornamental value of urban trees, and anthocyanin accumulation plays a critical role in leaf color change [29,30]. Until now, several genes and enzymes that played a key role in color development of plant leaves and anthocyanin accumulation have been described in Aceraceae species, including A. rubrum [31,32], A. palmatum [33,34], and A. pseudosieboldianum [35]. However, pigment composition and the structural genes of the metabolic pathway varied across species. In addition, the molecular mechanism of anthocyanin biosynthesis in A. triflorum was still obscure.
In our present research, UPLC-MS/MS was used to explore the metabolites change in different colors of A. triflorum leaves. Consequently, we identified 27 metabolites of anthocyanin, of which 14 metabolites showed significant variations among different colored leaves (Figure 2 and Figure 3). In general, red hues are frequently attributed to cyanidins, pelargonidins mainly show orange/red, whereas purple/blue hues are typically ascribed to delphinidins. In this study, five cyanidins (cyanidin 3,5-O-diglucoside, cyanidin 3-O-arabinoside, cyanidin 3-O-glucoside, cyanidin 3-O-rutinoside, and cyanidin 3-O-(6-O-malonyl-beta-D-glucoside)) and pelargonidin (pelargonidin 3-O-glucoside) (Figure 3) were significantly increased when the leaves turned red. Remarkably, three anthocyanin compounds (cyanidin 3-O-arabinoside, pelargonidin 3-O-glucoside, and peonidin 3-O-glucoside) were significantly increased in red and orange leaves, suggesting that these metabolites may be involved in the final color of A. triflorum leaves (Figure 7). Similarly, a previous report suggested that cyanidin 3-O-rutinoside, peonidin 3-O-glucoside, cyanidin 3-O-glucoside, and pelargonidin 3-O-glucoside were accountable for the deep red color of Camellia japonica petals [36]. Seven anthocyanin compounds including cyanidin-3-O-glucoside, pelargonidin 3-O-glucoside, and cyanidin 3-O-rutinoside were identified in deep pink colored petals of roses, while these metabolites were not detected in light pink colored petals [37]. In addition, cyanidin 3,5-O-diglucoside was reported as the main compound involved in the red leaf phenotype [35]. At the same time, cyanidin 3-O-arabinoside, peonidin 3-O-glucoside, and pelargonidin 3-O-glucoside, as predominant metabolites in anthocyanin biosynthesis pathway of A. triflorum, were regulated by numerous DEGs; each of them were associated with 28,520, 18,916, and 17,979 DEGs, respectively (r > 0.8) (Supplementary Table S9). This result provided a new insight into the difference between green and red coloring in A. triflorum leaves.

4.2. Key Genes Related to Anthocyanin Synthesis in A. triflorum Leaves

Existing studies confirmed that the pathway for anthocyanin biosynthetic is part and parcel of the phenylpropanoid biosynthetic pathway, and its biosynthesis was strongly controlled by structural genes, such as PAL, 4CL, CHI, CHS, DFR, ANS, F3H, BZ1, and UGFT [38]. In our studies, the structural genes that regulated the phenylpropanoid biosynthesis pathways (43 genes), flavonoid biosynthesis pathways (22 genes), and anthocyanidin biosynthetic pathways (10 genes) were significantly expressed when the color of the leaves was changed (Figure 5). Among them, six PAL genes, nine 4CL genes, and six CHS genes were substantially expressed in red-colored leaves of A. triflorum, suggesting that these early biosynthetic genes lead to the production of flavonoids, as observed in other plant species with red leaves or fruits [39,40,41,42]. In addition, some downregulated PAL, 4CL, and CHS genes were also found in red leaves, suggesting that the color change in A. triflorum leaves was controlled by multiple single genes.
Compared to green leaves, one F3H gene (Cluster-57603.1) was significantly upregulated in red and orange leaves. The enzyme encoded by F3H catalyzes an early step in the flavonoid biosynthesis pathway and displays a positive correlation with catechins and anthocyanidins synthesis [43]. In some fruit skins, the expression levels of F3Hs are positively correlated with anthocyanin accumulation [44,45]. Seven DFR genes were upregulated in red-colored leaves; three DFR genes and one ANS gene were upregulated in orange-colored leaves. ANS and DFR genes have been shown to play a key role in catalyzing the production of colored anthocyanidins from colorless leucoanthocyanidins [46,47]. Similarly, in transgenic tobacco lines, overexpression of HvDFR has been shown to enhance the anthocyanins accumulation [48]. The gene BZ1 is an anthocyanidin 3-O-glucosyltransferase that modifies flower color as well as increases the solubility and stability of hydrophobic flavonoids [49,50]. The expression level of three BZ1 genes (Cluster-24474.30610, Cluster-24474.30670, and Cluster-24474.31001) was the highest in orange leaf, and its downstream metabolites (cyanidin 3-O-glucoside and pelargonidin 3-O-glucoside) were correspondingly significantly upregulated. This suggests that the two BZ1 genes could regulate anthocyanin synthesis and stabilization of leaf color when the leaf color gradually turns orange. However, it should be noted that most of ANS, BZ1, GT1, and UGT75C1 (anthocyanidin 3-O-glucoside 5-O-glucosyltransferase) were highly expressed in orange leaves, but downregulated in the red leaves. The leaf color change is very complex and primarily determined by content, composition, and distribution of intracellular pigments (anthocyanin, chlorophylls, and carotenoids) [14,51]. Carotenoids are responsible for colors that vary from yellow to red [52,53]. We speculated that some other pigments, such as carotenoids, may contribute to the transformation from orange to red when anthocyanins are accumulated abundantly. As the leaves were sampled in late autumn, the cold temperature may result in slower metabolism in red leaves. Moreover, the downregulated UGT75C1 and GT1 genes were significant in anthocyanin biosynthesis, resulting in the formation of more anthocyanin derivatives.

4.3. Transcription Factors Associated with Anthocyanin Biosynthesis

Transcription factors (TFs) play a crucial role in regulating the anthocyanin biosynthesis. Previous studies have elucidated MYB, bHLH, and WD40 to be involved in the anthocyanin biosynthesis pathway that contributes to accumulation of anthocyanin [54,55,56]. Most crucially, the MBW complex (MYB-bHLH-WD40) regulates the downstream accumulation of anthocyanin positively or negatively [26,57]. In our case, 160 (78 upregulated and 82 downregulated), 1480 (840 upregulated and 640 downregulated), and 1463 (795 upregulated and 668 downregulated) TFs that were differentially expressed were identified in green versus orange leaves, green versus red leaves, and orange and red leaves, respectively (Supplementary Table S12). Our study showed that highly expressed MYB genes, such as Cluster-24474.31177, Cluster-24474.28911, Cluster-24474.26570, Cluster-24474.35504, Cluster-24474.30825, and Cluster-24474.45773, were concentrated mainly in orange and red leaves, which, in turn, may regulate key structural genes involved in anthocyanin biosynthesis positively. Similarly, the overexpression of PsMYB58 (an anthocyanin regulatory R2R3-MYB gene in tree peony flowers) in tobacco enhanced anthocyanin accumulation in various organs [58]. In contrast, we also found some MYBs (Cluster-24474.33458, Cluster-24474.28542, Cluster-24474.31177, Cluster-24474.34995, Cluster-24474.35337, and Cluster-24474.31121) that were downregulated dramatically in red leaves. This suggests that these genes may play a negative role in anthocyanin biosynthesis, as reported recently [59] in which MaMYB4 was a repressor of anthocyanin biosynthesis and anthocyanin synthesis structural genes in banana.
In addition, 14 AtrMYBs, including AtrMYB68, AtrMYB74, and AtrMYB35 strongly interacted with genes involved in anthocyanin biosynthesis; and hence could be regarded as hub regulators. Furthermore, some bHLHs (Cluster-24474.33920, Cluster-24474.56470, Cluster-24474.19324, Cluster-24474.32567, Cluster-52890.0, and Cluster-24474.57016) displayed an increasing expression level during leaf color change, indicating that they may cooperate with MYB genes in anthocyanin synthesis. The co-functioning of multiple TFs in anthocyanin biosynthesis has been reported in various plants [60,61,62]. Moreover, some other TFs such as NAC, WRKY, and bZIP were differentially expressed during changes in leaf color, indicating that they may synergistically regulate gene expression in anthocyanin biosynthesis. In light of the aforementioned results, we speculate that the changes in the expression level of these TFs, especially MYB, result in leaf color change, although further verification is warranted.

5. Conclusions

A. triflorum is a visually appealing ornamental tree in landscapes, in which the leaves turn from green to beautifully red in autumn. Although anthocyanins are the main pigments that determine the formation of leaf color, the underlying molecular mechanisms of color change in A. triflorum leaves are still unclear. In this study, we conducted metabolome and transcriptome analyses in three different colors of A. triflorum leaves. We detected 27 anthocyanin metabolites, of which cyanidin-3-O-arabinoside, pelargonidin-3-O-glucoside and peonidin-3-O-gluside were the predominant metabolites in the biosynthesis of the anthocyanins, which accumulated in large quantities when A. triflorum leaves turned red. Furthermore, 47,790 differentially expressed genes were identified in different colored leaves of A. triflorum, of which 3441, 44,887, and 46,123 DEGs were obtained in green versus orange leaves, orange versus red leaves, and green versus red leaves, respectively. Additionally, we screened out some key structural genes (DFR, CHS, F3H) and some key TFs (MYBs and bHLHs) that were differentially expressed in different colored leaves, which in turn may participate in anthocyanin accumulation in A. triflorum leaves. The findings provide valuable insights into genetic engineering or improvement works to enhance the ornamental qualities of A. triflorum by enhancing the red coloration of the leaves.

Supplementary Materials

The following supporting information can be downloaded at: https://www.mdpi.com/article/10.3390/horticulturae8070635/s1, Figure S1: The HPLC ions chromatogram. The x-axis represents the retention time of detection and the y-axis represents the ions intensity. Figure S2: Histogram of anthocyanidin levels in Acer triflorum. The x-axis represents the anthocyanin levels (μg/g) and the y-axis represents the anthocyanin composition obtained by high-performance liquid chromatography (HPLC). Error bars show standard error (SE) of the mean. Figure S3: Hierarchical cluster analysis of identified metabolites in green (GL), orange (HRL), and red (RL) leaves. Cluster analysis was generated by the k-means methods. Color scale from green to red in the heatmap represents the normalized metabolite contents using Row Z-score. Figure S4: GO enrichment analysis of the DEGs in each comparison. The red rectangles highlight the flavonoid biosynthetic process and flavonoid metabolic process. Table S1: Primer sequences of genes used for quantitative RT-PCR verification; Table S2: Gene names and IDs in protein–protein interaction (PPI) networks; Table S3: The type and content of metabolites in differently colored leaves; Table S4: Differential metabolites in three comparison groups; Table S5: Overview of the transcriptome sequencing data; Table S6: Number of unigenes annotated in protein databases; Table S7: Comparison of differently expressed genes between green versus red leaves in three compared groups (GL_vs_RL), between green versus orange leaves (GL_vs_HRL), and between orange and red leaves (HRL-ver_RL); Table S8: Transcription factors in sub-class 1 by k-means clustering analysis; Table S9: Correlation analysis of DEGs and metabolites; Table S10: DEGs in the phenylpropanoid, flavonoid, and anthocyanidin biosynthesis pathways; Table S11: Differentially expressed TFs in three compared groups (GL vs. HRL, GL vs. RL and HRL vs. RL); Table S12: Statistics of differentially expressed TFs number in GL vs. HRL, GL vs. RL and HRL vs. RL.

Author Contributions

X.H. and X.Z. conceived and designed the experiments. A.S., X.P. and S.Z. conducted the experiments and wrote the manuscript. Z.H. and Y.X. analyzed the data and made the figures. M.T. and G.Q. revised the manuscript critically. All authors have read and agreed to the published version of the manuscript.

Funding

This work was supported by the Heilongjiang Province Applied Technology Research and Development Plan Project (No. GA20B402), Fundamental Research Funds for the Central Universities (Northeast Forestry University) (No. 2572020DR01) and Scientific Research Start-up Funds of Jilin Agricultural University (No. 2021002).

Institutional Review Board Statement

Not applicable.

Informed Consent Statement

Not applicable.

Data Availability Statement

Transcriptome sequencing data will be uploaded soon during the review process before publication of the article.

Acknowledgments

We express our gratitude to members of the State Key Laboratory of Tree Genetics and Breeding for their assistance during laboratory work and for fruitful discussions.

Conflicts of Interest

The authors declare no potential conflict of interest.

References

  1. Flora of China Editorial Committee. Flora of China; Science Press: Beijing, China; Missouri Botanical Garden Press: St. Louis, MO, USA, 2008; p. 94. Available online: http://www.iplant.cn/info/Acer%20triflorum?t=foc (accessed on 2 April 2022).
  2. Wang, H.Y.; Wei, B.Y.; Xiao, H.X. Development of 15 microsatellite markers in Acer triflorum (Aceraceae) and cross-amplification in congeneric species. Appl. Plant Sci. 2018, 6, e01166. [Google Scholar] [CrossRef] [PubMed] [Green Version]
  3. Xia, X.H.; Yu, X.Y.; Fu, Q.D.; Zheng, Y.Q.; Zhang, C.H. Complete chloroplast genome sequence of the three-flowered maple, Acer triflorum (Sapindaceae). Mitochondrial DNA Part B 2020, 5, 1859–1860. [Google Scholar] [CrossRef] [Green Version]
  4. Qiao, Q.; Hu, K.R.; Wu, C.; Wang, J.W.; Liu, Q.Z.; Tao, J.H.; Liu, Y.; Lu, Y.Z.; Feng, Z. Acer triflorum as a new nervonic acid-containing oilseed resource for the future: Fruit-and-seed weight, oil content and fatty acid composition. Ind. Crops Prod. 2022, 179, 114684. [Google Scholar] [CrossRef]
  5. Su, Y.J.; Xue, W.X.; Jia, B.Y.; Chu, J.T.; Wang, L.B.; Feng, Z.; Yu, X.Y. Acer triflorum: A maple species that serves as a resource for nervonic acid and that has an ultralow erucic acid content. Food Sci. Technol. 2021, 41, 633–636. [Google Scholar] [CrossRef]
  6. Shi, Y.; Liu, W.H. Cultivation and application of seedlings of color-leaf tree species Acer triflorum. Spec. Econ. Anim. Plants 2017, 20, 31–32. [Google Scholar]
  7. Lin, S.J.; Xu, D.; Cui, Z.; Yang, H.X.; Xie, P.; Zhang, Z.H.; Gou, T.B.; Yang, C.Y.; Zhao, S.S.; Bao, G.D. Determination of biological activity of methanol extract from Acer triflorum seeds. Chin. Agric. Sci. Bull. 2014, 30, 19–22. [Google Scholar]
  8. Williams, C.A.; Grayer, R.J. Anthocyanins and other flavonoids. Nat. Prod. Rep. 2004, 21, 539–573. [Google Scholar] [CrossRef]
  9. Zhang, Q.; Zhai, J.; Shao, L.; Lin, W.; Peng, C. Accumulation of Anthocyanins: An Adaptation Strategy of Mikania micrantha to Low Temperature in Winter. Front. Plant Sci. 2019, 10, 1049. [Google Scholar] [CrossRef] [Green Version]
  10. Song, X.H.; Duan, X.J.; Chang, X.C.; Xian, L.H.; Yang, Q.S.; Liu, Y. Molecular and metabolic insights into anthocyanin biosynthesis during leaf coloration in autumn. Environ. Exp. Bot. 2021, 190, 101584. [Google Scholar] [CrossRef]
  11. Zhang, S.K.; Zhan, W.; Sun, A.R.; Xie, Y.; Han, Z.M.; Qu, X.B.; Wang, J.Y.; Zhang, L.F.; Tian, M.S.; Pang, X.H.; et al. Combined transcriptome and metabolome integrated analysis of Acer mandshuricum to reveal candidate genes involved in anthocyanin accumulation. Sci. Rep. 2021, 11, 23148. [Google Scholar] [CrossRef]
  12. Delgado-Vargas, F.; Jim’enez, A.R.; Paredes-L’opez, O. Natural pigments: Carotenoids, anthocyanins, and betalains-characteristics, biosynthesis, processing, and stability. Crit. Rev. Food Sci. Nutr. 2000, 40, 173–289. [Google Scholar] [CrossRef] [PubMed]
  13. Tanaka, Y.; Ohmiya, A. Seeing is believing: Engineering anthocyanin and carotenoid biosynthetic pathways. Curr. Opin. Biotechnol. 2008, 19, 190–197. [Google Scholar] [CrossRef] [PubMed]
  14. Xu, W.; Dubos, C.; Lepiniec, L. Transcriptional control of flavonoid biosynthesis by MYB-bHLH-WDR complexes. Trends Plant Sci. 2015, 20, 176–185. [Google Scholar] [CrossRef]
  15. Sun, C.; Deng, L.; Du, M.; Zhao, J.; Chen, Q.; Huang, T.; Jiang, H.; Li, C.B.; Li, C. A Transcriptional Network Promotes Anthocyanin Biosynthesis in Tomato Flesh. Mol. Plant 2020, 13, 42–58. [Google Scholar] [CrossRef] [PubMed]
  16. Wang, F.; Chen, S.; Liang, D.Y.; Qu, G.Z.; Chen, S.; Zhao, X.Y. Transcriptomic analyses of Pinus koraiensis under different cold stresses. BMC Genom. 2020, 21, 10. [Google Scholar] [CrossRef] [PubMed] [Green Version]
  17. Jiao, F.C.; Zhao, L.; Wu, X.F.; Song, Z.B.; Li, Y.P. Metabolome and transcriptome analyses of the molecular mechanisms of flower color mutation in tobacco. BMC Genom. 2020, 21, 611. [Google Scholar] [CrossRef]
  18. Ge, W.; Wang, X.X.; Li, J.Y.; Zhu, W.P.; Cui, J.T.; Zhang, K.Z. Regulatory mechanisms of leaf color change in Acer pictum subsp. mono. Genome 2019, 62, 793–805. [Google Scholar] [CrossRef] [PubMed]
  19. Chen, Z.; Lu, X.; Xuan, Y.; Tang, F.; Wang, J.; Shi, D.; Fu, S.; Ren, J. Transcriptome analysis based on a combination of sequencing platforms provides insights into leaf pigmentation in Acer rubrum. BMC Plant Biol. 2019, 19, 240. [Google Scholar] [CrossRef] [Green Version]
  20. Quattrocchio, F.; Wing, J.F.; Woude, K.; Mol, J.N.; Koes, R. Analysis of bHLH and MYB domain proteins: Species-specific regulatory differences are caused by divergent evolution of target anthocyanin genes. Plant J. 1998, 13, 475–488. [Google Scholar] [CrossRef]
  21. Su, Y.K.; Zhang, J.; Xu, Z.C.; Li, J.Y.; Wang, P.F.; Song, Z.Q.; Tian, G.Q.; Li, L.; Song, J.Y.; Wang, J.H. Integrative analysis of metabolome and transcriptome reveals the mechanism of color formation in white root (Salvia miltiorrhiza). Ind. Crops Prod. 2021, 170, 113784. [Google Scholar] [CrossRef]
  22. Davidson, N.M.; Oshlack, A. Corset: Enabling differential gene expression analysis for de novo assembled transcriptomes. Genome Biol. 2014, 15, 410. [Google Scholar] [PubMed] [Green Version]
  23. Varet, H.; Brillet-Guéguen, L.; Coppée, J.Y.; Dillies, M.A. SARTools: A DESeq2- and EdgeR-Based R pipeline for comprehensive differential analysis of RNA-Seq data. PLoS ONE 2016, 11, e0157022. [Google Scholar] [CrossRef] [PubMed] [Green Version]
  24. Love, M.I.; Huber, W.; Anders, S. Moderated estimation of fold change and dispersion for RNA-seq data with DESeq2. Genome Biol. 2014, 15, 550. [Google Scholar] [CrossRef] [PubMed] [Green Version]
  25. Young, M.D.; Wakefield, M.J.; Smyth, G.K.; Oshlack, A. Gene ontology analysis for RNA-seq: Accounting for selection bias. Genome Biol. 2010, 11, 14. [Google Scholar] [CrossRef] [Green Version]
  26. Chen, X.; Mao, X.; Huang, J.; Yang, D.; Wu, J.; Dong, S.; Lei, K.; Ge, G.; Li, C.Y.; Wei, L. KOBAS 2.0: A web server for annotation and identification of enriched pathways and diseases. Nucleic Acids Res. 2011, 39, 316–322. [Google Scholar]
  27. Chen, C.J.; Chen, H.; Zhang, Y.; Thomas, H.R.; Frank, M.H.; He, Y.H.; Xia, R. TBtools: An Integrative Toolkit Developed for Interactive Analyses of Big Biological Data. Mol. Plant 2020, 13, 1194–1202. [Google Scholar] [CrossRef]
  28. Li, S. Transcriptional control of flavonoid biosynthesis: Fine-tuning of the MYB-bHLH-WD40 (MBW) complex. Plant Signal. Behav. 2014, 9, e27522. [Google Scholar] [CrossRef]
  29. Liu, C.Q.; Yao, X.Q.; Li, G.Q.; Huang, L.; Xie, Z.J. Transcriptomic profiling of purple broccoli reveals light-induced anthocyanin biosynthetic signaling and structural genes. PeerJ 2020, 8, e8870. [Google Scholar] [CrossRef]
  30. Song, B.; Xu, H.; Chen, L.Z.; Fan, X.X.; Jing, Z.G.; Chen, S.; Xu, Z.G. Study of the relationship between leaf color formation and anthocyanin metabolism among different purple pakchoi lines. Molecules 2020, 25, 4809. [Google Scholar] [CrossRef]
  31. Liu, C.X.; Yu, Q.X.; Li, Z.Q.; Jin, X.L.; Xing, W. Metabolic and transcriptomic analysis related to flavonoid biosynthesis during the color formation of Michelia crassipes tepal. Plant Physiol. Biochem. 2020, 155, 938–951. [Google Scholar] [CrossRef]
  32. Chen, Z.; Lu, X.Y.; Li, Q.Z.; Li, T.-C.; Zhu, L.; Ma, Q.Y.; Wang, J.J.; Lan, W.; Ren, J. Systematic analysis of MYB gene family in Acer rubrum and functional characterization of ArMYB89 in regulating anthocyanin biosynthesis. J. Exp. Bot. 2021, 72, 6319–6335. [Google Scholar] [CrossRef] [PubMed]
  33. Li, S.S.; Li, Q.Z.; Rong, L.P.; Tang, L.; Wang, J.J.; Zhang, B. Analysis of the transcriptome of green and mutant golden-yellow leaves of Acer palmatum Thunb. using high-throughput RNA sequencing. J. Hortic. Sci. Biotechnol. 2015, 90, 388–394. [Google Scholar] [CrossRef]
  34. Dong, H.Y.; Xu, B.; Ji, K.S. Comparative transcriptome analysis of genes involved in response to thermal stress and leaf colour change of Acer palmatum. Sci. Hortic. 2019, 255, 77–85. [Google Scholar] [CrossRef]
  35. Gao, Y.F.; Zhao, D.H.; Zhang, J.Q.; Chen, J.S.; Li, J.L.; Weng, Z.; Rong, L.P. De novo transcriptome sequencing and anthocyanin metabolite analysis reveals leaf color of Acer pseudosieboldianum in autumn. BMC Genom. 2021, 22, 383. [Google Scholar] [CrossRef] [PubMed]
  36. Lu, J.J.; Zhang, Q.; Lang, L.X.; Jiang, C.; Wang, X.F.; Sun, H.M. Integrated metabolome and transcriptome analysis of the anthocyanin biosynthetic pathway in relation to color mutation in miniature roses. BMC Plant Biol. 2021, 21, 257. [Google Scholar] [CrossRef] [PubMed]
  37. Fu, M.Y.; Yang, X.; Zheng, J.R.; Wang, L.; Yang, X.Y.; Tu, Y.; Ye, J.B.; Zhang, W.W.; Liao, Y.L.; Cheng, S.Y.; et al. Unraveling the regulatory mechanism of color diversity in Camellia japonica petals by integrative transcriptome and metabolome analysis. Front. Plant Sci. 2021, 12, 685136. [Google Scholar] [CrossRef]
  38. Kumar, D.; Sarmah, B.K.; Das, P.K. Ethylene mediates repression of anthocyanin accumulation in black rice pericarps in the absence of light. J. Plant Physiol. 2019, 236, 34–38. [Google Scholar] [CrossRef]
  39. Guo, Y.Q.; Chang, X.J.; Zhu, C.; Zhang, S.T.; Li, X.Z.; Fu, H.F.; Chen, C.S.; Lin, Y.L.; Lai, Z.X. De novo transcriptome combined with spectrophotometry and gas chromatography-mass spectrometer (GC-MS) reveals differentially expressed genes during accumulation of secondary metabolites in purple-leaf tea (Camellia sinensis cv Hongyafoshou). J. Pomol. Hortic. Sci. 2018, 94, 349–367. [Google Scholar] [CrossRef]
  40. Kiselev, K.V.; Suprun, A.R.; Aleynova, O.A.; Ogneva, Z.V.; Kalachev, A.V.; Dubrovina, A.S. External dsRNA downregulates anthocyanin biosynthesis-related genes and affects anthocyanin accumulation in Arabidopsis thaliana. Int. J. Mol. Sci. 2021, 23, 6749. [Google Scholar] [CrossRef]
  41. Han, Y.P.; Vimolmangkang, S.; Soria-Guerra, R.E.; Rosales-Mendoza, S.; Zheng, D.; Lygin, A.V.; Korban, S.S. Ectopic expression of apple F3‘H genes contributes to anthocyanin accumulation in the Arabidopsis tt7 mutant grown under nitrogen stress. Plant Physiol. 2010, 153, 806–820. [Google Scholar] [CrossRef] [Green Version]
  42. Sundaramoorthy, J.; Park, G.T.; Chang, J.H.; Lee, J.D.; Kim, J.H.; Seo, H.S.; Chung, G.; Song, J.T. Identification and molecular analysis of four new alleles at the W1 locus associated with flower color in soybean. PLoS ONE 2016, 11, e0159865. [Google Scholar] [CrossRef] [PubMed] [Green Version]
  43. Wang, Y.Y.; Shi, Y.F.; Li, K.Y.; Yang, D.; Liu, N.N.; Zhang, L.J.; Zhao, L.; Zhang, X.F.; Liu, Y.J.; Gao, L.P.; et al. Roles of the 2-Oxoglutarate-Dependent Dioxygenase Superfamily in the Flavonoid Pathway: A Review of the Functional Diversity of F3H, FNS I., FLS, and LDOX/ANS. Molecules 2021, 26, 6745. [Google Scholar] [CrossRef] [PubMed]
  44. Kim, S.H.; Lee, J.R.; Hong, S.T.; Yoo, Y.K.; An, G.; Kim, S.R. Molecular cloning and analysis of anthocyanin biosynthesis genes preferentially expressed in apple skin. Plant Sci. 2003, 165, 403–413. [Google Scholar] [CrossRef]
  45. Wu, M.; Liu, J.L.; Song, L.Y.; Li, X.Y.; Cong, L.; Yue, R.R.; Yang, C.Q.; Liu, Z.; Xu, L.F.; Wang, Z.G. Differences among the Anthocyanin Accumulation Patterns and Related Gene Expression Levels in Red Pears. Plants 2019, 8, 100. [Google Scholar] [CrossRef] [Green Version]
  46. Han, Y.P.; Vimolmangkang, S.; Soria-Guerra, R.E.; Korban, S.S. Introduction of apple ANR genes into tobacco inhibits expression of both CHI and DFR genes in flowers, leading to loss of anthocyanin. J. Exp. Bot. 2012, 63, 2437–2447. [Google Scholar] [CrossRef] [Green Version]
  47. Shi, S.G.; Li, S.J.; Kang, Y.X.; Liu, J.J. Molecular characterization and expression analyses of an anthocyanin synthase gene from Magnolia sprengeri pamp. Appl. Biochem. Biotechnol. 2015, 175, 477–488. [Google Scholar] [CrossRef]
  48. Qin, S.J.; Liu, Y.T.; Cui, B.Q.; Cheng, J.L.; Liu, S.Y.; Liu, H.Z. Isolation and functional diversification of dihydroflavonol 4-Reductase gene HvDFR from Hosta ventricosa indicate its role in driving anthocyanin accumulation. Plant Signal. Behav. 2021, 17, 2010389. [Google Scholar] [CrossRef]
  49. Yoshihara, N.; Imayama, T.; Fukuchi-Mizutani, M.; Okuhara, H.; Tanaka, Y.; Ino, I.; Yabuya, T. cDNA cloning and characterization of UDP-glucose: Anthocyanidin 3-O-glucosyltransferase in Iris hollandica. Plant Sci. 2005, 169, 496–501. [Google Scholar] [CrossRef]
  50. Hiromoto, T.; Honjo, E.; Noda, N.; Tamada, T.; Kazuma, K.; Suzuki, M.; Blaber, M.; Kuroki, R. Structural basis for acceptor-substrate recognition of UDP-glucose: Anthocyanidin 3-O-glucosyltransferase from Clitoria ternatea. Protein Sci. 2015, 24, 395–407. [Google Scholar] [CrossRef] [Green Version]
  51. Tanaka, Y.; Sasaki, N.; Ohmiya, A. Biosynthesis of plant pigments: Anthocyanins, betalains and carotenoids. Plant J. 2008, 54, 733–749. [Google Scholar] [CrossRef]
  52. Sun, T.H.; Yuan, H.; Cao, H.B.; Yazdani, M.; Tadmor, Y.; Li, L. Carotenoid Metabolism in Plants: The Role of Plastids. Mol. Plant 2018, 11, 58–74. [Google Scholar] [CrossRef] [PubMed] [Green Version]
  53. Stanley, L.; Yuan, Y.W. Transcriptional Regulation of Carotenoid Biosynthesis in Plants: So Many Regulators, So Little Consensus. Front. Plant Sci. 2019, 10, 1017. [Google Scholar] [CrossRef] [PubMed] [Green Version]
  54. Luo, J.R.; Shi, Q.Q.; Niu, L.X.; Zhang, Y.L. Transcriptomic analysis of leaf in tree peony reveals differentially expressed pigments genes. Molecules 2017, 22, 324. [Google Scholar] [CrossRef] [PubMed] [Green Version]
  55. Shan, X.T.; Li, Y.Q.; Yang, S.; Gao, R.F.; Zhou, L.D.; Bao, T.T.; Han, T.T.; Wang, S.C.; Gao, X.; Wang, L. A functional homologue of Arabidopsis TTG1 from Freesia interacts with bHLH proteins to regulate anthocyanin and proanthocyanidin biosynthesis in both Freesia hybrida and Arabidopsis thaliana. Plant Physiol. Biochem. 2019, 141, 60–72. [Google Scholar] [CrossRef]
  56. Yan, H.L.; Pei, X.N.; Zhang, H.; Li, X.; Zhang, X.X.; Zhao, M.H.; Chiang, V.L.; Sederoff, R.R.; Zhao, X.Y. MYB-Mediated Regulation of Anthocyanin Biosynthesis. Int. J. Mol. Sci. 2021, 22, 3103. [Google Scholar] [CrossRef]
  57. Gil-Muoz, F.; Sánchez-Navarro, J.A.; Besada, C.; Salvador, A.; Badenes, M.L.; Naval, M.D.M.; Ríos, G. MBW complexes impinge on anthocyanidin reductase gene regulation for proanthocyanidin biosynthesis in persimmon fruit. Sci. Rep. 2020, 10, 3543. [Google Scholar] [CrossRef]
  58. Zhang, Y.Z.; Xu, S.Z.; Ma, H.P.; Duan, X.J.; Gao, S.X.; Zhou, X.J.; Cheng, Y.W. The R2R3-MYB gene PsMYB58 positively regulates anthocyanin biosynthesis in tree peony flowers. Plant Physiol. Biochem. 2021, 164, 279–288. [Google Scholar] [CrossRef]
  59. Deng, G.M.; Zhang, S.; Yang, Q.S.; Gao, H.J.; Sheng, O.; Bi, F.C.; Li, C.Y.; Dong, T.; Yi, G.J.; He, W.D.; et al. MaMYB4, an R2R3-MYB Repressor Transcription Factor, Negatively Regulates the Biosynthesis of Anthocyanin in Banana. Front. Plant Sci. 2021, 11, 600704. [Google Scholar] [CrossRef]
  60. Ning, Z.Y.; Hu, K.D.; Zhou, Z.L.; Zhao, D.L.; Tang, J.; Wang, H.; Li, L.X.; Ding, C.; Chen, X.Y.; Yao, G.F.; et al. IbERF71, with IbMYB340 and IbbHLH2, coregulates anthocyanin accumulation by binding to the IbANS1 promoter in purple-fleshed sweet potato (Ipomoea batatas L.). Plant Cell Rep. 2021, 40, 157–169. [Google Scholar] [CrossRef]
  61. Cui, D.L.; Zhao, S.X.; Xu, H.N.; Allan, A.C.; Zhang, X.D.; Fan, L.; Chen, L.M.; Su, J.; Shu, Q.; Li, K.Z. The interaction of MYB, bHLH and WD40 transcription factors in red pear (Pyrus pyrifolia) peel. Plant Mol. Biol. 2021, 106, 407–417. [Google Scholar] [CrossRef]
  62. Chen, X.; Li, M.H.; Ni, J.; Hou, J.Y.; Shu, X.; Zhao, W.W.; Su, P.F.; Wang, D.C.; Shah, F.A.; Huang, S.W.; et al. The R2R3-MYB transcription factor SsMYB1 positively regulates anthocyanin biosynthesis and determines leaf color in Chinese tallow (Sapium sebiferum Roxb.). Ind. Crops Prod. 2021, 164, 113335. [Google Scholar] [CrossRef]
Figure 1. Different leaf color change stages of A. triflorum, green leaf (GL), orange (HRL), and red leaf (RL).
Horticulturae 08 00635 g001
Figure 2. Heatmap of the identified metabolites in green (GL), orange (HRL), and red (RL) leaves. The color scale indicates the normalized metabolite contents using Row Z-score. The name of each anthocyanin compound is listed on the right side of the heatmap.
Horticulturae 08 00635 g002
Figure 3. Differentially accumulated metabolites in the pathway of anthocyanin biosynthesis in three comparison groups: (A) green versus orange leaves (GL vs. HRL), (B) green versus red leaves (GL vs. RL), and (C) orange versus red leaves (HRL vs. RL). (D) Venn diagram of DAMs.
Horticulturae 08 00635 g003
Figure 4. Volcano plots of differentially expressed genes; green, red, and blue dots represent the downregulated, the upregulated, and non-differentially expressed genes, respectively.
Horticulturae 08 00635 g004
Figure 5. Venn diagram of DEGs in each comparison group: green versus orange (GL vs. HRL), green versus red (GL vs. RL), and orange versus red leaves (HRL vs. RL).
Horticulturae 08 00635 g005
Figure 6. KEGG enrichment analysis of the DEGs in each comparison. The red dots highlight the flavonoid biosynthetic process and flavonoid metabolic process.
Horticulturae 08 00635 g006
Figure 7. k-means clustering of DEGs. Black lines show the average values for standardized FPKM in each sub-class; the colored lines represent the standardized FPKM values of each gene in each sub-class.
Horticulturae 08 00635 g007
Figure 8. Pathways and key genes related to the biosynthesis pathways of phenylpropanoid, flavonoid, and anthocyanidin in A. triflorum, reconstructed based on KEGG pathway analysis of DEGs. The left and right colored dots displayed the level of expression of key genes in green (GL), orange (HRL), and red (RL) leaves; PAL, phenylalanine ammonia-lyase; 4CL, 4-coumarate-CoA ligase; DFR, dihydroflavonol 4-reductase; CHS, chalcone synthase; CHI, chalcone isomerase; F3H, flavanone 3-hydroxylase; F3′H, flavanone 3′-hydroxylase; F3′5′H, flavanone 3′5′-hydroxylase; DFR, dihydroflavonol 4-reductase; ANS, anthocyanin synthase; BZ1, anthocyanidin 3-O-glucosyltransferase; GT, glucosyltransferase; UGT75C1, anthocyanidin 3-O-glucoside 5-O-glucosyltransferase.
Horticulturae 08 00635 g008
Figure 9. The PPI (protein–protein interaction) network of differentially expressed AtrMYB and anthocyanin synthesis structural genes.
Horticulturae 08 00635 g009
Figure 10. The top 40 nodes of the PPI network between differentially expressed AtrMYBs and anthocyanin synthesis structural genes (A) and the expression level of AtrMYBs in green (GL), orange (HRL), and red (RL) leaves (B).
Horticulturae 08 00635 g010
Figure 11. Expression patterns of anthocyanidin-biosynthesis-related differentially expressed genes (DEGs) in green (GL), orange (HRL), and red (RL) leaves by qRT-PCR.
Horticulturae 08 00635 g011
Publisher’s Note: MDPI stays neutral with regard to jurisdictional claims in published maps and institutional affiliations.

