Article

Comparative Analysis of Complete Chloroplast Genome and Phenotypic Characteristics of Japanese Apricot Accessions

1
Laboratory of Fruit Tree Biotechnology, College of Horticulture, Nanjing Agricultural University, Nanjing 210095, China
2
Department of Agricultural Sciences and Techniques-Horticulture, Rural Polytechnic Institute for Training and Applied Research (IPR/IFRA) of Katibougou, Koulikoro, Mali
3
College of Forest Resources and Environmental Science, Michigan Technological University, Houghton, MI 49931, USA
4
Department of Crops, Horticulture and Soils, Faculty of Agriculture, Egerton University, P.O. Box 536, Egerton 20115, Kenya
5
Department of Crop Science, Faculty of Agriculture, Food and Consumer Sciences, University for Development Studies, Tamale 00233, Ghana
6
Genetics Department, Faculty of Agriculture, Ain Shams University, Cairo 11241, Egypt
*
Author to whom correspondence should be addressed.
Horticulturae 2022, 8(9), 794; https://doi.org/10.3390/horticulturae8090794
Submission received: 5 July 2022 / Revised: 26 August 2022 / Accepted: 27 August 2022 / Published: 31 August 2022
(This article belongs to the Section Genetics, Genomics, Breeding, and Biotechnology (G2B2))

Abstract

:
Japanese apricot (Prunus mume Sieb. et Zucc.) is among the most valued fruits and flowering plants in eastern Asia. However, few comparative studies have been conducted with respect to its agro-morphological and pomological traits, chloroplast (cp) genome sequences and plastid diversity. Therefore, a comparative study was, conducted to investigate the divergence and geographic distribution of ten Japanese apricot accessions from three Chinese provinces (Zhejiang, Jiangsu and Sichuan). Phenotypic characteristics of the evaluated accessions, such as leaf length, tip leaf length, flower diameter, anther number, fruit weight, longitudinal height, transversal height, lateral height, fruit stone weight, stone longitudinal height, stone transversal height, stone lateral heigh, titratable acid content and total soluble solids, varied significantly (p < 0.05) among the ten investigated accessions. On the other hand, most of the investigated accessions were statistically similar within the same province. Comparing the Cp genomes of P. mume accessions with those of the genus Prunus revealed a similarity in structure and composition with slight differences. “Bayes empirical Bayes” (BEB) analysis in Prunus species, including P. mume, revealed BEB in rps16, rps3, rpoC1(4*), rpl32, rpl16, rbcL, psbF, petB, ndhF, clpP and ccsA genes. The BEB value of the rpoC1 gene is higher than 0.95, indicating that it is potentially under positive selection. Interestingly, the accessions from the same province of origin had the same number of forward repeat sequences. Furthermore, all accessions from Zhejiang province had the same number of simple sequence repeats. Similarly, nucleotide deletion/insertion of the ycf1 sequence and the results of phylogenetic trees revealed that accessions were mainly clustered according to their province of origin. Our comparative study of agronomical traits, chloroplast composition, structure, nucleotide variability of cp genome and phylogeography in Japanese apricot accessions provides valuable information on their diversity and geographic distribution.

1. Introduction

The structure, coding ability and evolution of chloroplast genomes and mitochondria, two DNA-containing cell organelles in plants, have been studied [1]. DNA contained in chloroplasts (cp) [2] evolved over almost a billion years from cyanobacterial endosymbionts [3,4] and is known as chloroplast DNA (cpDNA) [2,5]. Chloroplast is the photosynthetic site [5,6], providing the most noticeable characteristic in green plant cells, and is specific to plants [5,6,7]. Its main layer participates in the synthesis of several substances, including amino acids, fatty acids, starch and pigments [7].The first complete cp genome was described in tobacco in 1986 [8], and since that time, an increasing number of cp genomes have been reported and submitted to the nucleotide database. The cp genome is regarded as an effective tool for revealing the inherent genetic diversity, phylogenetic relationships [8] and evolution [9] of plants species. Despite the highly conserved structure of the cp genome, previous studies have shown that certain plant species, including members of the Prunus genus, have changed in size due to genetic arrangements of the inverted repeat (IR) region, such as gene mutation and deletion [1,10,11,12,13]. These variations have been found in cp genomes, providing information for the development of molecular markers and genetic adaptive radiation analysis [14], as well as ensuring the accuracy of phylogenetic research. For instance, the sequences linked to regions and open reading frames were screened in a comparative study of cp genome sequences of Prunus armeniaca, P. salicina and P. mume, which could be useful as molecular markers in taxonomic classification studies [9]. The ndh gene suite (ndhA, ndhI and ndhG) displays a loss of putative autonomy in Najas flexilis, [10]. Köhler, M et al. [11] also found non-conserved regions on genes of the ndh gene suite (i.e., ndhA, ndhD, ndhE, ndhF, ndhG, ndhH, ndhI and ndhJ) and pseudogenization of some genes from the perspective of plastid structure and content in Opuntioideae (Cactaceae). Furthermore, the phylogenetic certainty of the backbone of Prunus species, including P. mume, was investigated using nuclear genes and plastid genome sequences, specifically the position of the racemose group relative to the solitary and corymbose groups [12]. The Prunus backbone was consistently resolved in the phylogenies of both nuclear and chloroplast genomes [12]. Moreover, the encoding cp genes (such as ycf1 and ndhF) meet the requirement for optimal Prunus usefulness. According to previous studies [13,14], Ycf1 and ndhF are essential for DNA barcodes inferred from a significant level of variability. Amar [15] noted a higher rate of transition/transversion (R) DNA sequence variation, which could be used to distinguish between species or populations.
The Japanese apricot is a native plant in China that belongs to the Rosaceae family, subfamily ‘Prunoideae’; in Chinese, it is referred as “mume” or “mei” [16]. P. mume is a long-cultivated fruit crop that of economic significance in temperate areas and Eastern Asian countries. Its germplasm resources are abundant in high-quality cultivar populations, playing a key role in fruit production [17]. The genetic background of available resources and accessions is complex because of the high genetic variability of the species, which is also present in many cultivars of apricot (Prunus armeniaca) due to natural crossing [18]. Shimada, T. et al. [19] cited morphological characteristics as the basis of their classification. As a result, morphological data can be used to identify P. mume accessions based on their geographic location. For instance, stone morphology was used to distinguish/classify Japanese and Chinese P. mume accessions [20].
Recently, it was revealed that the combination of both approaches (molecular and morphological) was made possible via extensive and accurate knowledge of angiosperm linkages based on molecular phylogenetic analyses [21], as well as an increasing record of morphological features, such as flower [22]. Moreover, morphological variability revealed the presence of two ecotypes within a species [23]. However, morphological feature evolution studies among species and populations represent a crucial method [20], enabling the exploration of their geographical origins [24]. The cp genome is a useful data resource for phylogenetic studies [25] and elucidating evolutionary relationships, genetic diversity and the genetic resources of higher plants. It provides accurate assertions in the context of accessing genetic consistency and reveals historical processes that influenced genetic variation [23].
Agro-morphological and phylogenetic analysis of accessions using complete cp genomes could provide information regarding phylogenetic relationships, cp and morphological diversity. As a result, the current study was focused on phenotypic characteristics, cp genome diversity and geographic distribution of Japanese apricot accessions. This study provides valuable insight into agro-morphological traits, cp genome diversity and phylogeographic characteristics of the evaluated accessions from different regions of origin.

2. Materials and Methods

2.1. Genetic Materials and Agro-Morphological Characterization

In this study, two accessions of P. mume, M01 and M02, were identified by Prof. Gao Zhihong in Flora of China. The two accessions were collected from the National Field Genebank for Prunus mume in Nanjing, Jiangsu, China, for sequencing and combined with the eight previously sequenced accessions R01, R04, R03, R05, R02, R15, R16 and R17 for analysis. The evaluated accessions were from different regions (Table 1). All Japanese apricots used in the present study were not endangered accessions, and permission was obtained before collection. The voucher specimen deposits are stored at Nanjing Agricultural University (accession numbers: GMNJ0020 (M01) and GMNJ0021 (M02)). Table 1 provides details on the 10 accessions used in the present study.
The plantation of the National Field Genebank of P. mume (longitude: 119.1807, latitude: 31.6147) in Nanjing, Jiangsu, China, was used to determine agro-morphological and fruit quality traits of the accessions listed in Table 1, and additional information on the field is listed in Table S1. Three trees per accession were selected for data collection on leaves, flowers and fruits; these were collected carefully for morphological and fruit quality characterization [26]. Fruit samples were harvested in the maturity stage (higher climacteric maximum values), with fruit color (green to yellow) and days after complete flowering (88 days) as maturity indicators. Agro-morphological characteristics of the ten accessions were assessed by sampling 10 leaves, 10 flowers and 10 fruits for all the variables that were measured and counted. The variables were measured with a ruler (precision, 0.02 cm) in leaves and flowers, including leaf length, leaf tip length, leaf diameter, leaf stock, flower diameter and pistil length. Counted variables included anther number and petal number in the anthesis stage. The variables measured for fruits were fresh fruit and fruit stone weight, which were weighed using an electronic analytical balance (Mettler Toledo Instrument Co., Ltd., Zurich, Switzerland; precision, 0.0001 g). Other fruit variables measured in fruits included fresh fruit and fruit stone transversal, as well as longitudinal and lateral height, using a Vernier caliper (precision, 0.05 mm). Total soluble solids (TSS) were determined using a PAL 1 portable digital-display sugar meter (Atago Ajon Company, Tokyo, Japan), and titratable acid content (TAC) was determined by indicator titration [27]. Data collected in triplicate were subjected to analysis of variance, followed by Duncan’s multiple range test post hoc to separate the means among the accessions at a significance level of 5%; the results were visualized in GraphPad Prism (Version 8, GraphPad Software, San Diego, CA, USA, http://www.graphpad.com, accessed on 09 June 2021). In addition, Pearson correlation among the fruit quality parameters was computed by a two-tailed test at a 5% significance level with the corrplot package in R [28].

2.2. Sample Preparations, DNA Extraction and Sequencing

Total DNA was extracted from young leaves of M01 and M02 using a modified CTAB method [29]. cDNA library sequencing was performed using an Illumina HiSeq2500 high-throughput sequencing platform (San Diego, CA, USA) to acquire high-quality, clean data based on edge synthesis sequencing technology.

2.3. Assembly, Annotation and Analysis of the Chloroplast Genome Sequences

The cp genome was assembled using SPAdes version 3.11 software (BANKEVICH, A.,Petersburg, Russia, http://bioinf.spbau.ru/spades, accessed on 3 September 2020) [30]. To ensure the accuracy of the assembled results, quality control of the assembled cp genome was carried out by genome readback, genome coverage, insert size and comparison of genome reference sequences. In order to conduct collinear analysis of the conserved and rearranged genome and alignment of the two to the reference genome sequence-structure, the reference sequence Prunus persica HQ336405.1 [31] (https://www.ncbi.nlm.nih.gov/nuccore/, accessed on 5 September 2020) was used for quality control after assembly. Prodigal v2.6.3 (GNU, Cambridge, Massachusetts, USA, https://www.github.com/hyattpd/Prodigal, accessed on 6 September 2020) software was used to annotate the coding DNA sequence (CDS) of the cp genome. Hmmer software v3.1b2 (Eddy S.R., Ashburn, Virginia, USA, http://www.hmmer.org/, accessed on 7 September 2020) was used to obtain rRNA annotation results of the cp genome sequence. tRNA prediction of the cp genome sequence was performed using Aragorn software v1.2.38 (Dean Laslett, Perth, Western Australia, Australia, http://130.235.244.92/ARAGORN/, accessed on 7 September 2020). According to the relative species already published in the NCBI database, the related genes sequences were extracted, verified and analyzed by BLAST v2.6 (Altschul, S.F., New York, NY, USA, https://blast.ncbi.nlm.nih.gov/Blast.cgi, accessed on 10 September 2020). Using this method, the assembled sequences were aligned to obtain secondary annotation results. The annotation results for differential genes were checked manually to eliminate erroneous and redundant annotations that determine multiple exon boundaries to obtain the final annotation. The codon usage and RSCU of plastid genomes were studied, and Perl script version 5.26 (Wall, L., Los Angeles, CA, USA, perl.org, accessed 25 September 2020) was used for the relative calculations.

2.4. Analysis of Repeat Sequences and Single-Sequence Repeats

In the cp genomes of Japanese apricot accessions, single-sequence repeats (SSRs) or microsatellites were identified using the MISA v1.0 (MISA-web) MIcroSAtellite identification tool (Leibniz-Institute, Saarbrucken, Germany, http://pgrc.ipk-gatersleben.de/misa/misa.html, accessed on 4 October 2020) with parameters 1–8 (single-base repeat 8 times or more). A combination of vmatch software v2.3.0 (Kurtz, Stefan, Hamburg, Bundesstrasse, Germany, http://www.vmatch.de/, accessed on 6 October 2020) with Perl script version 5.26 (Wall, L., Los Angeles, CA, USA, perl.org, accessed on 6 October 2020) was used to identify repeated sequences. The parameters had a minimum length = 30 bp, hamming distance = 3 and four terms of identification: forward, palindromic, reverse and complement.

2.5. Genome Comparison and Sequence Divergence of Chloroplast Genomes

The complete cp genomes of Japanese apricot accessions were compared to one another using the default parameters of Mauve software (Darling, A, Wisconsin-Madison, USA, http://darlinglab.org/mauve, accessed on 8 October 2020). The gene sequences were aligned using Mafft software v7.310 (Katoh, K, Tokyo, Japan, https://mafft.cbrc.jp/alignment/software/, accessed on 10 October 2020). Vcf tools versions 4,4.1 (Danecek, P., Cambridge CB10 1SA, UK, http://vcftools.sourceforge.net, accessed on 10 October 2020) were used to calculate pi value (nucleic acid diversity) of each gene after performing a global alignment of homologous gene sequences from different accessions using Mafft v7.310 software (-auto mode) (Katoh, K, Tokyo, Japan, https://mafft.cbrc.jp/alignment/software/, accessed on 10 October 2020). Perl’s SVG module version 2.84 (Mohammad S Anwar, London, England, United Kingdom, https://metacpan.org/release/MANWAR/SVG-2.84, accessed on 12 October 2020) was used to visualize the boundary regions, such as LSC/IRb/SSC/IRa. In addition, the nucleotide sequences of ycf1 and ndhF of the P. mume accessions were aligned using DNAMAN version V8 software ( Lynnon Biosoft, Foster City, CA, USA, https://www.bioz.com/result/doap2%20proteins%20dnaman%20version%208%200%20software/product/Lynnon%20corporation, accessed on 20 March 2022) [32], MEGA X (Kumar, S., Philadelphia, USA, http://www.megasoftware.net, accessed on 20 March 2022), and Jalview version2.11.2.0 (Waterhouse, A, Dundee, UK, https://www.jalview.org/download, accessed on 20 March 2022).

2.6. Evolutionary Analysis

The whole cp genome, as well as LSC, SSC and IR regions were used to construct phylogenetic trees. MAFFT version 7 (Katoh, K., Tokyo, Japan, https://mafft.cbrc.jp/alignment/software/, accessed on 16 June 2022) [32] and trimA11.2 (Capella-Gutierrez, S., Barcelona, Spain, http://trimal. cgenomics.org/publications, accessed on 16 June 2022) [32] were used to align the sequences. The phylogenetic tree was inferred via RAxML version 8 (Stamatakis, A., Heidelberg, Germany, https://github.com/stamatak/standard-RAxML, accessed on 16 June 2022) [33] using the GTR+I+G4 model of evolution, as selected Model test-NG v0.1.7 software (Darriba, D., Elvina, A Coruna, Spain, https://github.com/ddarriba/modeltest, accessed on 16 June 2022) [34] and 1000 rapid bootstraps; then online iTOL (https://itol.embl.de/tree, accessed on 26 August 2022) was used to visualize the trees. P. triloba, P. pedunculata, P. japonica, P. dictyoneura and P. humilis sister groups, including the P. mume clade, were used to study the positive selection of protein-coding genes. However, for each protein-coding gene, the codeml program in the PAML package version 3.14 (Yang, Z., London, United Kingdom, http://web.mit.edu/6.891/www/lab/paml.html, accessed 25 June 2022) were used to determine synonymous (dS) and non-synonymous (dN) substitution rates. The likelihood ratio test (LRT) was used in R version 4.2.1 (Ihaka, G., R., Auckland, New Zealand, http://www.r-project.org, accessed on 26 June 2022) to examine adaptive evolution. Moreover, we explored chloroplast protein-coding genes that may have undergone positive selection in the Prunus species. EasyCodeML version 3 (Gao, F., Fuzhou, China, http://github.com/BioEasy/EasyCodeML, accessed on 27 June 2022 ) [35] models described as M0 (one ratio), M1a (nearly neutral), M2a (positive selection), M3 (discrete), M7 (beta), M8 (beta and ω > 1) and M8a (beta and ω = 1) were examined, and four likelihood ratio tests (M0 vs. M3, M1a vs. M2a, M7 vs. M8 and M8a vs. M8) were performed. Then, BEB analysis under model M8 was used to identify codon sites under positive selection. Additionally, by mapping encoded characters (the mean of each morphological characteristic value by accession was calculated, with the lower mean equivalent to 0 and the higher mean equal to 2); mesquite module version 3.70 (Wayne P. Maddison, Birtish, Columbia, https://www.mesquiteproject.org/Ancestral%20States.html, accessed on 20 May 2022) was used to reconstruct the trees of morphological features based on the maximum likelihood approach [36,37].

3. Results

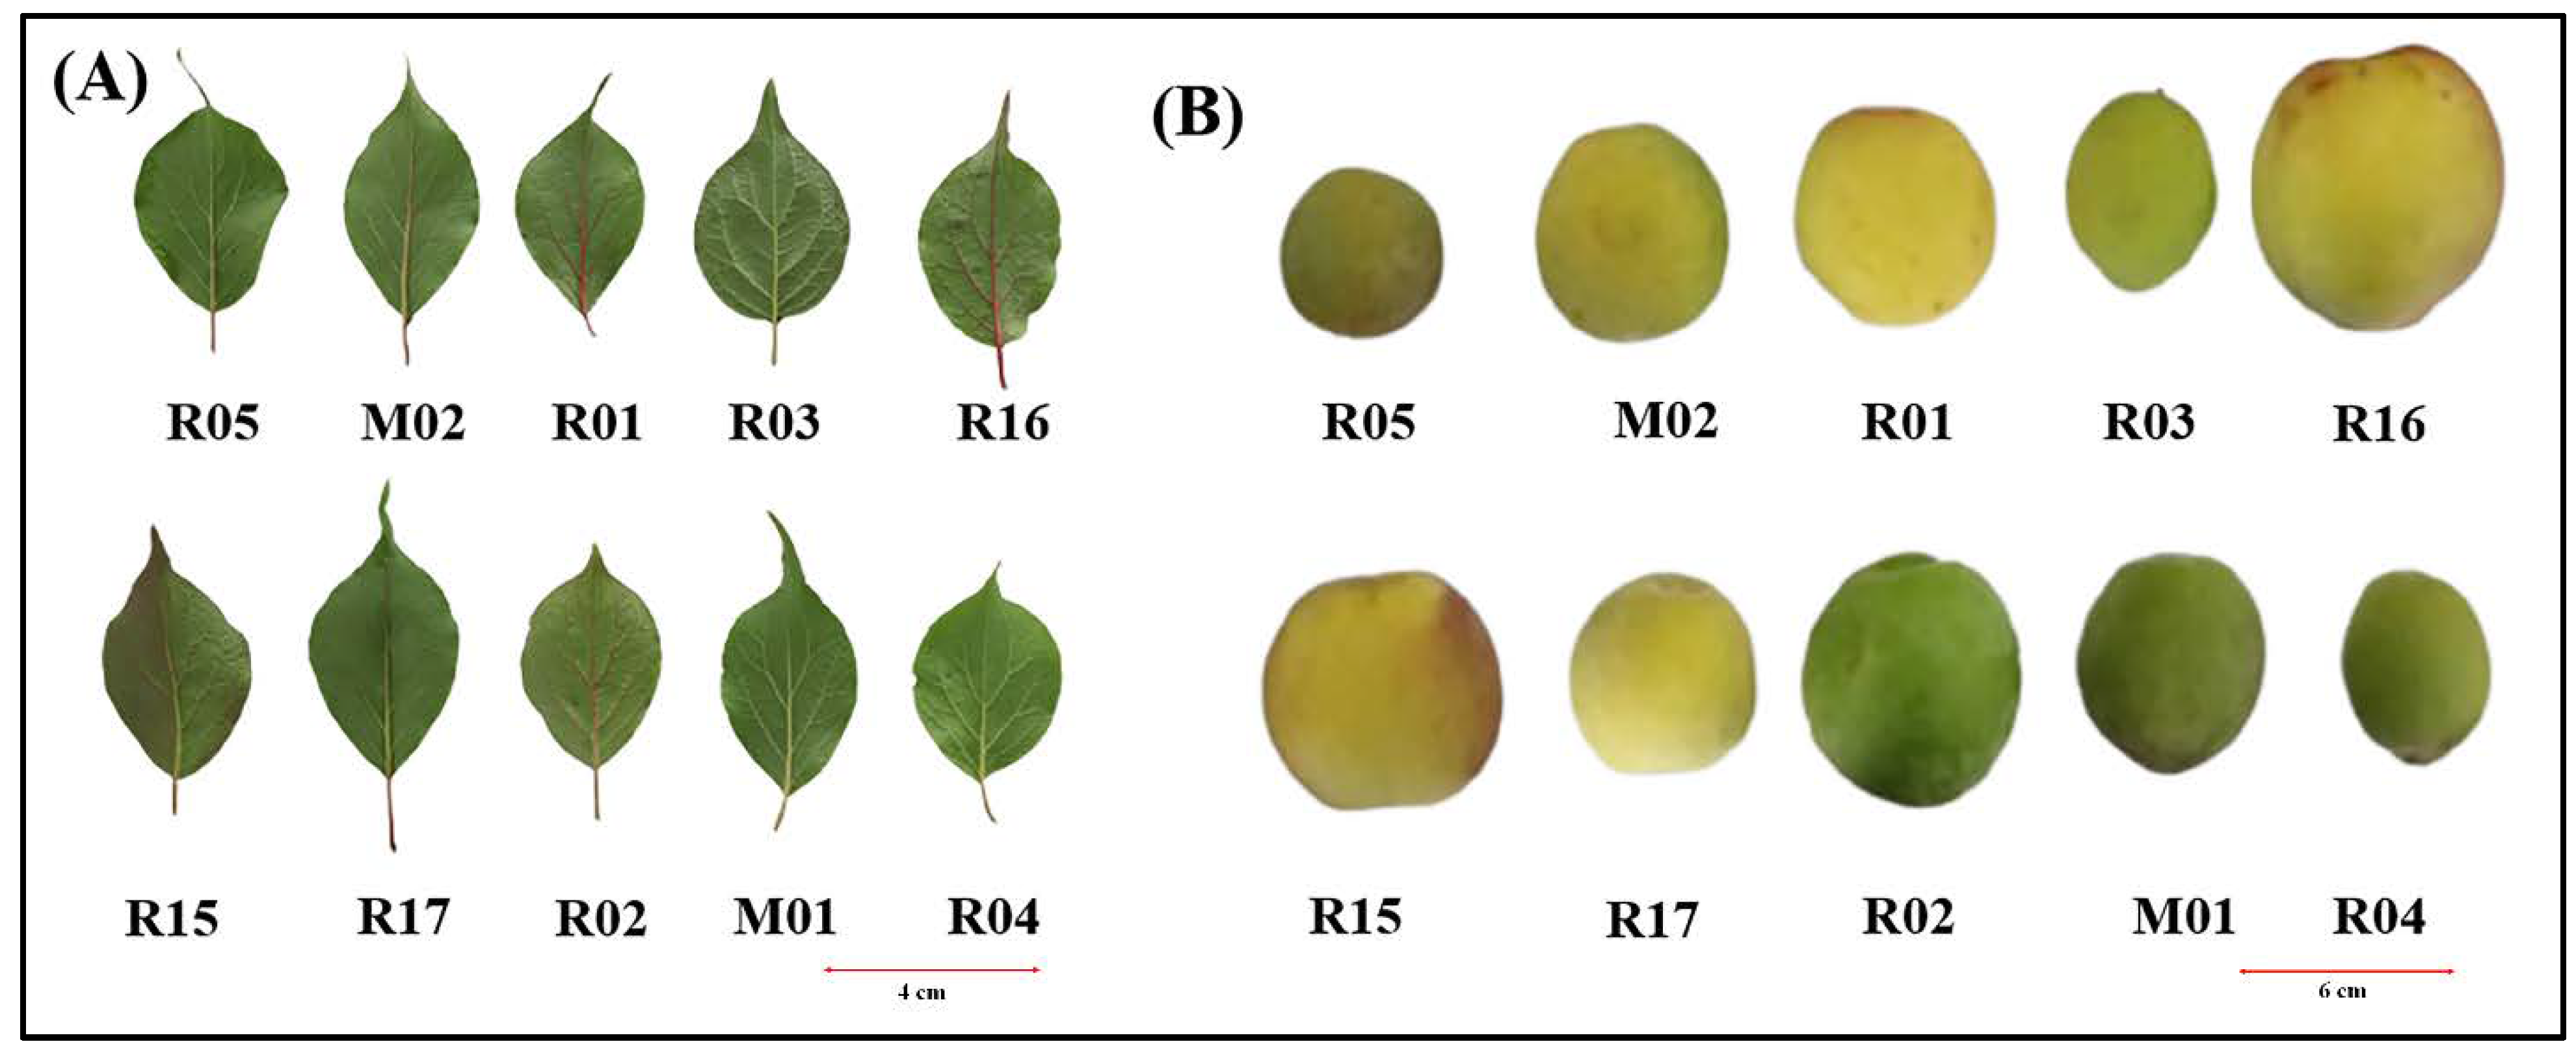
3.1. Agro-Morphological and Fruit Quality Characteristics among the Ten Prunus mume Accessions

Figure 1 displays samples of the leaves and fruit of the ten investigated accessions. Leaf length and tip leaf length differed significantly (p < 0.05) among the accessions, with a range of mean ± standard error of 6.23 ± 0.62 cm in R04 to 7.57 ± 0.71 cm in R17 and 1.00 ± 0.42 cm in R05 to 2.00 ± 0.58 cm in R17 (Figure S1A,D). However, the leaf diameter and stock of the ten accessions were statistically similar (p > 0.05) (Figure S1B,C). In addition, four flower-related traits (flower diameter, anther number, petal number and pistil length) were evaluated; among these, only flower diameter (1.90 ± 0.52 cm in M02 to 2.62 ± 0.20 cm in R04) and anther number (43.67 ± 8.20 in R15 to 60.33 ± 8.47 in R02) showed significant variation (Figure S1E–H).
Fruit quality variables, such as fresh fruit weight, longitudinal height, transversal height, lateral height, fruit stone weight, stone longitudinal height, stone transversal height, stone lateral height, total soluble solids (TSS) and titratable acid content (TAC), differed significantly (p < 0.05) among the 10 accessions (Figure 2A–J). The heaviest fruits were observed in R16 (39.95 ± 15.86 g) and R17 (37.89 ± 13.8 g), which were statistically similar, although their effects differed from those of the other eight accessions (Figure 2A). The fruit weights of R01 (29.38 ± 5.30 g), R02 (27.28 ± 3.19 g) and R15 (25.20 ± 1.11 g) were also similar; however, only R01 differed from M01. The lowest fruit weight ranges were (13.26 ± 10.82–17.07 ± 7.01 g) observed in R05, R03, R04 and M02 (Figure 2A), and fruit stone weights ranged from 1.89 ± 1.11 g in R04 to 4.25 ± 1.25 g in M02 (Figure 2E). The TSS and TAC ranged from 5.05 ± 2.38% in R02 to 9.17 ± 1.73% in R04 and R05 and from 2.73 ± 1.29% in R04 to 5.09 ± 1.08% in R01 (Figure 2I,J). The agro-morphological and fruit quality traits showed a wide range of variability among the 10 accessions. The mean range of morphological traits per accession was zero to two. Mesquite was used to construct tree morphological features based on the maximum likelihood approach via mapping of encoded characters. The results showed that the accessions differed phenotypically. However, as illustrated in Figure 3 and Figure S2A, the trees based on morphological characters varied between accessions in most of the nodes.
Fruit quality and phenotypic data were subjected to Pearson correlation. and the result is shown in Figure 4. TSS was negatively correlated with the other nine traits, but the only significant correlation was observed with fruit longitudinal height (correlation coefficient (r) of −0.60). Conversely, a strong and significant positive correlation was observed among some of the traits, for example, fruit weight relative to fruit longitudinal, traversal and lateral heights, with correlation coefficients (r) in the range of 0.95–0.97.

3.2. Structural Features and Gene Content of the Chloroplast Genome in Prunus mume Accessions

The cp genome, with 157,903 base pairs (bp), is exactly the same in the two accessions (M01 and M02); the depth of the coverages of cp genomes are shown in Table S2. Thus, the genetic map of cp genomes of all accessions in a circle is shown in Supplementary Figure S3. The cp genomes of both accessions (M01 and M02) showed a quadripartite structure, comprising a pair of the IR region of 26,391 bp, a large single copy (LSC) of 86,124 bp and a small single-copy (SSC) of 18,997 bp (Table S2). The cp genomes contain 130 genes (112 unique genes), including 85 coding proteins, 37 coding tRNAs and 8 coding rRNAs. Eighteen genes containing introns were found (Table S3); among them, sixteen genes (rpl16, ndhA, petB, atpF, rpl2, rps12trnV-UAC, rpoC1, trnA-UGC, trnG-GCC, petD, trnI- GAU, trnK-UUU, rps16, trnL-UAA and ndhB) have one intron, whereas two other genes (clpP and ycf3) have a pair of introns (Table S3). The total GC contents of cp DNA sequences of the two accessions (M01 and M02) were identical (36.74%) (Table S2).

3.3. Protein-Coding Gene Capacity and Codon Usage Analysis

The codon usage and relative use of synonymous codons (RSCU) of plastid genomes of ten P. mume accessions were analyzed with Perl script for the relative calculations. In the cp genomes of the accessions, coding capacity of the genes encoding proteins ranged from 26,509 (R01 and R02) to 26,518 (R04, R03 and R05) codons (Table S4). All accessions encode an equal number (21) of various amino acids, although accessions R04, R03 and R05 have a slightly stronger coding capacity than other accessions.
The relative synonymous codon usage (RSCU), codons, corresponding numbers and amino acids are shown in Table S4. Among the amino acids, leucine was the most abundant, with 2771 total codons (10.45%) in R04, R03, R05, R15, R16, R17, M01 and M02 and 2768 total codons (10.44%) in R01 and R02, followed by isoleucine (Ile) (863–864), with 2292 (R04, R03 and R05), 2291 (R01), 2290 (R02) and 2289 (R15, R16, R17, M01 and M02) codons. The fewest codons were observed for cysteine, with only 312 codons (1.18% of the total), across all accessions (Table S4).
The RSCU was calculated in the ten Japanese apricot accessions. The most ideal codon was AUG, which encodes an amino acid, methionine (Met), with 19,968 RSCU in each accession. The next was UUA (1962–19,554) encoding leucine, with 1962 RSCU in R04, R03, R05, R15, R16, R17, M01 and M02 and 19,554 RSCU in R01 and R02. The lowest frequency was the start codon, and the lowest use was GUG, with the same percentage (0.0032) in all the accessions, encoding the amino acid methionine (Met).

3.4. Simple Sequence Repeats and Repetitive Sequence Analysis

Using MISA software, the occurrence and single-sequence repeat (SSR) types of ten cp genomes of P. mume accessions were analyzed. In the cp genome, the SSR changed significantly at the intraspecies level; in the framework of population genetics and evolution, SSRs are regarded as specific genetic markers [38,39]. There were 248 SSRs in R02; 247 SSRs in R15, R16, R17, M01 and M02; and 246 SSRs in R01, R04, R03 and R05 (File 1), including six categories: mononucleotide (mNr), dinucleotide (dNr), trinucleotide (trNr), tetranucleotide (teNr), pentanucleotide (pNr) and hexanucleotide (hNr) repeats (Table 2).
However, among these categories, mononucleotide repeats (157–159 repeats) were the most abundant, followed by dinucleotide (13 repeats), trinucleotide (67 repeats), tetra-nucleotide (7 repeats), pentanucleotide (1–2 repeats) and hexanucleotide (0–1 repeat) repeats (Table 3). Single-nucleotide repeats accounted for 63.967% in R15, R16, R17, M01 and M02; 63.82% in R01, R04, R03 and R05; and 64.11% in R02, indicating their abundance. Hexanucleotides (0–0.40%) and pentanucleotides (0.40–0.80%) were less abundant. Therefore, single-nucleotide repeats are more involved in genetic variation than others. A higher level of A or T was observed within the mononucleotide, dinucleotide, trinucleotide, tetranucleotide and pentanucleotide repeats, leading to basic alignment deviations. In the cp genomes of the ten Japanese apricot accessions, the number of forward (F) repeats ranged from 14 (R04, R03 and R05) to 21(R01 and R02), the number of palindromic (P) repeats ranged from 24 (R02) to 26 (R04, R03 and R05) and the number of reverse (R) repeats ranged from 0 (R02 and R16) to 6 (R01, R03, R05, R15, R17, M01 and M02), whereas no complement (C) repeat was detected (Table 3), and majority of these repeats were between 30 and 40 bp in length (Figure S4).

3.5. Analysis of Nucleotide Diversity in P. mume Accessions

In the cp genome, nucleic acid sequences among diverse species can be revealed by the extent of variation of nucleic acid diversity (pi). Regions with higher variability are applicable as potential molecular markers for accession/germplasm resources. Homologous gene sequences of different accessions were globally aligned using Mafft software with default parameters, and the pi value of each gene was calculated using Vcf tools. The results showed that rpl33 (LSC region) [0.005], psbI (LSC region) [0.003], rpl32 (SSC region) [0.002], rps16 (LSC region) [0.001], ndhD (SSC region) [0.001] and petD (LSC region) [0.001] had the highest divergence values (pi) and has an increased chance of utility as prospective markers in future studies (Figure 5A). On the other hand, most of the vastly varied intergenic sites were located in the LSC regions, followed by SSC regions and IR regions (Figure 5B and Figure S3). Nevertheless, ndhC_trnV-UAC (LSC region) [0.0053], trnL-UAA_trnF-GAA (LSC region) [0.0026], trnQ-UUG_psbK (LSC region) [0.0023], psaJ_rpl33 (LSC region) [0.002324] and ccsA_ndhD (SSC region) [0.0019] were considered hotspot regions with the highest divergence values (pi) (Figure 5B and Figure S3).

3.6. Inverted Repeat Expansion and Contraction

The three component regions of the P. mume cp genome are SSC, LSC and IR (Figure 6). The adjacent genes and junctions of the cp genome of ten accessions were well aligned. In the ten P. mume accessions (M01, M02, R01, R04, R03, R05, R02, R15, R16 and R17), the sizes of three regions and the boundaries are very similar. For instance, pseudogene gene rps19 was found in the LSC/IRb junction (JLB) in all the accessions. However, it is located in IRb region (Figure 6) in all P. mume accessions and expanded in the LSC region, with a length of 86 bp in M01, M02, R04, R03, R05, R16 and R17 and 82 bp in R01, R02 and R15. The ndhF gene (Figure 6) was found in the IRb/SSC (JSB) junction in the SSC region and expanded (18bp) in the IRb region. Moreover, there are two ycf1 genes in the cp genomes of all accessions. However, the IRb/SSC border extended into the ycf1(1050) gene in genomes with a short ycf1 pseudogene of 3 bp [40], whereas the ycf1 (4593 bp) gene was in the IRa/SSC (JSA) junction in the IRa region and expanded in the SSC region (Figure 6).

3.7. Sequence Analysis of ndhF-ycf1 Genes from Ten Prunus mume Accessions

The alignments of ycf1 and ndhF nucleotide sequences from ten P. mume accessions were completed and obtained as shown in Figure S5 using DNAMAN (Version V6; Lynnon Biosoft) [41], MEGAX and Jalview (version:11.1.4). The result showed some nucleotide substitutions on either side of the sequences of these sequences (ycf1 and ndhF) of cp genomes tested in general (Figure S5), with a similarity of 99.62–99.89%. In the ycf1 sequence, accessions R15, R16, R17, M01 and M02 from Zhejiang province have the same deletion from regions 2393 to 2407, whereas a deletion from regions 4111 to 4131 was detected in R01 and R02 from Jiangsu province, although no deletion/insertion was found in other P. mume accessions ( Figure S5A). In the ndhF sequence, there were neither insertions or deletions in the P. mume accessions, although there were substitutions (Figure S5B). However, we noticed that the nucleotide substitution number/rate in R15, R16, R17, M01, and M02 from Zhejiang province was high compared to that in other P. mume accessions.

3.8. Selective Pressure Analyses

The phylogenetic tree indicates that P. triloba, P. pedunculata, P. japonica, P. dictyoneura and P. humilis are sister groups, and they have a common ancestor, which can be assigned to the internal branch next to terminal branches with P.armeniaca or P. mume as leaves. To that end, we studied the positive selection of protein-coding genes in the chloroplast genomes of the Prunus species from this clade and that of P. mume. For each protein-coding gene, the codeml program in the PAML package was used to determine synonymous (dS) and non-synonymous (dN) substitution rates. The adaptive evolution of genes was investigated using the likelihood ratio test (LRT). Although the majority of genes had a dN/dS (i.e., value) less than 1.0, four genes (petL, ndhF, rpoC1 and rpl36) had a value greater than 1 (Figure 7), indicating that they are under positive selection. Additionally, we performed “Bayes empirical Bayes” (BEB) analysis under model M8 to further investigate the sites under positive selection of the related genes. As a result, we found “BEB” in rps16, rps3, rpoC1(4*), rpl32, rpl16, rbcL, psbF; petB, ndhF, clpP and ccsA genes (Additional File 1), i.e., sites with a BEB score higher than 0.5. The sites with BEB values higher than 0.95 are potentially under positive selection, as are denoted by asterisks. However, these sites were found only in the rpoC1 gene, implying that it is potentially under positive selection [35].

3.9. Phylogenetic Analysis among Prunus mume Accessions

Genes in a genome or from different genomes may have more copies in a respective genome, which may cause problems in the construction of phylogenetic trees [42]; therefore, we constructed four phylogenetic trees with four datasets: cp genome, IR, LSC and SSC. In general, P. mume accessions were consistently closely clustered together across all four trees (Figure 8 and Figure S6). The trees exhibited relatively similar topological structure, with minor rearrangement of the ten accessions in this study. However, the phylogenetic tree based on the cp genome showed that P. mume accessions, P. armeniaca, P. dictyoneura, P. humilis, P. japonica, P. triloba and P. pedunculata form a monophyletic group. Additionally, this tree indicates that P. mume NC_023798, P. mume accessions and P. armeniaca are more closely related than the other Prunus species. Using full plastomes only, R01 and R02 were clustered together; R04, R03 and R05 were clustered together; and R15, R16, R17, M01 and M02 clustered together, indicating that clustered genomes are highly conserved and almost identical (Figure 8 and Figure S6). These results indicate that P. mume accessions were mainly clustered according to their province in China (Figure 8, Figure S5 and Table 1): Zhejiang (M01, M02, R15, R16 and R17), Jiangsu (R01 and R02) and Sichuan (R04, R03 and R05) (Table 1).

4. Discussion

Morphological traits and fruit quality parameters of P. mume accessions were determined in this study (Figure 1, Figure 2 and Figure S2A–H). The leaves of ten accessions were found to be oval in shape, with R03 and R04 being slightly more oval than the others (Figure 1A). The leaf margin of all accessions were roughly toothed (Figure 1A). The veins on the dorsal face of the leaves of R01, R16 and R02 were purple in color compared to the others (Figure 1), which could be a distinctive feature for accessions. [43]. Apart from leaf diameter, leaf stalk, petal number and pistil length, other variables varied significantly (p < 0.05) among the ten accessions (Figure 2A–J and Figure S1A–H). For instance, M01, with an average leaf length of 7.57 cm, was statistically longer than other accessions and was only comparable to those of P. mume ‘clone 15’ (5.08 cm) [26] and accession types of “Koumé”, “Ume” (4.45 cm) and “Bungo” (5.46 cm) [43]. Flower diameter in M02 and R04, as well as anther number in R15 and R02, showed significant variation (Figure S1E–H). Flower diameter in M02 and R04 and anther number in R15 and R02 showed significant variation (Figure S1E–H). According to Chartier et al. [44], the flower is the most distinctive feature in angiosperms. However, we suggest that accessions M02, R04, R15 and R02 could be distinguished from other P. mume accessions by the significant difference in the related traits. The heaviest fruit weights were recorded in R16 (39.95 g) and R17 (37.89 g) and were not significantly different from those of other accessions, whereas the lightest fruit weights were recorded in R05, R03, R04 and M02 (Figure 3A), similar to commercial “Mei” fruit [45]. TSS and TAC values assessed among the accessions differed significantly (p < 0.05) (Figure 2A–J), with higher TSS concentration levels determined in R04, R05 (9.17%) and R01 (5.09%), which were relatively similar to accessions growing in the state of São Paulo (10.2–12.2% and 4.0–5.7%) [45]. In conclusion, certain accessions from the same regions are statistically similar in terms of agro-morphological traits, whereas others are statistically different. Furthermore, the trees based on morphological characters revealed that most of the evaluated accessions exhibited divergence at the node level. When the diversity of nodes is ignored, the majority of the accessions from the same province cluster consistently. The agro-morphological and pomological features revealed that the accessions studied from the same province are distinct. However, the interaction between environmental and genetic factors may have influenced their adaptation, contributing to their divergence. There was a statistically significant positive correlation between certain characteristics, such as fruit weight vs. fruit size (Figure 2). Mratinić et al. [46] also found a statistically significant positive correlation between the size and weight of fruit and stones in 24 apricot accessions. This indicates the possibility of simultaneously improving at least two traits without any tradeoff effect.
The main features of ten sequenced cp genomes of Japanese apricot accessions from different provinces were compared, eight of which had previously been resequenced by our research group for other studies [47]. The cp genomes of all accessions were similar in structure and composition but with an exceptional slight difference in the genome size of R02 (158,150 bp), R01 (158,143 bp), R05 (157,922 bp), R04 (157,918 bp) and R03 (157,915 bp). We also noticed that R15, R16, R17, M01 and M02 from Zhejiang province had the same size (157,903 bp) (Table S2). This variation could have resulted from the borders of IR regions due to their expansion or contraction. They also share several similar characteristics with other Prunus species, such as P. avium ‘Summit’ [48].The total GC contents of the assessed accessions varied from 36.73 to 36.74% (Table S2) and were similar to those of other Prunus species, such as P. armeniaca (36.75%) [9].
A comparative analysis of cp genome sequences revealed intrinsic genetic information. For example, AccD, clpP, rpoA, ycf1 and ycf2 genes were diversity hotspots in Bignoniaceae species cp genomes. Among these, ycf1 had the highest nucleotide diversity, as evidenced by numerous y sites subject to positive selection [49]. GC content was significantly higher in the IR regions of the cp genome compared to SSC and LSC regions (Table S2). Xue [9] reported similar findings on the cp genome of some Prunus species, which could be due to high GC content of the eight identified rRNA genes in the IR region. The contraction and expansion of the SSC, LSC and IR regions during angiosperm evolution are mainly responsible for the reported variation in cp genome length [50]. Contraction and expansion of the IR region can lead to the creation of pseudogenes [51]. However, our findings show that ycf1 was located in the JSA region (SSC/IRa), whereas rps19 was found at the IRb/LSC intersection (Figure 6). rps19 has been detected at the LSC/IRa border of some Cardiocrinum (Liliaceae) species [52], possibly as a result of incomplete duplication and its incapacity to encode proteins.
In the present study, a total of 248 SSRs were detected in R02, followed by 247 SSRs in R15, R16, R17, M01 and M02 from Zhejiang province and 246 SSRs in R01, R04, R03 and R05. These identified SSRs were classified as mononucleotide, dinucleotide, trinucleotide, tetranucleotide, pentanucleotide and hexanucleotide repeats. The most abundant single-sequence repeats (SSRs) were single-nucleotide repeats (Table 2), which were also identified in species such as Quercus [39] and Primula [53]. They are widely used as molecular markers in evolutionary and population genetic studies [54]. As a result, SSR plastids are often rich in poly-T and poly-A but may also contain tandem repeats of cytosine (C) and guanine (G) [55]. An earlier study revealed that this deviation is related to the ease of A–T alteration in the plant cp genome compared to G-C alteration [56]. Moreover, we observed that in most of the repeat sequences, the length of the sequence was between 30 and 40 bp, similar to what was identified in P. bournei and P. chekiangensis [57]. The most repeat sequences were observed in R01, with 52 repeat sequences, followed by R03, R05, R15, R17, M01 and M02, with 46 repeats sequences, and R04 and R02, with 45 repeat sequences. In contrast, the minimum number of repeat sequences was detected in R16, with 40 repeats sequence. Furthermore, palindromic (P) repeats were dominant, ranging from 24 (R02) to 26 (R04, R03 and R05), followed by forward (F) repeats, ranging from 14 (R04, R03 and R05) in Sichuan Province to 21 (R01 and R02) in Jiangsu Province, and reversed (R) repeats, ranging from 0 (R02 and R16) to 6 (R01, R03, R05, R15, R17, M01 and M02) (Table 3). The accessions from the same province of origin had the same number of forward(F) repeat sequences: 14 F in R04, R03 and R05 from Sichuan; 15 F in R15, R16, R17, M01 and M02 from Zhejiang; and 21 F in R01 and R02 from Jiangsu. Forward repeat sequences can be used for accession identification.
Codon usage is important for genetic information transmission and plant evolution [58]. In this study, P. mume accessions were found to encode an equal number (21) of distinct amino acids; the number of codons varied by a small margin between 26,509 and 26,518, depending the accession, similar to those in some angiosperms, such as S. grosvenorii and S. siamensis [59]. The codon abilities of R03, R04 and R05 (26,518 codons) from Sichuan were slightly stronger than those of R15, R16, R17, M01 and M02 (26,511 codons) from Zhejiang, whereas R01 and R02 from Jiangsu had 26,509 codons. Codon number can be useful in identifying which province an accession is from. Leucine and cysteine were the most used amino acids with higher values (10.45–10.44%) and a lower value (1.18%). However, similar findings were reported in two sugarcane ancestors, i.e., Saccharum spontaneum and S. officinarum [60]. Codon preference is an ubiquitous occurrence in plants; in our study, AUG was the most preferred codon, which encodes the amino acid methionine (Met) (with 1.9968% RSCU); after AUG, the codon UUA follows suit, with a 1.9554–1.9620% RSCU, encoding leucine (Leu), and the GUG start codon in translation encodes the amino acid methionine (Met) (0.0032 RSCU), with similar results in all accessions (Table S4). The most often used codons in a subspecies of P. hopeiensis are ATT, AAA, GAA, AAT and TTT [61].This finding proves that various green plants species have varied codon usage preferences, and this divergence could be a result of an evolutionary process. Nucleotide diversity analysis revealed that the most significant regions of divergence were among rpl33, psbI, rpl32, rps16, ndhD and petD genes (Figure 5). Among these, rps16 was previously identified as a gene with more divergent regions in Streptocarpus ionanthus [62], as well as in some other species, e.g., in almond trees (Prunus spp. L.) [63]. In previous studies, the petD gene has been detected in Amphilophium (Bignonieae, Bignoniaceae) [64] and rps16 and ndhD have been detected in Prunus species [9]. In addition, positive selection analysis using PAML software revealed the presence of four genes (rpoC1, rpl36, ndhF and petL) that were positively selected and could be associated with adaptation. We also identified intergenic regions among them, including ndhC_trnV-UAC, atpB_rbcL, trnL-UAA_trnF-GAA and rbcL_accD, which were previously found in four Bulbophyllum species [65]. On the other hand, Bayes empirical Bayes (BEB) analysis revealed that the rpoC1 gene is potentially subjected to positive selection. These findings could be useful in examining phylogenetic relationships among Prunus species, P. mume populations and adaptive evolution analysis.
The results of this study show that nucleotide substitutions and insertions/deletions induced variation in gene sequences (ycf1 and ndhF) of the tested P. mume tested (Figure S5). In the ycf1 sequence, nucleotide deletion ranged from 2393 to 2407. R15, R16, R17, M01 and M02 had nucleotides deleted from 2393 to 2407 regions. We also discovered that a majority of the same deletions in the ycf1 sequence are related to P. mume accessions from the same province in China (Figure S5A, Figure 8, Figure S6 and Table 1 ) and consistent with phylogenetic results. Therefore, these could be a key index/indicator for research and could be useful for the geographic identification of Prunus and P. mume accessions.
The phylogenetic tree based on the cp genome revealed that P. mume NC_023798, P. mume accessions and P.armeniaca are more closely related than other Prunus species and that P. armeniaca is closely related to P. mume, NC-023798.1, R01 and R02. However, the phylogenetic tree suggests that P. armeniaca and P. mume (including R01 and R02) have a close relationship, indicating that they diverged. This could be due to the genetic heterogeneity in P. mume, which includes numerous accessions with Prunus armeniaca characteristics as a result of natural crossing [18]. Furthermore, the topological structure of the four trees was found to be comparatively similar with tested accessions but with minor rearrangement. This suggests that the 10 tested genomes are similar, probably due to repetitive contraction and expansion of the genome/regions, a known evolutionary occurrence in plants [66,67], resulting in differences in the lengths of angiosperm plastid genomes [68]. The 10 tested accessions formed subclusters, possibly due to their genetic and geographic diversity. For instance, R01 and R02 from the same province grouped together, as shown in Figure 6, as they share the same nucleotide diversity/deletions from 4111 to 4131 regions in the ycf1 sequence. The same number of SSRs (247) was found in the accessions from Zhejiang province (R15, R16, R17, M01 and M02). Phylogenetic inference can also be related to structural disparity and the presence/absence of genes in the genomes [17,69], indicating the possibility of limiting accessions based on to their province/region of origin.

5. Conclusions

In this study, we found that plastid genomes of different accessions have the same structure and composition, with a higher similarity to those of the Prunus genus, with minor divergences. The sequences (ycf1 and ndhF) of the analyzed accessions showed variation in nucleotides due deletion. Similar to nucleotide deletions in the ycf1 sequence, SSR number and phylogenetic trees revealed that accessions from the same ancestral provinces were principally grouped together. R01 and R02 were clustered together in four tree datasets, indicating that their genomes are highly conserved and identical. This study provides additional knowledge on plastid diversity and agro-morphological variability among different accessions. These genetic and phenotypic resources can be utilized for future research on different accessions/populations of Japanese apricot and other related genera or species.

Supplementary Materials

The following are available online at https://www.mdpi.com/article/10.3390/horticulturae8090794/s1, Table S1: Agroecological and environmental information from the National Field Genebank for Prunus mume, Nanjing, Jiangsu, China; Table S2: Summary statistics for the assembly of ten Punus mume accessions; Table S3: Classification of Prunus mume chloroplast genes according to their functions; Table S4: Coding capacity of protein-coding genes (PCGs) and relative synonymous codon usage (RSCU) of the accessions of Prunus mume; Figure S1: Agro-morphological characteristics of the 10 accessions of Japanese apricot (Prunus mume Sieb. et Zucc.): R01, R04, R03, R05, R02, R15, R16, R17, M01 and M02. (A) Leaf length; (B) leaf diameter; (c) leaf stock; (D) leaf tip; (E) anther number; (F) petal number; (G) flower diameter; (H) pistil length. The bars in each figure represent the mean of the three replicates, and error bars represent standard error. The bars with common letters on top indicate no significant difference according to post hoc means comparison with Duncan’s multiple range test at p < 0.05, whereas those with different letters indicate significant difference at p < 0.05; Figure S2: Tree of morphological features of the accessions of Prunus mume based on the maximum likelihood approach using Mesquite via mapping of encoded characters using modular Mesquite software. (A) Fruit lateral height (mm) (B); fruit longitudinal height (mm); (C) fruit stone lateral height (mm); (D); fruit stone longitudinal height (mm); (E) fruit stone transversal height (mm); (F) fruit stone weight (g); (G) fruit transversal height (mm); (H) fruit weight (I) leaf diameter; (J) leaf stock; (K) leaf tip; (L) TAC (%); (M) TSS%.; Figure S3: Chloroplast genome map of Prunus mume. Genes encoded in the forward direction are located outside the circle, and genes encoded in the reverse direction are located inside the circle. The gray circle inside represents the GC content; Figure S4: Frequency of repeat sequences of the ten P. mume accessions’ chloroplast genomes; Figure S5: (A) Alignment of the nucleotide sequences of the Ycf1 and ndhF genes of Prunus mume accessions; (B) alignment of the nucleotide sequences of the ndhF gene. R01, R04, R03, R05, R02, R15, R16, R17, M01 and M02; Figure S6: Phylogenetic trees of P. mume accession cp genomes built by the maximum likelihood evolution tree: (A) LSC tree, (B) SSC tree, (C) IR tree. R01, R04, R03, R05, R02, R15, R16, R17, M01 and M02.

Author Contributions

Conceptualization, Z.G.; formal analysis, X.H., S.I., K.O.O. and F.H.; funding acquisition, Z.G.; methodology, S.I.; project administration, Z.G.; resources, Z.N., W.T., G.H. and C.M.; software, D.C., S.I. and M.M.; visualization, S.I.; writing—original draft, D.C. and S.I.; Writing—review and editing, S.T., S.I., B.K. and Z.G. All authors have read and agreed to the published version of the manuscript.

Funding

This study was supported by the “JBGS” Project of Seed Industry Revitalization in Jiangsu Province (JBG (2021) 019), the Fundamental Research Funds for the Central Universities (KYZZ2022004) and the National Natural Science Foundation of China (31971703).

Institutional Review Board Statement

Not applicable.

Informed Consent Statement

Not applicable.

Data Availability Statement

All data analyzed or generated during the present study are included in this manuscript and the Supplementary Materials. The complete newly sequenced cp genomes of Prunus mume accessions were submitted to NCBI under accession nos. MW759299 (M01) and MW759300 (M02). The complete chloroplast genome sequences used in the current study were downloaded from the NCBI Genbank (https://www.ncbi.nlm.nih.gov), and the accession numbers can be found in Table 1.

Acknowledgments

Thanks to all the researchers for their contribution to this study.

Conflicts of Interest

The authors declare no conflicting interest.

Abbreviations

cpchloroplast
bpbase pairs
SSCSmall single-copy
IRInverted repeat
LSCLarge single copy
SSR Single-sequence Repeat
RSCURelative synonymous codon usage
TSSTotal soluble solids
TACTitratable acid content

References

  1. Bock, R.; Knoop, V. Genomics of Chloroplasts and Mitochondria; Springer Science & Business Media: New York, NY, USA, 2012; Volume 35. [Google Scholar]
  2. Ris, H.; Plaut, W. Ultrastructure of DNA-containing areas in the chloroplast of Chlamydomonas. J. Cell Biol. 1962, 13, 383–391. [Google Scholar] [CrossRef] [PubMed]
  3. Timmis, J.N.; Ayliffe, M.A.; Huang, C.Y.; Martin, W. Endosymbiotic gene transfer: Organelle genomes forge eukaryotic chromosomes. Nat. Rev. Genet. 2004, 5, 123–135. [Google Scholar] [CrossRef] [PubMed]
  4. Dyall, S.D.; Brown, M.T.; Johnson, P.J. Ancient invasions: From endosymbionts to organelles. Science 2004, 304, 253–257. [Google Scholar] [CrossRef]
  5. Price, D.C. Genome Elucidates Origin of Photosynthesis Cyanophora paradoxa. Science 2012, 1213561, 335. [Google Scholar] [CrossRef] [PubMed]
  6. Mustárdy, L.; Buttle, K.; Steinbach, G.; Garab, G.Z. The three-dimensional network of the thylakoid membranes in plants: Quasihelical model of the granum-stroma assembly. Plant Cell 2008, 20, 2552–2557. [Google Scholar] [CrossRef]
  7. Neuhaus, H.; Emes, M. Nonphotosynthetic metabolism in plastids. Annu. Rev. Plant Biol. 2000, 51, 111–140. [Google Scholar] [CrossRef]
  8. Li, X.; Tan, W.; Sun, J.; Du, J.; Zheng, C.; Tian, X.; Zheng, M.; Xiang, B.; Wang, Y. Comparison of Four Complete Chloroplast Genomes of Medicinal and Ornamental Meconopsis Species: Genome Organization and Species Discrimination. Sci. Rep. 2019, 9, 10567. [Google Scholar] [CrossRef]
  9. Xue, S.; Shi, T.; Luo, W.; Ni, X.; Iqbal, S.; Ni, Z.; Huang, X.; Yao, D.; Shen, Z.; Gao, Z. Comparative analysis of the complete chloroplast genome among Prunus mume, P. armeniaca, and P. salicina. Hortic. Res. 2019, 6, 89. [Google Scholar] [CrossRef]
  10. Peredo, E.L.; King, U.M.; Les, D.H. The plastid genome of Najas flexilis: Adaptation to submersed environments is accompanied by the complete loss of the NDH complex in an aquatic angiosperm. PLoS ONE 2013, 8, e68591. [Google Scholar]
  11. Köhler, M.; Reginato, M.; Souza-Chies, T.T.; Majure, L.C. Insights into chloroplast genome evolution across opuntioideae (Cactaceae) reveals robust yet sometimes conflicting phylogenetic topologies. Front. Plant Sci. 2020, 11, 729. [Google Scholar] [CrossRef]
  12. Hodel, R.G.; Zimmer, E.; Wen, J.J. A phylogenomic approach resolves the backbone of Prunus (Rosaceae) and identifies signals of hybridization and allopolyploidy. Mol. Phylogenetics Evol. 2021, 160, 107118. [Google Scholar] [CrossRef] [PubMed]
  13. Wang, S.; Shi, C.; Gao, L.-Z. Plastid genome sequence of a wild woody oil species, Prinsepia utilis, provides insights into evolutionary and mutational patterns of Rosaceae chloroplast genomes. PLoS ONE 2013, 8, e73946. [Google Scholar] [CrossRef] [PubMed]
  14. Song, Y.; Dong, W.; Liu, B.; Xu, C.; Yao, X.; Gao, J.; Corlett, R.T. Comparative analysis of complete chloroplast genome sequences of two tropical trees Machilus yunnanensis and Machilus balansae in the family Lauraceae. Front. Plant Sci. 2015, 6, 662. [Google Scholar] [CrossRef] [PubMed]
  15. Amar, M.H. Biotechnology. ycf 1-ndh F genes, the most promising plastid genomic barcode, sheds light on phylogeny at low taxonomic levels in Prunus persica. J. Genet. Eng. 2020, 18, 42. [Google Scholar]
  16. Numaguchi, K.; Akagi, T.; Kitamura, Y.; Ishikawa, R.; Ishii, T. Interspecific introgression and natural selection in the evolution of Japanese apricot (Prunus mume). Plant J. 2020, 104, 1551–1567. [Google Scholar] [CrossRef]
  17. Wu, C.-S.; Wang, Y.-N.; Hsu, C.-Y.; Lin, C.-P.; Chaw, S.-M. Loss of different inverted repeat copies from the chloroplast genomes of Pinaceae and cupressophytes and influence of heterotachy on the evaluation of gymnosperm phylogeny. Genome Biol. Evol. 2011, 3, 1284–1295. [Google Scholar] [CrossRef]
  18. My, C. China Fruit Records-Mei; China Forestry Press: Beijing, China, 1999; pp. 97–188. [Google Scholar]
  19. Shimada, T.; Haji, T.; Yamaguchi, M.; Takeda, T.; Nomura, K.; Yoshida, M. Classification of mume (Prunus mume Sieb. et Zucc.) by RAPD assay. J. Jpn. Soc. Hortic. 1994, 63, 543–551. [Google Scholar] [CrossRef]
  20. Reyes, E.; Nadot, S.; Von Balthazar, M.; Schoenenberger, J.; Sauquet, H. Testing the impact of morphological rate heterogeneity on ancestral state reconstruction of five floral traits in angiosperms. Sci. Rep. 2018, 8, 9473. [Google Scholar] [CrossRef]
  21. Stevens, P. Angiosperm Phylogeny Website. Available online: http://www.mobot.org/MOBOT/research/APweb (accessed on 12 January 2022).
  22. Sauquet, H.; Von Balthazar, M.; Magallón, S.; Doyle, J.A.; Endress, P.K.; Bailes, E.J.; de Morais, E.B.; Bull-Hereñu, K.; Carrive, L.; Chartier, M. The ancestral flower of angiosperms and its early diversification. J. Nat. Commun. 2017, 8, 16047. [Google Scholar] [CrossRef]
  23. Byrne, M.; Macdonald, B.; Brand, J. Phylogeography and divergence in the chloroplast genome of Western Australian Sandalwood (Santalum spicatum). Heredity 2003, 91, 389–395. [Google Scholar] [CrossRef]
  24. Heritage, S. MBASR: Workflow-simplified ancestral state reconstruction of discrete traits with MrBayes in the R environment. bioRxiv 2021. [Google Scholar]
  25. Gao, L.; Su, Y.J.; Wang, T. Plastid genome sequencing, comparative genomics, and phylogenomics: Current status and prospects. J. Syst. Evol. 2010, 48, 77–93. [Google Scholar] [CrossRef]
  26. Mayer, N.A.; Pereira, F.M.; Môro, F.V.J.R.B.d.F. Caracterização morfológica de três genótipos de umezeiro selecionados como porta-enxertos para pessegueiro. Rev. Bras. De Frutic. 2008, 30, 716–722. [Google Scholar] [CrossRef]
  27. Cao, J.K.J.W.B.; Zhao, Y.M. Study on Physiology and Biochemistry of Fruits and Vegetables after Harvest; China Light Industry Press: Beijing, China, 2007; pp. 2054–2125. [Google Scholar]
  28. Simko, T.W.a.V. R Package “Corrplot”: Visualization of a Correlation Matrix (Version 0.84). Available online: https://github.com/taiyun/corrplot (accessed on 15 June 2017).
  29. Doyle, J.J.; Doyle, J.L. A Rapid DNA Isolation Procedure for Small Quantities of Fresh Leaf Tissue. Phytochem. Bull. 1987, 19, 11–15. [Google Scholar]
  30. Bankevich, A.; Nurk, S.; Antipov, D.; Gurevich, A.A.; Dvorkin, M.; Kulikov, A.S.; Lesin, V.M.; Nikolenko, S.I.; Pham, S.; Prjibelski, A.D.; et al. SPAdes: A New Genome Assembly Algorithm and Its Applications to Single-Cell Sequencing. J. Comput. Biol. 2012, 19, 455–477. [Google Scholar] [CrossRef]
  31. Jansen, R.K.; Saski, C.; Lee, S.-B.; Hansen, A.K.; Daniell, H. Complete plastid genome sequences of three rosids (Castanea, Prunus, Theobroma): Evidence for at least two independent transfers of rpl22 to the nucleus. Mol. Biol. Evol. 2011, 28, 835–847. [Google Scholar] [CrossRef] [PubMed]
  32. Capella-Gutiérrez, S.; Silla-Martínez, J.M.; Gabaldón, T. trimAl: A tool for automated alignment trimming in large-scale phylogenetic analyses. Bioinformatics 2009, 25, 1972–1973. [Google Scholar] [CrossRef]
  33. Stamatakis, A. RAxML version 8: A tool for phylogenetic analysis and post-analysis of large phylogenies. Bioinformatics 2014, 30, 1312–1313. [Google Scholar] [CrossRef]
  34. Darriba, D.; Posada, D.; Kozlov, A.M.; Stamatakis, A.; Morel, B.; Flouri, T. ModelTest-NG: A new and scalable tool for the selection of DNA and protein evolutionary models. Mol. Biol. Evol. Bioinform. 2020, 37, 291–294. [Google Scholar] [CrossRef]
  35. Gao, F.; Chen, C.; Arab, D.A.; Du, Z.; He, Y.; Ho, S.Y. EasyCodeML: A visual tool for analysis of selection using CodeML. Ecol. Evol. Bioinform. 2019, 9, 3891–3898. [Google Scholar] [CrossRef]
  36. Lewis, P.O. A likelihood approach to estimating phylogeny from discrete morphological character data. Syst. Biol. 2001, 50, 913–925. [Google Scholar] [CrossRef] [PubMed]
  37. Pagel, M. The maximum likelihood approach to reconstructing ancestral character states of discrete characters on phylogenies. Syst. Biol. 1999, 48, 612–622. [Google Scholar] [CrossRef]
  38. Jeon, J.-H.; Kim, S.-C. Comparative analysis of the complete chloroplast genome sequences of three closely related East-Asian wild roses (Rosa sect. Synstylae; Rosaceae). Genes 2019, 10, 23. [Google Scholar] [CrossRef] [PubMed]
  39. Yang, Y.; Zhou, T.; Duan, D.; Yang, J.; Feng, L.; Zhao, G. Comparative analysis of the complete chloroplast genomes of five Quercus species. Front. Plant Sci. 2016, 7, 959. [Google Scholar] [CrossRef] [Green Version]
  40. Du, Z.; Lu, K.; Zhang, K.; He, Y.; Wang, H.; Chai, G.; Shi, J.; Duan, Y. The chloroplast genome of Amygdalus L. (Rosaceae) reveals the phylogenetic relationship and divergence time. BMC Genom. 2021, 22, 645. [Google Scholar] [CrossRef]
  41. Thompson, J.D.; Higgins, D.G.; Gibson, T.J. CLUSTAL W: Improving the sensitivity of progressive multiple sequence alignment through sequence weighting, position-specific gap penalties and weight matrix choice. Nucleic Acids Res. 1994, 22, 4673–4680. [Google Scholar] [CrossRef]
  42. Michu, E. A short guide to phylogeny reconstruction. Plant Soil Environ. 2007, 53, 442. [Google Scholar] [CrossRef]
  43. Tzonev, R.; Haji, T.; Yamaguchi, M. A contribution to the apricot taxonomy: Investigation on the flowers, leaves and shoots of some European cultivars and Asian Prunus species. In Proceedings of the XI International Symposium on Apricot Culture 488, Veria-Makedonia, Greece, 25 May 1997; pp. 243–246. [Google Scholar]
  44. Chartier, M.; Jabbour, F.; Gerber, S.; Mitteroecker, P.; Sauquet, H.; von Balthazar, M.; Staedler, Y.; Crane, P.R.; Schönenberger, J. The floral morphospace–a modern comparative approach to study angiosperm evolution. New Phytol. 2014, 204, 841–853. [Google Scholar] [CrossRef]
  45. Quast, E.; Vieira, I.; Nogueira, A.; Schmidt, F.L. Chemical and physical characterization of mume fruit collected from different locations and at different maturity stages in São Paulo State. Food Sci. Technol. 2013, 33, 441–445. [Google Scholar] [CrossRef]
  46. Mratinić, E.; Rakonjac, V.; Milatović, D. Genetic parameters of yield and morphological fruit and stone properties in apricot. Genetika 2007, 39, 315–324. [Google Scholar] [CrossRef]
  47. Shi, T.; Luo, W.; Li, H.; Huang, X.; Ni, Z.; Gao, H.; Iqbal, S.; Gao, Z. Association between blooming time and climatic adaptation in Prunus mume. Ecol. Evol. 2020, 10, 292–306. [Google Scholar] [CrossRef] [PubMed]
  48. Zhao, X.; Yan, M.; Ding, Y.; Huo, Y.; Yuan, Z. Characterization and comparative analysis of the complete chloroplast genome sequence from Prunus avium ‘Summit’. PeerJ 2019, 7, e8210. [Google Scholar] [CrossRef]
  49. Sobreiro, M.B.; Vieira, L.D.; Nunes, R.; Novaes, E.; Coissac, E.; Silva-Junior, O.B.; Grattapaglia, D.; Collevatti, R.G. Chloroplast genome assembly of Handroanthus impetiginosus: Comparative analysis and molecular evolution in Bignoniaceae. Planta 2020, 252, 91. [Google Scholar] [CrossRef] [PubMed]
  50. Ni, L.; Zhao, Z.; Dorje, G.; Ma, M. The complete chloroplast genome of Ye-Xing-Ba (Scrophularia dentata; Scrophulariaceae), an alpine Tibetan herb. PLoS ONE 2016, 11, e0158488. [Google Scholar] [CrossRef] [Green Version]
  51. Li, C.; Zheng, Y.; Huang, P. Molecular markers from the chloroplast genome of rose provide a complementary tool for variety discrimination and profiling. Sci. Rep. 2020, 10, 12188. [Google Scholar] [PubMed]
  52. Lu, R.-S.; Li, P.; Qiu, Y.-X. The complete chloroplast genomes of three Cardiocrinum (Liliaceae) species: Comparative genomic and phylogenetic analyses. Front. Plant Sci. 2017, 7, 2054. [Google Scholar] [CrossRef] [PubMed]
  53. Ren, T.; Yang, Y.; Zhou, T.; Liu, Z.-L. Comparative plastid genomes of Primula species: Sequence divergence and phylogenetic relationships. Int. J. Mol. Sci. 2018, 19, 1050. [Google Scholar] [CrossRef]
  54. Kaur, S.; Panesar, P.S.; Bera, M.B.; Kaur, V. Simple sequence repeat markers in genetic divergence and marker-assisted selection of rice cultivars: A review. Crit. Rev. Food Sci. Nutr. 2015, 55, 41–49. [Google Scholar] [CrossRef]
  55. Shen, X.; Wu, M.; Liao, B.; Liu, Z.; Bai, R.; Xiao, S.; Li, X.; Zhang, B.; Xu, J.; Chen, S. Complete chloroplast genome sequence and phylogenetic analysis of the medicinal plant Artemisia annua. Molecules 2017, 22, 1330. [Google Scholar] [CrossRef]
  56. Xie, D.-F.; Yu, Y.; Deng, Y.-Q.; Li, J.; Liu, H.-Y.; Zhou, S.-D.; He, X.-J. Comparative analysis of the chloroplast genomes of the Chinese endemic genus Urophysa and their contribution to chloroplast phylogeny and adaptive evolution. Int. J. Mol. Sci. 2018, 19, 1847. [Google Scholar] [CrossRef]
  57. Li, Y.; Xu, W.; Zou, W.; Jiang, D.; Liu, X. Complete chloroplast genome sequences of two endangered Phoebe (Lauraceae) species. Bot. Stud. 2017, 58, 37. [Google Scholar] [CrossRef] [PubMed]
  58. Ivanova, Z.; Sablok, G.; Daskalova, E.; Zahmanova, G.; Apostolova, E.; Yahubyan, G.; Baev, V. Chloroplast genome analysis of resurrection tertiary relict Haberlea rhodopensis highlights genes important for desiccation stress response. Front. Plant Sci. 2017, 8, 204. [Google Scholar] [CrossRef] [PubMed]
  59. Shi, H.; Yang, M.; Mo, C.; Xie, W.; Liu, C.; Wu, B.; Ma, X. Complete chloroplast genomes of two Siraitia Merrill species: Comparative analysis, positive selection and novel molecular marker development. PLoS ONE 2019, 14, e0226865. [Google Scholar] [CrossRef] [PubMed]
  60. Xu, F.; He, L.; Gao, S.; Su, Y.; Li, F.; Xu, L. Comparative Analysis of two Sugarcane Ancestors Saccharum officinarum and S. spontaneum based on Complete Chloroplast Genome Sequences and Photosynthetic Ability in Cold Stress. Int. J. Mol. Sci. 2019, 20, 3828. [Google Scholar] [CrossRef] [Green Version]
  61. Li, Y.; Li, J.Z.L.; Gao, L.; Xu, J.; Yang, M. Structural and Comparative Analysis of the Complete Chloroplast Genome of Pyrus hopeiensis “Wild Plants with a Tiny Population”and Three Other Pyrus Species. Int. J. Mol. Sci. 2018, 19, 3262. [Google Scholar] [CrossRef]
  62. Kyalo, C.M.; Li, Z.-Z.; Mkala, E.M.; Malombe, I.; Hu, G.-W.; Wang, Q.-F. The First Glimpse of Streptocarpus ionanthus (Gesneriaceae) Phylogenomics: Analysis of Five Subspecies’ Chloroplast Genomes.Plants. Plants 2020, 18, 456. [Google Scholar] [CrossRef]
  63. Liu, H.; Xia, M.; Xiao, Q.; Fang, J.; Wang, A.; Chen, S.; Zhang, D. Characterization of the complete chloroplast genome of Linnaea borealis, a rare, clonal self-incompatible plant. Mitochondrial DNA Part B 2020, 5, 200–201. [Google Scholar] [CrossRef]
  64. Thode, V.A.; Lohmann, L.G. Comparative chloroplast genomics at low taxonomic levels: A case study using Amphilophium (Bignonieae, Bignoniaceae). Front. Plant Sci. 2019, 10, 796. [Google Scholar] [CrossRef]
  65. Tang, H.; Tang, L.; Shao, S.; Peng, Y.; Li, L.; Luo, Y. Chloroplast genomic diversity in Bulbophyllum section Macrocaulia (Bl.) Aver.(Orchidaceae, Epidendroideae, Malaxideae): Insights into species divergence and adaptive evolution. Plant Divers. 2021, 43, 350–361. [Google Scholar] [CrossRef]
  66. Davis, J.I.; Soreng, R.J. Migration of endpoints of two genes relative to boundaries between regions of the plastid genome in the grass family (Poaceae). Am. J. Bot. 2010, 97, 874–892. [Google Scholar] [CrossRef]
  67. Huang, H.; Shi, C.; Liu, Y.; Mao, S.-Y.; Gao, L.-Z. Thirteen Camellia chloroplast genome sequences determined by high-throughput sequencing: Genome structure and phylogenetic relationships. BMC Evol. Biol. 2014, 14, 151. [Google Scholar] [CrossRef] [PubMed]
  68. Kim, K.-J.; Lee, H.-L. Complete chloroplast genome sequences from Korean ginseng (Panax schinseng Nees) and comparative analysis of sequence evolution among 17 vascular plants. DNA Res. 2004, 11, 247–261. [Google Scholar] [CrossRef] [PubMed]
  69. Wu, H.; Ma, P.-F.; Li, H.-T.; Hu, G.-X.; Li, D.-Z. Comparative plastomic analysis and insights into the phylogeny of Salvia (Lamiaceae). Plant Divers. 2020, 43, 15–26. [Google Scholar] [CrossRef] [PubMed]
Figure 1. Leaf and fruit samples of the 10 accessions of Prunus mume: (A) leaf; (B) fruit. The 10 accessions comprised R05, M02, R01, R03, R16, R15, R1, R02, M01 and R04.
Horticulturae 08 00794 g001
Figure 2. Fruit quality parameters among the 10 accessions of Japanese apricot (Prunus mume): R05, M02, R01, R03, R16, R15, R1, R02, M01 and R04: (A) fruit weight; (B) longitudinal height; (C) transversal height; (D) lateral height; (E) stone weight; (F) stone longitudinal height; (G) stone transversal height; (H) stone lateral height; (I) total soluble solids; (J) titratable acid content. The bars in each figure represent the mean of three replicates, and error bars represent standard error of means. The bars with a common letter on top indicate no significant difference according to post hoc mean comparison with Duncan’s multiple range test at p < 0.05, whereas those with different letters indicate significant differences at p < 0.05.
Horticulturae 08 00794 g002
Figure 3. Tree of morphological features of Prunus mume accessions based on the maximum likelihood approach using Mesquite via mapping of encoded characters. Trees of selected morphological characters generated using modular Mesquite software; (A) flower diameter; (B) petal number; (C) pistil length (mm); (D) anther number.
Horticulturae 08 00794 g003
Figure 4. Correlation coefficient matrix showing associations of fruit quality traits among the 10 accessions of Prunus mume. Fruit quality parameters: total soluble solids (TSS), fruit stone weight (FSW), fruit stone longitudinal height (FSLgH), fruit stone transversal height (FSTH), titratable acid content (TAC), fruit stone lateral height (FSLH), fruit longitudinal height (FLgH), fruit lateral height (FLH), fruit weight (FW) and fruit transversal height (FTH). The correlation coefficients with asterisks (*) indicate significance at two-tailed p < 0.05.
Horticulturae 08 00794 g004
Figure 5. Comparative analysis of nucleotide diversity (Pi) values among the cp genome sequences of Prunus mume accessions. (A) Nucleotide diversity (Pi) values in the large single-copy (LSC) and small single-copy (SSC) trees and inverted repeat (IR) regions. (B) Nucleotide diversity (pi) values of intergenic regions in the LSC, SSC and IR regions. Gene nucleic acid diversity (pi) line chart. The abscissa denotes the gene name, and the ordinate denotes the pi value.
Horticulturae 08 00794 g005
Figure 6. Analysis of changes in the boundaries of small single-copy, large single-copy and inverted repeat regions in the chloroplast genome among the ten Prunus mume accessions: R05, M02, R01, R03, R16, R15, R1, R02, M01 and R04.
Horticulturae 08 00794 g006
Figure 7. Positive selection analysis among Prunus species. The abscissa denotes the gene name, and the ordinate denotes the dN/dS ratio value.
Horticulturae 08 00794 g007
Figure 8. Phylogenetic trees of Prunus mume accessions based on whole cp genomes. Bootstrap support values shown near the nodes or below branches.
Horticulturae 08 00794 g008
Table 1. Accessions name, accession number and origin of the two newly sequenced and eight previously sequenced Japanese apricot (Prunus mume) accessions available at Nanjing Agricultural University.
Prunus mume Accessions NameAccession NumberCity of Origin Province of Origin Designation
NanhongmeiMW755873NanjingJiangsuR01
HongguangmeiMW755879SuzhouJiangsuR02
SichuanqingmeiMW755875DayiSichuanR03
SichuanbaimeiMW755874DayiSichuanR04
SichuanhuangmeiMW755877DayiSichuanR05
RuantiaohongmeiMW755885ChaoshanZhejiangR15
XiaoyezhuganMW755886ChaoshanZhejiangR16
Qingjia No.2MW755887ChaoshanZhejiangR17
ZaohongMW759299FenghuaZhejiangM01
Changnong No.17MW759300ChangxingZhejiangM02
Table 2. Types and number of SSRs in the chloroplast genomes of Prunus mume accessions.
SSR TypeRepeat Unit R01R04R03R05R02R15R16R17M01M02
MonoA63646464636464646464
T86858585888686868686
C5555555555
G3333333333
DiAT7777777777
TA5555555555
TC1111111111
TriAAC/AAG/AGA/ GAA/TTG2222222222
AAT3333333333
ACC/ACT/AGC/ATC/ ATG/CAA/CAG/CCA1111111111
ATA7777777777
CTT/TCT4444444444
GAT/GCA/GCT/GGA/
GGT/GTG/GTT/TAG/TGC
1111111111
TAA/TTC6666666666
TAT/TTA5555555555
AAAT2222222222
TetraAATA/ATAA/TTGA/
TTTA/TTTC
1111111111
PentaAAAAT1000100000
TTTGA1111111111
HexaATCTAT0111011111
Table 3. Types and number of repeat sequence in the chloroplast genomes of Prunus mume accessions.
TypeR01R04R03R05R02R15R16R17M01M02
F21141414211515151515
P25262626242525252525
R6566060666
C0000000000
Total52454646454640464646
F, forward repeat; P, palindrome repeat, R, reverse repeat; C, complement repeat. R05, M02, R01, R03, R16, R15, R1, R02, M01 and R04.
Publisher’s Note: MDPI stays neutral with regard to jurisdictional claims in published maps and institutional affiliations.

