Article

Field Efficacy of Proteolytic Entomopathogenic Fungi against Ceratovacuna lanigera Zehntner

by
Md. Shafiqul Islam
1,2,
Vijay Kumar Subbiah
1 and
Shafiquzzaman Siddiquee
1,*
1
Biotechnology Research Institute, Universiti Malaysia Sabah, Jalan UMS, Kota Kinabalu 88400, Malaysia
2
Entomology Division, Bangladesh Sugarcrop Research Institute, Ishurdi, Pabna 6620, Bangladesh
*
Author to whom correspondence should be addressed.
Horticulturae 2022, 8(9), 808; https://doi.org/10.3390/horticulturae8090808
Submission received: 14 July 2022 / Revised: 30 August 2022 / Accepted: 30 August 2022 / Published: 2 September 2022
(This article belongs to the Section Insect Pest Management)

Abstract

:
Entomopathogenic fungi (EPF) are regarded as viable alternatives to insect pest control chemicals that contain a large amount of protease enzyme, which degrades the proteinaceous substances in insect cuticles. The aim of this study was to evaluate the field efficacy of protease-producing EPF against Ceratovacuna lanigera, and to assess the persistence of the Ceratovacuna lanigera, on sugarcane leaves. A total of 10 protease-producing fungi isolates were cultured from different agricultural soils, and identified as Purpureocillium lilacinum on the basis of the morphological features and molecular data, using ITS 1-5.8 S-ITS 2 of the rDNA sequences. The proteolytic activity of the isolates was assessed and expressed as an Enzyme Index (EI). Three isolates (PLTP5, PLPS8, and PLMC11) were found to be the best enzyme producers among the isolates, presenting EI values > 2.0 at 24 h, 48 h, and 72 h during incubation. These three isolates also gave the best results in terms of lethal concentrations (LC50 and LC90) and lethal time (LT50 and LT90) values, based on laboratory virulence evaluation, and were therefore selected for field application; commercial B. bassiana (GHA) was applied as standard treatment. An oil-based formulation of conidia (1 × 10⁸ mL−1) of the isolates was applied in a sugarcane field experiment, with an interval of 10 days for four times. The results revealed that P. lilacinum (PLTP5) showed the highest reduction in the C. lanigera population, of 28.75, 56.02, 67.42, and 77.21%, respectively, after the first, second, third, and fourth spraying. The persistence of the conidia of the isolates on the sugarcane leaves was assessed. Per cent reductions in the conidia population, of 36.94–45.23%, 69.36–80.15%, and 81.75–92.96%, respectively, were found after three, six, and nine days of application. The application impact of EPF on the yield component and sugar content was evaluated. Purpureocillium lilacinum (PLTP5) showed the highest increase, of 18.15, 17.83, 15.07, 11.88, 23.73, and 19.38%, respectively, for leaf length, leaf width, cane height, cane girth, cane weight, and sugar content (brix). Our study indicated that P. lilacinum (PLTP5) was the most effective EPF against C. lanigera in field conditions, and also showed the highest proteolytic activity. Consequently, protease was considered the essential factor regulating the efficacy of P. lilacinum against C. lanigera. Protease would be useful, therefore, as an eco-friendly alternative to chemical pesticides, for the sustainable management of C. lanigera.

1. Introduction

The sugarcane woolly aphid (SWA), Ceratovacuna lanigera Zehntner (Hemiptera: Aphididae), is one of the most abundant and destructive sugarcane insect pests, causing yield and sugar content reductions. The control of this insect pest is basically dependent on the use of synthetic, chemical-based insecticides. However, the increasing use of chemical pesticides has generated harmful effects on the environment, plants, animals, and human health [1,2].
In view of the issues mentioned above, there is an urgent need to develop safe, eco-friendly, effective, and sustainable strategies for the management of this insect pest. The eco-friendly alternatives to chemical insecticides are biological control agents (BCAs). Among the BCAs, entomopathogenic fungi (EPF) are specific in action, are safe and compatible with IPM tactics, and are not harmful to natural beneficial organisms and the environment. They are key regulatory factors in insect pest populations, and are considered very promising biological control agents [3], as they cause disease and death by infecting the insect’s cuticle [4].
Most insects have a segmented, cylindrical structure. The cuticle of an insect is a non-living polymer network that is composed of up to 70% proteins [5]. Protease is an insect cuticle-degrading enzyme that is responsible for protein degradation. For cuticle penetration, it is the key extracellular enzyme, so the infection process cannot be achieved without this enzyme [6]. Entomopathogenic fungi produce a large amount of protease that degrades the proteinaceous substances of insect cuticles. Pathogenicity and virulence are the main characteristics of entomopathogenic fungi that are related to the production of protease enzyme, which is the essential factor for the infection process [7].
In field conditions, one of the most important factors for the efficacy of EPF as biological control agents is the persistence (viability of fungal conidia and infectivity over time) of the fungal conidia in the host habitat. The variation in the persistence of fungal conidia on the leaf surface in different plant species is influenced by several factors, such as the morphology of the plants, the chemistry of the plant surface, and abiotic conditions [8,9].
Several entomopathogenic fungi species, viz., Beauveria bassiana, Metarhizium anisopliae, Lecanicillium lecanii, Paecilomyces carneus, and Paecilomyces farinosuss, have been reported to be effective against rose aphid, Macrosiphum rosae L., Aphis gossypii in chilli and brinjal, and insect pests on corn, both in laboratory and field conditions [10,11,12].
Purpureocillium lilacinum (Thom) (Luangsa-Ard, Hywel-Jones, Houbraken, and Samson) is a soil fungus known primarily as a pathogen of nematodes [13,14]. It has been reported as an effective entomopathogen against several insect species, including melon fruit fly [15], mosquitoes [16], leaf-cutting ants [17], flies [18], white flies [19], mites [20], and bugs [21]. It is also effective in the control of cotton aphid [22], black cherry aphid [23], Mexican fruit fly [24], and Asian citrus psyllid [3]. It has also been proven as a potential pathogen for the control of green peach aphid and fall armyworm (FAW) [25], citrus black fly nymphs [26], and greater wax moth [27].
However, the efficacy of EPF for the control of sugarcane woolly aphids in field conditions, and the persistence of fungal conidia on sugarcane leaves, as well as the impact of EPF application on the yield component and sugar content of sugarcane, have not been studied.
Therefore, the objectives of this study were: (1) to find the potential protease enzyme producing entomopathogenic fungi isolated from agricultural soils in Sabah, Malaysia, and to evaluate their efficacy for the control of the sugarcane woolly aphid in field conditions; (2) to assess the persistence of fungal conidia on sugarcane leaves over time, in field conditions; and (3) to evaluate the impact of EPF application on the yield component and sugar content of sugarcane.

2. Materials and Methods

2.1. Fungi Isolates

The fungi used in this study were isolated locally from agricultural soils of brinjal-, pumpkin-, maize-, sugarcane-, mustard-, and okra-cultivated lands in different locations in Sabah, Malaysia. The fungi were cultured at the Microbiology Laboratory, UMS Biotechnology Research Institute (BRI). A commercial isolate of Beauveria bassiana (GHA) (BotaniGard®, WP) was purchased from LAM International Corporation in Butte, MT, USA. Fungi were isolated using the soil dilution technique, in accordance with Siddiquee [28]. Ten grams (10 g) of soil were transferred to a 250 mL sterile conical flask with 100 mL of sterile distilled water and prepared dilutions in orderly 10−1, 10−2, and 10−3. One mL of the soil solution (10−2 and 10−3) was pipetted into a 90 mm-diameter Petri dish with selective medium, sabouraud dextrose agar + yeast (2%) (SDAY). Tetracycline (0.005%) and streptomycin (0.06%) were used to inhibit bacterial growth. The Petri dish was incubated at 28 °C with a humidity of 70%. After 3 days of culture, colonies of fungi appeared as a single colony-forming unit (CFU). Each colony was cultured separately, and maintained in SDAY. Slants were made from pure cultures, and stored at 4 °C for further use.

2.2. Preparation of Skimmed Milk Agar Medium

The protease enzyme-producing fungi isolates were screened using Skimmed Milk Agar (SMA) media [29], and the media was sterilized in an autoclave at 121 °C for 15 min. Streptomycin (0.06%) was added, to inhibit bacterial growth. Then, 15 mL of SMA medium was poured onto Petri dishes (90 mm diameter) and kept at 4 °C until use.

2.3. Protease Assay

Fungi isolates were screened for proteolytic activity, in accordance with Mohanasrinivasan [29]. Three-days-old pure culture isolate was cut to a diameter of 5 mm, with a cork-borer, then placed in the center of each Petri dish containing SMA medium, and incubated at 28 °C for 72 h. The appearance of a clear halo zone in the medium around the colony indicates protease activity [29,30]. Isolates showing a clear zone around the colonies were selected for proteolytic activity. The diameter of the degradation zone (diameter of clear zone + diameter of the colony) and the diameter of the colony were measured in millimeters (mm) and recorded after 24 h, 48 h, and 72 h during the incubation period. The following formula was used to determine the Enzymatic Index (EI): R/r, where R was the diameter of the degradation zone, and r was the diameter of the colony. Fungal isolates capable of producing protease enzymes with Enzyme Index values, EI ≥ 2.0, were considered the best producers, as established as standard [30].

2.4. Colony Growth Rate and Sporulation

The isolates (protease-producing) were cultured on SDAY plates (90 mm diameter), and incubated at 28 °C. The diameter of the colony was measured daily for 15 days (until the culture plate was fully colonized), after which the growth rate was measured as the average daily growth rate (mm day−1) of the 15 days [31] Spore density was determined in accordance with the method described by Aiin [32]. A 15-day-old culture of each isolate in SDAY plates was used for the spore counting. The spores were harvested by scraping the surface of the culture plates, and suspended in 10 mL of 0.02% (v/v) Tween 80 containing distilled water. A Neubauer haemocytometer was used to determine the spore density (spore mL−1) under a compound microscope at 400× magnification. Three replicates were taken for each isolate.

2.5. Identification of Fungi

Fungi isolates were morphologically identified, based on the microscopic and macroscopic features of the culture, according to Luangsa-Ard [33]. The molecular identification of the fungal isolates was performed by analyzing the ITS 1-5.8 S-ITS 2 rDNA sequences. The genomic DNA of the isolates was extracted using the CTAB protocol described by Cubero [34]. Using two primers, ITS1 (5′-TCC GTA GGT GAA CCT GCG G-3′) and ITS4 (5′-TCC TCC GCT TAT TGA TAT GC-3′), polymerase chain reactions (PCRs) were carried out for the amplification of the ITS 1-5.8 S-ITS 2 rDNA [35]. The polymerase chain reactions were carried out on an automat thermal cycler with 25 µL of reaction mixtures, comprising 2.0 µL MgCl2 (25 mM), 2.5 µL PCR buffer (10×), 0.25 µL Taq polymerase (5 Units), 0.5 µL PCR dNTPs (10 mM), 0.625 µL of each primer (10 μM), 16.5 μL ddH2O, and 2.00 μL DNA template (100 ng/μL). For the amplification of the rDNA ITS 1-5.8 S-ITS 2 regions, the following polymerase chain reaction protocol was used: initial denaturation for 4 min at 95 °C, followed by 39 cycles of denaturation for 45 s at 95 °C, annealing of the primer for 45 s at 58.8 °C, and extension for 1 min at 72 °C. A final extension stage for 10 min at 72 °C accomplished the amplification.
The QIAquick® PCR Purification Kit (QIAGEN) was used to purify the amplified PCR products, as per the manufacturer’s guidelines. The ABI 3130 DNA sequencer was used to do DNA sequencing at the BRI’s Genomic Laboratory at UMS. The NCBI (National Center for Biotechnology Information, Bethesda, MD, USA) (http://www.ncbi.nlm.nih.gov/BLAST/) (accessed on 6 July 2020) database was used to compare the sequencing findings of the ITS 1-5.8 S-ITS 2 rDNA. According to the BLAST results, the sequences were chosen based on a value of more than 97 percent similarity to known sequences in the NCBI database [36].

2.6. Phylogenetic Analysis

A phylogenetic tree for the ITS 1–5.8 S–ITS 2 rDNA was created, by comparing the sequence data of the ITS 1-5.8 S-ITS 2 rDNA to sequences in the GenBank database. The phylogenetic trees were created using MEGA X software version 10 [37], as per the unweighted pair-group method, based on the arithmetic average (UPGMA) [38]. The validity of the trees, and the reliability and strength of the interior branches, were tested with 10,000 replicates, using bootstrap. The Kimura-2 (K2P) parameter was used to calculate the distances [39].

2.7. Determination of Lethal Concentrations and Lethal Times in Laboratory Bioassay

The lethal concentrations (LC50 & LC90) and lethal times (LT50 & LT90) values of the isolates (protease-producing local isolates and one commercial, GHA) were determined against SWA adults, using the mortality data of the virulence evaluation bioassay in laboratory conditions. The LC50 and LC90 values were calculated using the mortality data from four different concentrations of 1 × 10⁵, 1 × 10⁶, 1 × 10⁷, and 1 × 10⁸ conidia mL−1 after six days of treatment. The LT50 and LT90 values were calculated using mortality data from 2 to 6 days after treatment, at a concentration of 1 × 10⁸ conidia mL−1.

2.8. Field Experimental Plots

The field experiment was conducted at the net house of the plant trangenic facility site of BRI, UMS. It was laid out in a randomized, complete block design (RCBD), with three replications. The test field was divided into three equal blocks, that were 2.5 m apart between the blocks. Each block was further divided into five plots as a pit (0.8 m × 0.8 m), resulting in a total of 15 pits as a treatment pit, with 2.5 m between them. Each pit was separated from the adjacent pit at a distance of 2.5 m, to avoid the possibility of the spread of fungal spores between the pits.
A local variety of sugarcane (black dwarf variety) was planted in each pit on 10 June 2020. A total of five sugarcane plants were established in each pit. The plants in all pits were subjected to a natural infestation, and no insect pest control measures were used prior to the application of the fungi. Before the fungi application, the whole experimental field was covered with a shading net (orchid shading net). From June to December 2020, the average temperature and humidity were 27–28 °C and 78–86%, respectively, and from January to April 2021, they were 26–28 °C and 80–88%, respectively (https://www.timeanddate.com/weather/malaysia/kota-kinabalu/historic) (accessed on 28 April 2021). In January, February, March, and April 2021, the average rainfall was 4.4, 2.7, 2.7, and 3.7 inches, respectively (https://weatherspark.com/average-monthly-weather-in-kota-kinabalu-Malaysia) (accessed on 28 April 2021).

2.9. Preparation of Conidial Formulation

Oil-based conidial formulations were prepared, in accordance with Naik [40]. Isolates were cultured in SDAY from pure culture stock slants. Conidia were harvested by scraping the surface of the fully overgrown plates (20-day pure culture plates), suspending in 10 mL of sterile sunflower oil, and adding 0.02% (v/v) Tween 80 solution. The formulations were shaken and filtered through a muslin cloth. The conidia concentration of the formulations was counted using a Neubauer haemocytometer, and diluted (by mixing sterile sunflower oil) to a final concentration of 1 × 10⁸ conidia mL−1, based on laboratory bioassay, which gave the highest results. One gram of commercial B. bassiana (GHA) wettable powder (WP) was also suspended in 100 mL of sterile sunflower oil with 0.02% (v/v) Tween 80 solution, and prepared formulation, to a final concentration of 1 × 10⁸ conidia mL−1.

2.10. Application of Formulation

The oil-based conidia formulations of the isolates were applied in the field test pits. There were five treatments: three local isolates (PLTP5, PLPS8, and PLMC11), selected based on their enzymatic activity and LC & LT values in the bioassay, a commercial B. bassiana (GHA), and control. The conidia formulation of each isolate was sprayed on the sugarcane plants in the treatment pits. After the infestation of SWA, 100 mL of the formulation was sprayed on each sugarcane plant. The control plants were left untreated. Four sprays (25 January 2021 to 24 February 2021) were conducted within a 10-day interval. The spraying was applied in the evening, between 5.30 p.m. and 7.00 p.m., when the wind was calm, and the intensity of sunlight had decreased [41].

2.11. Aphid Counts

The population number of the SWA was counted before the first spray, and 3, 7, and 10 days after each spray, following a visual observation of the leaves. A total of 15 leaves were selected from each pit (of five established plants), of which three leaves (upper, middle, and lower) from each plant were examined for aphid counts [10,42]. Therefore, the aphid population per leaf was calculated as the mean population value of 15 leaves. For calculating population reduction, Abbott’s formula [43] was applied.

2.12. Persistence Assessment of Conidia on Leaves

2.12.1. Leaf Collection and Preparation

Leaf samples were collected (during the first application) from treated and control plants, in accordance with Shrestha [44], with some modifications. The sampling times were selected at immediately-after-spraying (0 day), and 3, 6, and 9 days after the application, for the CFUs test. A total of three leaves (top, middle, and lower) were collected from the randomly selected plant of each pit, and were taken care of by choosing the leaves that were sprayed by the tested fungi. At each sampling time, three replicated leaf samples were collected. The leaves were cut using sterile scissors, and were kept separately in a plastic bag, and brought to the laboratory as early as possible. A leaf disc (2 cm diameter) was made from each leaf sample, using a cork borer.

2.12.2. Recovery of Conidia and Quantification of CFUs

Conidia were recovered and quantified from leave discs treated with the tested fungi, using the washing method in accordance with Shrestha [44]. Leaf discs, made from leaf samples, were washed in 30 mL of sterile distilled water, containing 0.02%Tween 80 solution. The solution was shaken on a rotary shaker at 300 rpm for 2 h at room temperature. Subsequently, 200 µL suspensions were pipetted to a Petri dish containing SDAY. To inhibit bacterial growth, streptomycin (0.06%) and tetracycline (0.005%) were used in the medium [45]. The Petri dishes were incubated at 280 °C for 7 days. The colony-forming units (CFUs) were estimated, and this value was used to calculate the CFUs per leaf disc. For the confirmation of the identity of the tested fungi, well-separated colonies were subcultured onto SDAY, observed under the microscope (×400 magnifications), and finally compared with the standard morphological characteristics of the respective fungi used in the field application.

2.12.3. Calculation of the Reduction (%) of Conidia from Leaves

No conidia of the tested fungi were recovered from the leaf samples of the control plants. Therefore, this part of the data set for the CFUs count was not included in the analysis. The conidia reduction percentage in relation to initial sampling time (measured immediately after spraying) was calculated as follows [45]:
Conidia   reduction   % = CFU s t 0   CFU s t 1 CFU s t 0 × 100
where CFUst0 represented the CFUs of conidia recovered immediately after spraying of conidial suspension, and CFUst1 represented the CFUs of conidia recovered at each sampling time.

2.13. Assessment of Impact of EPF Application on Yield Components and Sugar Content

2.13.1. Length and Width of Leaf

Length and width of leaf were measured in the treated and control plants 10 days after the last spray. The lowest green leaf of each of the five plants in each pit was selected, to measure the length and width of the leaves. Therefore, the length and width per leaf of each pit were determined as the mean value of five leaves. Three replications were performed for each treatment (pit). The leaf length (m) was measured from the base of the leaf blade to the tip of the leaf. The leaf width (cm) was taken at 30 cm from the base of the leaf blade [42,46,47].
The increase in leaf length and width (%) over the control was calculated.

2.13.2. Height and Girth of Sugarcane

The height and girth of each of the five canes in each pit were measured at harvesting time (25 April 2021). Thus, the height and girth per cane were determined as the mean value of five canes. The height (m) of the cane was measured from the soil surface to the tip of the stem, while the girth (cm) was measured from the middle portion of the cane [46,47]. Three replicates were performed, and the increase (%) over the control was calculated.

2.13.3. Weight of Cane and Sugar Content

The weight of the cane was measured from each treated and control pit at harvest time. The cane weight was determined as the mean weight of the five canes in each pit, recorded in kilograms (kg), using a weighing scale. The reading of the sugar percentages (soluble solid) (brix%) of the cane juice was carried out using a hand refractometer at the time of harvest [47]. Three replicates were performed, and the increase (%) over the control was calculated.

2.14. Statistical Analysis

Lethal concentrations (LC50 and LC90) values and lethal time (LT50 and LT90) values were determined following Finney’s Probit analysis Table [48], and regression analysis using Microsoft Office Excel version 2007 (Microsoft Corporation; Redmond, Washington, DC, USA) [49]. Field trials were conducted, following a randomized complete block design (RCBD) with five treatments, together with controls and three replicates of each treatment. The aphid population reduction data was calculated using the Abbott formula [43]. To evaluate the persistence of fungal conidia on sugarcane leaves, the CFU data were Log10-transformed prior to the analysis. The final data of colony growth rates, spore density, aphid population, the persistence of fungal conidia population on leaves and conidia reduction (%), length and width of leaf, height and girth of cane, weight and brix (%) of cane, were analyzed using ANOVA, and the means were compared by the LSD test at a 5% significance level, using Statistix 10 software (Tallahassee, FL, USA).

3. Results

3.1. Proteolytic Fungi Isolates

A total of 38 isolates were cultured from different agricultural soils. Among them, a total of 10 isolates showed proteolytic activity. The proteolytic activity of a representative isolate (PLTP5) in the SMA medium is shown in Figure 1. Isolates showed varying levels of proteolytic activity during the incubation period. At 24 h of incubation, the protease enzyme activity (EI values) of the isolates ranged from 1.80 to 2.80. The enzyme activity was increased at 48 h of incubation, and the highest EI range for the isolates was found from 2.25 to 2.93. At 72 h of incubation, the activity had decreased, and the EI values ranged from 1.68 to 2.29 (Table 1).
Among the 10 isolates, PLTP5 showed the highest EI values, of 2.80, 2.93, and 2.29, respectively, at 24 h, 48 h, and 72 h of incubation. Isolate PLPS8 and PLMC11 showed the second-and third-highest EI values, of 2.60, 2.73, and 2.10, and 2.45, 2.70, and 2.04, respectively (Table 1).
Moreover, according to the evaluation of the Enzyme Index values, EI ≥ 2.0, as established as standard, only three isolates (PLTP5, PLPS8, and PLMC11) were considered the best enzyme producers among the isolates, as they showed values of EI > 2.0 during the entire incubation period. Therefore, these three isolates were selected for the field application.

3.2. Colony Growth Rate and Sporulation

In terms of colony growth rate, there were significant differences among the isolates. The colony growth rates of the isolates ranged from 4.59 to 5.84 mm day−1 (Table 2). Significant variations in mean spore density were also found among the isolates. The spore density of the isolates ranged from 3.37 × 10⁸ to 4.45 × 10⁸ spore mL−1 (Table 2).

3.3. Morphological Characterization

As presented in Figure 2, the isolates were characterized on the basis of the color of the colony, the growing pattern of the colony, and the morphologies of conidiophores, conidia, and phialides. Selected protease-producing 10 isolates (PLMS4, PLTP5, PLKM7, PLPS8, PLMS9, PLMC11, PLMS12, PLMS44, PLMS88, and PLMS113) were morphologically characterized in accordance with the following descriptions:
Macroscopic characteristics:
The diameter of the colonies cultured on SDAY media was found to range from 7.5–8.7 cm at 28 °C for 15 days (Figure 2A). A basal felty structure, consisting with or without floccose aerial overgrowth of the mycelium, was found. Colonies were initially white, and turned vinaceous or shades of pink. The colonies were had irregular formations, with entire margins and flat elevation (Figure 2A). The reverse of the colony appeared to be a purple color (Figure 2B).
Figure 2. Morphological characteristics of representative isolate (PLTP5) of P. lilacinum: (A) Front colony grown in SDAY for 15 days; (B) Reverse colony; (C,D) Conidiophores with phialides and conidia observed under light microscope with 400× magnification.
Horticulturae 08 00808 g002
Microscopic characteristics:
The conidiophores appeared to be of the verticillate type, thick, rough-walled, and bore densely clustered phialides. Verticillate branches were observed in the whorls of 2–4 phialides. The phialides were 6–9 × 2.5–3.0 μm in measure, consisting of a swollen basal part tapering to a short neck (about 1 μm wide). The shapes of conidia were ellipsoidal-to-fusiform, and were produced in divergent chains. The conidia (2–3 × 2–4 μm) were smooth-to-slightly-rough-walled, hyaline-to-purple in mass (Figure 2C,D).
In view of the descriptions of the macroscopic and microscopic characteristics of the isolates mentioned above, it was suggested that the isolates belonged to the Purpureocillium lilacinum species. However, morphological characteristics alone are not sufficient for fungi species identification. Therefore, the molecular method, based on DNA sequence analysis, was carried out, to identify fungi isolates at species level.

3.4. Molecular Identification

DNA sequencing results were collected from the Genomic laboratory of the BRI, UMS. The ITS 1-5.8 S-ITS 2 rDNA sequences were aligned using the BioEdit Sequence Alignment Editor (version: 7.2, Tom Hall, North Carolina State University, Raleigh, NC, USA), and a consensus sequence was created. After that, the NCBI (http://www.ncbi.nlm.nih.gov/BLAST/) (accessed on 6 July 2020) database was used to compare the sequencing findings of the ITS 1-5.8 S-ITS 2 rDNA. All the isolates showed values, ranging from 98 to 100%, similar to known sequences in the NCBI database. According to the BLAST results, 10 isolates (PLMS4, PLTP5, PLKM7, PLPS8, PLMS9, PLMC11, PLMS12, PLMS44, PLMS88, and PLMS113) were positively identified as Purpureocillium lilacinum. Table 3 presents details on the fungi isolates.

3.5. Phylogenetic Analysis

MEGA X software was used to create a phylogenetic tree, using the ITS 1-5.8 S-ITS 2 rDNA gene sequences. The tree was created from 19 sequences, 10 of which were obtained from this study, and 9 from GenBank (http://www.ncbi.nih.gov) (accessed on 7 July 2020), which were used as references. Metarhizium anisopliae (EF113341.1) was used as an outgroup in this study. Phylogenetic analysis revealed that 10 isolates had similarities to the sequences of the GenBank database. According to UPGMA bootstrap tree analysis, with 10,000 bootstrap replicates, three main clusters were formed. Ten isolates (PLMS4, PLTP5, PLKM7, PLPS8, PLMS9, PLMC11, PLMS12, PLMS44, PLMS88, and PLMS113) of this study were clustered belonging to Purpureocillium lilacinum (Figure 3).

3.6. Lethal Concentrations and Lethal Times for the Isolates

The fungi isolates showed different lethal concentrations and lethal times values for the mortality of C. lanigera adults in laboratory bioassay. The LC50 and LC90 values of the isolates ranged from 8.31 × 10⁴ to 1.04 × 10⁶ conidia mL−1, and from 2.13 × 10⁸ to 3.01 × 10¹⁰ conidia mL−1, respectively. The lowest LC50 and LC90 values, of 8.31 × 10⁴ and 2.13 × 10⁸ conidia mL−1, respectively, were found for PLTP5, followed by GHA (1.41 × 10⁵ and 6.91 × 10⁸ conidia mL−1, respectively), PLPS8 (1.99 × 10⁵ and 9.39 × 10⁸ conidia mL−1, respectively) and PLMC11(3.23 × 10⁵ and 1.81 × 10⁹ conidia mL−1, respectively) (Table 4). The LT50 and LT90 values ranged from 3.16 to 4.14 days, and from 6.30 to 8.97 days, respectively. The lowest LT50 and LT90 values of 3.16 and 6.30 days, respectively, were found for PLTP5, followed by GHA (3.54 and 6.91 days, respectively), PLPS8 (3.55 and 7.24 days, respectively), and PLMC11(3.71 and 7.58 days, respectively) (Table 5).

3.7. Efficacy of EPF for Controlling C. lanigera in Field Conditions

With regard to the effect of entomopathogenic fungi under sugarcane field conditions, the data presented in Figure 4, Figure 5, Figure 6 and Figure 7 show that the C. lanigera population in the control plants gradually increased, compared to the treated plants. On the other hand, the population density in sugarcane leaves treated with oil-based formulation of conidia of three local isolates (PLTP5, PLPS8 and PLMC11) of P. lilacinum, and one commercial B. bassiana (GHA), gradually decreased, and differed among the isolates.
Effect of First Spray
After 3 days (F = 63.29; p < 0.001), 7 days (F = 108.01; p < 0.001), and 10 days (F = 45.92; p < 0.001) of the first spray, the population of C. lanigera ranged from 87.44 to 93.39 aphid leaf−1, from 81.84 to 89.53 aphid leaf−1 and from 80.42 to 87.74 aphid leaf−1, respectively, in the treated plants. At the same time, a population of 102.91, 107.04, and 112.84 aphid leaf−1, respectively, was found in the control plants (Figure 4). Population reduction ranges, from 8.71 to 15.07%, from 16.24 to 23.66%, and from 22.24 to 28.75%, respectively, were found in the treated plants over the control plants.
Effect of Second Spray
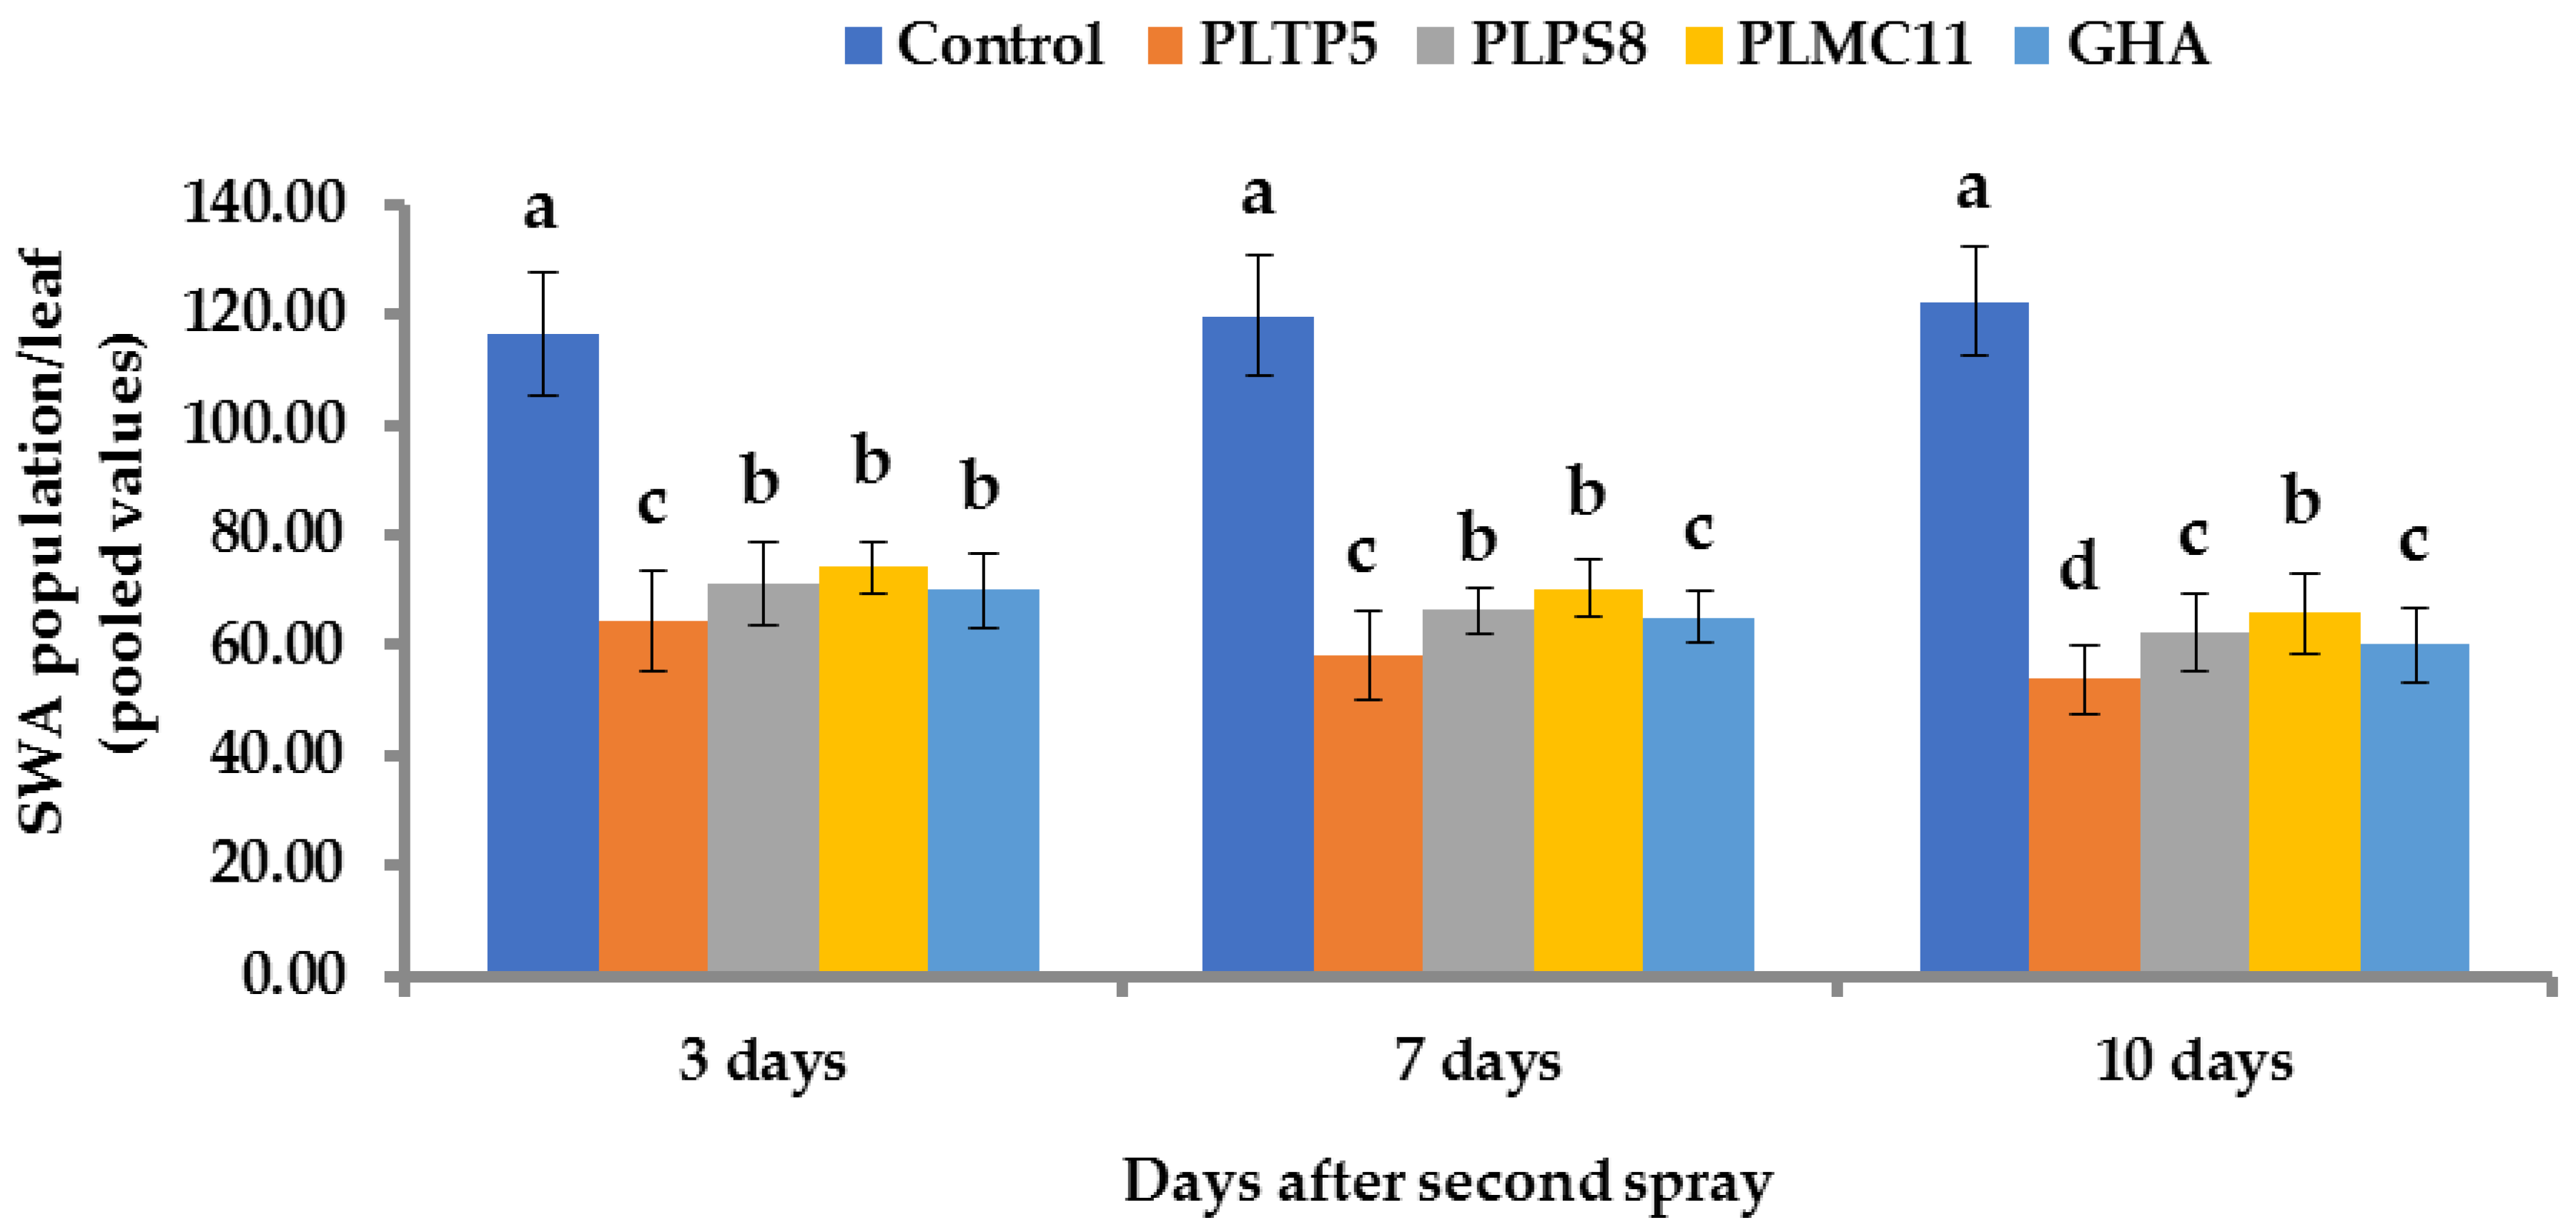
Population ranges of 64.59 to 74.11 aphid leaf−1, 58.02 to 70.29 aphid leaf−1 and 53.62 to 65.75 aphid leaf−1, respectively, were found in the treated plants after 3 days (F = 260.27; p < 0.001), 7 days (F = 203.41; p < 0.001) and 10 days (F = 651.09; p < 0.001) of the second spray; however, populations of 115.42, 119.88, and 126.27 aphid leaf−1, respectively, were found in the control plants (Figure 5). Population reductions were found from 36.26 to 44.67%, from 41.26 to 51.69%, and from 46.23 to 56.02%, respectively, in treated plants, over the control.
Effect of Third Spray
After 3 days (F = 260.57; p < 0.001), 7 days (F = 271.40; p < 0.001), and 10 days (F = 226.31; p < 0.001) of the third spray, population ranges from 48.17 to 60.41 aphid leaf−1, 45.27 to 55.97 aphid leaf−1, and 43.67 to 51.80 aphid leaf−1, respectively, were found in the treated plants, while in the control plants, populations of 126.68, 130.42, and 134.57 aphid leaf−1, were found (Figure 6). The isolates caused population reductions, ranging from 52.44 to 61.90%, 57.07 to 65.19%, and 61.43 to 67.42%, respectively.
Effect of Fourth Spray
The data presented in Figure 7 revealed that after 3 days (F = 260.77; p < 0.001), 7 days (F = 261.62; p < 0.001), and 10 days (F = 339.17; p < 0.001) of the fourth spray, population ranges of 34.66 to 45.11 aphid leaf−1, 30.22 to 42.14 aphid leaf−1, and 27.41 to 36.97 aphid leaf−1, respectively, were found in the treated plants. In the control plants, populations of 129.24, 124.88, and 120.02 aphid leaf−1 were recorded (Figure 7). Reductions of the populations, from 65.06 to 73.15%, from 66.24 to 75.76%, and from 68.92 to 77.21% were found in the treated plants over the control plants. Among the isolates, PLTP5 caused the highest population reductions, of 73.15, 75.76, and 77.21%, respectively.
Thus, the reduction of the C. lanigera population was significantly higher for P. lilacinum (PLTP5) compared to other local and commercial isolates. Therefore, P. lilacinum (PLTP5) was found to be most effective in reducing the population of C. lanigera in field conditions.

3.8. Persistence of Fungi Conidia on Sugarcane Leaves

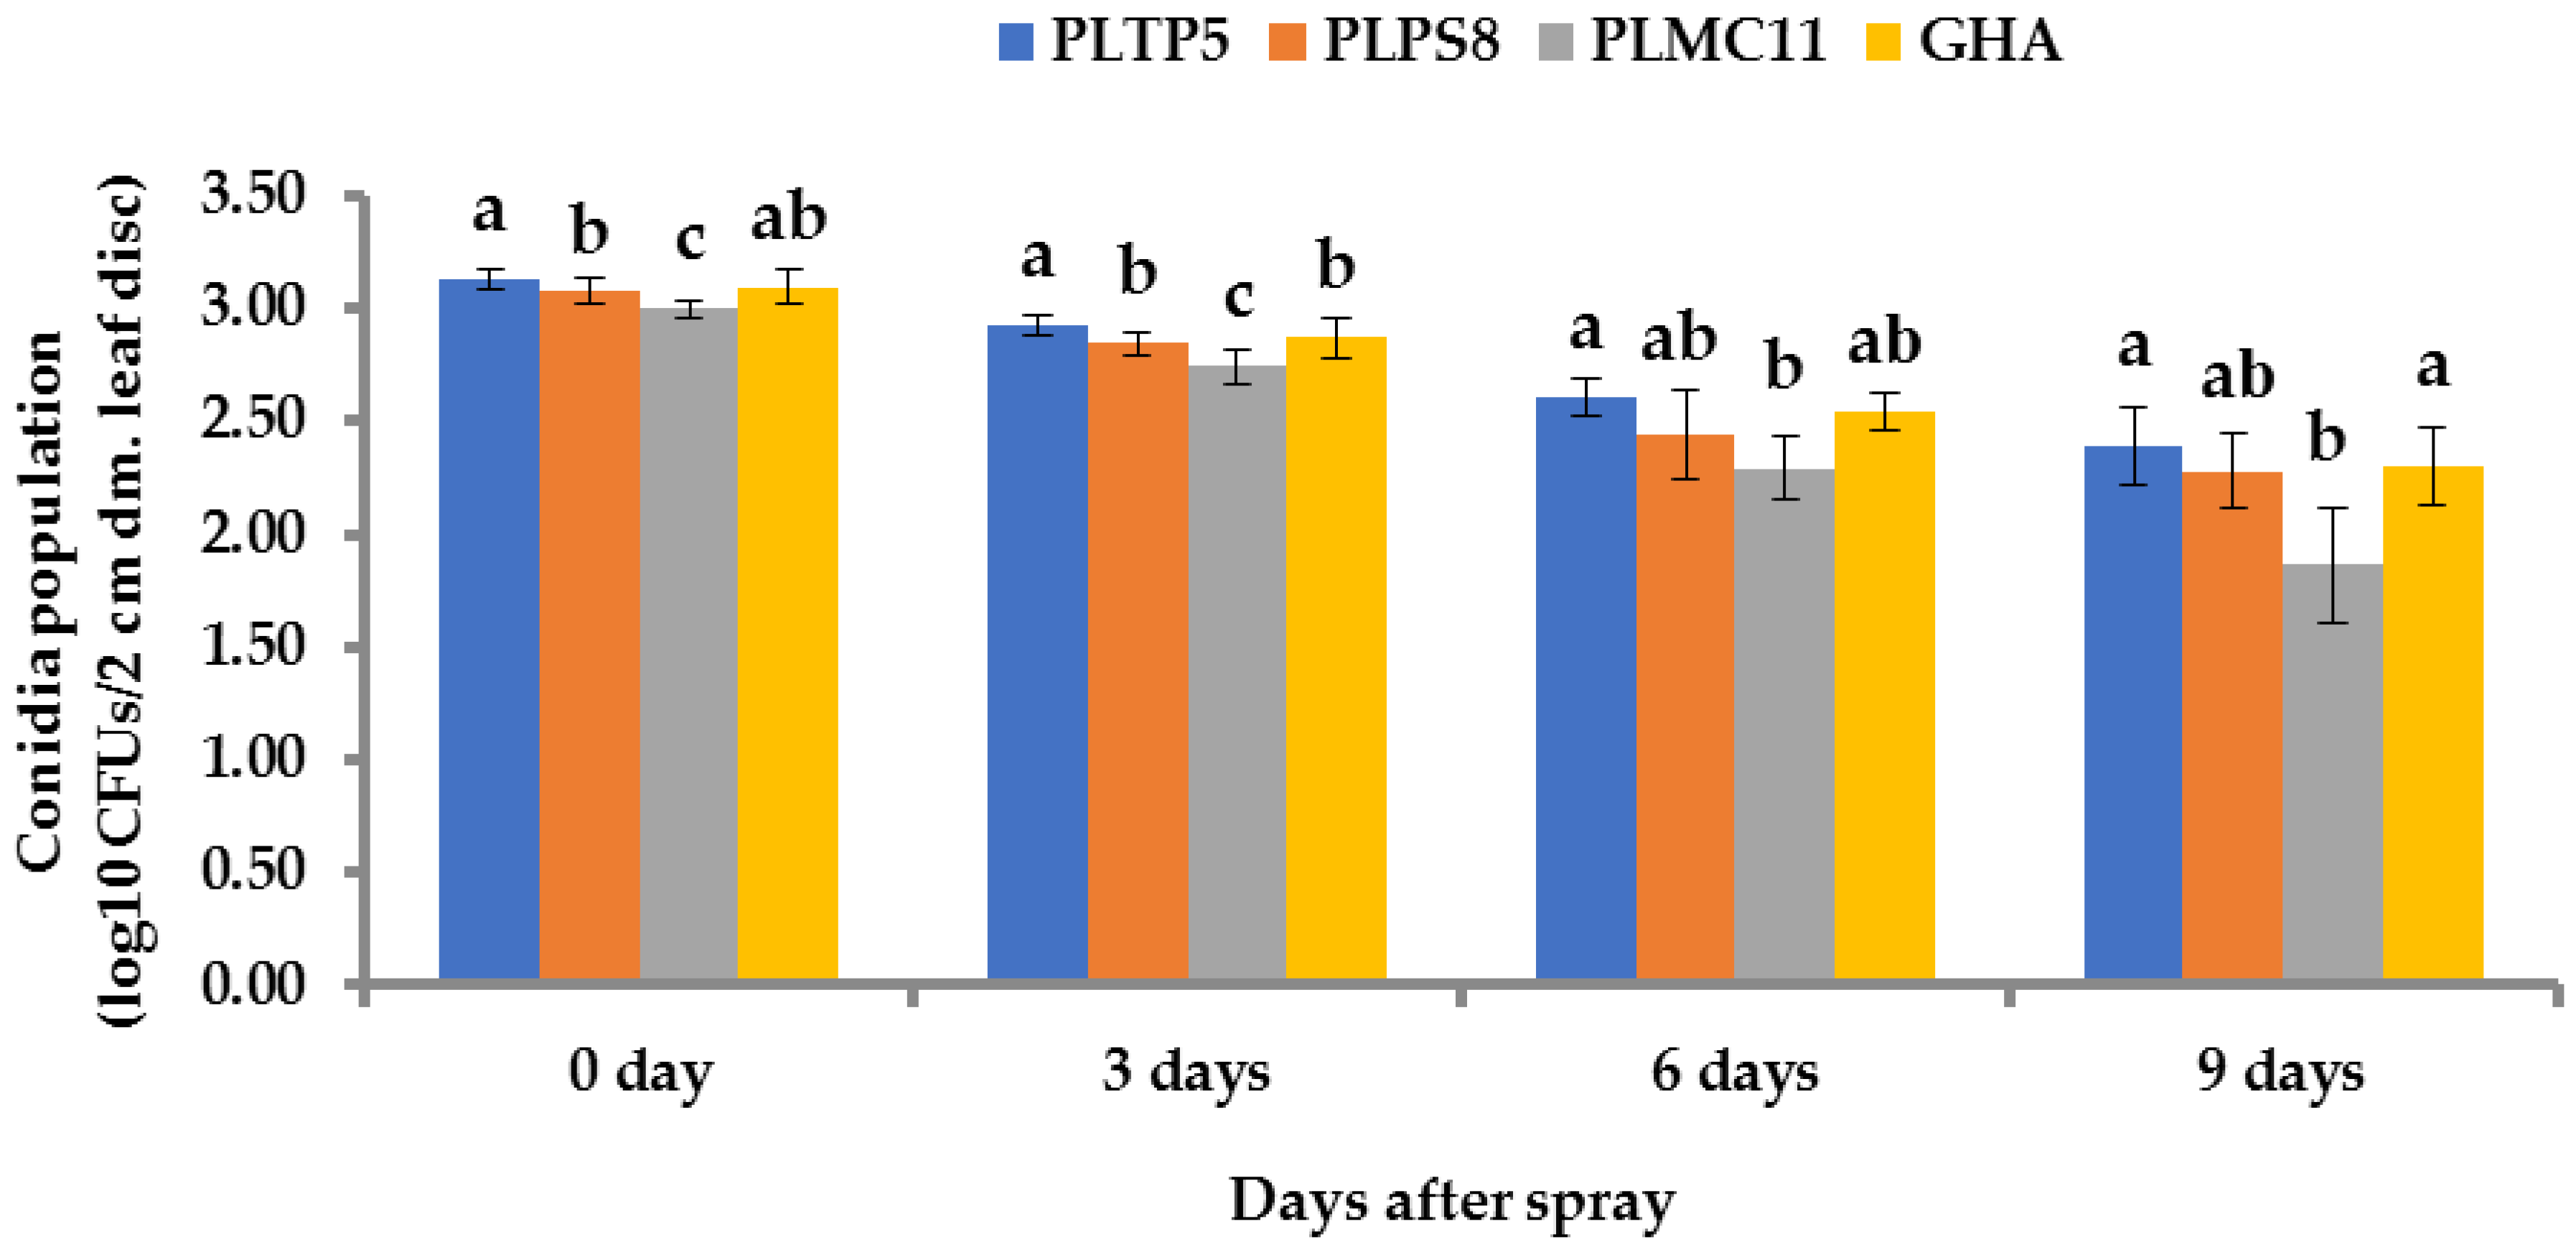
The conidia population density from fungal-sprayed sugarcane leaves was assessed among the treatments, i.e., three local isolates (PLTP5, PLPS8, and PLMC11) of P. lilacinum, and one commercial B. bassiana (GHA). The mean conidia population on sugarcane leaves (CFUs/2 cm diameter leaf disc), recovered immediately after the application (0 day) (F = 18.23; p = 0.002), varied among the isolates. The data observed showed that the highest conidia population, of log 3.13 (1348.96), was found in the leaves treated with the conidia formulation of PLTP5, followed by GHA-treated leaves, in which a population of log 3.09 (1230.26) was found. Populations of log 3.08 (1202.26) and log 3.0 (1000.00), respectively, were recorded in the leaves treated with PLPS8 and PLMC11, (Figure 8).
The conidia populations on the leaf surfaces for all the isolates decreased significantly over time (Figure 8). After 3 days (F = 31.05; p < 0.001) of spraying, conidia populations of log 2.93 (851.13), log 2.84 (691.83), log 2.74 (549.54), and log 2.87 (741.31) were found in the leaf discs treated with PLTP5, PLPS8, PLMC11, and GHA (Figure 8), with reductions of 36.94, 42.45, 45.23, and 39.74%, respectively.
After 6 days (F = 6.71; p =0.174) of spraying, the populations decreased drastically. Populations of log 2.61 (407.38), log 2.44 (275.42), log 2.29 (194.98), and log 2.54 (346.73) were found in leaf discs treated with PLTP5, PLPS8, PLMC11, and GHA (Figure 8), where the highest reduction (80.15%) was found in the leaf discs treated with PLMC11, and the lowest reduction (69.36%) was found in PLTP5-treated leaf discs.
Consequently, after 9 days (F = 1.83; p = 0.219) of spraying, conidia populations of log 2.39 (245.47), log 2.28 (190.54), log 1.86 (72.44), and log 2.30 (199.52) were found in the leaf discs treated with PLTP5, PLPS8, PLMC11, and GHA (Figure 8), with population reductions of 81.75, 84.15, 92.96, and 83.78%, respectively.

3.9. Impact of EPF Application on Yield Component and Sugar Content

The application of the EPF conidia formulation to the foliage showed a significant increase in yield components (length and width of leaf, height, girth, and weight of cane) and sugar content (brix) in sugarcane, over the control plants, due to the reduction of the most destructive foliage sap-sucking insect infestation, the sugarcane woolly aphid (SWA).
Sugarcane leaf length and width were significantly affected by foliar application of the EPF conidia formulation. Leaf length values of between 1.52 and 1.56 m were found in the treated plants, while a value of 1.32 m was found in the control plants (Figure 9). An increase in leaf length from 14.62 to 18.15% was found in the treated plants over the control plants, whereas the highest increase, of 18.15%, was found in the plants treated with PLTP5.
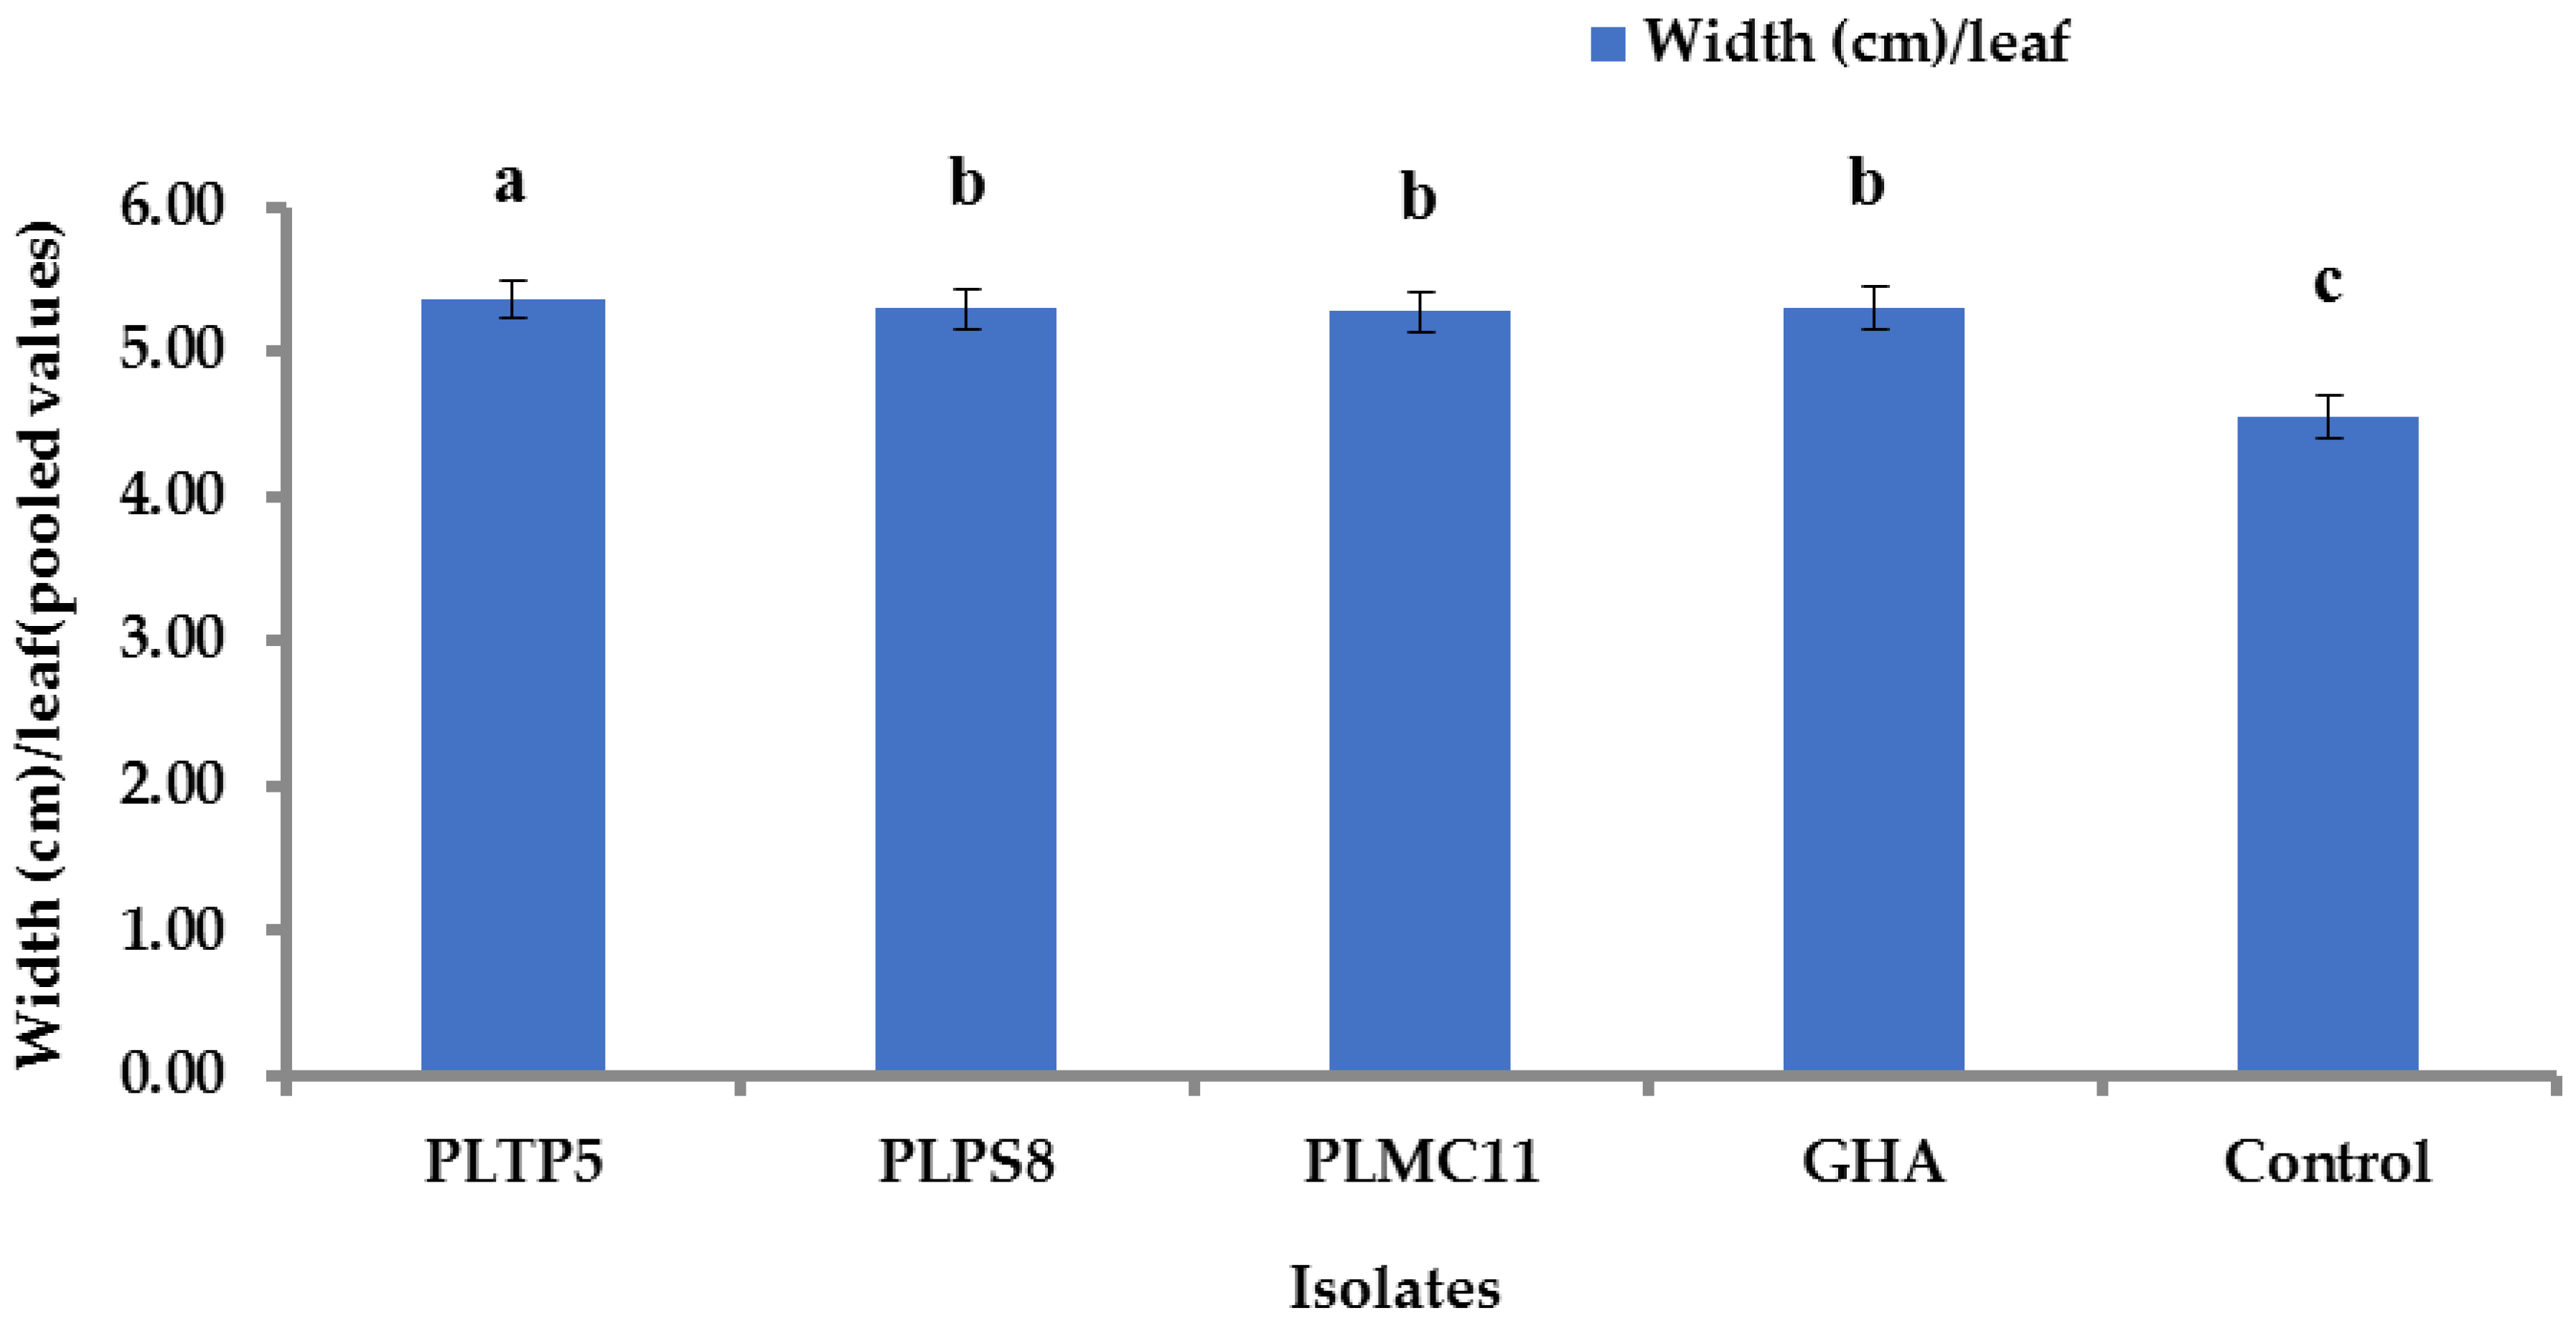
Regarding leaf width, values of 5.27 to 5.35 cm were found in the treated plants, and 4.54 cm in the control plants (Figure 10). Increases of 16.00 to 17.83% were found in the treated plants, with PLTP5-treated plants showing the highest increase, of 17.83%, over the control plants.
The data presented in Figure 11 revealed that the highest cane height was found in the plants treated with PLTP5 (2.56 m), followed by GHA (2.53 m), PLMC11 (2.51 m), and PLPS8 (2.49 m). The lowest value was found in the control (2.23 m) (Figure 11). However, in plants treated with PLTP5, PLPS8, PLMC11, and GHA, there was an increase in plant height of 15.07, 11.62, 12.81, and 13.57%, respectively, over the control.
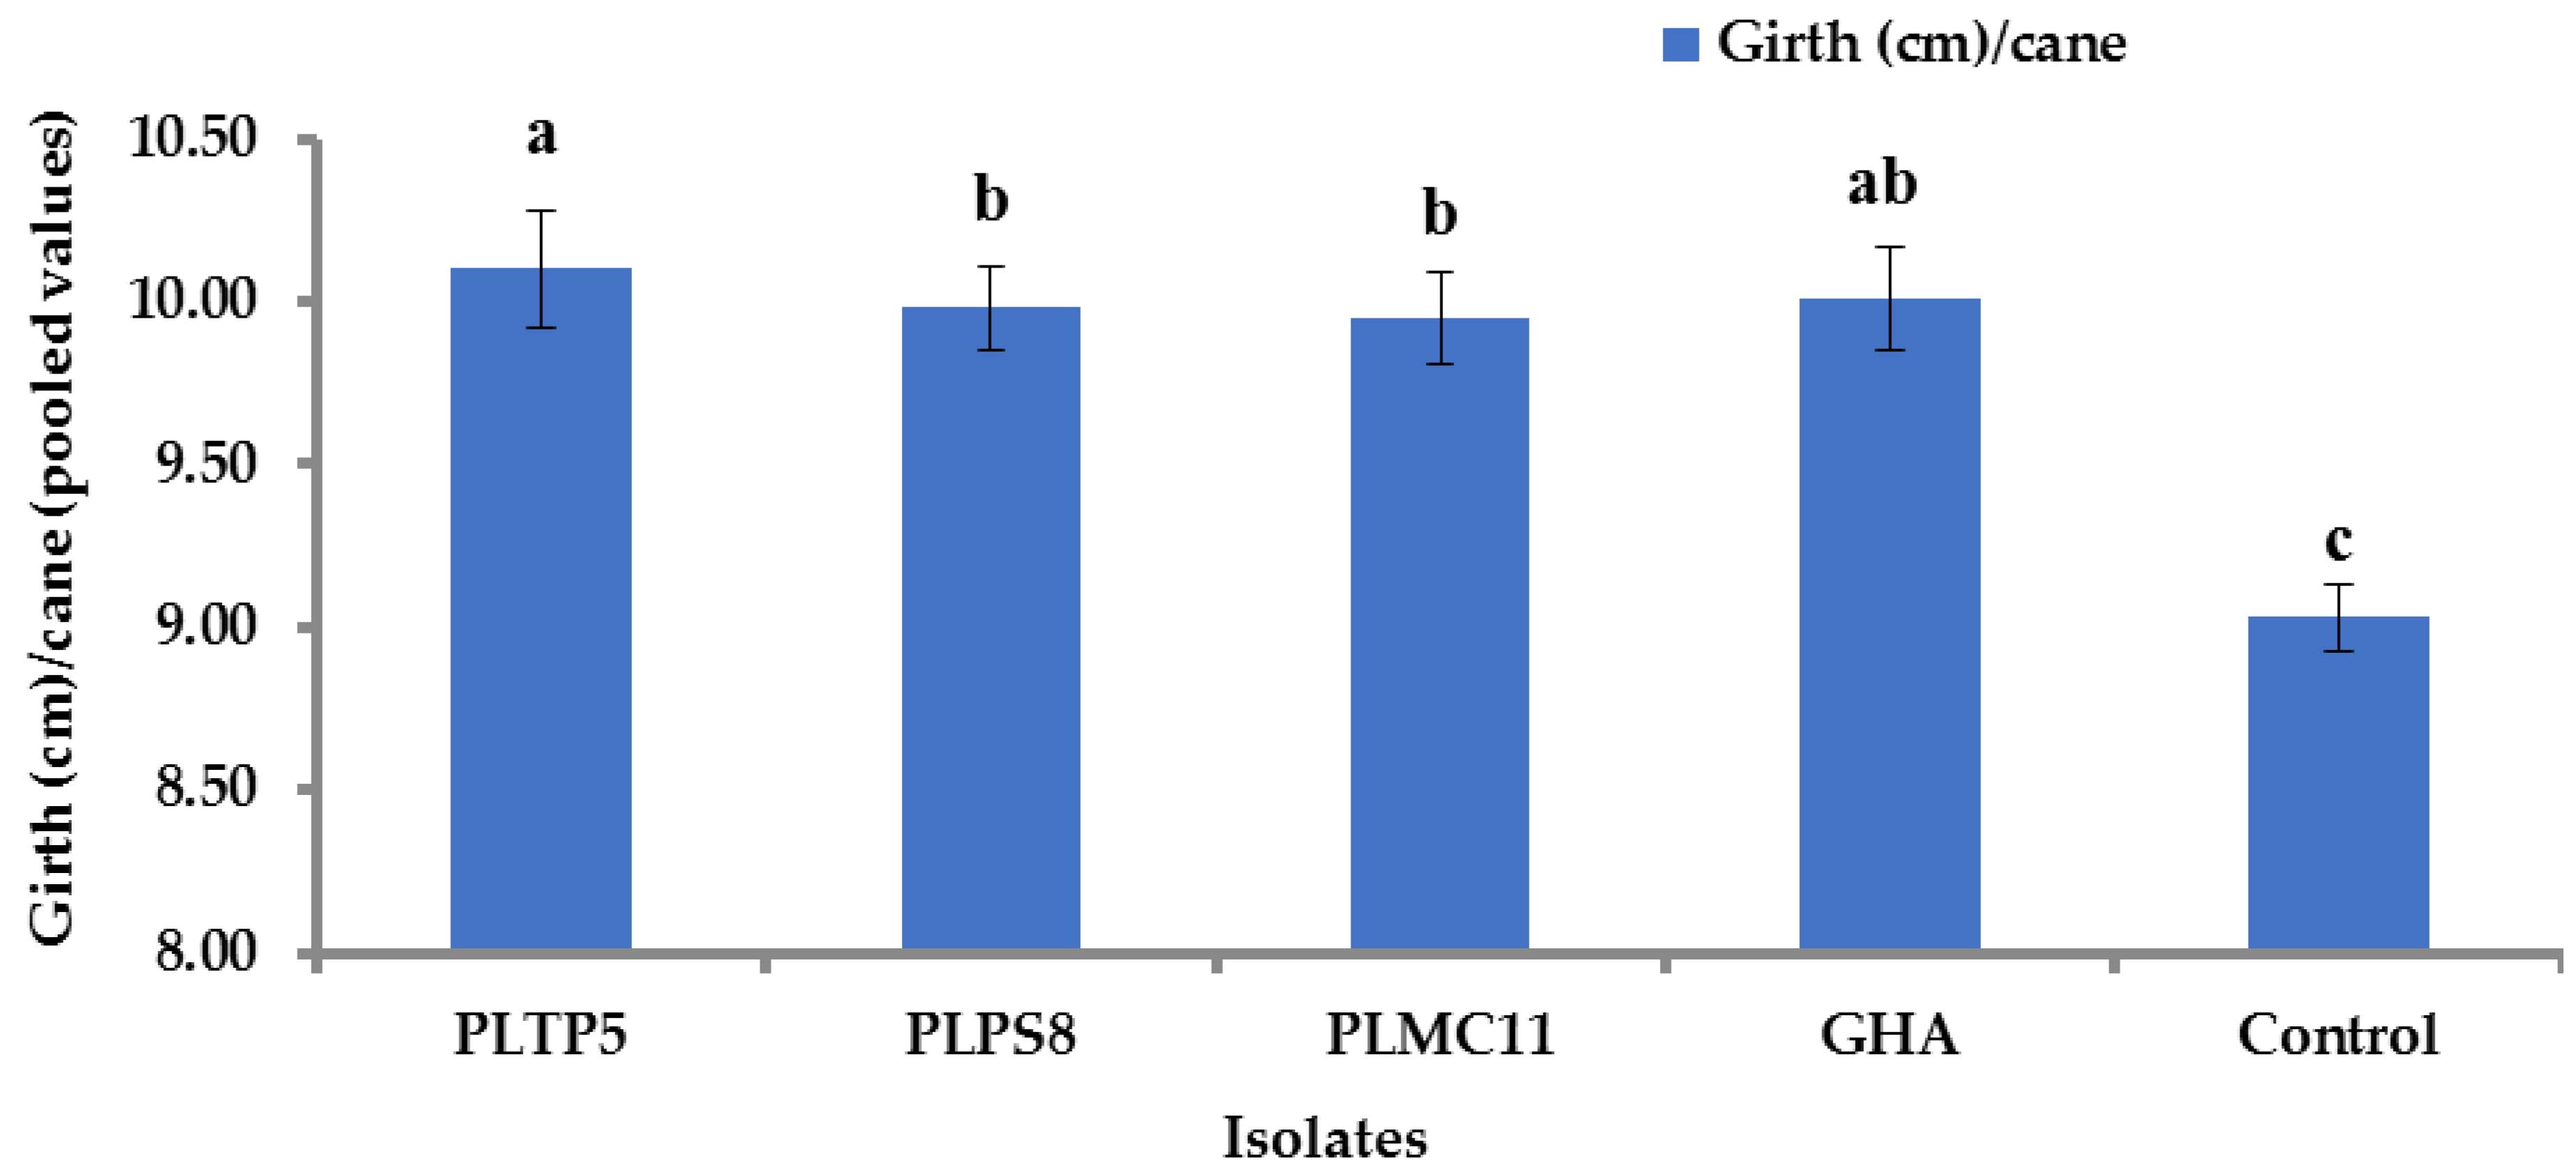
In terms of girth, the treated plants showed values between 9.95 and 10.10 cm, with an increase of 10.20 to 11.88% over the control plants, where PLTP5-treated plants showed the highest increase of 11.88% (Figure 12).
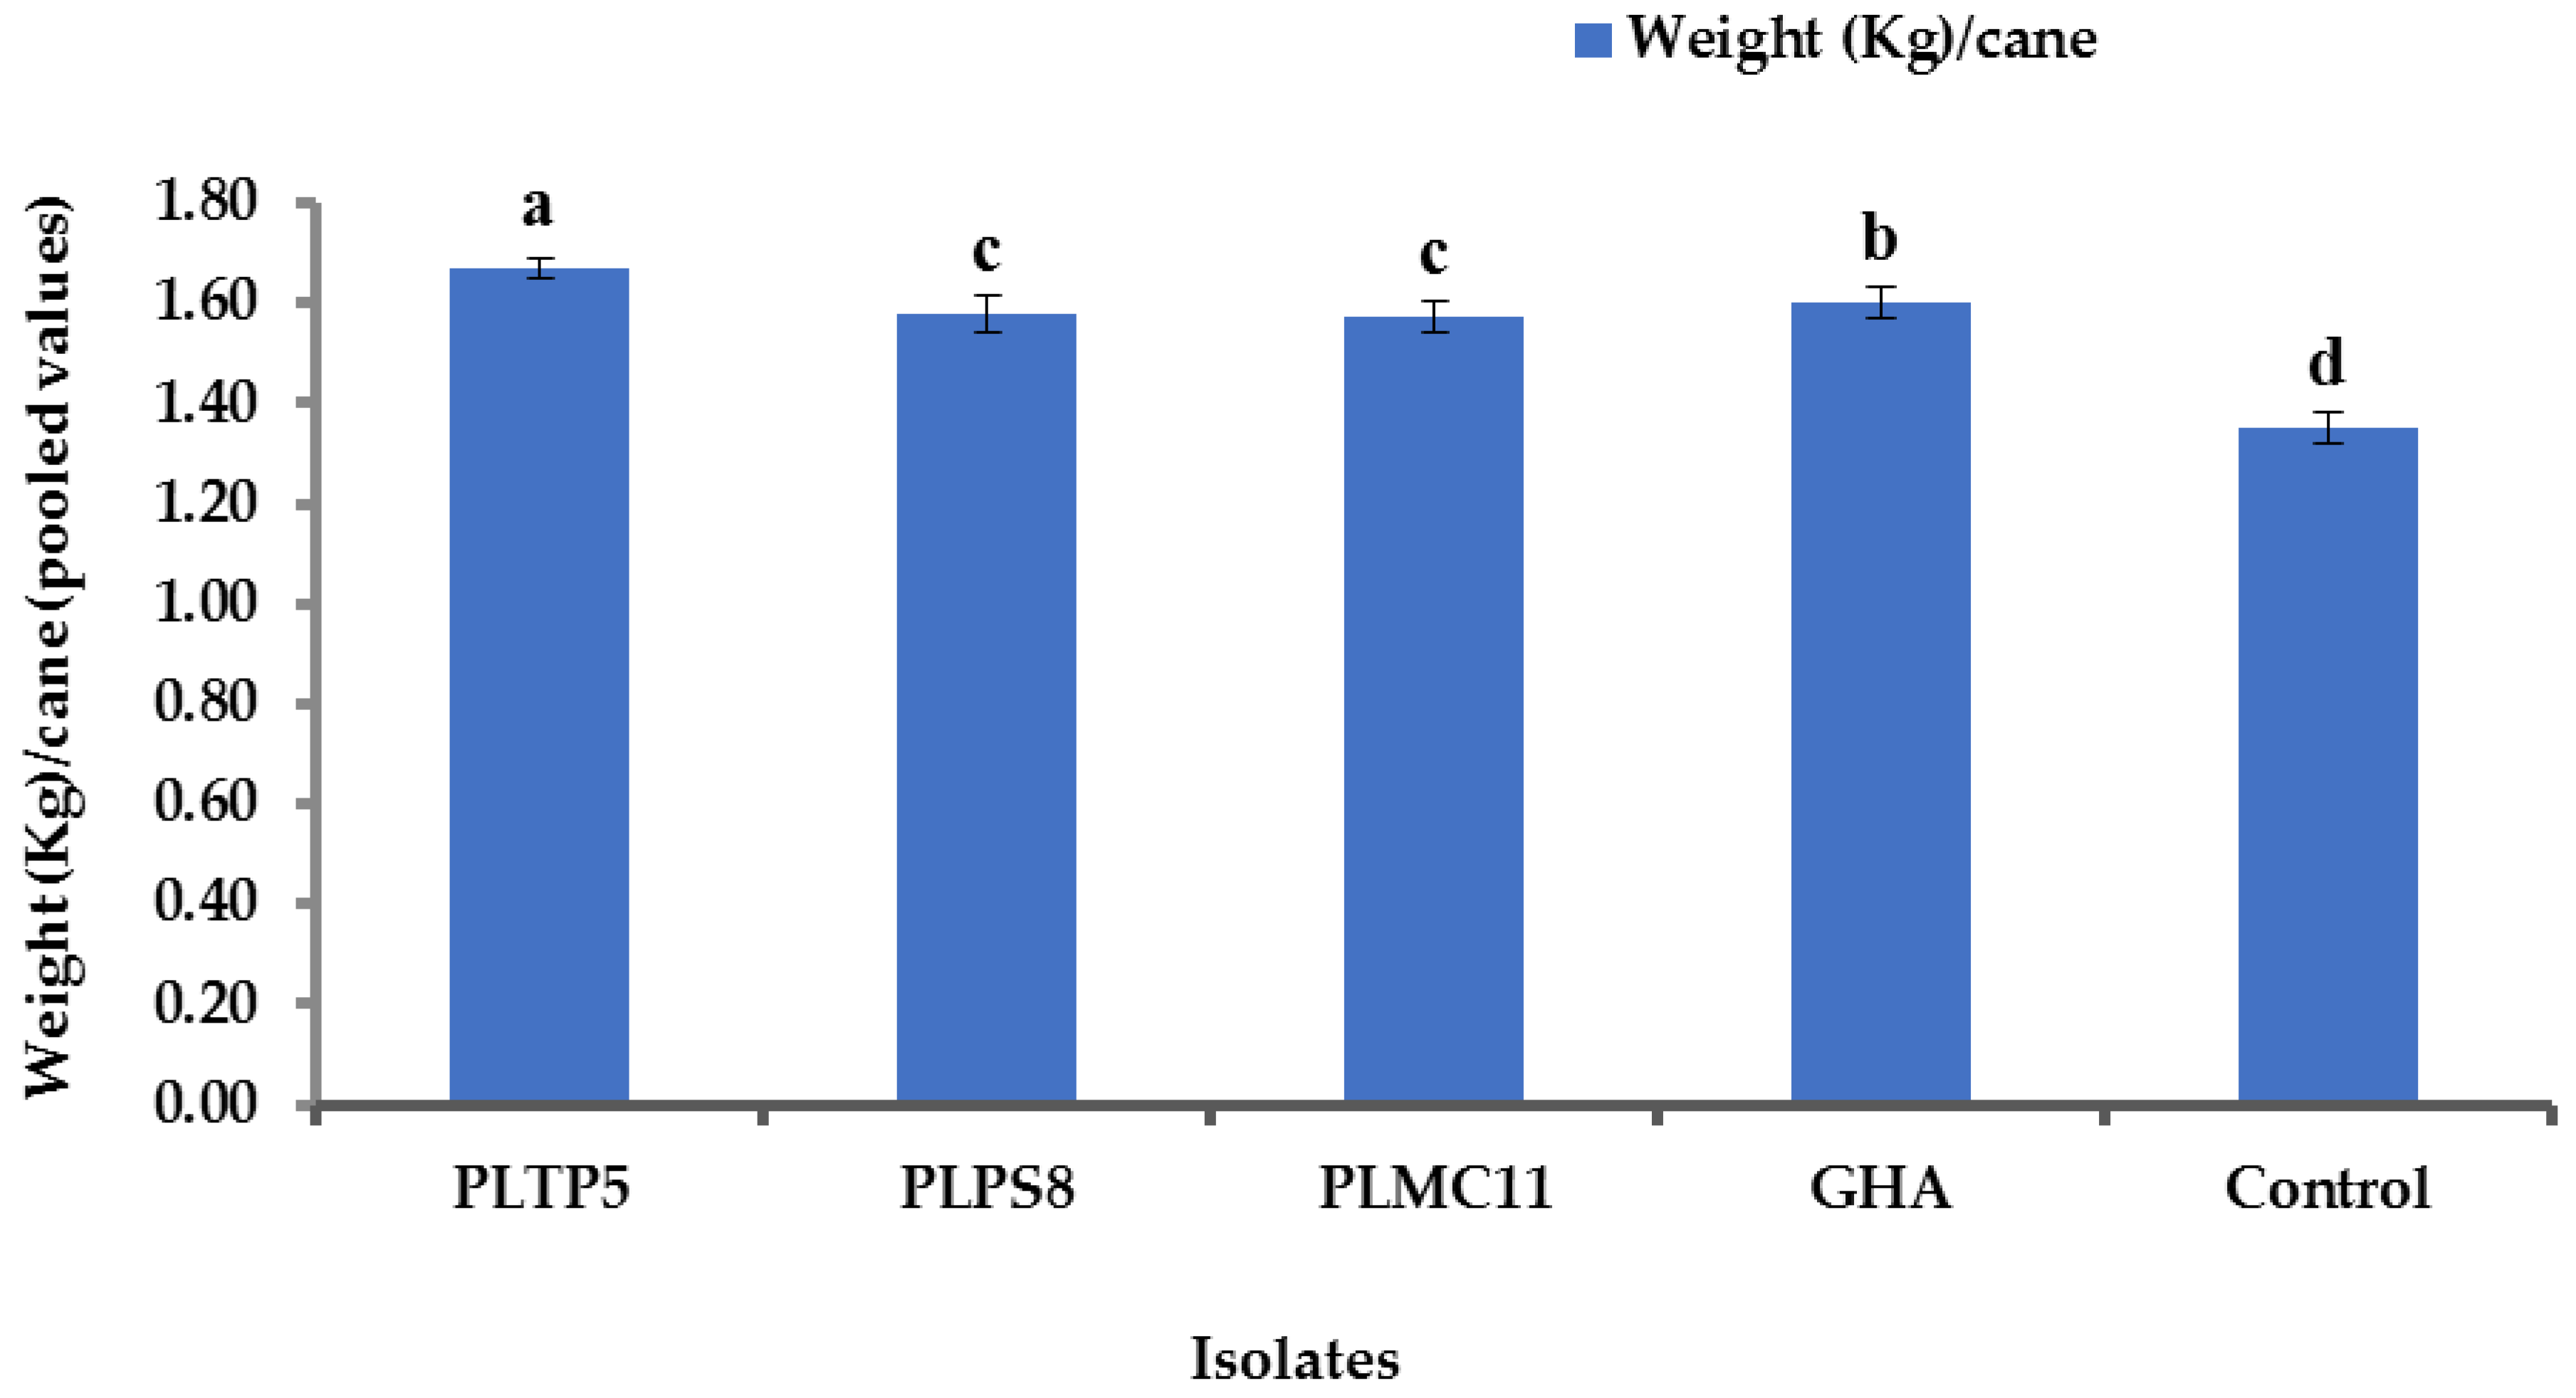
The weight/cane was higher in the plants treated with PLTP5 (1.67 kg/cane), and a significant difference was found, compared with the control and other isolates. The lowest weight (1.35 kg/barrel) was found in the control plants (Figure 13). However, a weight increase of 16.55 to 23.72% was found in the treated plants over the control plants, with the highest increase, of 23.72%, found in the plants treated with PLTP5.
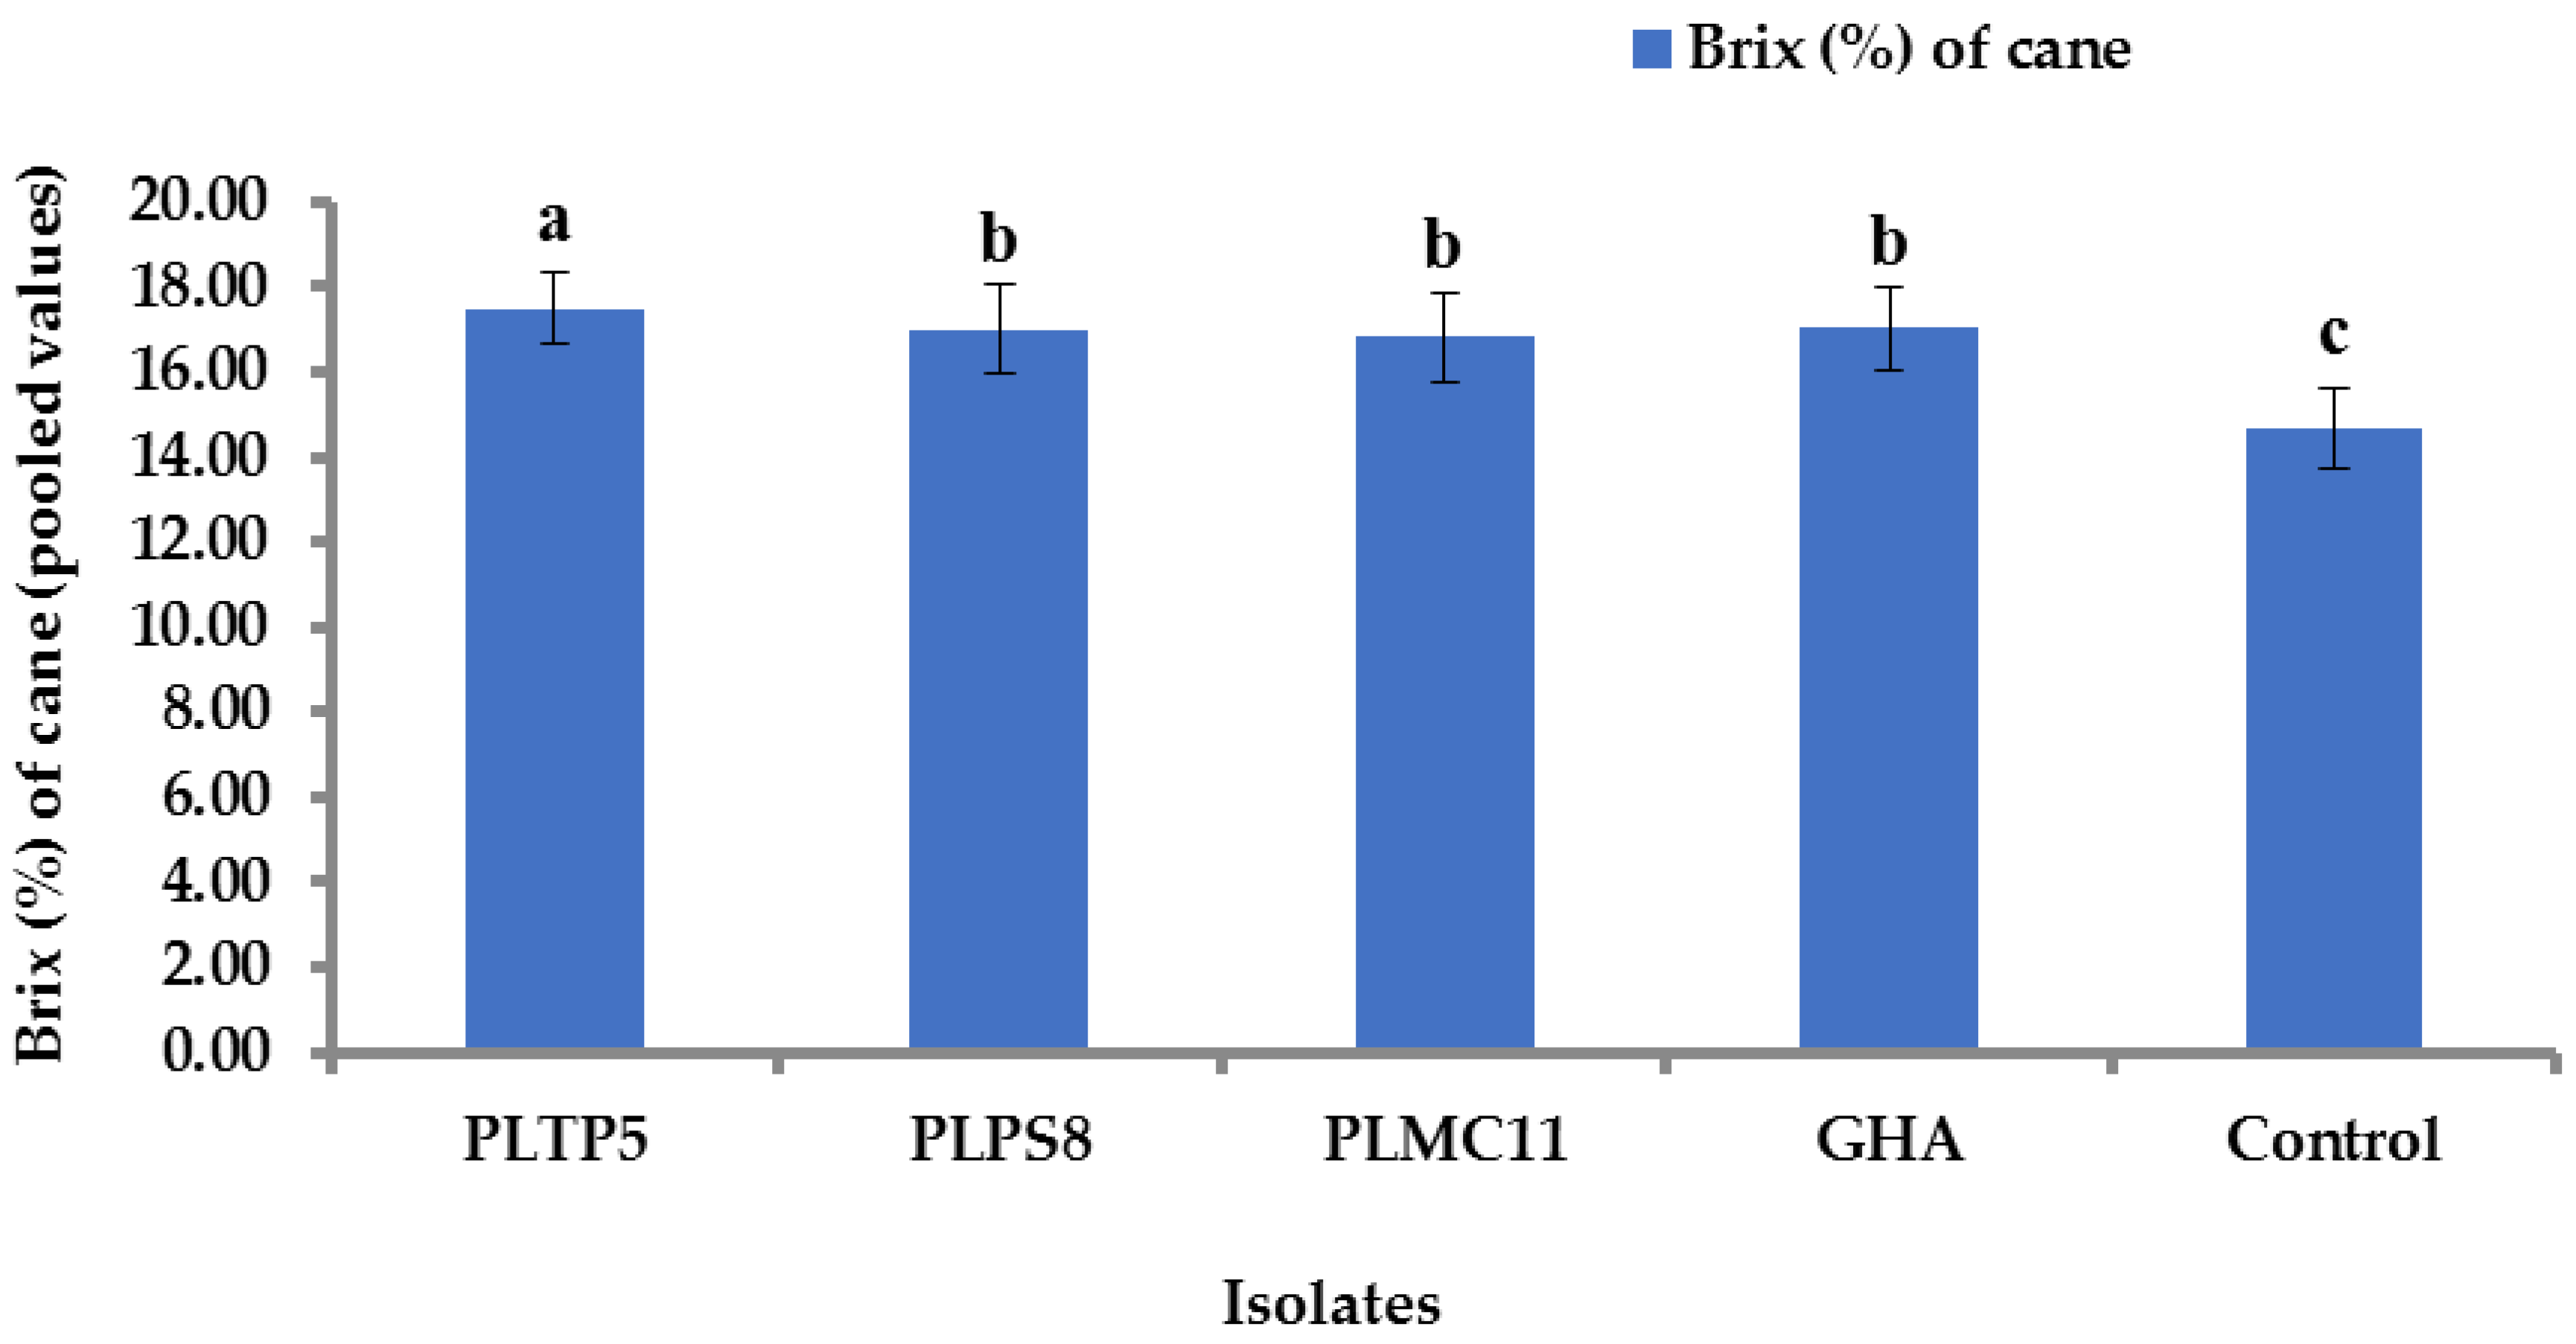
Sugar content (brix%) of 16.83 to 17.59% was found in the treated plants; the lowest sugar content (brix%) was 14.66% in the control plants (Figure 14). The treated plants showed an increase in sugar content from 14.74 to 19.38% over the control plants, with PLTP5-treated plants showing the highest increase, of 19.38%.

4. Discussion

Entomopathogenic fungi (EPF) are recognized as insect host-infecting natural pathogens, and are known as promising viable alternatives to chemical-based insecticides for controlling insect pests [50]. The soil is the appropriate habitat for entomopathogenic fungi, where they can live as a part of the ecosystem’s natural flora, and act as antagonists to other organisms harmful to the environment [36]. In this study, 10 EPF isolates belonging to the species P. lilacinum were isolated from different agricultural soils in Sabah, Malaysia. The isolated fungi were screened for their proteolytic activity, using skim milk agar (SMA) medium. Similarly, the proteolytic activity of P. lilacinum, M. anisopliae, Penicillium sp., Aspergillus sp., and Trichoderma sp. were determined in the other previous research studies using skimmed milk agar medium [51,52,53,54,55].
In our study, fungi isolates of P. lilacinum species showed varying levels of proteolytic activity, with PLTP5 showing the highest Enzyme Index (EI) value (Table 1). This finding was supported by Bai [51], who reported that the protease index (EI) range of the nine isolates of M. anisopliae was 1.2 to 3.3, and that the highest protease index of 3.33 was measured in isolate MIS7. A study by Valadares [56] found that the protease index for the 40 isolates of EPF, M. anisopliae, ranged from 1.35 to 1.92. Dias [57] reported that the protease index of B. bassiana was 1.87 and 2.2 at pH 6.8 and 8.5, respectively.
The efficacy of entomopathogenic fungi is correlated to proteolytic activity. In this study, among the 10 isolates of P. lilacinum, the highest mean proteolytic activity was recorded in PLTP5, which also showed the highest reduction of sugarcane woolly aphids (Table 1 and Figure 4, Figure 5, Figure 6 and Figure 7). Similarly, Dhawan [58] reported that extracellular protease-producing B. bassiana MTCC4495 showed maximum protease activity, which was evaluated as the most pathogenic strain against P. brassicae. Bidochka [59] found remarkable proteolytic activity related to the virulent isolates of B. bassiana. In another study, Perinotto [60] observed that the EPF isolates showing the highest levels of proteolytic activity were most virulent to R. microplus. Therefore, protease can be considered as the essential factor regulating virulence in P. lilacinum against C. lanigera.
In this study, the results obtained showed that the aphid population in the control plants gradually increased and provided the highest value, during the observation, 10 days after the third spray. The population then declined (Figure 4, Figure 5, Figure 6 and Figure 7). In a previous study, Shultz [42] also found that the population of sugarcane aphid, Melanaphis sacchari (Zehntner), gradually increased up to 57 days, after planting of the sorghum, Sorghum bicolor (L.) Moench plant, and then declined.
Spraying of EPF on plant leaves is susceptible to unfavorable environmental factors, e.g., sunlight, humidity, rain, and the chemistry of the leaf surface [9]. However, it is believed that the oil-based formulation of the conidia suspension is less susceptible to the adverse effects of rain [61] and sunlight [62], and exhibits better adhesion and deposition in the cuticles of host insects [63]. Therefore, to improve the efficacy of EPF, an oil-based formulation was used in the field experiment.
The results obtained from this study indicated that both local isolates (PLTP5, PLPS8, and PLMC11) of P. lilacinum and commercial B. bassiana (GHA), applied as an oil-based formulation at 1 × 10⁸ conidia mL−1, were effective against C. lanigera in field conditions. The reduction percentage of aphids increased with the number of applications, and reached its maximum value 10 days after the fourth application. Among the isolates, PLTP5 showed the best results in reducing aphid populations, and significant differences were found with the other isolates after the first, second, third, and fourth applications (Figure 4, Figure 5, Figure 6 and Figure 7). Similarly, several studies have reported that EPF with different species were effective for controlling different aphid species in field conditions. Sayed [10] reported that in rose production, the population of rose aphids, Macrosiphum rosae L, was reduced from 70.30 to 72.62%, treated with indigenous B. bassiana isolates, at 10 days after the fourth spraying. According to Ramanujam [11], Beauveria bassiana showed a reduction of 75.10% in chilli aphid, Aphis gossypii Glover, in field conditions. In another investigation, Filho [64] stated in their report that the population of M. persicae (Hemiptera: Aphididae) in cabbage plots treated with two isolates of B. bassiana, was significantly reduced from 57 to 60%. Moreover, Naik [40] found that the oil-based formulation of Beauveria bassiana, Metarhizium anisopliae, and Verticillium lecanii were potential EPF for controlling sucking pests, aphids, and whitefly in okra cultivation. Hatting [65] stated that EPF, Beauveria bassiana, caused a 65% reduction in the Russian wheat aphid, Diuraphis noxia (Kurdjumov), in field conditions. Wawdhane [66] reported that Verticillium lecanii, applied at 1 × 10⁸ conidia mL−1, showed promising biocontrol potential for the reduction of cotton aphids.
To evaluate the efficacy of EPF as biological control agents, it is very important to determine their ability to persist in their host habitat. Knowledge of this aspect is essential for the development of efficient and cost-effective application strategies, including, in particular, the timing and frequency of spray applications [67].
In this study, the conidia population on the surface of sugarcane leaves for all isolates decreased significantly over time (Figure 8). Similarly, Shrestha [44] reported that the conidia population on lettuce leaves decreased over time, while reductions of 38, 92, and 99%, respectively, were found after 5, 11, and 20 days of application. In another study, Gatarayiha [45] stated that the rate of decline in the conidia population varied between different crops, such as beans, cucumbers, eggplant, maize, and tomatoes, and was significantly higher in maize. However, after three weeks of application, more than 50% of the initial conidia population was found viable on crop leaves. Kouassi [68] observed that the persistence of B. bassiana conidia was found for up to 26 days in lettuce and celery leaves.
The efficacy of EPF is related to the persistence of fungal conidia on plant leaves as biocontrol agents [69]. In this study, comparing the mean reduction (%) in SWA caused by fungi isolates showed that a higher reduction was found in PLTP5-treated sugarcane leaves, compared to other isolates. Higher control efficiency was found from this isolate, possibly due to a higher conidia population retained on the leaves, as measured by the number of CFUs recovered immediately after spraying (0 days), and 3, 6, and 9 days after application of the formulation of conidia (Figure 8). These findings were strongly supported by Shrestha [44], who reported that the persistence of the B. bassiana conidia population, as well as their infectivity against lettuce aphids, decreased over time on lettuce leaves in a field environment.
The foliar application of conidia formulation of EPF isolates affected the yield component and sugar content of sugarcane. The results showed that the leaf length, leaf width, cane height, cane girth, cane weight, and sugar content (brix%) of sugarcane were significantly higher in treated plants than in control plants. In general, the biochemical composition of the plant is influenced by insect infestation, which affects the growth and yield parameters of plants [70]. According to Varma [71], the continuous sucking of the phloem sap from the leaves, by the SWA, was found to reduce the photosynthetic efficiency of the leaves, and the length and width of the leaves, with a consequent reduction in the cane height, cane girth, cane weight, and sugar content (brix) of the sugarcane. In another study, Mukunthan [1] reported that infestation of the SWA reduced the quality of the sugarcane, as well as the yield and sugar content. Furthermore, Patil [72] found that SWA infestation resulted in a weight reduction of 26%, and sugar content (brix%) in the juice, of 24%. In this study, the application of conidia formulation to foliage significantly reduced the infestation of the SWA, which contributed to an increase in the length and width of leaves, the cane height, the cane girth, the cane weight, and the sugar content (brix%) of the sugarcane.
Among the treatments, plants treated with PLTP5 showed a higher increase in leaf length and width, cane height, cane girth, cane weight, and sugar content (brix%) of sugarcane over control, due to the higher reduction in infestation (Figure 9, Figure 10, Figure 11, Figure 12, Figure 13 and Figure 14). This was consistent with Sayed [10], who reported that the EPF, B. bassiana, significantly reduced the infestation of the rose aphid, Macrosiphum rosae L. (Hemiptera: Aphididae) in rose production, contributing to increasing the quality of the rose. In another study, Dokki and Cairo [12] reported that the EPF, Paecilomyces carneus and Paecilomyces farinosuss, reduced the corn pests, Sesamia cretica, Ostrinia nubilalis, and Chilo agamemnon, in field conditions, and significantly increased corn yield. Furthermore, the application of entomopathogenic fungi through soil drench or foliar spray improves the availability of nitrogen, phosphate, iron, and chlorophyll content, which enhances root development, plant growth, plant biomass, photosynthetic efficiency, leaf surface area, and yields [73,74].
However, our results showed that the local isolate of P. lilacinum (PLTP5) was the potential isolate in field conditions, for reducing infestation by the sugarcane woolly aphid, and increasing the length and width of leaf, the height, the girth, the weight, and the sugar content of sugarcane.

5. Conclusions

According to the findings of the study, P. lilacinum (PLTP5) was found to be a potential candidate, compared to other isolates and commercial isolate, for the control of C. lanigera in field conditions. This isolate also showed the highest proteolytic activity. Therefore, protease can be considered an essential factor regulating the efficacy of entomopathogenic fungi. To the best of our knowledge, P. lilacinum (PLTP5) has been reported for the first time as a potential candidate for the biological control of C. lanigera in field conditions, and it is expected to be an alternative to chemical-based insecticides for the sustainable management of insect pests in agricultural crops.

Author Contributions

Conceptualization, M.S.I., V.K.S., and S.S.; investigation, M.S.I., V.K.S., and S.S.; writing—original draft preparation, M.S.I.; writing—review and editing, V.K.S., and S.S.; revisions and responses to reviewers, M.S.I., and S.S.; funding acquisition, S.S. All authors have read and agreed to the published version of the manuscript.

Funding

This research project was funded by ‘Strengthening Integrated Research Facilities (SIRF)’ project of Bangladesh Sugarcrop Research Institute (BSRI), Ministry of Agriculture, Bangladesh and the project code under UMS of GLA0026-2019.

Institutional Review Board Statement

Not applicable.

Informed Consent Statement

Not applicable.

Data Availability Statement

Not applicable.

Acknowledgments

The authors would like to acknowledge the authority of Biotechnology Research Institute (BRI), Universiti Malaysia Sabah (UMS) for providing necessary research facilities.

Conflicts of Interest

The authors have declared that there is no conflicts of interest exist.

References

  1. Mukunthan, N.; Srikanth, J.; Singaravelu, B.; Asokan, S.; Kurup, N.K.; Goud, Y.S. Assessment of woolly aphid impact on growth, yield and quality parameters of sugarcane. Sugar Tech. 2008, 10, 143–149. [Google Scholar] [CrossRef]
  2. Usman, M.; Wakil, W.; Piñero, J.C.; Wu, S.; Toews, M.D.; Shapiro-Ilan, D.I. Evaluation of Locally Isolated Entomopathogenic Fungi against Multiple Life Stages of Bactrocera zonata and Bactrocera dorsalis (Diptera: Tephritidae): Laboratory and Field Study. Microorganisms 2021, 9, 1791. [Google Scholar] [CrossRef]
  3. Du, D.; Lu, L.; Hu, X.; Pu, Z.; Huang, Z.; Chen, G.; Liu, S.; Lyu, J. Virulence of Purpureocillium lilacinum strain ZJPL08 and efficacy of a wettable powder formulation against the Asian citrus psyllid (Diaphorina citri). Biotechnol. Biotechnol. Equip. 2020, 34, 1104–1113. [Google Scholar] [CrossRef]
  4. Mustafa, U.; Kaur, G. Extracellular Enzyme Production in Metarhizium anisopliae Isolates. Folia Microbiol. 2009, 54, 499–504. [Google Scholar] [CrossRef] [PubMed]
  5. Clarkson, J.M.; Charnley, A.K. New insights into the mechanisms of fungal insect pathogenesis in insects. Trends Microbiol. 1996, 4, 197–203. [Google Scholar] [CrossRef]
  6. Khan, S.; Nadir, S.; Wang, X.; Khan, A.; Xu, J.; Li, M.; Tao, L.; Karunarathna, S.C. Using in silico techniques: Isolation and characterization of an insect cuticle-degrading-protease gene from Beauveria bassiana. Microb. Pathog. 2016, 97, 189–197. [Google Scholar]
  7. Zhang, Y.J.; Feng, M.G.; Fan, Y.H.; Luo, Z.B.; Yang, X.Y.; Wu, D.; Pei, Y. A cuticle-degrading protease (CDEP-1) of Beauveria bassiana enhances virulence. Biocontrol Sci. Technol. 2008, 18, 543–555. [Google Scholar] [CrossRef]
  8. Inglis, G.D.; Goettel, M.S.; Johnson, D.L. Persistence of the entomopathogenic fungus, Beauveria bassiana, on phylloplanes of crested wheatgrass and alfalfa. Biol. Control 1993, 3, 258–270. [Google Scholar] [CrossRef]
  9. Jaronski, S.T. Ecological factors in the inundative use of fungal entomopathogens. BioControl 2010, 55, 159–185. [Google Scholar] [CrossRef]
  10. Sayed, S.M.; Ali, E.F.; Al-Otaibi, S.S. Efficacy of indigenous entomopathogenic fungus, Beauveria bassiana (Balsamo) Vuillemin, isolates against the rose aphid, Macrosiphum rosae L. (Hemiptera: Aphididae) in rose production. Egypt. J. Biol. Pest Control 2019, 29, 19. [Google Scholar] [CrossRef]
  11. Ramanujam, B.; Japur, K.; Poornesha, B. Field Efficacy of Entomopathogenic Fungi against Brinjal and Chilli Aphid (Aphis gossypii Glover) (Homoptera: Aphididae). Pestic. Res. J. 2018, 30, 159–162. [Google Scholar] [CrossRef]
  12. Dokki, E.T.S.; Cairo, E. Efficacy of two entomopathogenic fungi against corn pests under laboratory and field conditions in Egypt. Europ. J. Acad. Essays. 2014, 1, 1–6. [Google Scholar]
  13. Mendoza, A.R.; Sikora, R.A.; Kiewnick, S. Influence of Paecilomyces lilacinus strain 251 on the biological control of the burrowing nematode Radopholus similis in bananas. Nematropica 2007, 203–214. [Google Scholar]
  14. Roumpos, C. Ecological Studies on Praecilomyces Lilacinus Strain 251 and Their Importance for Biocontrol of Plant-Parasitic Nematodes and Environmental Risk Assessment; Cuvillier Verlag: Gottingen, Germany, 2006; pp. 1–8. [Google Scholar]
  15. Amala, U.; Jiji, T.; Naseema, A. Laboratory evaluation of local isolate of entomopathogenic fungus, Paecilomyces lilacinus Thom Samson (ITCC 6064) against adults of melon fruit fly, Bactrocera cucurbitae Coquillett. J. Trop. Agric. 2013, 51, 132–134. [Google Scholar]
  16. Luz, C.; Tai, M.H.H.; Santos, A.H.; Rocha, L.F.N.; Albernaz, D.A.S.; Silva, H.H.G. Ovicidal activity of entomopathogenic hyphomycetes on Aedes aegypti (Diptera: Culicidae) under laboratory conditions. J. Med. Entomol. 2007, 44, 799–804. [Google Scholar] [CrossRef] [PubMed]
  17. Goffré, D.; Folgarait, P.J. Purpureocillium lilacinum, potential agent for biological control of the leaf-cutting ant Acromyrmex lundii. J. Invertebr. Pathol. 2015, 130, 107–115. [Google Scholar] [CrossRef]
  18. Fernandes, E.G.; Valério, H.M.; Borges, M.A.Z.; Mascarin, G.M.; Silva, C.E.; Van Der Sand, S.T. Selection of fungi for the control of Musca domestica in aviaries. Biocontol. Sci. Tech. 2013, 23, 1256–1266. [Google Scholar] [CrossRef]
  19. Gökçe, A.; Er, M.K. Pathogenicity of Paecilomyces spp. to the glasshouse whitefly, Trialeurodes vaporariorum, with some observations on the fungal infection process. Turk. J. Agric. For. 2005, 29, 331–340. [Google Scholar]
  20. Fiedler, Ż.; Sosnowska, D. Nematophagous fungus Paecilomyces lilacinus (Thom) Samson is also a biological agent for control of greenhouse insects and mite pests. BioContol. 2007, 52, 547–558. [Google Scholar] [CrossRef]
  21. Rambadan, S.; Jugmohan, H.; Khan, A. Pathogenicity and haemolymph protein changes in Edessa meditabunda F. (Hemiptera: Pentatomidae) infected by Paecilomyces lilacinus. J. Biopestic. 2011, 4, 169. [Google Scholar]
  22. Lopez, D.C.; Zhu-Salzman, K.; Ek-Ramos, M.J.; Sword, G.A. The entomopathogenic fungal endophytes Purpureocillium lilacinum (formerly Paecilomyces lilacinus) and Beauveria bassiana negatively affect cotton aphid reproduction under both greenhouse and field conditions. PLoS ONE 2014, 9, e103891. [Google Scholar]
  23. Kepenekci, İ.; Yesilayer, A.; Atay, T.; Tulek, A. Pathogenicity of the entomopathogenic fungus, Purpureocillium lilacinum TR1 against the Black Cherry Aphid, Myzus cerasi Fabricus (Hemiptera: Aphididae). Munis Entomol. Zool. 2014, 10, 53–60. [Google Scholar]
  24. Toledo-Hernández, R.A.; Toledo, J.; Valle-Mora, J.; Holguín-Meléndez, F.; Liedo, P.; Huerta-Palacios, G. Pathogenicity and virulence of Purpureocillium lilacinum (Hypocreales: Ophiocordycipitaceae) on Mexican fruit fly adults. Fla. Entomol. 2019, 102, 309–314. [Google Scholar] [CrossRef]
  25. Liu, Z.; Liu, F.F.; Li, H.; Zhang, W.T.; Wang, Q.; Zhang, B.X.; Sun, Y.X.; Rao, X.J. Virulence of the Bio-Control Fungus Purpureocillium lilacinum against Myzus persicae (Hemiptera: Aphididae) and Spodoptera frugiperda (Lepidoptera: Noctuidae). J. Econ. Entomol. 2022, 115, 462–473. [Google Scholar] [CrossRef]
  26. Medeiros, F.R.; Lemos, R.N.S.D.; Rodrigues, A.A.C.; Batista Filho, A.; Oliveira, L.D.J.M.G.D.; Araújo, J.R.G. Occurrence of Purpureocillium lilacinum in citrus black fly nymphs. Rev. Bras. 2018, 40, 1–3. [Google Scholar] [CrossRef]
  27. Demirci SN, Ş.; Altuntaş, H. Entomopathogenic potential of Purpureocillium lilacinum against the model insect Galleria mellonella (Lepidoptera: Pyralidae). Environ. Exp. Biol. 2019, 17, 71–74. [Google Scholar]
  28. Siddiquee, S. Practical Handbook of the Biology and Molecular Diversity of Trichoderma Species from Tropical Regions; Springer International Publishing: Cham, Switzerland, 2017; p. 22. [Google Scholar]
  29. Mohanasrinivasan, V.; Vani, S.; Raisha, E.; Soumya, A.R.; Devi, C.S. Isolation, screening and identification of protease producing fungi from rhizosphere soil and optimisation of pH, incubation time and inducer concentration for enhanced protease production. Int. J. Pharm. Bio. Sci. 2012, 3, B784–B793. [Google Scholar]
  30. Abe, C.A.L.; Faria, C.B.; De Castro, F.F.; De Souza, S.R.; Santos, F.C.D.; Da Silva, C.N.; Tessmann, D.J.; Barbosa-Tessmann, I.P. Fungi isolated from maize (Zea mays L.) grains and production of associated enzyme activities. Int. J. Mol. Sci. 2015, 16, 15328–15346. [Google Scholar] [CrossRef] [PubMed]
  31. Hossain, M.I.; Ahmad, K.; Vadamalai, G.; Siddiqui, Y.; Saad, N.; Ahmed, O.H.; Hata, E.M.; Adzmi, F.; Rashed, O.; Rahman, M.Z.; et al. Phylogenetic analysis and genetic diversity of Colletotrichum falcatum isolates causing sugarcane red rot disease in Bangladesh. Biology 2021, 10, 862. [Google Scholar] [CrossRef]
  32. Nouri Aiin, M.; Askary, H.; Imani, S.; Zare, R. Isolation and characterization of entomopathogenic fungi from hibernating sites of Sunn Pest (Eurygaster integriceps) on Ilam Mountains, Iran. Int. J. Curr. Microbiol. Appl. Sci. 2014, 3, 314–325. [Google Scholar]
  33. Luangsa-Ard, J.J.; Houbraken, T.; van Doorn, S.B.; Hong, A.M.; Borman, N.L.; Hywel-Jones, N.; Samson, R.A. Purpureocillium, a new genus for the medically important Paecilomyces lilacinus. FEMS Microbiol. Lett. 2011, 321, 141–149. [Google Scholar] [CrossRef] [PubMed]
  34. Cubero, O.F.; Crespo, A.N.A.; Fatehi, J.; Bridge, P.D. DNA extraction and PCR amplification method suitable for fresh, herbarium-stored, lichenized, and other fungi. Pl. Syst. Evol. 1999, 216, 243–249. [Google Scholar] [CrossRef]
  35. White, T.J.; Bruns, T.; Lee, S.J.W.T.; Taylor, J. Amplification and direct sequencing of fungal ribosomal RNA genes for phylogenetics. In PCR Protocols: A Guide to Methods and Applications; Academic Press: Cambridge, MA, USA, 1990; Volume 18, pp. 315–322. [Google Scholar]
  36. Castillo, M.G.; Rivera, I.A.; Padilla, A.B.; Lara, F.; Victoriano, C.N.; Herrera, R.R. Isolation and identification of novel entomopathogenic fungal strains of the Beauveria and Metarhizium generous. BioTechnol. Indian J. 2012, 6, 386–395. [Google Scholar]
  37. Kumar, S.; Stecher, G.; Li, M.; Knyaz, C.; Tamura, K. MEGA X: Molecular Evolutionary Genetics Analysis across computing platforms. Mol. Biol. Evol. 2018, 35, 1547–1549. [Google Scholar] [CrossRef]
  38. Sneath, P.H.A.; Sokal, R.R. Numerical Taxonomy; Freeman: San Francisco, CA, USA, 1973. [Google Scholar]
  39. Kimura, M. A simple method for estimating evolutionary rate of base substitutions through comparative studies of nucleotide sequences. J. Mol. Evol. 1980, 16, 111–120. [Google Scholar] [CrossRef]
  40. Naik, P.H. Field evaluation of different entomopathogenic fungal formulations against sucking pests of okra. Karnataka J. Agril. Sci. 2009, 22, 575–578. [Google Scholar]
  41. Ujjan, A.A.; Shahzad, S. Use of entomopathogenic fungi for the control of mustard aphid (Lipaphis erysimi) on canola (Brassica napus L.). Pak. J. Bot. 2012, 44, 2081–2086. [Google Scholar]
  42. Harris-Shultz, K.; Knoll, J.; Punnuri, S.; Niland, E.; Ni, X. Evaluation of strains of Beauveria bassiana and Isaria fumosorosea to control sugarcane aphids on grain sorghum. Agrosyst. Geosci. Environ. 2020, 3, e20047. [Google Scholar] [CrossRef]
  43. Abbott, W.S. A method of computing the effectiveness of an insecticide. J. Am. Mosq. Control Assoc. 1987, 3, 302–303. [Google Scholar] [CrossRef]
  44. Shrestha, G.; Enkegaard, A.; Steenberg, T. Laboratory and semi-field evaluation of Beauveria bassiana (Ascomycota: Hypocreales) against the lettuce aphid, Nasonovia ribisnigri (Hemiptera: Aphididae). Biol. Control 2015, 85, 37–45. [Google Scholar] [CrossRef]
  45. Gatarayiha, M.C.; Laing, M.D.; Miller, R.M. Effects of crop type on persistence and control efficacy of Beauveria bassiana against the two spotted spider mite. BioControl 2010, 55, 767–776. [Google Scholar] [CrossRef]
  46. Donga, T.K.; Vega, F.E.; Klingen, I. Establishment of the fungal entomopathogen Beauveria bassiana as an endophyte in sugarcane, Saccharum officinarum. Fungal Ecol. 2018, 35, 70–77. [Google Scholar] [CrossRef]
  47. Banasihan, V.T.; Macalaguim, V.V.; Mendoza, T.C. Glyphosate as a ripener in sugarcane production in Batangas. Philipp. J. Crop Sci. 2007, 32, 31–45. [Google Scholar]
  48. Finney, D.J. Probit Analysis; Cambridge University Press: Cambridge, UK, 1952. [Google Scholar]
  49. Mukherjee, A.; Debnath, P.; Ghosh, S.K.; Medda, P.K. Biological control of papaya aphid (Aphis gossypii Glover) using entomopathogenic fungi. Vegetos 2020, 33, 1–10. [Google Scholar] [CrossRef]
  50. Inglis, G.D.; Enkerli, J.; Goettel, M.S. Laboratory techniques used for entomopathogenic fungi: Hypocreales. Man. Tech. Invertebr. Pathol. 2012, 2, 18–53. [Google Scholar]
  51. Bai, N.S.; Remadevi, O.K.; Sasidharan, T.O.; Balachander, M.; Dharmarajan, P. Cuticle degrading enzyme production by some isolates of the entomopathogenic fungus, Metarhizium anisopliae (Metsch.). J. Bio Sci. 2012, 20, 25–32. [Google Scholar] [CrossRef] [Green Version]
  52. Nawar, M.A.; Abo-Elnasr, A.A.; Kobisi, A.N.A.; Hefnawy, G.A. Evaluation of acaricidal activity of Purpureocillium lilacinum isolated from Egyptian soil against Tetranychus urticae. Egypt. J. Des. Res. 2018, 68, 157–172. [Google Scholar] [CrossRef]
  53. Schuster, F.P.W.; Maffessoni, C.; de Angelis, D.A.; Giachini, A.J.; Cardoso, D.H.; Moroni, L.S.; Skoronski, E.; Kempka, A.P. Screening and evaluation of filamentous fungi potential for protease production in swine plasma and red blood cells-based media: Qualitative and quantitative methods. Biocat. Agril. Biotech. 2019, 21, 101313. [Google Scholar] [CrossRef]
  54. Ariffin, Z.Z.; Ahmad, M.S.; Pepi, R.; Noor, Z.M. Proteolytic fungi from virgin forest. J. Teknol. 2016, 78, 37–41. [Google Scholar]
  55. Anilkumar, R.R.; Pradeep, N.S. Screening and Identification of halotolerant protease producing fungi from mangrove sediments of Kerala. Int. J. Biotechnol. Biochem. 2017, 13, 237–252. [Google Scholar]
  56. Valadares-Inglis, M.C.; Azevedo, J.L. Amylase and protease secretion in recombinant strains of Metarhizium anisopliae var anisopliae following parasexual crosses. Braz. J. Gene. 1997, 20, 171–175. [Google Scholar]
  57. Dias, B.A.; Neves, P.M.O.J.; Furlaneto-Maia, L.; Furlaneto, M.C. Cuticle-degrading proteases produced by the entomopathogenic fungus Beauveria bassiana in the presence ofcoffee berry borer cuticle. Braz. J. Microbiol. 2008, 39, 301–306. [Google Scholar] [CrossRef]
  58. Dhawan, M.; Joshi, N. Enzymatic comparison and mortality of Beauveria bassiana against cabbage caterpillar Pieris brassicae LINN. Braz. J. Microbiol. 2017, 48, 522–529. [Google Scholar] [CrossRef]
  59. Bidochka, M.J.; Khachatourians, G.G. Identification of Beauveria bassiana extracellular protease as a virulence factor in pathogenicity toward the migratory grasshopper, Melanoplus sanguinipes. J. Invertbr. Pathol. 1990, 56, 362–370. [Google Scholar] [CrossRef]
  60. Perinotto, W.M.; Golo, P.S.; Rodrigues, C.J.C.; Sá, F.A.; Santi, L.; da Silva, W.O.B.; Junges, A.; Vainstein, M.H.; Schrank, A.; Salles, C.M.; et al. Enzymatic activities and effects of mycovirus infection on the virulence of Metarhizium anisopliae in Rhipicephalus microplus. Veteri. Parasitol. 2014, 203, 189–196. [Google Scholar] [CrossRef] [PubMed]
  61. Inglis, G.D.; Ivie, T.J.; Duke, G.M.; Goettel, M.S. Influence of rain and conidial formulation on persistence of Beauveria bassiana on potato leaves and Colorado potato beetle larvae. Biol. Control 2000, 18, 55–64. [Google Scholar] [CrossRef]
  62. Alves, R.T.; Bateman, R.P.; Prior, C.; Leather, S.R. Effects of simulated solar radiation on conidial germination of Metarhizium anisopliae in different formulations. Crop Protect. 1998, 17, 675–679. [Google Scholar] [CrossRef]
  63. Ibrahim, L.; Butt, T.M.; Beckett, A.; Clark, S.J. The germination of oil-formulated conidia of the insect pathogen, Metarhizium anisopliae. Mycol. Res. 1999, 103, 901–907. [Google Scholar] [CrossRef]
  64. Michereff Filho, M.; Oliveira, S.O.D.; De Liz, R.S.; Faria, M. Cage and field assessments of Beauveria bassiana-based Mycoinsecticides for Myzus persicae Sulzer (Hemiptera: Aphididae) control in cabbage. Neotrop. Entomol. 2011, 40, 470–476. [Google Scholar]
  65. Hatting, J.L.; Wraight, S.P.; Miller, R.M. Efficacy of Beauveria bassiana (Hyphomycetes) for control of Russian wheat aphid (Homoptera: Aphididae) on resistant wheat under field conditions. Biocontrol Sci. Technol. 2004, 14, 459–473. [Google Scholar] [CrossRef]
  66. Wawdhane, P.A.; Nandanwar, V.N.; Mahankuda, B.; Ingle, A.S.; Chaple, K.I. Bio-efficacy of insecticides and bio pesticides against major sucking pests of Bt-cotton. J. Entomol. Zoo. Study 2020, 8, 829–833. [Google Scholar]
  67. Castrillo, L.A.; Griggs, M.H.; Liu, H.; Bauer, L.S.; Vandenberg, J.D. Assessing deposition and persistence of Beauveria bassiana GHA (Ascomycota: Hypocreales) applied for control of the emerald ash borer, Agrilus planipennis (Coleoptera: Buprestidae), in a commercial tree nursery. Biol. Control 2010, 54, 61–67. [Google Scholar] [CrossRef]
  68. Kouassi, M.; Coderre, D.; Todorova, S.I. Effect of plant type on the persistence of Beauveria bassiana. Biocontrol Sci. Technol. 2003, 13, 415–427. [Google Scholar] [CrossRef]
  69. Ignoffo, C.M. Environmental factors affecting persistence of entomopathogens. Fla. Entomol. 1992, 75, 516–525. [Google Scholar] [CrossRef]
  70. Singh, P.; Dhal, M.K.; Sagar, S.K. Experimental investigation on nutritional variation in plant foliage of rose (Rosa damascene): Effect of pest infestation. Int. J. Sci. Res. Publ. 2014, 4, 1–12. [Google Scholar]
  71. Kishore Varma, P.; Chandra Sekhar, V.; Bhavani, B.; Upendhar, S. Cladosporium cladosporioides: A new report of parasitism on sugarcane woolly aphid, Ceratovacuna lanigera Zehntner. J. Entomol. Zoolog. Stud. 2019, 7, 1122–1126. [Google Scholar]
  72. Patil, A.S.; Magar, S.B.; Shinde, V.D. Biological control of the sugarcane Woolly Aphid (Ceratovacuna lanigera) in Indian sugarcane through the release of predators. In Proceedings of the XXVI Congress, International Society of Sugar Cane Technologists, ICC, Durban, South Africa, 29 July–2 August 2007; International Society Sugar Cane Technologists (ISSCT): Réduit, Mauritius, 2007; pp. 797–804. [Google Scholar]
  73. Raya-Díaz, S.; Sánchez-Rodríguez, A.R.; Segura-Fernández, J.M.; Del Campillo, M.D.C.; Quesada-Moraga, E. Entomopathogenic fungi-based mechanisms for improved Fe nutrition in sorghum plants grown on calcareous substrates. PLoS ONE 2017, 12, e0185903. [Google Scholar] [CrossRef]
  74. Dara, S.K.; Dara, S.S.; Dara, S.S. Impact of entomopathogenic fungi on the growth, development, and health of cabbage growing under water stress. Am. J. Plant Sci. 2017, 8, 1224. [Google Scholar] [CrossRef]
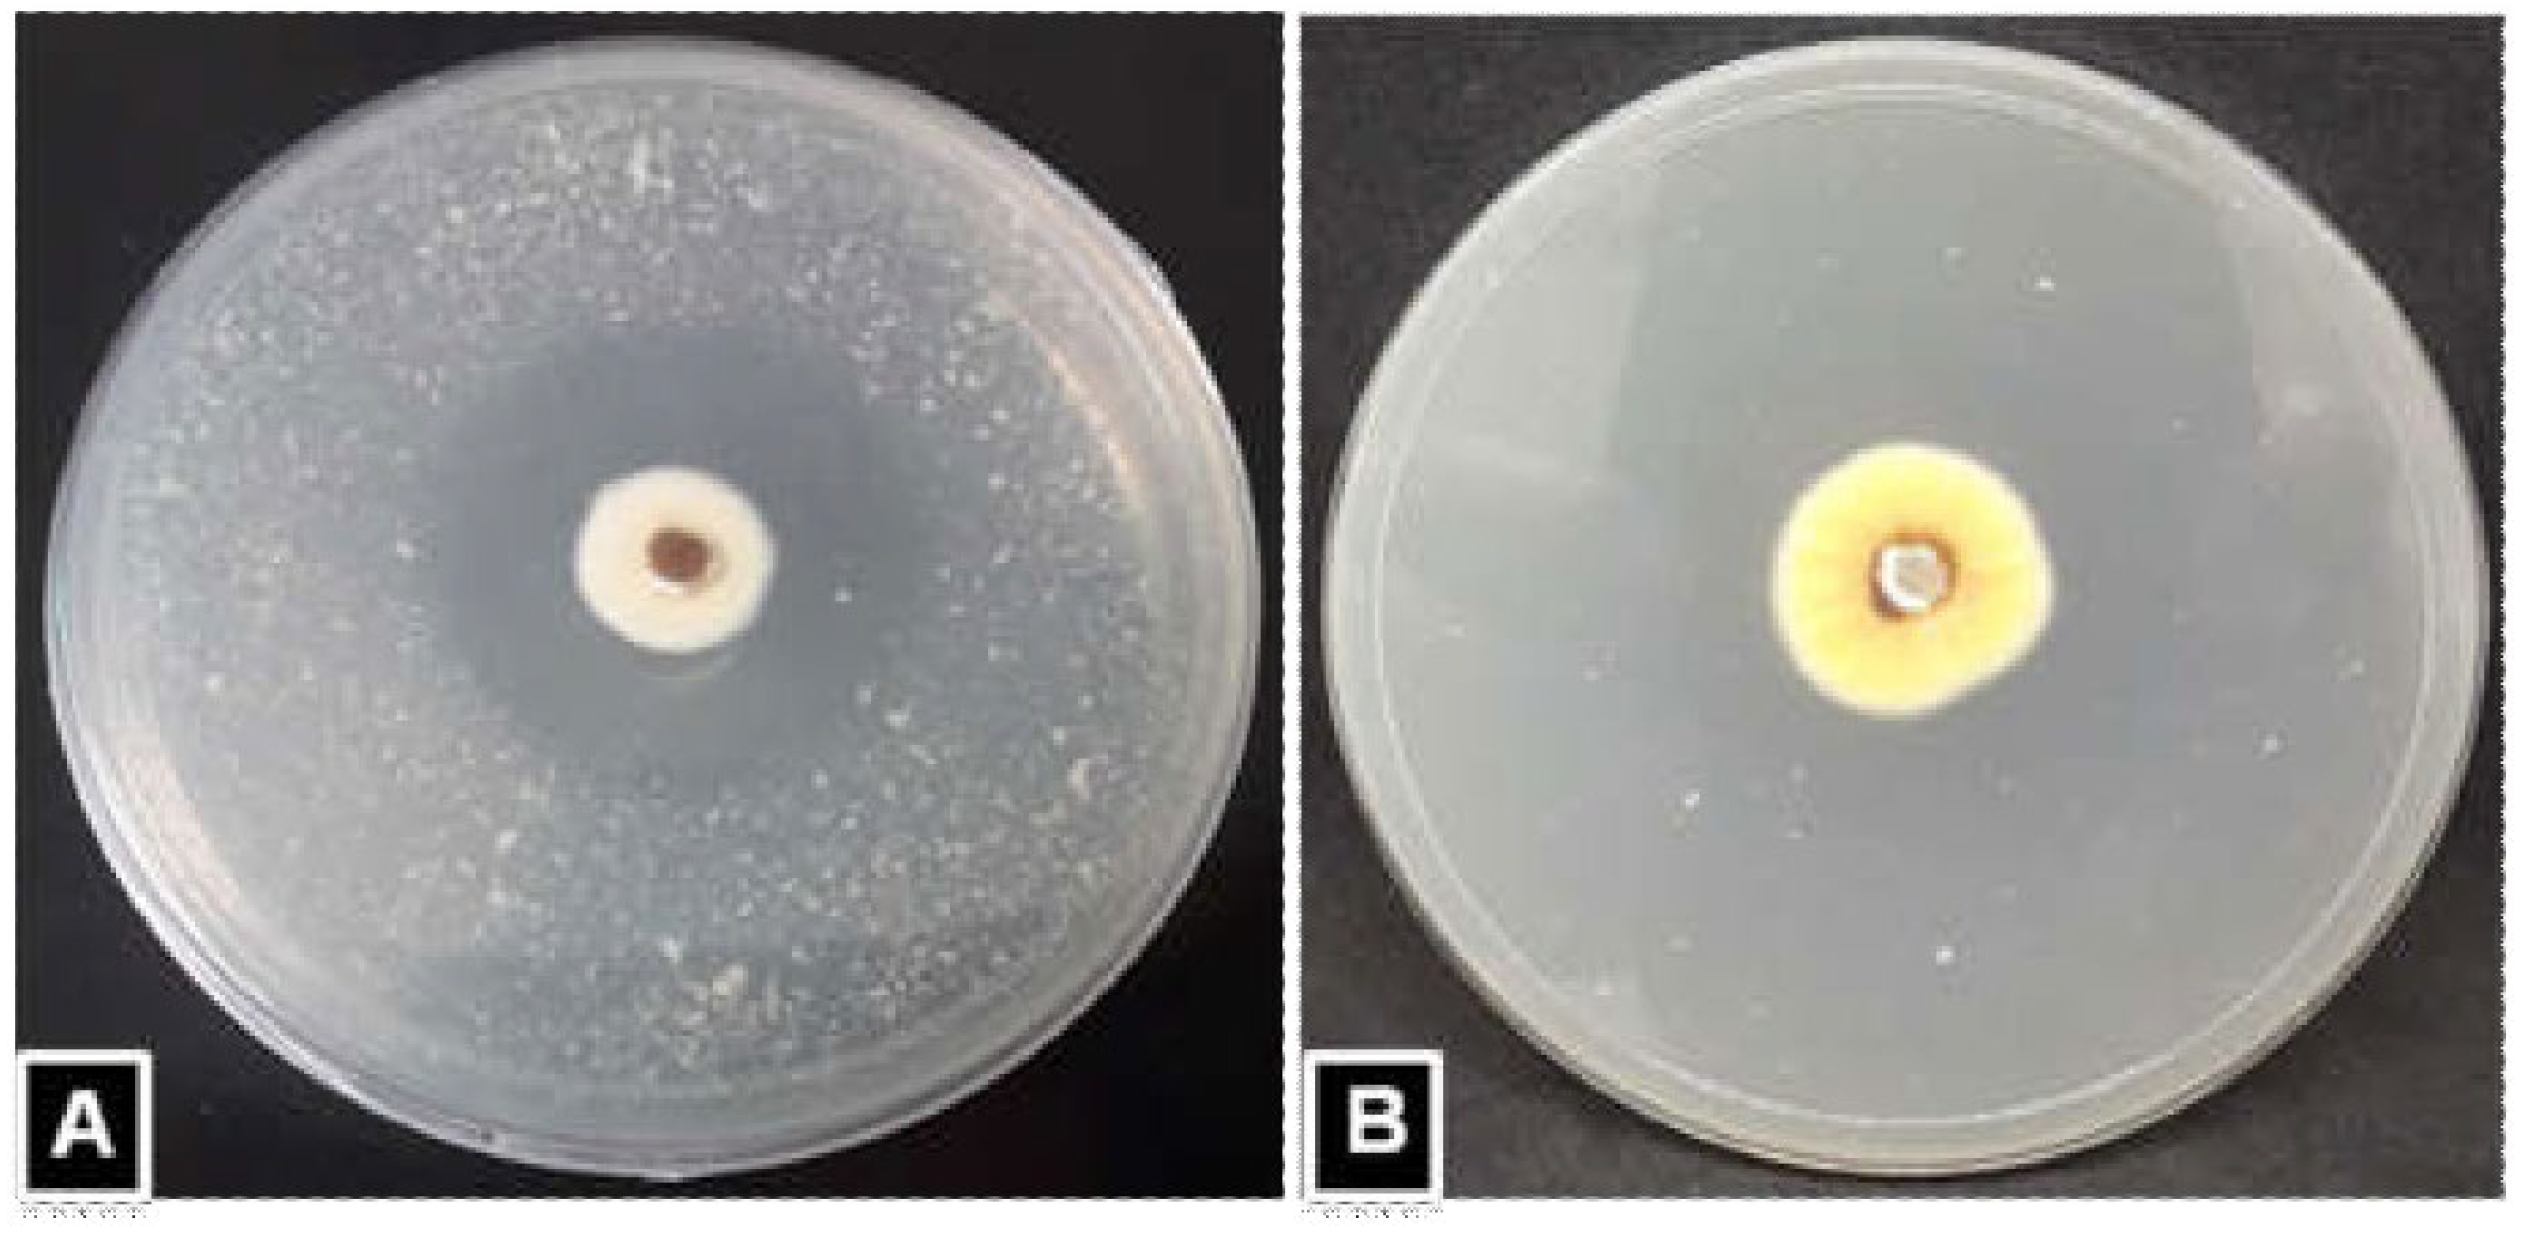
Figure 1. Proteolytic activity of representative fungi isolate (representative of 10 isolates) on the skimmed milk agar (SMA) medium, showing clear zone around the colonies incubated for 48 h at 28 °C. (A) Isolate PLTP5; (B) Negative control (Isolate: TS13).
Horticulturae 08 00808 g001
Figure 3. Phylogenetic relationship of 10 fungi isolates following the UPGMA method, using ITS 1-5.8 S-ITS 2 rDNA sequences. The nodes’ bootstrap values were on the basis of 10,000 replicates. Our isolates were represented by bold letters. Metarhizium anisopliae was used as the outgroup in this tree.
Horticulturae 08 00808 g003
Figure 4. Population of C. lanigera per leave treated with 1 × 10⁸ conidia mL−1 of EPF isolates, recorded at different time intervals after first spray. Different letters (a–d) in columns indicate significant differences (p ≤ 0.05) among the isolates. Columns represent the mean ± SD (n = 3). SD = standard deviation.
Horticulturae 08 00808 g004
Figure 5. Population of C. lanigera per leave treated with 1 × 10⁸ conidia mL−1 of EPF isolates, recorded at different time intervals after second spray. Different letters (a–c) in columns indicate significant differences (p ≤ 0.05) among the isolates. Columns represent the mean ± SD (n = 3). SD = standard deviation.
Horticulturae 08 00808 g005
Figure 6. Population of C. lanigera per leave treated with 1 × 10⁸ conidia mL−1 of EPF isolates, recorded at different time intervals after third spray. Different letters (a–c) in columns indicate significant differences (p ≤ 0.05) among the isolates. Columns represent the mean ± SD (n = 3). SD = standard deviation.
Horticulturae 08 00808 g006
Figure 7. Population of C. lanigera per leave treated with 1 × 10⁸ conidia mL−1 of EPF isolates, recorded at different time intervals after fourth spray. Different letters (a–c) in columns indicate significant differences (p ≤ 0.05) among the isolates. Columns represent the mean ± SD (n = 3). SD = standard deviation.
Horticulturae 08 00808 g007
Figure 8. Population of conidia (log10 CFUs/2 cm diameter leaf disc) recovered at different times from sugarcane leaves sprayed with conidia formulation (1 × 10⁸ conidia mL−1) of the isolates. Different letters (a–c) in columns indicate significant differences (p ≤ 0.05) among the isolates. Columns represent the mean ± SD (n = 3). SD = standard deviation.
Horticulturae 08 00808 g008
Figure 9. Effect of EPF conidia formulation application on the leaf length of sugarcane. Different letters (a–c) in columns indicate significant differences (p ≤ 0.05) among the isolates. Columns represent the mean ± SD (n = 3). SD = standard deviation.
Horticulturae 08 00808 g009
Figure 10. Effect of EPF conidia formulation application on the leaf width of sugarcane. Different letters (a–c) in columns indicate significant differences (p ≤ 0.05) among the isolates. Columns represent the mean ± SD (n = 3). SD = standard deviation.
Horticulturae 08 00808 g010
Figure 11. Effect of EPF conidia formulation application on the height of sugarcane. Different letters (a–d) in columns indicate significant differences (p ≤ 0.05) among the isolates. Columns represent the mean ± SD (n = 3). SD = standard deviation.
Horticulturae 08 00808 g011
Figure 12. Effect of EPF conidia formulation application on the girth of sugarcane. Different letters (a–c) in columns indicate significant differences (p ≤ 0.05) among the isolates. Columns represent the mean ± SD (n = 3). SD = standard deviation.
Horticulturae 08 00808 g012
Figure 13. Effect of EPF conidia formulation application on the weight of sugarcane. Different letters (a–d) in columns indicate significant differences (p ≤ 0.05) among the isolates. Columns represent the mean ± SD (n = 3). SD = standard deviation.
Horticulturae 08 00808 g013
Figure 14. Effect of EPF conidia formulation application on the sugar content (brix%) of sugarcane. Different letters (a–c) in columns indicate significant differences (p ≤ 0.05) among the isolates. Columns represent the mean ± SD (n = 3). SD = standard deviation.
Horticulturae 08 00808 g014
Table 1. Enzyme Index (EI) of the protease producing fungi isolates.
IsolatesDiameter (mm) of Degradation Zone (R)
(Diameter of Clear Zone + Diameter of Colony)
Diameter (mm) of Colony (r)Enzyme Index (EI) = Diameter of Degradation Zone(R)/Diameter of Colony (r)
Incubation PeriodsIncubation PeriodsIncubation Periods
24 h48 h72 h24 h48 h72 h24 h48 h72 h
PLMS416.00 ± 1.00 bcd25.00 ± 1.00 cd30.00 ± 1.00 def7.33 ± 0.58 ab10.00 ± 1.00 ab16.66 ± 0.58 ab2.18 ± 0.2 cd2.50 ± 0.15 bcd1.79 ± 0.03 efg
PLTP518.66 ± 0.58 a27.33 ± 0.58 a34.00 ± 1.00 a6.66 ± 0.58 b9.33 ± 0.58 b15.00 ± 1.00 c2.80 ± 0.17 a2.93 ± 0.21 a2.29 ± 0.06 a
PLKM716.66 ± 0.58 bc26.66 ± 1.53 abc30.66 ± 0.58 bcde7.33 ± 0.58 ab10.33 ± 1.15 ab16.33 ± 0.58 abc2.31 ± 0.09 bcd2.58 ± 0.17 bcd1.87 ± 0.06 de
PLPS817.33 ± 0.58 ab26.33 ± 0.58 abc32.33 ± 1.53 ab6.66± 0.58 b9.66 ± 0.58 ab15.33 ± 0.58 bc2.60 ± 0.21 ab2.73 ± 0.13 ab2.10 ± 0.04 b
PLMS915.00 ± 1.00 d24.00 ± 1.00 d28.00 ± 1.00 g7.33 ± 0.58 ab10.66 ± 0.58 ab16.66 ± 0.58 ab2.04 ± 0.19 cd2.25 ± 0.24 d1.68 ± 0.13 g
PLMC1117.00 ± 1.00 bc27.00 ± 1.00 ab32.00 ± 1.00 bc7.00 ± 1.00 ab10.00 ± 1.00 ab15.66 ± 0.58 abc2.45 ± 0.33 abc2.70 ± 0.17 abc2.04 ± 0.03 bc
PLMS1216.33 ± 0.58 bcd26.33 ± 1.15 abc30.33 ± 1.15 cdef7.33 ± 0.58 ab10.33 ± 0.58 ab16.33 ± 0.58 abc2.23 ± 0.2 cd2.55 ± 0.13 bcd1.85 ± 0.07 def
PLMS4415.66 ± 1.15 cd25.33 ± 1.15 bcd29.00 ± 1.00 efg7.00 ± 1.00 ab10.33 ± 0.58 ab16.66 ± 1.53 ab2.16 ± 0.25 cd2.45 ± 0.13 bcd1.74 ± 0.11 efg
PLMS8815.00 ± 1.00 d25.33 ± 0.58 bcd28.66 ± 0.58 fg8.33 ± 0.60 a11.00 ± 1.00 a17.00 ± 1.00 a1.80 ± 0.21 d2.30 ± 0.33 cd1.69 ± 0.13 g
PLMS11316.66 ± 1.53 bc26.33± 1.15 abc31.00 ± 1.00 bcd7.00 ± 1.00 ab10.00 ± 1.00 ab16.33 ± 1.00 abc2.39 ± 0.13 bcd2.60 ± 0.16 bcd1.89 ± 0.06 cd
LSD (0.05)1.611.731.751.351.521.550.350.320.13
Different letters (a–g) in columns indicate significant differences (p ≤ 0.05) among the isolates within each parameter, as per LSD test. Each value represents the mean ± SD (n = 3). LSD = Least Significant Difference.
Table 2. Colony growth rate and conidia density among the proteolytic isolates.
IsolatesColony Growth Rate/Day (mm)Spore Density (×108 Spore mL−1)
PLMS45.46 ± 0.17 bc3.37 ± 0.31 c
PLTP54.59 ± 0.31 f3.78 ± 0.19 bc
PLKM75.33 ± 0.13 bcd3.56 ± 0.28 c
PLPS84.86 ± 0.20 ef3.68 ± 0.14 bc
PLMS95.66 ± 0.17 ab4.17 ± 0.30 ab
PLMC115.02 ± 0.17 de3.64 ± 0.23 c
PLMS125.37 ± 0.20 bc3.49 ± 0.25 c
PLMS445.51 ± 0.25 abc3.42 ± 0.30 c
PLMS885.84 ± 0.17 a4.45 ± 0.20 a
PLMS1135.17 ± 0.17 cde3.61 ± 0.13 c
LSD (0.05)0.340.50
Different letters (a–f) in columns indicate significant differences (p ≤ 0.05) among the isolates within each parameter, as per LSD test. Each value represents the mean ± SD (n = 3). LSD = Least Significant Difference.
Table 3. Descriptions of proteolytic fungi isolated from different locations in Sabah, Malaysia.
IsolatesSpecies of FungiPercentage of IdentityGenBank
Accession
Number
CropsLocations
PLMS4P. lilacinum100.00MT529673.1BrinjalMenggatal
PLTP5P. lilacinum99.36MK952567.1PumpkinTuaran
PLKM7P. lilacinum100.00MK724002.1MaizeKotabelud
PLPS8P. lilacinum100.00MT529673.1SugarcanePapar
PLMS9P. lilacinum99.57KJ191566.1BrinjalPenampang
PLMC11P. lilacinum98.86KJ191566.1MustardPutatan
PLMS12P. lilacinum99.37MN962646.1OkraKotabelud
PLMS44P. lilacinum100.00MZ151176.1OkraPenampang
PLMS88P. lilacinum100.00MZ290901.1MustardMenggatal
PLMS113P. lilacinum98.08MG748677.1SugarcanePutatan
Table 4. LC50 and LC90 values for the efficacy of the isolates against SWA adults, using different concentrations (1 × 10⁵ to 1 × 10⁸ conidia mL−1) of conidia suspension, after 6 days’ treatment.
IsolatesConidia Conc.
(Conidia mL−1)
Mortality (%) after 6 Days.Log10 of
Conidia Conc.
Probit
Mortality
Regression
Statistics,
a = slope
b = intercept
Regression
Equation,
Y = aX + b
LC50
(in LC50 Calculation, Y = 5,
LC50 = antilogX)
LC90
(in LC90 Calculation, Y = 6.28, LC90 = antilogX)
PLMS41 × 10540.2554.75a = 0.311
b = 3.186
Y = 0.311X + 3.1866.76 × 1058.87 × 109
1 × 10650.0065.00
1 × 10767.3475.44
1 × 10874.4985.64
PLTP51 × 10552.5255.08a = 0.375
b = 3.155
Y = 0.375X + 3.1558.31 × 1042.13 × 108
1 × 10660.6765.28
1 × 10781.0175.88
1 × 10887.2686.13
PLKM71 × 10541.1054.77a = 0.336
b = 3.081
Y = 0.336X + 3.0815.12 × 1053.31 × 109
1 × 10651.6065.05
1 × 10768.8375.50
1 × 10877.3485.74
PLPS81 × 10548.2154.95a = 0.345
b = 3.175
Y = 0.345X + 3.1751.99 × 1059.39 × 108
1 × 10655.2765.13
1 × 10775.3575.67
1 × 10881.5885.92
PLMS91 × 10548.2154.72a = 0.287
b = 3.272
Y = 0.287X + 3.2721.04 × 1063.01 × 1010
1 × 10655.2764.92
1 × 10775.3575.39
1 × 10881.5885.52
PLMC111 × 10543.8954.85a = 0.341
b = 3.121
Y = 0.341X + 3.1213.23 × 1051.81 × 109
1 × 10653.0565.08
1 × 10773.1875.61
1 × 10879.4785.81
PLMS121 × 10540.9854.77a = 0.314
b = 3.194
Y = 0.314X + 3.1945.60 × 1056.60 × 109
1 × 10650.8665.03
1 × 10768.0975.47
1 × 10875.1885.67
PLMS441 × 10539.5454.75a = 0.314
b = 3.159
Y = 0.314X + 3.1597.24 × 1058.51 × 109
1 × 10649.2664.97
1 × 10766.6275.44
1 × 10873.7985.64
PLMS881 × 10538.8354.72a = 0.293
b = 3.324
Y = 0.293X + 3.3241.00 × 1062.34 × 1010
1 × 10647.7964.95
1 × 10765.1775.39
1 × 10871.4685.55
PLMS1131 × 10541.8254.80a = 0.338
b = 3.078
Y = 0.338X + 3.0784.78× 1052.95 × 109
1 × 10650.7465.03
1 × 10769.5475.50
1 × 10878.0585.77
1 × 10550.3555.00a = 0.347
b = 3.212
Y = 0.347X + 3.2121.41 × 1056.91 × 108
GHA1 × 10655.8165.15
1 × 10777.5475.77
1 × 10883.0085.95
Table 5. LT50 and LT90 values for the efficacy of the isolates against SWA adults, using mortality of different times (2 to 6 days) at 1 × 10⁸ conidia mL−1 suspension.
IsolatesMortality Time (Day)Mortality (%)Log10 of
Mortality Time (Day)
Probit
Mortality
Regression
Statistics, a = slope
b = intercept
Regression
Equation,
Y = aX + b
LT50
(in LT50 Calculation, Y = 5, LT50 = antilogX) (Day)
LT90
(in LT90 Calculation, Y = 6.28, LT90 = antilogX) (Day)
PLMS4212.000.303.82a = 3.954
b = 2.630
Y = 3.954 X + 2.6303.978.37
328.850.484.42
457.220.605.18
565.010.705.39
674.790.785.64
PLTP5217.330.304.05a = 4.512
b = 2.638
Y = 4.512 X + 2.6383.166.30
336.910.484.67
465.530.605.41
579.700.705.84
687.260.786.13
PLKM7211.330.303.77a = 4.164
b = 2.544
Y = 4.164 X + 2.5443.897.76
330.870.484.50
458.610.605.20
566.400.705.41
677.340.785.74
PLPS8214.660.303.96a = 4.221
b = 2.653
Y = 4.221 X + 2.6533.557.24
332.880.484.56
461.390.605.28
572.690.705.61
681.850.785.92
PLMS9211.330.303.77a = 3.823
b = 2.636
Y = 3.823 X + 2.6364.148.97
327.510.484.39
454.460.605.10
562.910.705.33
670.060.785.52
PLMC11213.330.303.87a = 4.208
b = 2.587
Y = 4.208 X + 2.5873.717.58
330.870.484.50
459.290.605.23
570.590.705.55
679.340.785.81
PLMS12212.660.303.82a = 3.996
b = 2.622
Y = 3.996 X + 2.6223.938.22
329.530.484.45
457.200.605.18
565.700.705.41
675.180.785.67
PLMS44212.000.303.82a = 3.958
b = 2.631
Y = 3.958 X + 2.6313.968.33
328.190.484.42
457.930.605.20
565.050.705.39
673.790.785.64
PLMS88211.330.303.77a = 3.911
b = 2.614
Y = 3.911 X + 2.6144.078.64
327.520.484.39
455.850.605.18
563.670.705.36
671.460.785.55
PLMS113213.330.303.87a = 4.098
b = 2.625
Y = 4.098X + 2.6253.807.78
330.850.484.50
458.610.605.20
569.210.705.50
678.050.785.77
GHA215.330.303.96a = 4.312
b = 2.653
Y = 4.312 X + 2.6533.546.91
335.560.484.64
463.460.605.33
575.550.705.71
683.000.785.95
Publisher’s Note: MDPI stays neutral with regard to jurisdictional claims in published maps and institutional affiliations.