Article

Identification of Reliable Reference Genes for the Expression of Hydrangea macrophylla ‘Bailmer’ and ‘Duro’ Sepal Color

Institute of Vegetables and Flowers, Chinese Academy of Agricultural Sciences, Beijing 100081, China
*
Author to whom correspondence should be addressed.
Horticulturae 2022, 8(9), 835; https://doi.org/10.3390/horticulturae8090835
Submission received: 19 August 2022 / Revised: 6 September 2022 / Accepted: 9 September 2022 / Published: 11 September 2022

Abstract

:
Hydrangea spp. is renowned for its variety of color changes in its developmental stage and before and after aluminum treatment. We analyzed gene expression in hydrangeas sepals to study the causes of color change. The accuracy of quantitative RT-qPCR analysis depends on the reliability of reference genes. We selected reference genes for hydrangea of varying cultivars, at different developmental stages, and in aluminum treatment groups. We chose ‘Bailmer’ and ‘Duro’ as subject species. We selected eight candidate genes, all of which were ranked by geNorm, NormFinder, BestKeeper, and RefFinder. CCR, NHX1, and LODX were used to verify the exactitude of reference genes. According to the ranking result of RefFinder, the top-ranked reference genes in each group were different; the top four candidate reference genes in each group mostly included EF1-β, RPL34, GADPH, and RPL10. EF1-β and RPL34 ranked top in the ‘all materials’ group, and their expression trends, obtained from the analysis of CCR, NHX1, and LODX, were consistent. From the results, we gather that EF1-β and RPL34 can be used as reference genes to quantify target gene expression. In this study, we screened for reference genes in hydrangeas to provide a technical basis for hydrangea sepal formation and transformation for further experiments.

1. Introduction

Bigleaf hydrangea (Hydrangea macrophylla) is native to China, Japan, and East Asia [1,2]. The sepals of unfertile flowers are ornamental organs [3]. The sepals of hydrangeas, which are blue under Al3+ treatment of soil and pink in soil with insufficient Al3+, hold cultural significance [4]. Hydrangeas, therefore, are popular as cut flowers in Europe, North America, and Asia [5]. However, the color changes of different varieties before and after aluminum treatment are different [2]. Transcriptome analysis may explain the cause of this transformation.
Real-time reverse transcription polymerase chain reaction (RT-qPCR) is an effective method for quantifying transcription [6]. RT-qPCR has high sensitivity and strong signal specificity in a series of targets [7]. However, physiological and technical influences may cause deviations in the results of qPCR; therefore, reference genes are used as references for analyzing various transcript abundances [8,9]. It is important to quantify the stabilization of reference genes since stabilization often differs according to the materials or treatments used [10,11,12,13]. The genes chosen as references tend to be highly conserved housekeeping genes [10]. Stable reference genes have been identified across multiple taxa within previous studies, including glyceraldehyde 3-phosphatedehydrogenase (GAPDH) and β-actin (ACTB) in mammalian transcription [14]. Ubiquitin (UBI) was the optimal reference gene in postharvest roses (Rosa spp.) [15]. Elongation factor 1-α (EF1-α) was adapted as a reference gene in lily (Family Liliaceae) tepals at different developmental stages and in different tissues [16]. Ribosomal protein L19 (RPL19) is the most stable reference gene in potato issue [17]. Today, an increasing number of scholars are interested in the process of allochroic hydrangeas [18,19].
To our knowledge, no corresponding reference genes amongst different varieties, development stages, and cultivars have been identified. Hence, particular reference genes adapted to the relevant materials need to be screened.

2. Materials and Methods

2.1. Plant Materials

Hydrangea macrophylla cultivar ‘Bailmer’ and ‘Duro’ cuttings were potted in 15 cm pot. 16 pots for each variety, 8 pots each for the control group and the aluminum treatment group, and all placed in greenhouses. ‘Huaduoduo’ compound fertilizer was formulated into a solution and used as a nutrient solution. All materials were cultivated for 2 years before the experiment. The registered name of ‘endless summer the original’ is ‘Bailmer’(‘Bailmer’ is abbreviated as B). This cultivar does not require dormancy for bloom. The floral organ is pink in the culture condition in which Al3+ is absent, and it is blue in the Al3+ sufficient condition. In contrast to ‘Bailmer’, dormancy is required for the ‘Duro’ cultivar to bloom (‘Duro’ was abbreviated as D). This cultivar floral organ is magenta, whether Al3+ is sufficient or not (Figure 1).
Each cultivar is treated with Al3+ and without Al3+, respectively. Materials not treated with Al3+ are called ‘control group (CK)’, and plants treated with 6 g/L Al2(SO4)3·18H2O aqueous solution (pH = 4.5) weekly are named ‘Tr’. Every subgroup has 3 growth stages (stage 1; S1 is bud and the sepal is green. Stage 2: S2 is partially open, upper sepal is colored with pigment, and the lower sepal is green. Stage 3: All sepals were colored with pigment). Including repetition, we collected 36 samples from two cultivars in total, and all materials were collected, just sepals without petals and stamens or pistils. Materials were frozen in liquid nitrogen and reserved at −80 °C.
We divided the 12 samples into four groups (nine subgroups) of experiments. (Table 1).

2.2. RNA Isolation and cDNA Synthesis

The integrated RNA was extracted using the EASYspin Plus Plant RNA Kit (Aidlab, Beijing, China). cDNA was synthesized using the PrimeScriptTM RT reagent kit with gDNA Eraser (Takara, Dalian, China). All RNA samples were adjusted to 25 ng/μL in 20 volume reversed transcription system, and the concentration of RNA samples was measured using an ultraviolet-visible spectrophotometer (Miulab, ND-100, Hangzhou, China), and the quality of RNA samples was tested by agarose gel electrophoresis.

2.3. Selection of Candidate Genes and Prime Design

According to the present research, raw transcriptome data were filtered by uniform thresholds (fragments per kilobase of exon model per million mapped fragments is greater than 100 fragments, and different issue expression quantity variable coefficients are under 0.53), and actin and elongation factors are considered to be added as common reference genes, and candidate reference genes (Actin7, EF1-α, EF1-β, GADPH, RPL10, RPL34, RPS4, and UBI) were chosen among all materials from the date. The RT-qPCR primers were designed using the NCBI primer blast (https://www.ncbi.nlm.nih.gov/tools/primer-blast/index, accessed on 15 January 2021) and integrated DNA technologies (https://sg.idtdna.com/calc/analyzer, accessed on 15 January 2021). The primer length was 20–25 bp, the amplicon length was 81–190 bp (Table 2), and the PCR melting temperature (Tm) was 60–61 °C. Primer specificity was tested by 2% (w/v) gel electrophoretic analysis.

2.4. Quantitative RT-PCR Analysis

LightCycle 480 II (Roche, Switzerland) and Forget-Me-Not™ qPCR Master Mix (Biotium, USA) were used for the RT-qPCR assay. The volume of reaction was 10 μL. The volume of reaction was 10 μL, including 1 µL of cDNA template (about 25 ng RNA), 0.5 μL amplification primer (5 μM), 5 μL 2X Forget-Me-Not™ qPCR Master Mix), and 3 μL sterilization dH2O. The PCR reaction included 95 °C enzyme activation for 2 min, 95 °C denaturation for 5 s, annealing for 10 s, 72 °C for 20 s. All tests consisted of three technical repetitions and three biological repetitions. The standard curve was generated using cDNA (50, 5−1, 5−2, 5−3, 5−4).

2.5. Data Analysis

The quantification cycle (Cq) was used to determine the expression levels. Four applets were used to rank stability of reference genes: geNorm [20], NormFinder [21], BestKeeper [22], and RefFinder (https://www.heartcure.com.au/reffinder/, accessed on 3 April 2021) [23]; 2−ΔΔCq was also used to analyze expression [24].

2.6. Assessment of Normalization

CCR has been shown to control lignin synthesis [25]. Lignin is an important component in xylophyta development [26]. NHX family genes encode famous salt tolerance proteins, which also play a pivotal role in the formation of the blue corolla of Japanese morning glory [27,28]. LODX encodes a dioxygenase that affects anthocyanin synthesis [29]. We used CCR, NHX1, and LODX to evaluate the reliability of the reference genes.
It is necessary to use appropriate software to standardize reference gene selection. geNorm calculates the stability of genes by the M value; the lower the M value, the more stable the genes. In addition, geNorm can calculate the number of reference genes required in testing, providing the desired ‘n’ value when ‘pairwise variation V’ score (Vn/Vn+1) < 0.15 [20]. NormFinder ranks gene stability by calculating the stability value, ρ, which depends on the logarithm of 2Cq mean + standard deviation (SD); the lower the ρ, the higher the gene stability [21]. BestKeeper ranks gene stability mainly by calculating the standard deviation (SD) from row Cq data; other parameters, such as variable coefficients (CV) and correlation coefficients (R2), were used as references. The lower the SD and CV, the more stable the gene [22]. The comparative ΔCt method can also measure stability [30]. The online software, RefFinder assigns an appropriate weight to GeNorm, NormFinder, BestKeeper, and △Cq to screen the best result.

3. Results

3.1. Primer Quality Detection of Each Gene

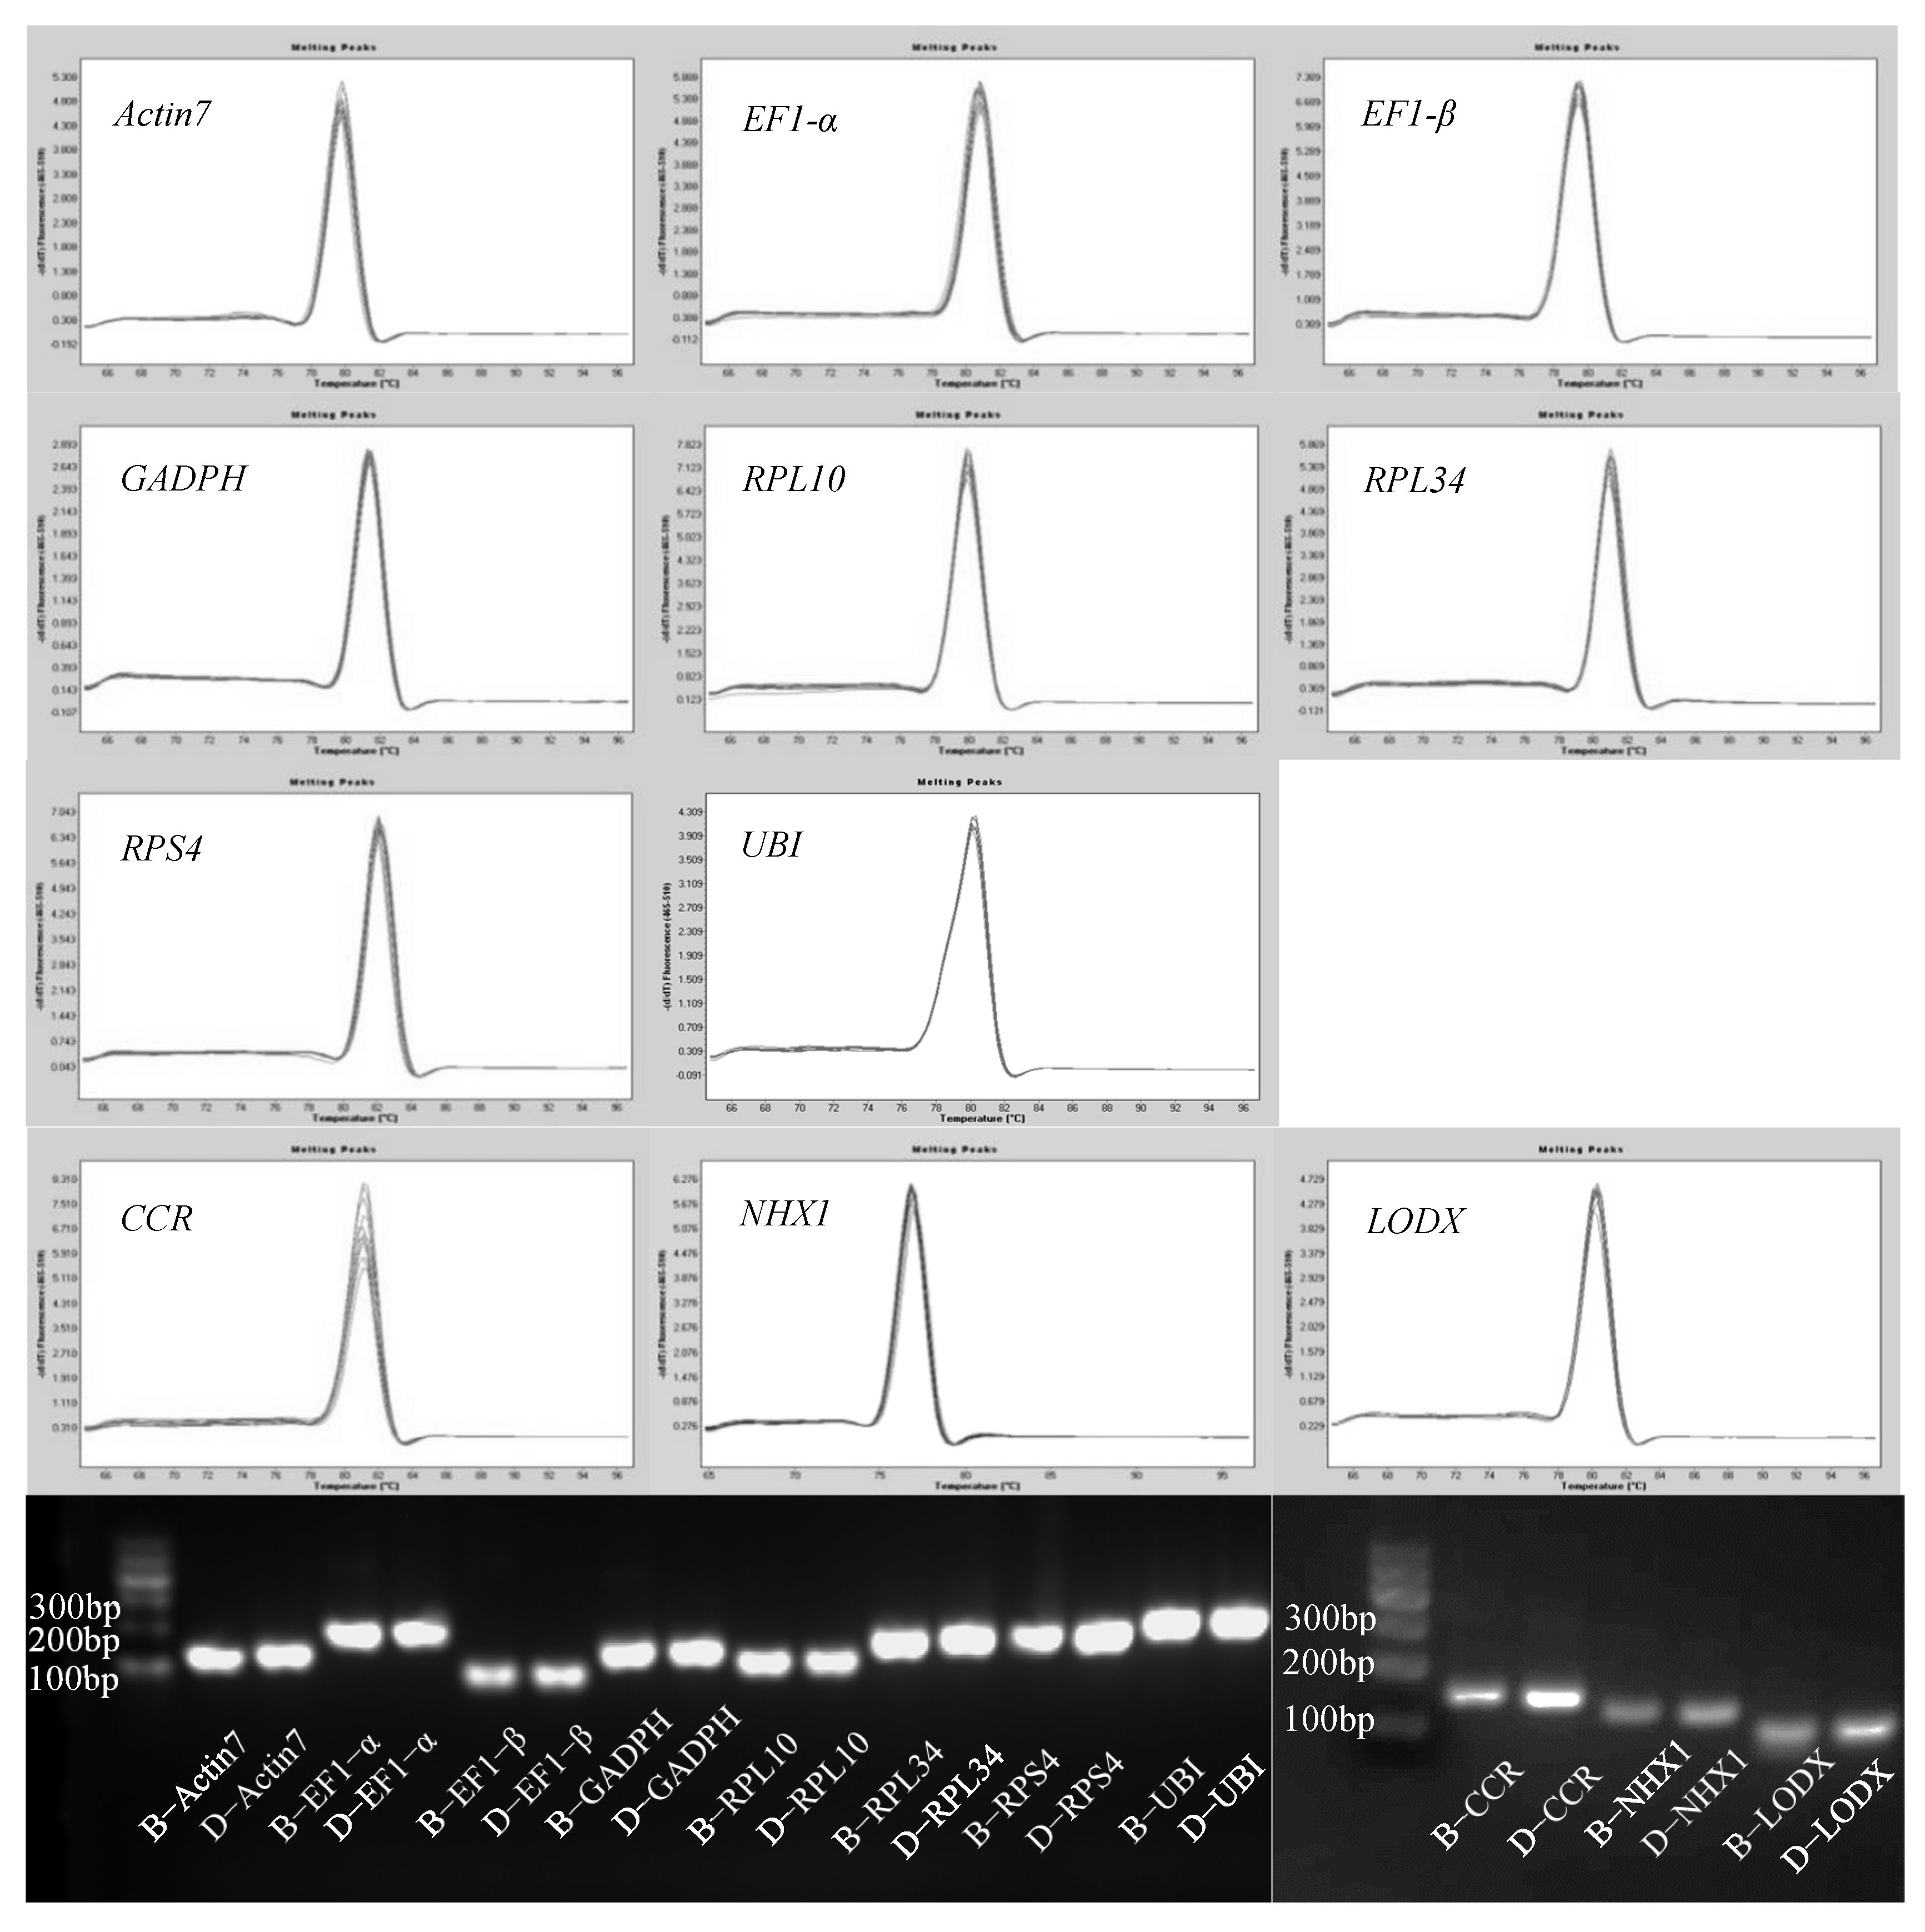
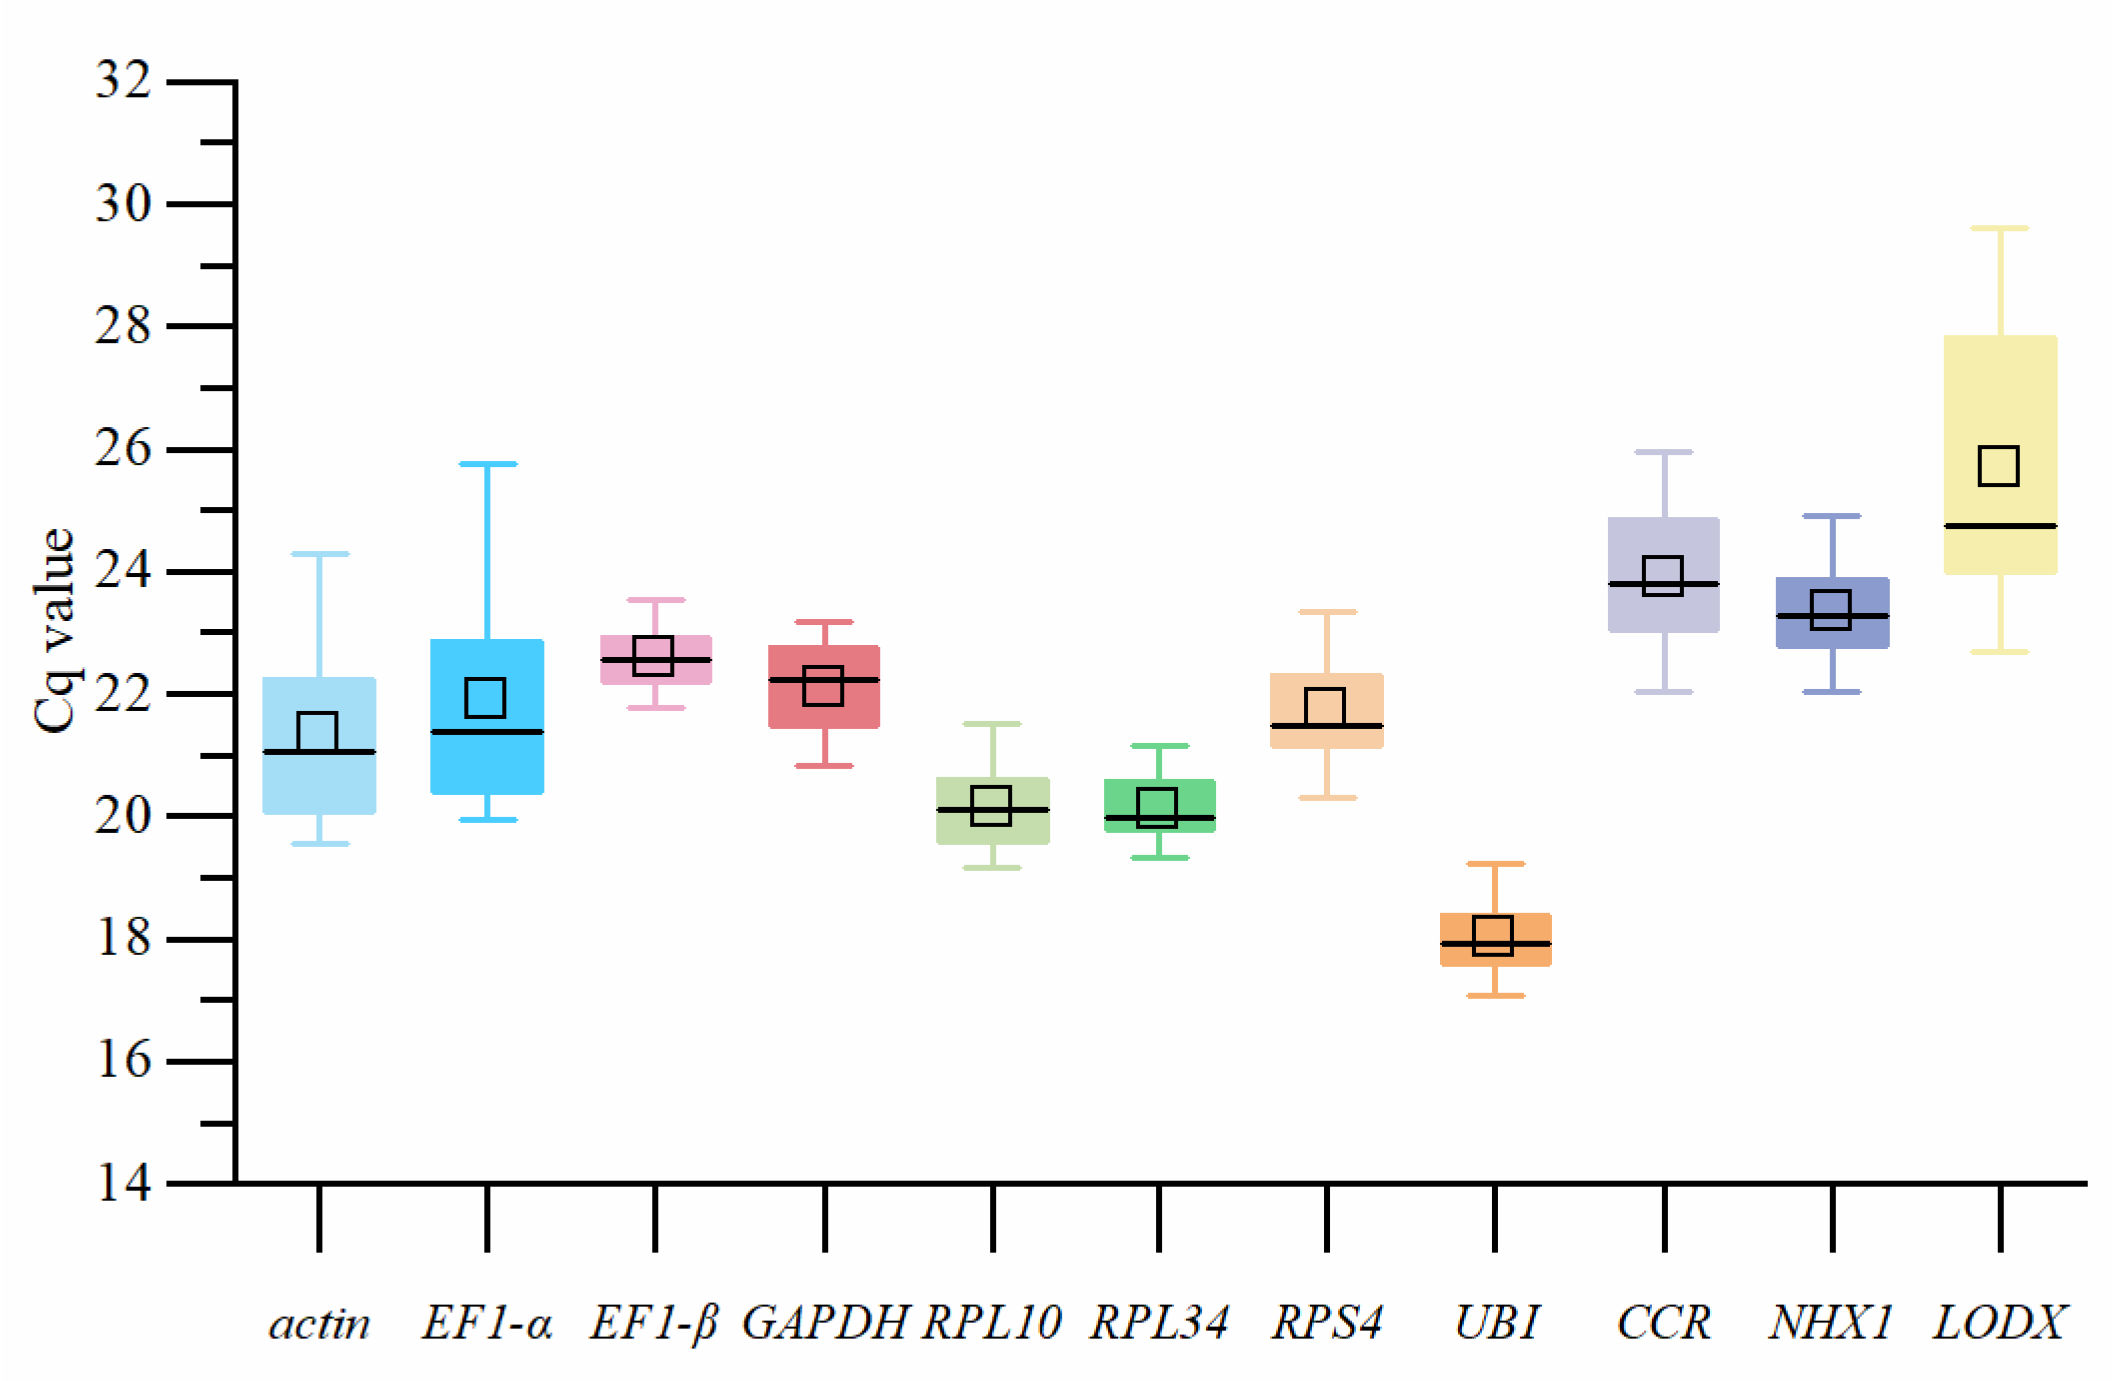
The R2 ranged from 0.958 for RPL10 to 0.999 for Actin7, GADPH, and EF1-β. The amplification efficiency was 86% for EF1-α and 126% for RPL10, the details of which are described in Table 2. All genes melt curve and gel test showed that the specifics of all primers were well, all melt curves had one peak, and all gel showed a single band (Figure 2). We created a boxplot to analyze data outliers and proved that there were no data outliers, with each candidate reference gene average Cq value from 18.02 for UBI to 22.58 for EF1-β (Figure 3).

3.2. geNorm

In this experiment, we needed two reference genes because the V2/V3 value of all groups was less than 0.15. Rank according to geNorm: GADPH and RPL34 adapt to group ‘B CK vs. D CK’ and ‘D CK S1 S2 S3′, EF1-β and RPL34 adapt to group ‘B Tr vs. D Tr’ and group ‘D Tr S1 S2 S3′, RPL34 and RPS4 adapt to group ‘B CK S1 S2 S3′, EF1-β and RPL10 adapt to group ‘B Tr S1 S2 S3′ and ‘B CK vs. B Tr’, RPL10 and RPL34 adapt to group ‘D CK vs. D Tr’, and EF1-β and RPL34 also adapt to group all materials (Table 3).

3.3. NormFinder

Based on NormFinder ranking, GADPH is the most stable gene in group ‘B CK vs. D CK’ ‘D CK S1 S2 S3′ and ‘B CK vs. B Tr’, RPL34 is the most stable gene in group ‘B Tr vs. D Tr’ ‘B Tr S1 S2 S3′ ‘D Tr S1 S2 S3′ and ‘D CK vs. D Tr’, RPL10 is the most stable gene in group ‘B CK S1 S2 S3′, and EF1-β is the most stable gene in group all materials (Table 4).

3.4. BestKeeper

Based on the rank of BestKeeper, EF1-β is the best nominate reference gene in group ‘B CK vs. D CK’ ‘B Tr vs. D Tr’ ‘B CK S1 S2 S3′ and all materials, RPL10 is the best nominate reference gene in group ‘B Tr S1 S2 S3′ ‘D CK S1 S2 S3′ ‘B CK vs. B Tr’ and ‘D CK vs. D Tr’, RPS4 is the best nominate reference gene in group ‘D Tr S1 S2 S3′ (Table 5).

3.5. RefFinder

According to RefFinder, we selected two genes in each group, GADPH and RPL34, which are propitious to group ‘B CK vs. D CK’ and ‘D CK S1 S2 S3′; RPL34 and EF1-β are propitious to group ‘B Tr vs. D Tr’ ‘B Tr S1 S2 S3′ and all materials, RPL10 and GADPH are propitious to group ‘B CK S1 S2 S3′, RPL34 and RPL10 are propitious to group ‘D Tr S1 S2 S3′ and ‘D CK vs. D Tr’, and EF1-β and RPL10 are propitious to group ‘B CK vs. B Tr’ (Table 6).

3.6. Verifying Selected Reference Genes

Although the geNorm calculation result recommends the use of two reference genes for fluorescence quantitative data analysis, we selected the top three reference genes ranked by Normfinder in each subgroup. We selected the two most stable reference genes in each group and, since EF1-β and RPL34 are the most stable reference genes in all materials group, we considered EF1-β and RPL34 to quantify the expression of target genes. We used a single reference gene, the combination of the first two internal reference genes of each subgroup, the combination of EF1-β and RPL34, and the combination of the first three reference genes of each subgroup for normalization analysis. The lowest-ranked candidate reference gene in each subgroup was also used for data analysis.
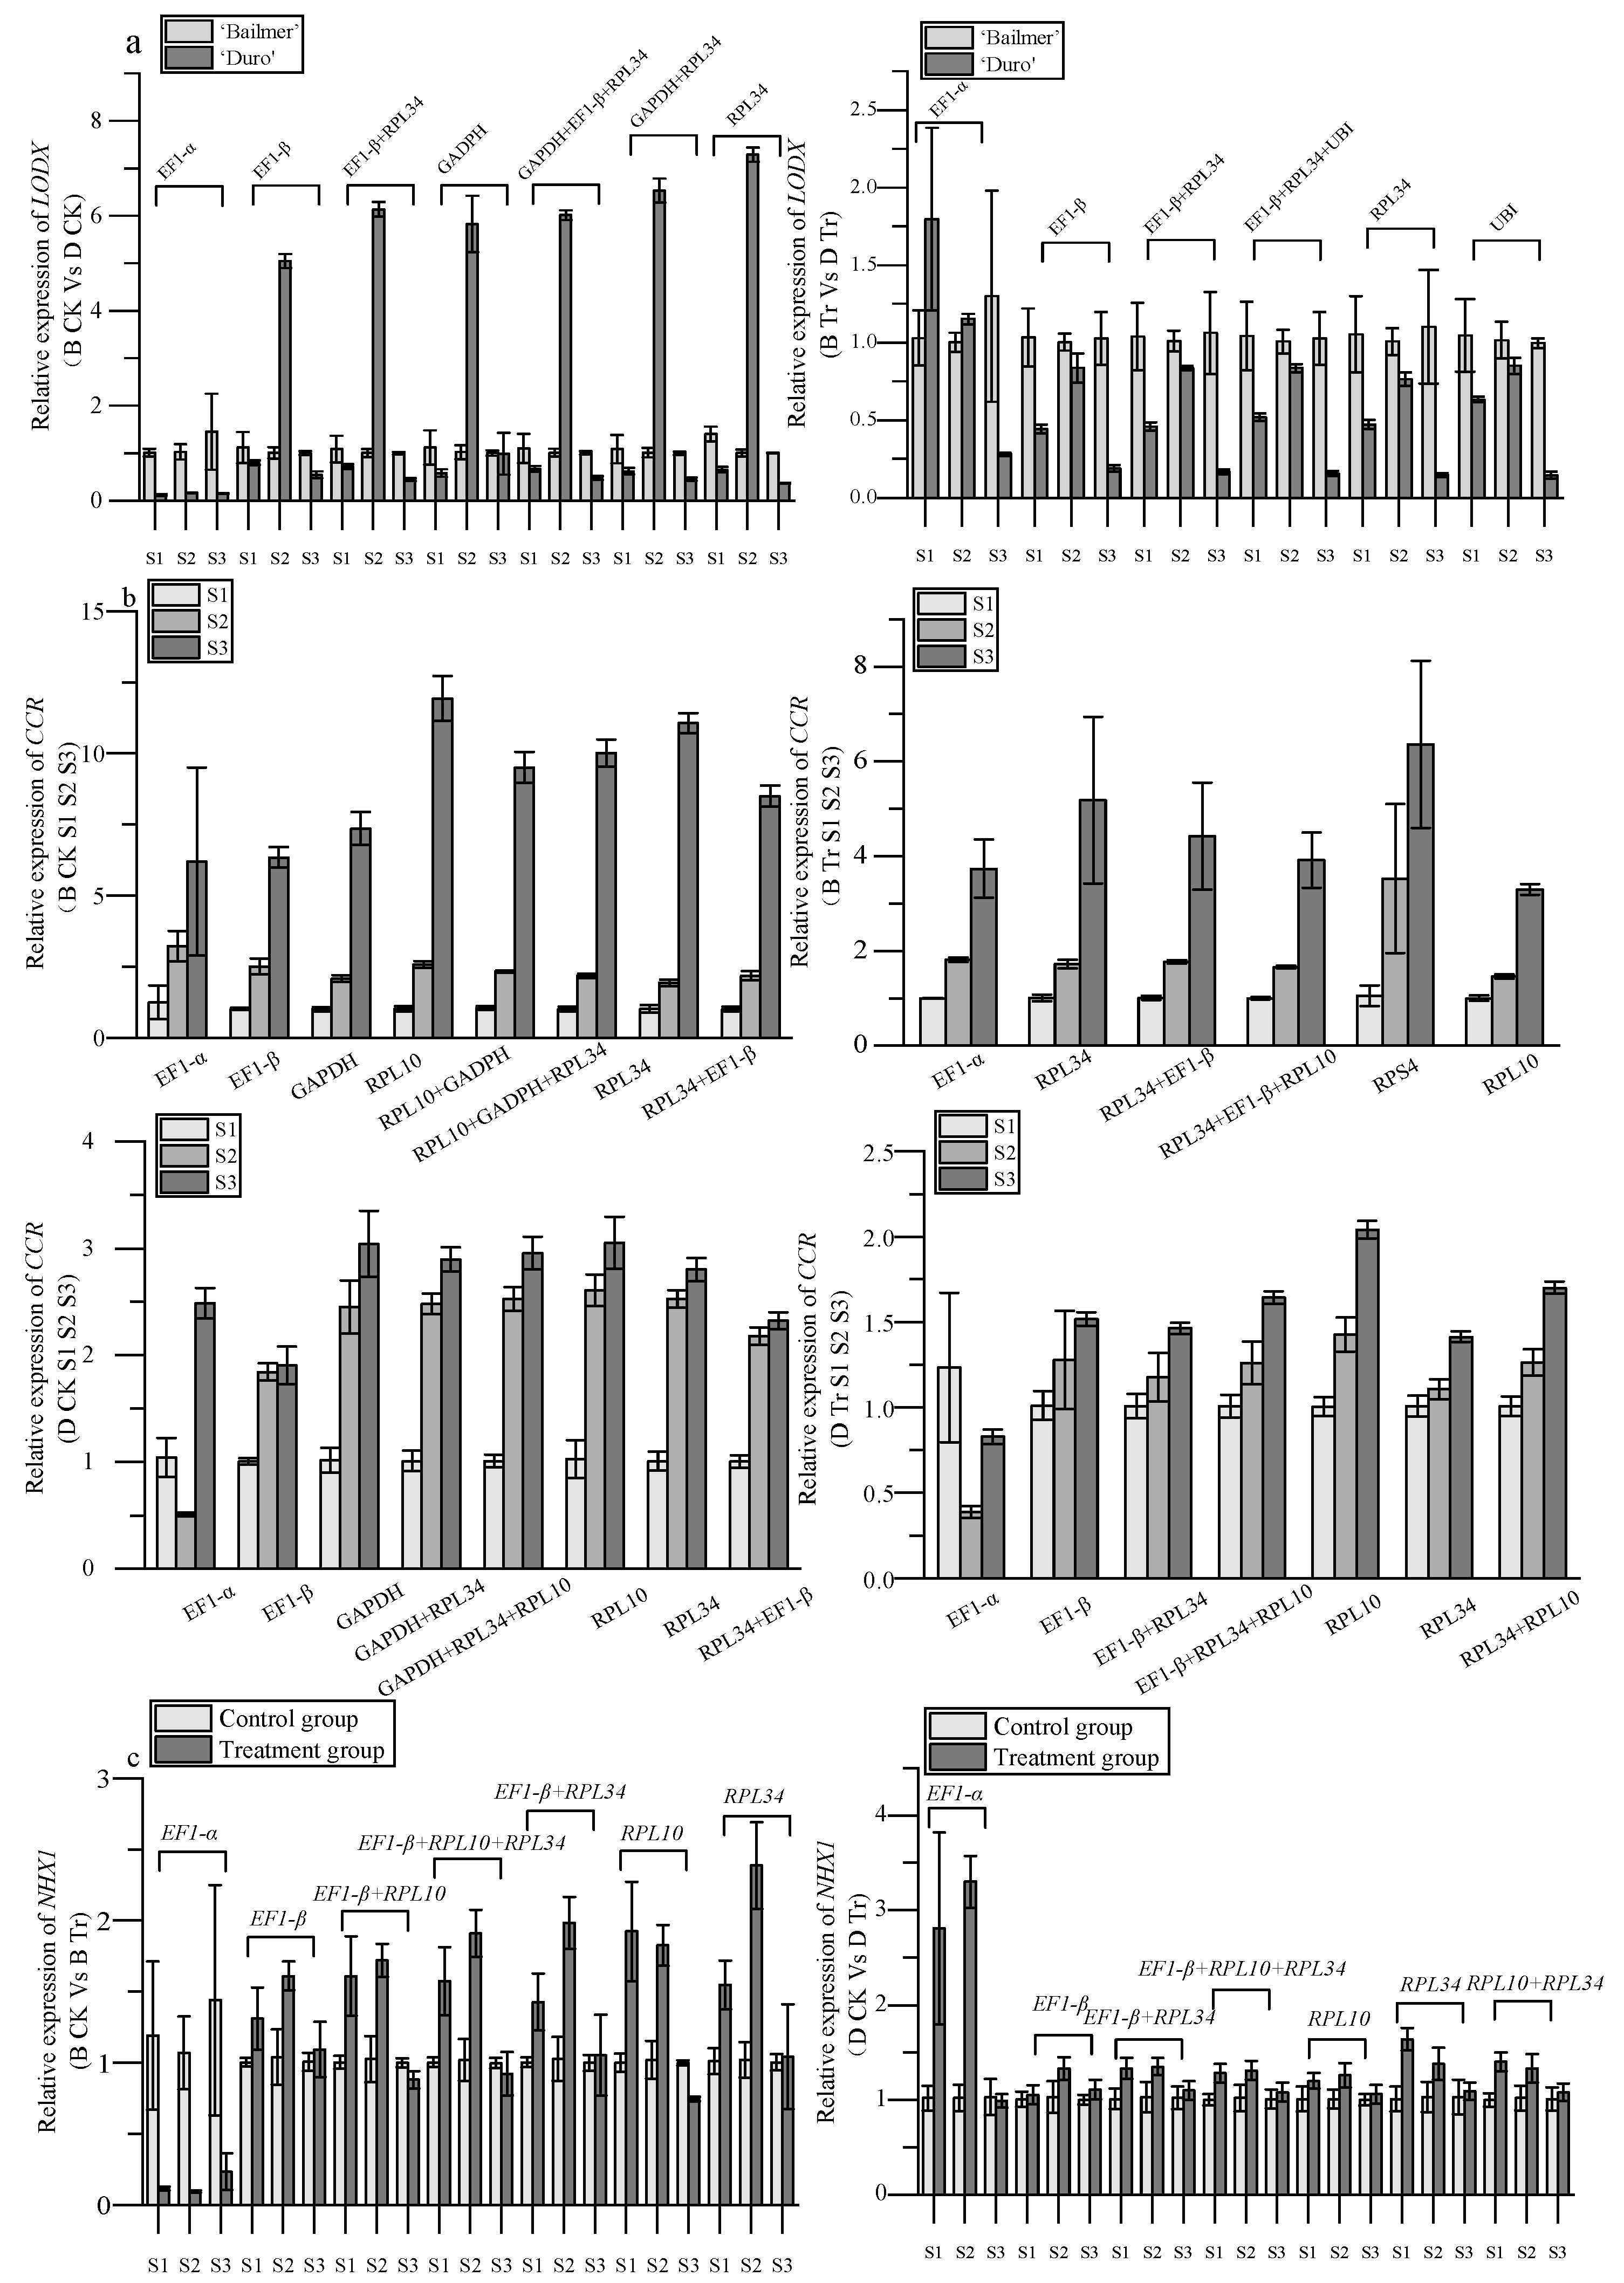
In group ‘B CK vs. D CK’, relative expression of LODX in B CK S2 was higher than the expression in D CK S2 when EF1-α was the reference gene, but this consequence was evidently contrary to GADPH, EF1-β, RPL34, GAPDH+RPL34, EF1-β+RPL34 and GAPDH+EF1-β+RPL34. In the group ‘B Tr vs. D Tr’, expression patterns of LODX in S1 differ when EF1-α was a reference gene and when EF1-β, RPL34, UBI, EF1-β+RPL34, and EF1-β+RPL34+UBI were reference genes. This result also applied to S2, though the difference was not significant (Figure 4a).
In the two groups ‘B CK S1 S2 S3′ and ‘B Tr S1 S2 S3′, CCR expression increased with the development of sepals. In groups ‘D CK S1 S2 S3′ and ‘D Tr S1 S2 S3′, relative expression of CCR was the lowest in S2 when EF1-α was used as reference gene, but the CCR expression pattern is similar to groups ‘B CK S1 S2 S3′ and ‘B Tr S1 S2 S3′ when GADPH, RPL34, RPL10, EF1-β, GAPDH+RPL34, RPL34+EF1-β, and GAPDH+RPL34+RPL10 were used as reference genes in group ‘D CK S1 S2 S3′ and RPL34, RPL10, EF1-β, RPL34+RPL10, EF1-β+RPL34, and EF1-β+RPL34+RPL10 were used as reference genes in group ‘D CK S1 S2 S3′ (Figure 4b).
The treatment group relative expression of NHX1 was higher than that of the control group in group ‘B CK vs B Tr’ and ‘D CK vs D Tr’; when EF1-β, RPL34, EF1-β+ RPL34 were regarded as reference genes in ‘B CK vs B Tr’ and RPL34, RPL10, EF1-β, RPL34+RPL10, EF1-β+RPL34, EF1-β+RPL34+RPL10 were regarded as reference genes in ‘D CK vs. D Tr’. When EF1-α was used as an internal reference gene in group ‘B CK vs B Tr’, and RPL10 was used as a reference gene in the S3 period, this expression pattern showed the opposite trend. (Figure 4c).
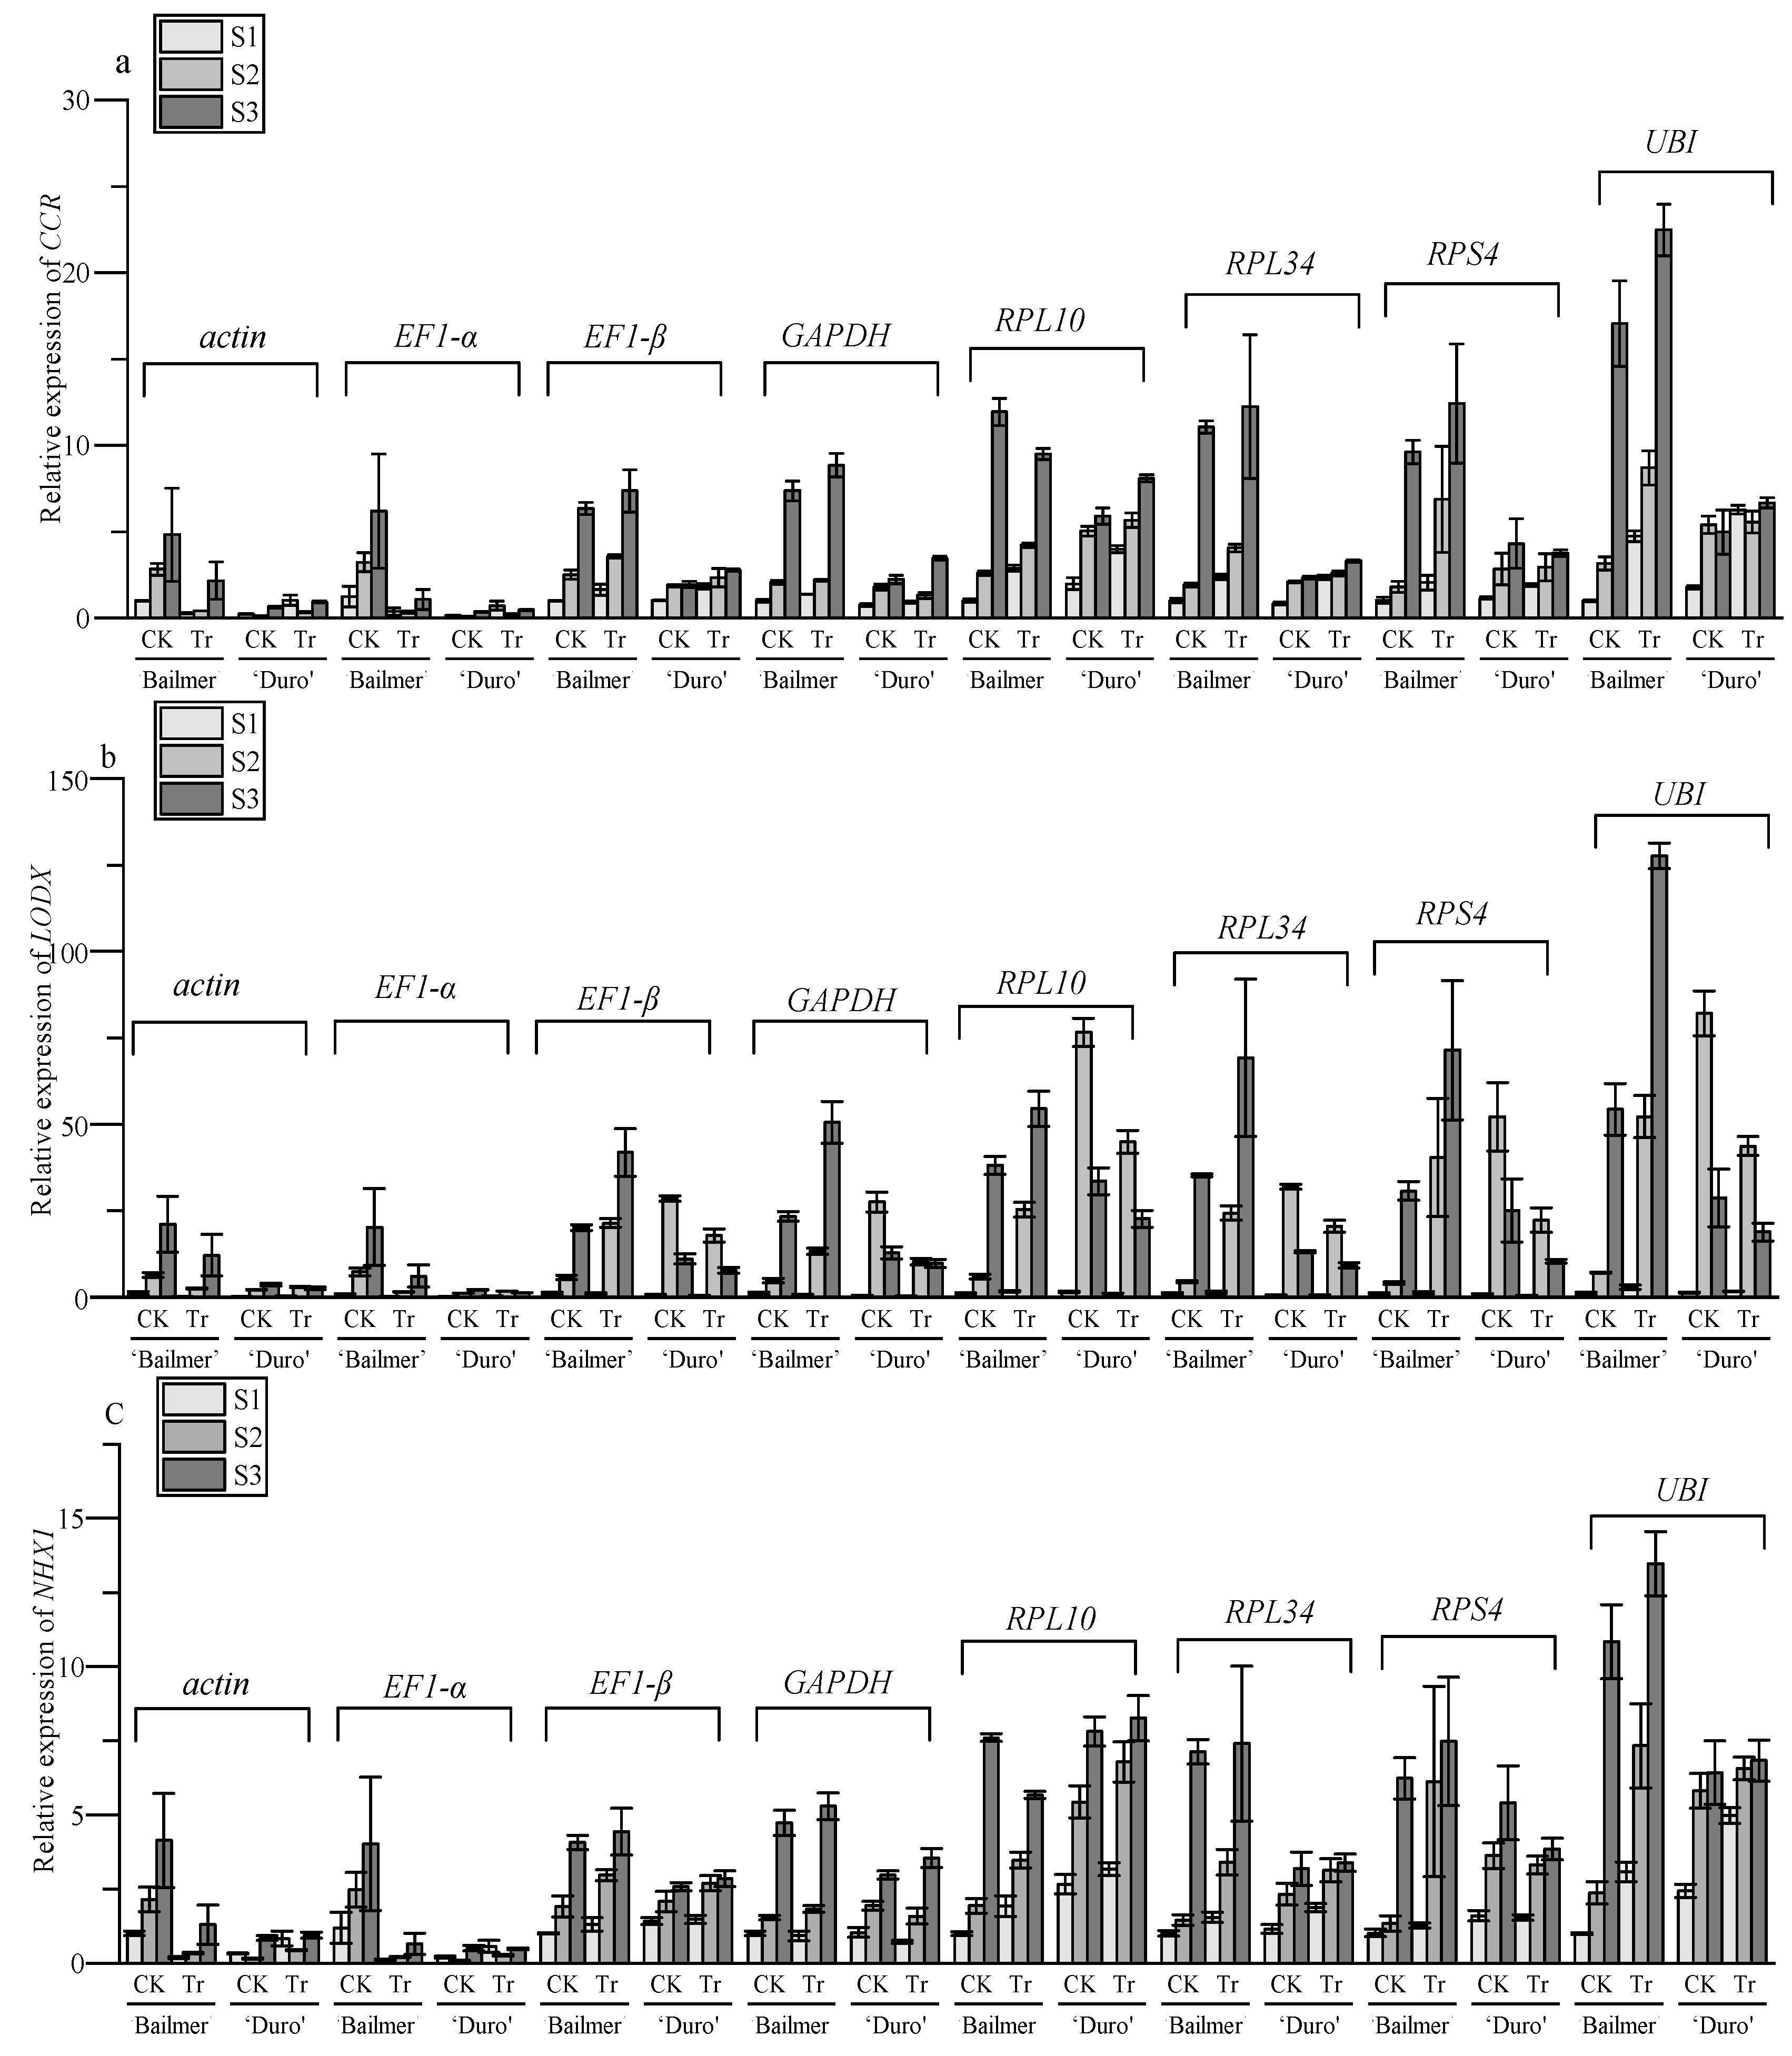
The expression of target genes was analyzed using each reference gene. The results showed that the target gene expression was analyzed using different reference genes, and their expression patterns were not the same. These differences are mainly due to the fact that actin and EF1-α were used as reference genes (Figure 5a–c). In addition, when using UBI to analyze CCR expression patterns (Figure 5a), and RPL10 and RPS4 to analyze NHX1 expression patterns, the results were also different (Figure 5c).

4. Discussion

RT-qPCR can accurately quantify gene expression in samples within an extremely varied concentration range [7]. The features of this measurement include high sensitivity and a large dynamic range, but there are still many problems that will affect the results of this method, such as differences in tissue materials and RNA extraction [31].
One of the most commonly used methods is the RT-PCR semi-quantitative method with the participation of a reference gene [32]. In this study, after combining the results of transcriptome analysis and common reference genes in other species, we screened eight candidate reference genes from all transcriptome data. We used three Excel plugs to compare the stability of candidate reference genes, and the ranks of each plug were different; hence, we used the RefFinder weighted method to rank. CCR plays a critical role in plant development and self-defense by controlling lignin synthesis [33]. NHX1 is involved in salt tolerance [34]. LODX converts leucoanthocyanidins into anthocyanidins in seeds [35], flowers [36], and fruits [37]. We selected these three genes as target genes to test the accuracy of the candidate reference genes. In this experiment, the results differed according to the reference gene selected. In fact, the lower-ranked and top-ranked reference gene was used to normalize the analysis of fluorescence quantitative data and showed an opposite trend to the results (Figure 4). Of course, the top-ranked reference genes calculation will also have different results, because the expression level of a certain reference gene in a specific test material was different from that of other materials, but the software calculated the stability ranking and considered that the difference was not large in the overall comparison, which ultimately made the fluorescence quantitative calculation result appear different (Figure 4). This requires us to select as many reference genes as possible when using reference genes during the experiment, exclude the internal reference genes that do not perform well in a certain tissue in the actual calculation process, and use at least two at the same time. The calculation results for the reference genes were mutually corrected. In this study, EF1-β and RPL34 can be used as reference genes for gene relative expression analysis of the two varieties of hydrangea, ‘Bailmer’ and ‘Duro’.
Actin is the optimal reference gene in Ganoderma lucidum [38], Cineraria [39], and Lilium [16], but actin does not work well in this experiments. EF1-β was once a candidate reference gene in Panax ginseng [40], and RPL34 does not appear in any studies on reference genes. These two genes were ranked in the top two for stability (Table 6). Different materials will yield different optimal reference genes, which is also consistent with the previous research conclusions on reference genes [15,16].
The R2 and PCR efficiency of candidate reference genes were not all satisfied with 1% and 100%, respectively. In fact, during the course of experiments, we cannot avoid errors entirely and the process of PCR amplification amplifies errors [41]. Therefore, three biological replicates were obtained from three similar plants as one replicate. We selected a 384-well PCR plate to promote this test because the 96-well PCR plate cannot detect all the materials of the same gene at one time.
Stable reference genes are used to calculate relative gene expression, which is an efficient way to screen key genes by normalizing the analysis of transcripts. Currently, research related to hydrangea is urgently needed. Recently, we found an article reporting the reference gene of Hydrangea (in Chinese with English summary) [42]. The report focused on excavating stable reference genes among different tissue of hydrangea (roots, leaves, and sepals), in the control group and aluminum treatment, after 21 days of aluminum application. [42] This means that the results of the article can be used as a research basis of gene expression in different functional organs. In our research, we paid close attention to ornamental organs color change. Our study involves the difference in the color of different varieties, the difference in the color at different development stages, and the difference in the color of the different treatments. Scholars can choose different results as technical support according to different research needs. After software ranking and target gene verification, our results showed that the reference genes selected in this experiment can provide a technical basis for subsequent experiments.

5. Conclusions

Stable reference genes are used as a means of calculating relative gene expression, which is an efficient way to screen key genes by normalizing analysis of transcripts. Nowadays, research work related to hydrangeas needs to be carried out urgently. After software ranking and target gene verification, the result showed that the reference genes selected in this experiment can provided a technical basis for the development and color change of the hydrangea sepals.

Author Contributions

C.L., S.Y. and G.Z. designed the experiments. C.L. and S.Y. funded the experiments and reviewed the manuscript. G.Z. carried out all experiments and wrote the manuscript. H.Q. and Z.C. conducted RNA extraction and reverse transcription. All authors have read and agreed to the published version of the manuscript.

Funding

This research was funded by Central Public-interest Scientific Institution Basal Research Fund (IVF-BRF2020021), the Science and Technology Innovation Program of the Chinese Academy of Agricultural Science (CAAS-ASTIP- 2020-IVFCAAS).

Institutional Review Board Statement

Not applicable.

Informed Consent Statement

Not applicable.

Data Availability Statement

The data that support the findings of this study have been deposited into the CNGB Sequence Archive (CNSA) of the China National GeneBank DataBase (CNGBdb) and NCBI Sequence Read Archive (SRA) of National Center for Biotechnology Information. The mRNA sequence data have been submitted to the NCBI GenBank database. Due to data confidentiality issues, public inquiries will be available after 10 May 2024.

Acknowledgments

We are in gratitude to the National Flower Improvement Center and Laboratory of Horticultural Crop Biology and Germplasm Creation for providing the facilities.

Conflicts of Interest

The authors declare no conflict of interest.

References

  1. Kesumawati, E.; Kimata, T.; Uemachi, T.; Hosokaw, M.; Yazawa, S. Correlation of phytoplasma concentration in Hydrangea macrophylla with green-flowering stability. Sci. Hortic. 2006, 108, 74–78. [Google Scholar] [CrossRef]
  2. Ito, T.; Aoki, D.; Fukushima, K.; Yoshida, K. Direct mapping of Hydrangea blue-complex in sepal tissues of Hydrangea macrophylla. Sci. Rep. 2019, 9, 5450. [Google Scholar] [CrossRef]
  3. Galopin, G.; Codarin, S.; Viemont, J.D.; Morel, P. Architectural development of inflorescence in Hydrangea macrophylla cv. Hermann Dienemann. Horticulture 2008, 43, 361–365. [Google Scholar] [CrossRef]
  4. Schreiber, H.D. Curious chemistry guides Hydrangea colors. Am. Sci. 2014, 102, 444. [Google Scholar] [CrossRef]
  5. Liu, F.; Huang, L.L.; Li, Y.L.; Reinhoud, P.; Jongsma, M.A.; Wang, C.Y. Shoot organogenesis in leaf explants of Hydrangea macrophylla ‘Hyd1’ and assessing genetic stability of regenerants using ISSR markers. Plant Cell Tiss. Org. 2011, 104, 111–117. [Google Scholar] [CrossRef]
  6. Radonic, A.; Thulke, S.; Mackay, I.M.; Landt, O.; Siegert, W.; Nitsche, A. Guideline to reference gene selection for quantitative real-time PCR. Biochem. Biophys. Res. Commun. 2004, 313, 856–862. [Google Scholar] [CrossRef] [PubMed]
  7. Gachon, C.; Mingam, A.; Charrier, B. Real-time PCR: What relevance to plant studies? J. Exp. Bot. 2004, 55, 1445–1454. [Google Scholar] [CrossRef]
  8. Udvardi, M.K.; Czechowski, T.; Scheible, W.R. Eleven Golden Rules of Quantitative RT-PCR. Plant Cell 2008, 20, 1736–1737. [Google Scholar] [CrossRef]
  9. Remans, T.; Keunen, E.; Bex, G.J.; Smeets, K.; Vangronsveld, J.; Cuypersa, A. Reliable Gene Expression Analysis by Reverse Transcription-Quantitative PCR: Reporting and Minimizing the Uncertainty in Data Accuracy. Plant Cell 2014, 26, 3829–3837. [Google Scholar] [CrossRef]
  10. Chapman, J.R.; Waldenström, J. With Reference to Reference Genes: A Systematic Review of Endogenous Controls in Gene Expression Studies. PLoS ONE 2015, 10, e0141853. [Google Scholar] [CrossRef] [Green Version]
  11. Wang, H.; Chen, S.; Jiang, J.; Zhang, F.; Chen, F. Reference gene selection for cross-species and cross-ploidy level comparisons in Chrysanthemum spp. Sci. Rep. 2015, 5, 8094. [Google Scholar] [CrossRef] [PubMed]
  12. Qi, S.; Yang, L.; Wen, X.; Hong, Y.; Song, X.; Zhang, M.; Dai, S. Reference Gene Selection for RT-qPCR Analysis of Flower Development in Chrysanthemum morifolium and Chrysanthemum lavandulifolium. Front. Plant Sci. 2016, 7, 1–12. [Google Scholar] [CrossRef]
  13. Wang, M.; Li, Q.; Xin, H.; Chen, X.; Zhu, X.; Li, X. Reliable reference genes for normalization of gene expression data in tea plants (Camellia sinensis) exposed to metal stresses. PLoS ONE 2017, 12, e0175863. [Google Scholar] [CrossRef] [PubMed]
  14. Suzuki, T.; Higgins, P.; Crawford, D.R. Control selection for RNA quantitation. Biotechniques 2000, 29, 332–337. [Google Scholar] [CrossRef]
  15. Meng, Y.; Li, N.; Tian, J.; Gao, J.; Zhang, C. Identification and validation of reference genes for gene expression studies in postharvest rose flower (Rosa hybrida). Sci. Hortic. 2013, 158, 16–21. [Google Scholar] [CrossRef]
  16. Xu, L.; Xu, H.; Cao, Y.; Yang, P.; Feng, Y.; Tang, Y.; Yuan, S.; Ming, J. Validation of Reference Genes for Quantitative Real-Time PCR during Bicolor Tepal Development in Asiatic Hybrid Lilies (Lilium spp.). Front. Plant Sci. 2017, 8, 669. [Google Scholar] [CrossRef] [PubMed]
  17. Li, G.; Zhou, Y.; Zhao, Y.; Liu, Y.; Ke, Y.; Jin, X.; Ma, H. Internal Reference gene selection for quantitative Real-Time RT-PCR normalization in potato tissues. Phyton 2020, 89, 329–344. [Google Scholar] [CrossRef]
  18. Jin, J.; Song, Z.; Zhao, B.; Zhang, Y.; Wang, R. Physiological and metabolomics responses of Hydrangea macrophylla (Thunb.) Ser. and Hydrangea strigosa Rehd. to lead exposure. Ecotox. Environ. Safe 2022, 243, 113960. [Google Scholar] [CrossRef]
  19. Chen, H.; Wang, D.; Zhu, Y.; Li, W.; Chen, J.; Li, Y. Integrative transcriptomics and proteomics elucidate the regulatory mechanism of Hydrangea macrophylla flower-color changes induced by exogenous aluminum. Agronomy 2022, 12, 969. [Google Scholar] [CrossRef]
  20. Vandesompele, J.; De Preter, K.; Pattyn, F.; Poppe, B.; Van Roy, N.; De Paepe, A.; Speleman, F. Accurate normalization of real-time quantitative RT-PCR data by geometric averaging of multiple internal control genes. Genome Biol. 2002, 3, research0034.1. [Google Scholar] [CrossRef] [Green Version]
  21. Andersen, C.L.; Jensen, J.L.; Ørntoft, T.F. Normalization of realtime quantitative reverse transcription-PCR data: A model-based variance estimation approach to identify genes suited for normalization, applied to bladder and colon cancer data sets. Cancer Res. 2004, 64, 5245–5250. [Google Scholar] [CrossRef] [PubMed]
  22. Pfaffl, M.W.; Tichopad, A.; Prgomet, C.; Neuvians, T.P. Determination of stable housekeeping genes, differentially regulated target genes and sample integrity: BestKeeper-Excel-based tool using pair-wise correlations. Biotechnol. Lett. 2004, 26, 509–515. [Google Scholar] [CrossRef] [PubMed]
  23. Xie, F.; Peng, X.; Chen, D.; Xu, L.; Zhang, B. miRDeepFinder: A miRNA analysis tool for deep sequencing of plant small RNAs. Plant Mol. Biol. 2012, 80, 5–84. [Google Scholar] [CrossRef]
  24. Livak, K.J.; Schmittgen, T.D. Analysis of Relative Gene Expression Data using Real-Time Quantitative PCR. Methods 2002, 25, 402–408. [Google Scholar] [CrossRef] [PubMed]
  25. Pichon, M.; Courboun, I.; Beckert, M.; Boudet, A.M.; Grima-Pettenati, J. Cloning and characterization of two maize cDNAs encoding Cinnamoyl-CoA Reductase (CCR) and differential expression of the corresponding genes. Plant Mol. Biol. 1998, 38, 671–676. [Google Scholar] [CrossRef]
  26. Piquemal, J.; Lapierre, C.; Myton, K.; Connell, A.O.; Boudet, A.M. Down-regulation of Cinnamoyl-CoA Reductase induces significant changes of lignin profiles in transgenic tobacco plants. Plant J. 1998, 13, 71–83. [Google Scholar] [CrossRef]
  27. Bassil, E.; Blumwald, E. The ins and outs of intracellular ion homeostasis: NHX-type cation/H+ transporters. Curr. Opin. Plant Biol. 2014, 22, 1–6. [Google Scholar] [CrossRef]
  28. Yoshida, K.; Kondo, T.; Okazaki, Y.; Katou, K. Cause of blue petal colour. Nature 1995, 373, 291. [Google Scholar] [CrossRef]
  29. Zhang, H.; Du, C.; Wang, Y.; Wang, J.; Zheng, L.; Wang, Y. The Reaumuria trigyna leucoanthocyanidin dioxygenase (RtLDOX) gene complements anthocyanidin synthesis and increases the salt tolerance potential of a transgenic Arabidopsis LDOX mutant. Plant Physiol. Bioch. 2016, 106, 278–287. [Google Scholar] [CrossRef]
  30. Silver, N.; Best, S.; Jiang, J.; Thein, S.L. Selection of housekeeping genes for gene expression studies in human reticulocytes using real-time PCR. BMC Mol. Biol. 2006, 7, 33. [Google Scholar] [CrossRef] [Green Version]
  31. Huggett, J.F.; Dheda, K.; Bustin, S.A.; Zumla, A. Real-time RT-PCR normalisation; strategies and considerations. Genes Immun. 2005, 6, 279–284. [Google Scholar] [CrossRef] [PubMed]
  32. Kozera, B.; Rapacz, M. Reference genes in real-time PCR. J. Appl. Genet. 2013, 54, 391–406. [Google Scholar] [CrossRef] [PubMed]
  33. Kawasaki, T.; Koita, H.; Nakatsubo, T.; Hasegawa, K.; Wakabayashi, K.; Takahashi, H.; Umemura, K.; Umezawa, T.; Shimamoto, K. Cinnamoyl-CoA reductase, a key enzyme in lignin biosynthesis, is an effector of small GTPase Rac in defense signaling in rice. Proc. Natl. Acad. Sci. USA 2006, 103, 230–235. [Google Scholar] [CrossRef]
  34. Borrero, V.B.; Leidi, E.O.; Andrés, Z.; Rubio, L.; De Luca, A.; Fernández, J.A.; Cubero, B.; Pardo, J.M. Ion Exchangers NHX1 and NHX2 Mediate Active Potassium Uptake into Vacuoles to Regulate Cell Turgor and Stomatal Function in Arabidopsis. Plant Cell 2012, 24, 1127–1142. [Google Scholar] [CrossRef]
  35. Appelhagen, I.; Jahns, O.; Bartelniewoehner, L.; Sagasser, M.; Weisshaar, B.; Stracke, R. Leucoanthocyanidin Dioxygenase in Arabidopsis thaliana: Characterization of mutant alleles and regulation by MYB–BHLH–TTG1 transcription factor complexes. Gene 2011, 484, 61–68. [Google Scholar] [CrossRef]
  36. Chung, S.J.; Lee, G.J.; Lee, H.J.; Kim, J.B.; Kim, D.S.; Kang, S.Y. Isolation of a Leucoanthocyanidin Dioxygenase (LDOX) Gene from a Spray-type Chrysanthemum (Dendranthema × grandiflorum) and Its Colored Mutants. Korean J. Hortic. Sci. Technol. 2010, 28, 595–600. [Google Scholar] [CrossRef]
  37. Gollop, R.; Farhi, S.; Perl, A. Regulation of the leucoanthocyanidin dioxygenase gene expression in Vitis vinifera. Plant Sci. 2001, 161, 579–588. [Google Scholar] [CrossRef]
  38. Lu, X.; Liu, Y.; Zhao, L.; Liu, Y.N.; Zhao, M. Selection of reliable reference genes for RT-qPCR during methyl jasmonate, salicylic acid and hydrogen peroxide treatments in Ganoderma lucidum. J. Microbiol. Biotechn. 2018, 34, 92. [Google Scholar] [CrossRef]
  39. Jin, X.; Fu, J.; Dai, S.; Sun, Y.; Hong, Y. Reference gene selection for qPCR analysis in cineraria developing flowers. Sci. Hortic. 2013, 153, 64–70. [Google Scholar] [CrossRef]
  40. Wang, M.; Lu, S. Validation of Suitable Reference Genes for Quantitative Gene Expression Analysis in Panax ginseng. Front. Plant. Sci. 2016, 6, 696. [Google Scholar] [CrossRef] [Green Version]
  41. Ramakers, C.; Ruijter, J.M.; Deprez, R.H.L.; Moorman, A.F.M. Assumption-free analysis of quantitative real-time polymerase chain reaction (PCR) data. Neurosci. Lett. 2003, 339, 62–66. [Google Scholar] [CrossRef]
  42. Chen, S.; Qi, X.; Feng, J.; Chen, H.; Wang, H.; Qin, Z.; Deng, Y. Selection and validation of reference genes for qRT-PCR gene expression analysis in Hydrangea macrophylla under aluminum treatment. Acta Agric. Boreali Sin. 2021, 36, 9–18. [Google Scholar] [CrossRef]
Figure 1. The definition of stages of two cultivars. (a) Normal ‘Bailmer’ B CK and ‘Bailmer’ was treated with Al3+ B Tr. (b) Normal ‘Duro’ D CK and ‘Duro’ was treated with Al3+ D Tr.
Horticulturae 08 00835 g001
Figure 2. Melt curve and gel electrophoresis of each gene.
Horticulturae 08 00835 g002
Figure 3. Expression level of candidate reference genes and target genes.
Horticulturae 08 00835 g003
Figure 4. Assessment of Normalization (a) Samples were compared according to cultivar (Relative expression of LODX; B CK vs. D CK, B Tr vs. D Tr.). (b) Developmental stage (Relative expression of CCR; B CK S1 S2 S3, B Tr S1 S2 S3, D CK S1 S2 S3, D Tr S1 S2 S3). (c) Treatment or control group (Relative expression of NHX1; B CK vs. B Tr, D CK vs. D Tr).
Horticulturae 08 00835 g004
Figure 5. Genes expression verification. (a) Relative expression of CCR. (b) Relative expression of LODX. (c) Relative expression of NHX1.
Horticulturae 08 00835 g005
Table 1. Group introduction.‘Bailmer’ was abbreviated as B, ‘Duro’ was abbreviated as D, control group was abbreviated as CK, treatment group was abbreviated as Tr, and stage was abbreviated as S.
GroupSubgroup
Comparison of different varietiesB CK vs. D CK
B Tr vs. D Tr
Comparison of developmental stageB CK S1 S2 S3
B Tr S1 S2 S3
D CK S1 S2 S3
D Tr S1 S2 S3
Treatment or control groupB CK vs. B Tr
D CK vs. D Tr
All materialsAll materials
Table 2. Introduction of candidate reference genes and target genes.
Gene SymbolGene NamePrimer Sequence (5’-3’)Amplicon Length (bp)Correlation Coefficients (R2)Amplification Efficiency (E %)
ACTActin7
(Isoform0002522)
CCGAAGAGCACCCAGTTCTT1310.999109
AGAAAGAACGGCCTGGATG
EF1-αelongation factor 1-Alpha
(Isoform0002316)
ACCCGGTGACAATGTTGGTT1800.98886
GACAATCGAGAACTGGGGCA
EF1-βelongation factor 1-beta
(Isoform0062896)
CGCAGCTGTTTTAGGGAAGCC810.999107
GCGAGCTGCGAAGACACAGA
GAPDHGlyceraldehyde-3-phosphate dehydrogenase
(Isoform0003402)
GGCTGAGACTGGAGCGGAAT1340.999104
CAAACATGGGGGCGTCTTTGC
RPL1060S ribosomal protein L10
(Isoform0006092)
TGTCTCCAGCGAGGCTCTTGA1040.958126
ATGGATGGACGCGCACTCTC
RPL3460S ribosomal protein L34
(Isoform0005815)
ACCCCCGGTGGAAAGCTAGT1560.995121
ACGGTTCACAGTCCTCCGGT
RPS440S ribosomal protein S4
(Isoform0004107)
GCTTCGAGACCATCCACGTC1650.99098.9
GAGCGCTAAGCCTCTTCCTG
UBI11Polyubiquitin
(Isoform0002406)
TGTTGAGGCTGAGGGGAGGT1900.98099.5
TGGAGGATGGAAGGACTCTTGC
CCRCinnamoyl-CoA Reductase
(Isoform0002511)
TTACTCCTTCGAGCCTCCTTCTGAC 1500.99398
ATGACAGCAGTGACAGAAGACGTGA
NHX1sodium/hydrogen exchanger 1-like
(Isoform0010678)
TGATGCCACATCAGTTGTGCTG1280.992106
CACCCAGCAAAGTGCTTGTGAG
LODXLeucoanthocyanidin dioxygenase
(Isoform0054522)
GAGTTGAACAAGGGCGCGAT1010.998105
AACCCTTGTCCCGCAACCTT
Table 3. Rank of candidate and Pairwise variation (V) of reference genes were calculated by geNorm.
Ranking Order |B CK vs. D CKB Tr vs. D TrB CK S1 S2 S3 B Tr S1 S2 S3D CK S1 S2 S3D Tr S1 S2 S3B CK vs. B TrD CK vs. D TrAll Materials
V2/30.1210.0910.1050.0930.0950.0770.1270.0940.149
1GAPDH | RPL34EF1-β | RPL34RPL34 | RPS4EF1-β | RPL10GAPDH | RPL34EF1-β | RPL34EF1-β | RPL10RPL10 | RPL34EF1-β | RPL34
2EF1-βUBIRPL10UBIRPL10RPL10RPL34EF1-βUBI
3RPS4RPS4GAPDHRPL34UBIRPS4GAPDHUBIRPS4
4UBIGAPDHUBIGAPDHEF1-βUBIUBIRPS4GAPDH
5RPL10RPL10EF1-βEF1-αRPS4GAPDHRPS4GAPDHRPL10
6actinactinactinactinactinactinactinactinactin
7EF1-αEF1-αEF1-αRPS4EF1-αEF1-αEF1-αEF1-αEF1-α
Table 4. Rank of candidate reference genes were calculated by NormFinder in each group.
Gene
Name
B CK vs.
D CK
B Tr vs.
D Tr
B CK S1
S2 S3
B Tr S1
S2 S3
D CK S1
S2 S3
D Tr S1
S2 S3
B CK vs.
B Tr
D CK vs.
D Tr
All
Materials
actin0.9630.4670.4880.3330.6070.4670.9080.5790.796
EF1-α1.3270.5060.7650.3020.7100.5651.2560.6701.079
EF1-β0.1740.2030.2010.1730.2220.2080.2110.2080.189
GADPH0.0970.4130.1940.2430.1530.4760.1100.4000.276
RPL100.5720.3520.1870.3060.1970.1970.2960.1860.473
RPL340.1670.1580.2550.0190.1730.1020.3020.1230.208
RPS40.4770.4170.2680.4810.3340.2550.5180.3570.444
UBI0.5100.1800.3970.1740.3230.1700.6140.2460.480
Table 5. Rank of candidate reference genes were calculated by Bestkeeper in each group.
Gene
Name
B CK vs.
D CK
B Tr vs.
D Tr
B CK S1
S2 S3
B Tr S1
S2 S3
D CK S1
S2 S3
D Tr S1
S2 S3
B CK vs.
B Tr
D CK vs.
D Tr
All
Materials
SDCVSDCVSDCVSDCVSDCVSDCVSDCVSDCVSDCV
actin1.305.870.693.370.431.840.502.490.643.070.582.761.707.820.612.891.225.71
EF1-α1.687.330.663.140.843.430.411.990.713.340.693.232.039.030.693.251.456.63
EF1-β0.241.050.210.940.100.440.190.850.381.680.221.000.361.590.462.040.411.83
GADPH0.321.430.462.150.210.930.502.280.411.830.472.190.572.570.612.770.622.79
RPL100.532.610.412.090.412.050.120.640.321.550.170.850.351.780.401.930.542.66
RPL340.452.210.241.230.482.350.291.460.432.100.190.990.462.260.402.020.432.12
RPS40.572.590.411.930.462.120.632.920.592.630.170.800.562.590.652.990.612.79
UBI0.633.500.281.580.573.170.291.610.563.070.281.540.442.480.452.500.462.56
Table 6. Rank of candidate reference genes were calculated by RefFinder in each group.
Ranking OrderB CK vs.
D CK
B Tr vs.
D Tr
B CK S1
S2 S3
B Tr S1
S2 S3
D CK S1
S2 S3
D Tr S1
S2 S3
B CK vs.
B Tr
D CK vs.
D Tr
All Materials
1GAPDHRPL34RPL10EF1-βGAPDHRPL34EF1-βRPL34EF1-β
2RPL34EF1-βGAPDHRPL34RPL34RPL10RPL10RPL10RPL34
3EF1-βUBIRPL34RPL10RPL10EF1-βRPL34EF1-βGAPDH
4RPS4RPL10EF1-βUBIEF1-βRPS4GAPDHUBIUBI
5UBIRPS4RPS4GAPDHUBIUBIUBIRPS4RPS4
6RPL10GAPDHUBIEF1-αRPS4actinRPS4GAPDHRPL10
7actinactinactinactinactinGAPDHactinactinactin
8EF1-αEF1-αEF1-αRPS4EF1-αEF1-αEF1-αEF1-αEF1-α
Publisher’s Note: MDPI stays neutral with regard to jurisdictional claims in published maps and institutional affiliations.