Abstract
The cultivation of tolerant species with low-quality irrigation water is one of the main strategies to address the lack of availability of irrigation water. In this work, the effect of salinity on plant growth, nutritional composition, and quality features of Hedypnois cretica and Urospermum picroides was tested. Fresh yield of leaves and roots of both species were severely decreased under high salinity, while the mineral profile of leaves and roots also showed a decrease in most minerals. The recorded values of K/Na and Ca/Na ratios indicate that H. cretica has a higher susceptibility to salt stress due to a higher decrease in the values of the respective ratios compared to U. picroides. Leaf pigments and total phenolic compounds content were not significantly affected by salinity, while total soluble solids and titratable acidity increased under increasing salinity in most cases. Moreover, free proline content increased with increasing salinity, while the opposite trend was recorded for nitrates’ content. In conclusion, our findings indicate that tailor-made nutrient solutions could allow the use of irrigation water of a low quality for the commercial cultivation of H. cretica and U. picroides, thus allowing their domestication and integration in cropping systems where the cultivation of conventional crops is compromised.
1. Introduction
The world population is constantly increasing and is predicted to reach 9.2 billion by 2050 [1]. Moreover, the percentage of people that face hunger or undernutrition globally increased from 8.4% in 2019 to 9.9% in 2020 mainly due to the COVID-19 pandemic, thus challenging the Zero Hunger target of 2030 [2]. At the same time, about 20% of agricultural land is affected by salinity [3], while it is predicted that the current soil salinization trends will result in 50% of arable land being salt-affected by 2050 [4], mainly because of poor agricultural practices and the impacts of climate change [5]. Therefore, food security is put under continuous threat directly or indirectly by anthropogenic activities.
To meet the increasing demands in food availability, it is imperative to exploit saline soils or even to reclaim arable lands that are not currently cultivated due to secondary salinity [6]. For this purpose, the adoption of proper agronomical practices and novel methods in mitigating abiotic stresses (e.g., use of biostimulants, microbial inoculations, etc.) could alleviate the negative effects of salinity on salt-sensitive crops [7]. However, this goal can be mainly achieved by breeding new cultivars of higher resistance to soil salinity or poor water quality, and by introducing new salt-resilient crops by domesticating wild, edible plants and halophytes, with proven resistance to salinity as well as to other abiotic stressors (e.g., water shortages, extreme temperatures, etc.) related to the increasing scarcity of irrigation water and climate change impacts [8].
In this context, many studies have been recently carried out to determine the level of salt-resistance in a number of wild, edible and medicinal plants that are traditionally consumed by gathering from the wild and could potentially serve as innovative/complementary crops, including Cichorium spinosum L. [9], Diplotaxis tenuifolia (L.) DC. [10], Taraxacum officinale, and Reichardia picroides (L.) Roth [11]. In addition, halophytes, such as Crithmum maritimum L. [12], Chenopodium album L. [13], Plantago coronopus L. [14], Salsola komarovii Iljin, Sanguisorba minor Scop. [15], and Portulaca oleracea L. [16], have been proposed as new horticultural or medicinal crops, due to their ability to adapt to harsh conditions such as irrigation with saline or sea-water, providing a solution to the continuous decrease in irrigation water availability [14]. Apart from being a valuable source of genotypes and genes that could be exploited in breeding programs towards integrating salt-resistance to crops, wild, edible and medicinal plants may also play an important role in daily diet and human health due to their richness in beneficial bioactive compounds [17,18]. In addition, saline conditions as well as other abiotic stresses may act as eustressors by inducing the biosynthesis of health-promoting compounds in a number of fresh vegetables, including wild, edible species [19].
Hedypnois cretica (L.) Dum. Cours (syn. Hedypnois rhagadiolioides subsp. cretica) (Cretanweed or scaly hawkbit) and Urospermum picroides (L.) Scop. Ex F.W. Schmidt (syn. Tragopogon picroides L.) (prickly goldenfleece or prickly cupped goat’s beard) are two wild, edible plants belonging to the Asteraceae family that are commonly consumed by local communities of the Mediterranean basin in raw, boiled, or cooked form and present a great potential for commercial cultivation as vegetables or medicinal species rich in health-promoting bioactive compounds [20]. However, being considered as an underutilized species, there is scarcity or even absence of information regarding their cultivation practices and their response to salinity in particular, although dunes and coastal areas are reported to be among the natural habitats of H. cretica [21], while U. picroides is considered to be NaCl-resistant up to 8 dS m−1 [22]. This knowledge is essential for the commercial exploitation of both species, especially in problematic soils, since the salinity thresholds have to be defined before introducing them as innovative crops. For instance, Alexopoulos et al. [11] recorded reduced growth in Taraxacum officinale (L.) Weber ex F.H. Wigg. plants cultivated in a floating system using NaCl-supplemented nutrient solution (EC 6 dS m−1), whereas R. picroides plants were unaffected, probably due to its higher effectiveness in water uptake, accumulation of osmolytes (e.g., proline), and K/Na selectivity under salt-stress conditions.
Taking into account the lack of scientific data related to the response of these valuable, wild species to adverse environments, we studied the effect of NaCl-induced salinity at 6 and 10 dS m−1 on the growth, accumulation of nutrients, and quality/dietary traits of H. cretica and U. picroides plants, cultivated in a floating system aiming at their domestication and commercial exploitation in existing farming systems.
2. Materials and Methods
2.1. Plant Material, Experimental Treatments and Growth Conditions
The trial was carried out at the University of the Peloponnese (Kalamata, Messinia, Southern Greece, 37°3′22″ N, 22°1′43″ E) from November 2018 to March 2019, according to the methodology previously reported by Alexopoulos et al. [11]. In particular, seeds of Cretanweed (Hedypnois cretica (L.) Dum. Cours) and prickly goldenfleece (Urospermum picroides (L.) Scop. Ex F.W. Schmidt) were sown in November 2018 in germination containers (19 cm × 13 cm × 5 cm) containing white peat (pH 5.5–6.5, base substrate with no fertilizers added; Klasmann-Deilmann GmbH, Geeste, Germany). Then, the containers were put in a walk-in growth chamber (temperature = 20 °C, photoperiod 16 h, light intensity of fluorescent lamps = 55 μmol m−2 s−1). When seedlings formed 3–4 true leaves (61 days after sowing; DAS), they were transferred to polystyrene seedling trays (cell dimension 5 cm × 5 cm × 5 cm) containing the same growing medium in a density of 44.44 plants m−2 (distances between plants 15 cm × 15 cm). The trays were transferred in an unheated glasshouse and put into containers filled with nutrient solution up to a height of 20 cm. The nutrient solution was continuously supplied with oxygen using air pumps. The composition of the nutrient solution was already described by Alexopoulos et al. [23]. The tested treatments included three nutrient solutions with different salinity levels, namely EC2, EC6, and EC10, prepared according to the procedure reported by Alexopoulos et al. [11,23]. During the experimental period, pH values were recorded daily and maintained and levels between 5.8 and 6.2, while EC values ranged from 2.0 to 2.2 dS m−1 (EC2), 6.0 to 6.2 dS m−1 (EC6), and 10.0 to 10.2 dS m−1 (EC10). Growing conditions were reported in the study of Alexopoulos et al. [11].
Both species were harvested 56 days after transplanting (DAT), when their rosette was comparable to the harvesting stage when collected in the wild (e.g., plants reached an adequate size being young and tender; Figure 1). The experiment for each species followed the completely randomized design, while four replications with ten plants each were implemented for each species (120 plants in total for each species).
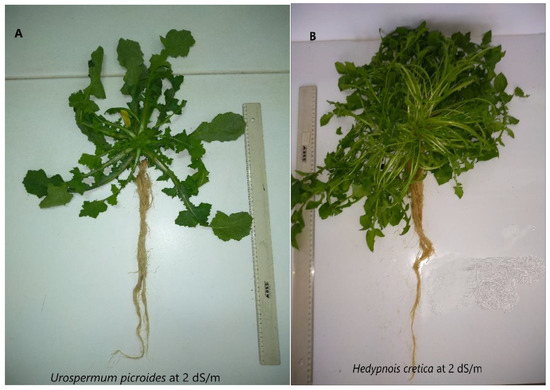
Figure 1.
Plants of Urospermum picroides (A) and Hedypnois cretica (B) grown at 2 dS m−1.
2.2. Plant Growth Parameters Measurement
The number of leaves, the diameter of rosettes, length, and width of the largest leaf were recorded in both plant species at the harvesting date (56 DAT). Measurements were taken in all the plants of each replication (40 plants for each treatment) and after harvest, the plants of each replicate were sampled and grouped as one batch sample, i.e., four samples (replications) per treatment. The assessed parameters included the number of non-marketable leaves (yellowed, partially dried, or injured), the aboveground plant-parts’ fresh weight (FW), root FW, and marketable leaf FW. After the assessment of the abovementioned parameters, the marketable leaves of each treatment were put together in a batch sample which was further split into two subsamples for further chemical analyses. One of the subsamples was used for the evaluation of dry matter content (% DMC) and the mineral profile determination of leaves, while the other subsample was kept at −80 °C for the assessment of chlorophyll, total soluble solids content (TSSC), total phenolic compounds (TPC), and proline content in the leaves. Similarly, the roots of each treatment were grouped as one sample, i.e., four samples (replications) per treatment, which was used for the determination of % DMC and of the macro-, and micro-elements’ content. For the evaluation of % DMC, plant leaves and roots were air-dried at 72 °C to constant weight.
2.3. Determination of Mineral Profile in Leaves and Roots and Nitrate Concentration in Leaves
For the determination of total N, P, Κ, Ca, Mg, Na, Cl (expressed in % of plant tissue dry weight), and total Fe, Mn, Zn, Cu, and Β (expressed in g kg−1 of plant tissue dry weight) contents in leaves and roots, the methodology previously reported by Alexopoulos et al. was followed [23]. The concentration of nitrates (N-NO3−) in leaves was determined according to the method reported by Cataldo et al. [24] and expressed in mg kg−1 of leaf FW.
Salinity tolerance index (STI) was calculated as the percent ratio of plant dry weight under salt stress and non-salt stress condition (relative plant dry-weight) using the following formula: Tolerance index (TI) (%) = (Treatment dry weight/Control dry weight) × 100 [25].
Regarding the nutrient accumulation, the nutrient contents per organ were calculated from the nutrient concentrations in the plant tissue (g Kg−1) and the relevant dry matter (g per plant) and expressed as mg per plant.
2.4. Chemical Analyses in Leaves
Total soluble solids’ content of leaves was evaluated with a portable refractometer (model HR32B; Schmidt + Haensch GmbH & Co., Berlin, Germany), as previously described by Alexopoulos et al. [11], while titratable acidity was determined by titration with NaOH [11].
Chlorophyll content of leaves was measured based on the readings of SPAD-502 Chlorophyll Meter (Konica-Minolta Co., Ltd., Tokyo, Japan) [23] and by quantification of chlorophylls in acetone extracts of leaves [26]. Carotenoids + xanthophylls were measured according to the method of Lichtenthaler and Buschmann [27].
Total phenolic compounds were quantified based on the Folin–Ciocalteu method with slight modifications [26], while free proline was assessed using the acid–ninhydrin method [28].
2.5. Statistical Analysis
The results for each species were analyzed with a one-way analysis of variance (ANOVA), while means comparison was performed with the Least Significant Difference (LSD) test at p ≤ 0.05. The relationships between growth parameters and minerals contents and quality parameters were evaluated using Pearson’s correlation test. All statistical tests were performed with the StatGraphics Centurion-XVI statistical package (StatPoint Technologies Inc., Warrenton, VA, USA).
3. Results and Discussion
3.1. Plant Growth Parameters
The leaf number of H. cretica was significantly decreased by increasing the salinity level (Table 1), whereas in the case of U. picroides the number of leaves was significantly higher in the EC2 than the EC10 treatment (Table 2). In particular, the percent leaf number decrease in H. cretica under EC6 treatment compared to the control (EC2) was similar to the decrease in U. picroides under EC10 treatment compared to the control (29.8% and 25.4%, respectively). The rosette diameter was severely affected by increasing salinity, especially in the case of H. cretica plants where high salinity (EC10) reduced the diameter of plants by 66.7%, whereas U. picroides was less affected showing a reduction of 35%. Moreover, the decrease in the number of leaves coincided with a significant increase in the number of non-marketable yield due to the loss of visual quality in both species (two-fold and three-fold increase in the case of EC10 compared to EC2 treatment, for H. cretica and U. picroides, respectively); however, the portion of unmarketable leaves in the total leaf number under high salinity was similar for both species (15% and 16% for H. cretica and U. picroides, respectively). Apart from the effects on the formation of new leaves, high salinity (EC10) significantly reduced the dimension of leaves, especially in H. cretica plants where the leaf length and width were reduced by 65.9% and 59.2%, respectively. On the other hand, no effects were recorded in the SPAD index for both species. Regarding yield-related parameters, total fresh weight was significantly reduced with increasing salinity for both species due to the formation of fewer and smaller leaves, while H. cretica seemed to be more susceptible to salinity stress compared to U. picroides (81.5% vs. 43.6% yield reduction under EC10 treatment, respectively). When allocating total plant weight in the aerial part and roots, a severe effect of high salinity level was also recorded, while the root/aerial part ratio revealed that the reduction in total plant weight was mostly due to the reduction in the weight of the aerial part, especially in the case of H. cretica plants. Finally, the percentage of leaf dry matter of H. cretica plants increased from EC2 to EC6 and from EC2 to EC10 by 16% and 46%, respectively, whereas that of U. picroides was not significantly impacted by the tested salinity levels (Table 1 and Table 2).

Table 1.
Growth parameters of Hedypnois cretica plants grown under different electrical conductivity (EC) levels (2, 6, and 10 dS m−1).
Table 2.
Growth parameters of Urospermum picroides plants grown under different electrical conductivity (EC) levels (2, 6, and 10 dS m−1).
Similarly to our study, Uddin et al. [29] suggested a reduction in the number of leaves of three Brassica species subjected to salt stress, while Klados and Tzortzakis also reported a significant decrease in the number of leaves of Cichorium spinosum plant grown under saline conditions. Moreover, taking into consideration the plant leaf FW decrease in combination with the maximum leaf length and width decrease under salt stress, we could assume that salinity affected negatively the leaf expansion, thus limiting the photosynthetically active surface area and the biosynthesis of structural compounds that allowed for the formation of new leaves and the development of the existing ones [30]. The severe effects of salinity on fresh biomass yield were also reported in the case of Cichorium intybus L. where the aerial part and roots showed similar decreasing trends. This finding coincides with the results of our study regarding U. picroides and not with those of H. cretica highlighting the significant effect of genotypes on salinity stress [31].
The higher tolerance of U. picroides to salinity stress could be attributed to better water uptake, as indicated by the non-significant impact of the tested salinity levels on leaf dry matter content and consequently to water content of leaves. It has been well-documented that the presence of high amounts of NaCl in the nutrient solution may result in hyperosmotic conditions which hamper plant absorption of water and nutrients [32]. To the authors’ knowledge, there are no available reports on the tolerance of the tested species to salinity stress. However, in other wild species such as Taraxacum erythropodium Kitag., plants grown under high soil salt content (>0.7%) also showed reduced growth [33], while in the case of Reichardia picroides the plants were resistant to high salinity levels based on the recorded growth parameters’ values [11,22].
3.2. Leaf and Root Mineral Profile
Leaf N concentration of H. cretica was not significantly affected by increasing EC levels in comparison to the control, whereas in regard to U. picroides the N content was significantly lower for the EC6 treatment compared either to the control (EC2) or the high salinity level (EC10) (Table 3). This variable response of the tested species could be attributed to the severe decrease in the leaf fresh biomass in the case of H. cretica compared to U. picroides under the same salt conditions. Moreover, the variability of the salt stress impact on N metabolism could be also attributed to genotypic differences between the tested plant species which suggest the variability in the effectiveness of protective mechanisms against abiotic stressors [11,34].
Table 3.
Leaf nutrient concentrations of Hedypnois cretica (3a) and Urospermum picroides (3b) plants grown under different nutrient solution EC levels (2, 6, and 10 dS m−1).
Leaf P concentration of both species was significantly increased in H. cretica plants for both salinity levels (e.g., EC6 and EC10) in comparison to the control treatment (EC2), whereas in the case of U. picroides, the P content increased only under the high salinity as compared to EC2 treatment (Table 3). Moreover, P content in roots was significantly higher in plants subjected to EC6 and EC10 levels in comparison to the control treatment for both tested species (Table 4). Similar results were reported for the edible, wild species Taraxacum officinale and Reichardia picroides by Alexopoulos et al. [11] who used similar growing conditions (nutrient solution composition, light conditions, salinity levels) to our study. In contrast, Assimakopoulou et al. [35] recorded a decrease in the P content of tomato leaves, while Grattan and Grieve [36] reported that salinity either improved or had no effect on P uptake in horticultural crops. These differences could be attributed to the different species tested, since the importance of genotype to response of species to salinity stress is well-established [36]. Therefore, it could be suggested that the response of plants regarding the uptake of P under saline conditions is genotype-dependent, while growing conditions may also have an impact on plants’ nutrient profile.
Table 4.
Root nutrient concentrations at harvest date of Hedypnois cretica and Urospermum picroides plants grown under different nutrient solution EC levels (2, 6, and 10 dS m−1).
For both species, leaf K and Ca content decreased significantly under the two salinity levels in comparison to the control treatment without significant differences being recorded between them (except for the case of U. picroides where leaf K content in EC10 treatment was significantly different from EC6 treatment) (Table 3). Leaf Mg content was not significantly affected by increasing salinity in H. cretica, whereas a significant reduction was recorded in both salinity levels in comparison to the control treatment (Table 3). In regard to roots, the Mg content was not significantly affected in H. cretica plants, while a significant decrease was recorded only at the highest salinity level tested (EC10) compared to the control treatment (Table 4). This decrease in leaf K and Ca content under salt stress could be associated with the known antagonistic effects between Na+, K+, and Ca2+, since they probably share the same transport systems either at the root surface or into the xylem [37], while the high content of Na+ inhibits the uptake process of K+ and Ca2+ [38] with severe effects on plant growth and yield in various crops [39]. Alexopoulos et al. [11] also reported a decreasing trend in K and Ca content of leaves in Taraxacum officinale and Reichardia picroides, a finding which confirms our results, especially when considering the similarities in the growing and experimental conditions between these two studies. In contrast, other researchers have reported non-significant effects of salinity on leaf K and Mg contents in pepper [40], while Assimakopoulou et al. [35] found increased leaf Ca, Mg, and K content in tomato plants. These contradictory reports could be due to the variable effect of salinity stress on plants, depending on several factors such as growing conditions, growth medium, stress duration, plant genotype, as well as to vegetable type (e.g., leafy or fruit vegetable) [41].
In the case of roots, the root K content was gradually decreased with increasing salinity in H. cretica plants, while in U. picroides the K content decreased only at the high salinity level (Table 4). According to Zhang et al. [42], the K content is pivotal for the homeostasis in salt tolerance mechanisms, which indicates more effective stress protective mechanisms in U. picroides than H. cretica plants. Moreover, our results indicate that the decrease in K content was more profound in leaves than in roots in both species, a finding which coincides with the reports of Pérez-Alfocea et al. [43] in tomato plants or the results of Alexopoulos et al. [11] in Taraxacum officinale and Reichardia picroides plants.
Leaf Na and Cl content, as well as root Na content recorded a gradual increase with increasing salinity in both species, due to the increasing availability of both minerals in nutrient solution in saline conditions (Table 3 and Table 4). Moreover, considering that U. picroides plants had lower Na content in leaves and roots compared to H. cretica plants, it could be suggested that the observed tolerance of the former species could be due to Na excretion mechanisms [44,45].
Moreover, both the leaf K/Na and Ca/Na ratios reflected the relevant salt tolerance of the studied species in the present work, as in H. cretica a higher decrease in K/Na and Ca/Na ratios in the cytosol was recorded compared to U. picroides, suggesting a higher susceptibility to salt stress in the former species. Similar results were suggested by other researchers who also suggested the ratios of K/Na and Ca/Na as indicative indices for tolerance to salinity stress in various crops [46]. According to Mousavi et al. [47], the K/Na reflects the effectiveness of the K–Na exchange in plasmalemma which is responsible for salinity tolerance through the removal of Na from the cytoplast and its decreased translocation through the xylem.
Regarding micronutrients, leaf Fe, Zn, and Cu content was not significantly impacted by salinity levels in H. cretica plants, whereas Mn and B were negatively affected by saline conditions (Table 3). On the other hand, EC6 and EC10 treatments had no significant effect on leaf Cu content of U. picroides, while Mn and Zn content significantly decreased under salinity treatments. Finally, the content of Fe and B in leaves showed an increase over the control treatment when plants were grown at high salinity levels (EC10). As shown in Table 4, the micronutrients’ content in H. cretica roots was significantly lower compared to the control plants under the salt treatments EC6 and EC10; however, Zn content decreased only at EC6 and B which was not significantly affected by the tested treatments. Similarly, a negative impact of salinity on micronutrients content was recorded for U. picroides, regardless of the salinity level, except for the case of Fe and Cu where the EC6 level resulted in a significant increase compared to the rest of the treatments. This varied response to salinity levels has also been confirmed in the literature studies where inconsistent results regarding the micronutrients content under saline conditions have been suggested in various crops, indicating the importance of genotype as well as the experimental treatments (salinity level, stress duration, stress initiation etc.) and growing conditions (cropping season, air temperature, light conditions) [48].
3.3. Salinity Tolerance Index
In order to assess the tolerance of the tested species, the salinity tolerance index was determined based on the recorded values of dry weight of plants in the control (EC2) and the studied salinity levels (Figure 2). Comparing the tolerance index of the two plants, U. picroides and the control treatment, it could be suggested that U. picroides was more tolerant than H. cretica in either the EC6 or EC10 treatments. According to the literature, there is a strong correlation between Na content in leaves, with tolerant genotypes showing a lower accumulation of Na than less tolerant ones [49]. This finding agrees with our study, since the increase in Na content in leaves and roots under high salinity levels (EC10) was lower in the case of U. picroides than H. cretica (increased by 3.85 times vs. 12.08 times in the case of leaves for U. picroides and H. cretica, respectively; and 15.46 times vs. 17.12 times in the case of roots for U. picroides and H. cretica, respectively). Moreover, Tao et al. [50] reported a wide variability between different wheat genotypes in values of the salinity tolerance index while Anshori et al. [51] highlighted the importance of using various salinity tolerance indices for the selection of elite rice genotypes in breeding programs.
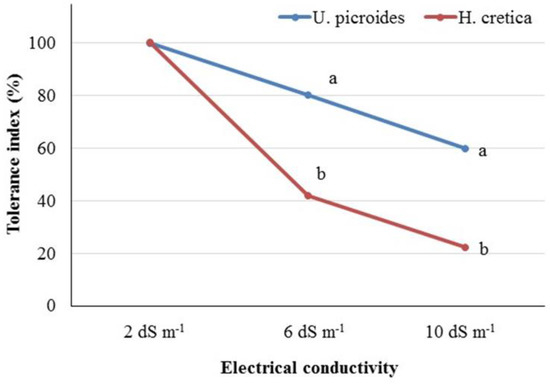
Figure 2.
Salinity tolerance index of Urospermus picroides and Hedypnois cretica plants grown under different EC levels (2, 6, and 10 dS m−1) in nutrient solution. Different letters indicate statistically significant differences in the salinity tolerance index of the plant species (in each EC level separately) according to the t-test at p < 0.05.
3.4. Quality Traits (Leaf Pigments, Total Soluble Solids Content, Titratable Acidity, and Total Phenolic Compounds Content)
In both species, salinity had no effect on the content of leaves in chlorophylls (chl a, chl b, and total chlorophylls) as well as in carotenoids, xanthophylls, and total phenols (Table 5). The lack of effect of salinity levels on chlorophyll content is in accordance with our results for SPAD index values presented in Table 1 and Table 2. According to the literature, moderate to high salinity levels similarly had no effect on the content of pigments in the leaves of Taraxacum officinale and Reichardia picroides (up to 10 dS m−1; [11]), and leaf chlorophyll content of Cichorium spinosum (up to 40 mM NaCl; [52]). In contrast, a gradual addition of NaCl/CaCl2 up to 30/15 mM (EC 8.4 dS m−1) in lettuce genotypes [53] and up to 20/10 mM (EC 6.5 dS m−1) in spinach [54] resulted in increased chlorophyll content (a, b, and total) and chlorophyll a/b ratio. However, although both lettuce and spinach are considered moderately sensitive to salinity [31], the evaluation of 178 cultivars and germplasm accessions of lettuce resulted in either no change or in an increase in the leaf SPAD units, thus indicating a genotype-dependent response to salinity stress. In the case of Taraxacum erythropodium, soil salt contents above 0.4% had a negative effect on chlorophyll content [33]. Therefore, it could be suggested that depending on the genotype, the application of mild or relatively high salinity stress do not negatively affect the content of leafy vegetables in pigments and thus do not impair their coloration, an organoleptic trait of particular importance for their marketability and preference by consumers [55]. Moreover, apart from the involvement of leaf pigments in physiological functions (i.e., photosynthesis), they are also beneficial for human health, as they mitigate oxidative stress and help in the prevention of chronic diseases [56]. Therefore, the lack of effect of salinity on leaf pigments indicate that visual and nutritional quality of the edible product of both species is not compromised by saline conditions.
Table 5.
Chlorophyll (a, b, and total; mg/100 g FW); carotenoids + xanthophylls (mg/100 g FW); total phenolics (mg GAE/100 g FW); total soluble solids content (TSSC; °Brix); titratable acidity (TA; g malic acid/100 g FW); leaf nitrate content (mg/kg fw) and free proline content (μmole/g FW) of Hedypnois cretica and Urospermum picroides plants grown under different nutrient solution EC (2, 6, and 10 dS m−1) levels.
Leaf content in total phenolic compounds (TPC) was not significantly impacted by the tested salinity treatments in both species (Table 5). Although it is reported that salinity enhances the biosynthesis of phenolic compounds in plants due to the induction of secondary metabolism [57], several other factors could be involved in this response such as the salt dose, the initiation of salt treatment in relation to plant developmental stage, the duration of the treatment, and the source of salt stress among others [58]. Thus, in agreement with our results, no change in TPC was recorded in romaine-type lettuce under a long-term mild NaCl stress (5 mM NaCl; [59]), in green and red-leafed baby lettuce grown at 10 mM NaCl [60], in spinach after a combined NaCl/CaCl2 salt-treatment at 6.5 dS m−1 [54], or in spiny chicory (Cichorium spinosum) after NaCl treatment up to 8 dS m−1 [9]. On the contrary, lettuce plants subjected at 50 mmol L−1 NaCl had higher TPC and phenolic acids’ content, whereas a more severe stress (150 mmol L−1 NaCl) favored the accumulation of flavonoids [61]. Similarly, Klados and Tzortzakis [62] observed an increase in TPC at 120 mM NaCl in spiny chicory plants. However, although TPC and antioxidant compounds such as carotenoids were not affected under the studied conditions, the determination of other bioactive compounds could provide useful information regarding the potential of implementing saline irrigation water as a cost-effective means for increasing functional quality of wild, edible species, as already indicated on other occasions [9,63].
Leaf total soluble-solids’ content (TSSC) increased in both species after the application of EC10 treatment in comparison to the control plants, whereas non-significant differences were recorded between EC6 and the control treatment or between EC6 and EC10 treatments (Table 5). In other wild, edible species such as Taraxacum officinale and Reichardia picroides, the TSSC values were unaffected by salinity levels up to 10 dS m−1 [11], whereas salt-treated Cichorium spinosum plants showed a reduced sugar accumulation [9]. In the case of lettuce plants, TSSC values either increased at mild salt-stress [64] or showed no significant changes at higher salinity levels [65], while Sakamoto et al. [66] reported a two-fold increase in TSSC values at NaCl-supplemented nutrient solution up to EC 12.6 dS m−1 in red lettuce leaves. Moreover, titratable acidity (TA) of H. cretica leaves gradually increased with increasing EC levels, whereas no significant differences were recorded in the case of U. picroides. The higher titratable acidity observed in H. cretica leaves under both salinity treatments could be due to concentration effect, as salinity (especially at 10 dS m−1) was detrimental for plant growth, resulting in a significant increase in leaf DMC and consequently to lower water content [67].
3.5. Proline Content
The application of salinity treatments resulted in a gradual increase in the proline content compared to the control treatment only in the case of U. picroides, whereas the content in H. cretica leaves was increased only when the plants were subjected to high salinity (EC10) (Table 5). Given that proline is related to osmotic adjustment when plants are subjected to salinity stress [34], the higher salt tolerance of U. picroides indicated by the growth parameters (see results in Table 2) could be associated with the induction of proline biosynthesis, especially under the highest salinity levels tested (EC10). This finding agrees with the literature reports regarding Brassica napus L. [55], Taraxacum erythropodium [33], and strawberry [68] where the content of leaf proline showed an increase under increased salinity levels. Moreover, it seems that the protective mechanism of the species is triggered even at moderate salinity levels (EC6), whereas in the case of H. cretica, proline biosynthesis was significantly increased only when the plants were subjected to high salinity. Therefore, the lower fresh biomass yield recorded for H. cretica plants under saline conditions (see results in Table 1) could be associated with the inefficient protective mechanisms of the species and the biosynthesis of adequate amounts of proline. This difference in proline biosynthesis between the tested species could be attributed to the genetic manipulation of proline metabolism and the accumulation of the species [69].
3.6. Leaf Nitrate Concentration
The leaf nitrate concentration of the control plants in both plant species was found to be significantly higher than salinity treatments, while a gradual decrease with increasing salinity was recorded in H. cretica plants (Table 5). On the other hand, no significant differences in nitrate content were recorded between EC6 and EC10 in the case of U. picroides. H. cretica presented 1.7, 2.2, and 1.3 times higher leaf nitrate content under EC2, EC6, and EC10, respectively, as compared to the respective salinity levels in U. picroides leaves. Human exposure to nitrate is receiving significant attention from regulators and governmental officers due to the potential harmful effects on human health [70]. In particular, leafy vegetables and specific species such as spinach and lettuce are considered as potentially harmful due to nitrate accumulation [71].
The synthesis and accumulation of nitrates in leafy vegetables has been associated with several factors: (i) genotype, (ii), agronomic practices such as fertilizer rates, application form and timing of nitrogen, and (iii) growing conditions such as light intensity and quality, air temperature, and concentration of carbon dioxide [19,70]. Moreover, due to antagonism between nitrates and chloride, salinity elicited through a NaCl addition in nutrient solution has been suggested as an effective practice to reduce nitrate accumulation in leafy vegetables [19,70]. Therefore, replacing nitrate with chloride in the feeding solution in hydroponic cropping systems, could lead to the reduction in anti-nutrient nitrates in leafy vegetables [72]. For instance, Colla et al. [73] found that increasing the NaCl in the nutrient solution from 1 to 30 mM NaCl decreased the nitrogen content in leaves of various artichoke and cardoon cultivars grown in a floating system. Moreover, the reduction in nitrogen content at saline conditions was followed by a significant increase in antioxidant activity and polyphenols’ profile. In addition, the decrease in the NO3−:Cl− ratio in the feeding solution impaired translocation of N and NO3− in the shoots of cardoon plants cultivated in a floating system, but increased the total antioxidant activity, flavonoids and phenols’ content in leaves [74]. The reduction in nitrate uptake could be attributed to a high chloride content, since the translocation of nitrates from roots to shoots might be reduced at the site of entrance into the xylem due the competition for the same anion channel [75].
4. Conclusions
Our results suggest a significant impact of electrical conductivity levels of nutrient solution on plant growth parameters and quality traits of Hedypnois cretica and Urospermum picroides. Although fresh biomass yield was severely affected in both species, U. picroides seems to be more resilient than H. cretica. This finding is also confirmed by the mineral profile of leaves and the values of K/Na and Ca/Na ratios, as well as the calculated stress tolerance index and the free proline content which all support the argument for U. picroides possessing a higher salinity stress tolerance. The evaluation of quality traits revealed that the tested salinity treatments had no significant effect on leaf pigments and total phenolic compounds content, whereas titratable acidity and total soluble solids content increased under salinity treatments indicating positive effects on the taste of the edible products. Moreover, it is worth mentioning that the content of nitrates was significantly reduced even under moderate salinity levels, which is also a beneficial effect on the quality of the edible product. In conclusion, our results indicate that the studied species showed a varied response to salinity treatments, with U. picorides being more tolerant to salt stress than H. cretica. Moreover, the application of tailor-made nutrient solutions may improve the quality traits of the edible portion of both species without compromising yield parameters, thus suggesting a cost-effective practice to increase the added value of both species and exploit them in commercial cropping systems.
Author Contributions
Conceptualization, A.A.A., I.C.K. and S.A.P.; methodology, P.P., M.B., A.A. and N.V.; formal analysis, P.P., M.B., A.A. and N.V.; investigation, P.P., M.B., A.A. and N.V.; resources, A.A.A., I.C.K. and S.A.P.; data curation, A.A.A. and I.C.K.; writing—original draft preparation, A.A.A. and S.A.P.; writing—review and editing, A.A.A., Y.R., I.C.K. and S.A.P.; visualization, A.A.A.; supervision, A.A.A., I.C.K. and S.A.P.; project administration, A.A.A. and S.A.P.; funding acquisition, S.A.P. All authors have read and agreed to the published version of the manuscript.
Funding
This research received no external funding.
Institutional Review Board Statement
Not applicable.
Informed Consent Statement
Not applicable.
Data Availability Statement
Data are available upon request.
Conflicts of Interest
The authors declare no conflict of interest.
References
- Stephenson, J.; Newman, K.; Mayhew, S. Population dynamics and climate change: What are the links? J. Public Health 2010, 32, 150–156. [Google Scholar] [CrossRef] [PubMed]
- FAO; IFAD; UNICEF; WFP; WHO. The State of Food Security and Nutrition in the World 2021. In Transforming Food Systems for Food Security, Improved Nutrition and Affordable Healthy Diets for All; FAO: Rome, Italy, 2021; p. 240. [Google Scholar]
- FAOSTAT Production and Trade Statistics. Available online: http://www.fao.org/faostat/en/#data/QC/visualize (accessed on 24 December 2022).
- Ashraf, M.; Foolad, M.R. Roles of glycine betaine and proline in improving plant abiotic stress resistance. Environ. Exp. Bot. 2007, 59, 206–216. [Google Scholar] [CrossRef]
- Jamil, A.; Riaz, S.; Ashraf, M.; Foolad, M.R. Gene expression profiling of plants under salt stress. CRC. Crit. Rev. Plant Sci. 2011, 30, 435–458. [Google Scholar] [CrossRef]
- Petropoulos, S.A.; Karkanis, A.; Martins, N.; Ferreira, I.C.F.R. Edible halophytes of the Mediterranean basin: Potential candidates for novel food products. Trends Food Sci. Technol. 2018, 74, 69–84. [Google Scholar] [CrossRef]
- Rouphael, Y.; Petropoulos, S.A.; Cardarelli, M.; Colla, G. Salinity as eustressor for enhancing quality of vegetables. Sci. Hortic. 2018, 234, 361–369. [Google Scholar] [CrossRef]
- Fita, A.; Rodríguez-Burruezo, A.; Boscaiu, M.; Prohens, J.; Vicente, O. Breeding and domesticating crops adapted to drought and salinity: A new paradigm for increasing food production. Front. Plant Sci. 2015, 6, 978. [Google Scholar] [CrossRef]
- Petropoulos, S.; Levizou, E.; Ntatsi, G.; Fernandes, Â.; Petrotos, K.; Akoumianakis, K.; Barros, L.; Ferreira, I. Salinity effect on nutritional value, chemical composition and bioactive compounds content of Cichorium spinosum L. Food Chem. 2017, 214, 129–136. [Google Scholar] [CrossRef]
- Bonasia, A.; Lazzizera, C.; Elia, A.; Conversa, G. Nutritional, biophysical and physiological characteristics of wild rocket genotypes as affected by soilless cultivation system, salinity level of nutrient solution and growing period. Front. Plant Sci. 2017, 8, 300. [Google Scholar] [CrossRef]
- Alexopoulos, A.A.; Assimakopoulou, A.; Panagopoulos, P.; Bakea, M.; Vidalis, N.; Karapanos, I.C.; Petropoulos, S.A. Impact of salinity on the growth and chemical composition of two underutilized wild edible greens: Taraxacum Officinale and Reichardia picroides. Horticulturae 2021, 7, 160. [Google Scholar] [CrossRef]
- Renna, M. Reviewing the prospects of sea fennel (Crithmum maritimum L.) as emerging vegetable crop. Plants 2018, 7, 92. [Google Scholar] [CrossRef]
- Calone, R.; Bregaglio, S.; Sanoubar, R.; Noli, E.; Lambertini, C.; Barbanti, L. Physiological adaptation to water salinity in six wild halophytes suitable for Mediterranean agriculture. Plants 2021, 10, 309. [Google Scholar] [CrossRef]
- Koyro, H.-W. Effect of salinity on growth, photosynthesis, water relations and solute composition of the potential cash crop halophyte Plantago coronopus (L.). Environ. Exp. Bot. 2006, 56, 136–146. [Google Scholar] [CrossRef]
- Karkanis, A.C.; Fernandes, A.; Vaz, J.; Petropoulos, S.; Georgiou, E.; Ciric, A.; Sokovic, M.; Oludemi, T.; Barros, L.; Ferreira, I. Chemical composition and bioactive properties of Sanguisorba minor Scop. under Mediterranean growing conditions. Food Funct. 2019, 10, 1340–1351. [Google Scholar] [CrossRef]
- Karkanis, A.C.; Petropoulos, S.A. Physiological and growth responses of several genotypes of common purslane (Portulaca oleracea L.) under Mediterranean semi-arid conditions. Not. Bot. Horti Agrobot. Cluj-Napoca 2017, 45, 569–575. [Google Scholar] [CrossRef]
- Sánchez-Mata, M.C.; Loera, R.D.C.; Morales, P.; Fernández-Ruiz, V.; Cámara, M.; Marqués, C.D.; Pardo-de-Santayana, M.; Tardío, J. Wild vegetables of the Mediterranean area as valuable sources of bioactive compounds. Genet. Resour. Crop Evol. 2012, 59, 431–443. [Google Scholar] [CrossRef]
- Chatzopoulou, E.; Carocho, M.; Di Gioia, F.; Petropoulos, S.A. The beneficial health effects of vegetables and wild edible greens: The case of the mediterranean diet and its sustainability. Appl. Sci. 2020, 10, 9144. [Google Scholar] [CrossRef]
- Rouphael, Y.; Kyriacou, M.C.; Petropoulos, S.A.; De Pascale, S.; Colla, G. Improving vegetable quality in controlled environments. Sci. Hortic. 2018, 234, 275–289. [Google Scholar] [CrossRef]
- Petropoulos, S.A.; Fernandes, Â.; Tzortzakis, N.; Sokovic, M.; Ciric, A.; Barros, L.; Ferreira, I.C.F.R. Bioactive compounds content and antimicrobial activities of wild edible Asteraceae species of the Mediterranean flora under commercial cultivation conditions. Food Res. Int. 2019, 119, 859–868. [Google Scholar] [CrossRef]
- Badalonas, D.; Sykora, K.; Papastergiadou, E. Review of plant communities from Greek dunes and salt marshes, a preliminary summarizing list. Ann. Di Bot. 1995, 53, 107–118. [Google Scholar]
- Salonikioti, A.; Petropoulos, S.; Antoniadis, V.; Levizou, E.; Alexopoulos, A. Wild Edible Species with Phytoremediation Properties. Procedia Environ. Sci. 2015, 29, 98–99. [Google Scholar] [CrossRef]
- Alexopoulos, A.A.; Marandos, E.; Assimakopoulou, A.; Vidalis, N.; Petropoulos, S.A.; Karapanos, I.C. Effect of Nutrient Solution pH on the Growth, Yield and Quality of Taraxacum officinale and Reichardia picroides in a Floating Hydroponic System. Agronomy 2021, 11, 1118. [Google Scholar] [CrossRef]
- Cataldo, D.A.; Maroon, M.; Schrader, L.E.; Youngs, V.L. Rapid colorimetric determination of nitrate in plant tissue by nitration of salicylic acid. Commun. Soil Sci. Plant Anal. 1975, 6, 71–80. [Google Scholar] [CrossRef]
- Bálint, A.F.; Kovács, G.; Sutka, J. Copper tolerance of Aegilops, Triticum, Secale and triticale seedlings and copper and iron content in their shoots. Acta Biol. Szeged. 2002, 46, 77–78. [Google Scholar]
- Karapanos, I.; Papandreou, A.; Skouloudi, M.; Makrogianni, D.; Fernández, J.A.; Rosa, E.; Ntatsi, G.; Bebeli, P.J.; Savvas, D. Cowpea fresh pods—A new legume for the market: Assessment of their quality and dietary characteristics of 37 cowpea accessions grown in southern Europe. J. Sci. Food Agric. 2017, 97, 4343–4352. [Google Scholar] [CrossRef] [PubMed]
- Lichtenthaler, H.K.; Buschmann, C. Chlorophylls and Carotenoids: Measurement and Characterization by UV-VIS Spectroscopy. Curr. Protoc. Food Anal. Chem. 2001, 1, F4.3.1–F4.3.8. [Google Scholar] [CrossRef]
- Bates, L.S. Rapid determination of free proline for water-stress studies. Plant Soil 1973, 39, 205–207. [Google Scholar] [CrossRef]
- Uddin, M.N.; Tariqul Islam, M.; Karim, M.A. Salinity tolerance of three mustard/rapeseed cuitivars. J. Bangladesh Agric. Univ. 2005, 3, 203–208. [Google Scholar] [CrossRef]
- Wang, Y.; Nii, N. Changes in chlorophyll, ribulose bisphosphate carboxylase-oxygenase, glycine betaine content, photosynthesis and transpiration in Amaranthus tricolor leaves during salt stress. J. Hortic. Sci. Biotechnol. 2000, 75, 623–627. [Google Scholar] [CrossRef]
- Shannon, M.C.; Grieve, C.M. Tolerance of vegetable crops to salinity. HortScience 1999, 78, 5–38. [Google Scholar] [CrossRef]
- Ryu, H.; Cho, Y.G. Plant hormones in salt stress tolerance. J. Plant Biol. 2015, 58, 147–155. [Google Scholar] [CrossRef]
- Wu, Z.; Xue, Z.; Li, H.; Zhang, X.; Wang, X.; Lu, X. Cultivation of dandelion (Taraxacum erythropodium) on coastal saline land based on the control of salinity and fertilizer. Folia Hortic. 2019, 31, 277–284. [Google Scholar] [CrossRef]
- Ashraf, M. Biotechnological approach of improving plant salt tolerance using antioxidants as markers. Biotechnol. Adv. 2009, 27, 84–93. [Google Scholar] [CrossRef]
- Assimakopoulou, A.; Nifakos, K.; Salmas, I.; Kalogeropoulos, P. Growth, Ion Uptake, and Yield Responses of Three Indigenous Small-Sized Greek Tomato (Lycopersicon esculentum L.) Cultivars and Four Hybrids of Cherry Tomato under NaCl Salinity Stress. Commun. Soil Sci. Plant Anal. 2015, 46, 2357–2377. [Google Scholar] [CrossRef]
- Grattan, S.R.; Grieve, C.M. Salinity-mineral nutrient relations in horticultural crops. Sci. Hortic. 1998, 78, 127–157. [Google Scholar] [CrossRef]
- Rus, A.; Lee, B.H.; Muñoz-Mayor, A.; Sharkhuu, A.; Miura, K.; Zhu, J.K.; Bressan, R.A.; Hasegawa, P.M. AtHKT1 facilitates Na+ homeostasis and K+ nutrition in planta. Plant Physiol. 2004, 136, 2500–2511. [Google Scholar] [CrossRef]
- Shannon, M.; Gronwald, J.; Tal, M. Effects of Salinity on Growth and Accumulation of Organic and Inorganic Ions in Cultivated and Wild Tomato Species. J. Am. Soc. Hortic. Sci. 1987, 112, 416–423. [Google Scholar] [CrossRef]
- Assimakopoulou, A.; Salmas, I.; Roussos, P.A.; Nifakos, K.; Kalogeropoulos, P.; Kostelenos, G. Salt tolerance evaluation of nine indigenous Greek olive cultivars. J. Plant Nutr. 2017, 40, 1099–1110. [Google Scholar] [CrossRef]
- Semiz, G.D.; Suarez, D.L.; Ünlükara, A.; Yurtseven, E. Interactive Effects of Salinity and N on Pepper (Capsicum annuum L.) Yield, Water Use Efficiency and Root Zone and Drainage Salinity. J. Plant Nutr. 2014, 37, 595–610. [Google Scholar] [CrossRef]
- Shahid, M.A.; Sarkhosh, A.; Khan, N.; Balal, R.M.; Ali, S.; Rossi, L.; Gómez, C.; Mattson, N.; Nasim, W.; Garcia-Sanchez, F. Insights into the physiological and biochemical impacts of salt stress on plant growth and development. Agronomy 2020, 10, 938. [Google Scholar] [CrossRef]
- Zhang, J.L.; Flowers, T.J.; Wang, S.M. Mechanisms of sodium uptake by roots of higher plants. Plant Soil 2010, 326, 45–60. [Google Scholar] [CrossRef]
- Alfocea, F.P.; Estañ, M.T.; Caro, M.; Bolarín, M.C. Response of tomato cultivars to salinity. Plant Soil 1993, 150, 203–211. [Google Scholar] [CrossRef]
- Peng, Z.; He, S.; Sun, J.; Pan, Z.; Gong, W.; Lu, Y.; Du, X. Na+ compartmentalization related to salinity stress tolerance in upland cotton (Gossypium hirsutum) seedlings. Sci. Rep. 2016, 6, 34548. [Google Scholar] [CrossRef] [PubMed]
- Maathuis, F.J.M.; Ahmad, I.; Patishtan, J. Regulation of Na+ fluxes in plants. Front. Plant Sci. 2014, 5, 467. [Google Scholar] [CrossRef] [PubMed]
- Almeida, D.M.; Margarida Oliveira, M.; Saibo, N.J.M. Regulation of Na+ and K+ homeostasis in plants: Towards improved salt stress tolerance in crop plants. Genet. Mol. Biol. 2017, 40, 326–345. [Google Scholar] [CrossRef] [PubMed]
- Mousavi, A.; Lessani, H.; Babalar, M.; Talaei, A.R.; Fallahi, E. Influence of salinity on chlorophyll, leaf water potential, total soluble sugars, and mineral nutrients in two young olive cultivars. J. Plant Nutr. 2008, 31, 1906–1916. [Google Scholar] [CrossRef]
- Shibli, R.A.; Sawwan, J.; Swaidat, I.; Tahat, M. Increased phosphorus mitigates the adverse effects of salinity in tissue culture. Commun. Soil Sci. Plant Anal. 2001, 32, 429–440. [Google Scholar] [CrossRef]
- Negrão, S.; Schmöckel, S.M.; Tester, M. Evaluating physiological responses of plants to salinity stress. Ann. Bot. 2017, 119, 1–11. [Google Scholar] [CrossRef]
- Tao, R.; Ding, J.; Li, C.; Zhu, X.; Guo, W.; Zhu, M. Evaluating and Screening of Agro-Physiological Indices for Salinity Stress Tolerance in Wheat at the Seedling Stage. Front. Plant Sci. 2021, 12, 646175. [Google Scholar] [CrossRef]
- Anshori, M.F.; Purwoko, B.S.; Dewi, I.S.; Ardie, S.W.; Suwarno, W.B.; Safitri, H. Determination of selection criteria for screening of rice genotypes for salinity tolerance. Sabrao J. Breed. Genet. 2018, 50, 279–294. [Google Scholar]
- Chatzigianni, M.; Ntatsi, G.; Theodorou, M.; Stamatakis, A.; Livieratos, I.; Rouphael, Y.; Savvas, D. Functional Quality, Mineral Composition and Biomass Production in Hydroponic Spiny Chicory (Cichorium spinosum L.) Are Modulated Interactively by Ecotype, Salinity and Nitrogen Supply. Front. Plant Sci. 2019, 10, 1040. [Google Scholar] [CrossRef]
- Xu, C.; Mou, B. Evaluation of lettuce genotypes for salinity tolerance. HortScience 2015, 50, 1441–1446. [Google Scholar] [CrossRef]
- Xu, C.; Mou, B. Responses of spinach to salinity and nutrient deficiency in growth, physiology, and nutritional value. J. Am. Soc. Hortic. Sci. 2016, 141, 12–21. [Google Scholar] [CrossRef]
- Xue, X.; Liu, A.; Hua, X. Proline accumulation and transcriptional regulation of proline biothesynthesis and degradation in Brassica napus. BMB Rep. 2009, 42, 28–34. [Google Scholar] [CrossRef]
- Žnidarčič, D.; Ban, D.; Šircelj, H. Carotenoid and chlorophyll composition of commonly consumed leafy vegetables in Mediterranean countries. Food Chem. 2011, 129, 1164–1168. [Google Scholar] [CrossRef]
- Zhao, J.; Davis, L.C.; Verpoorte, R. Elicitor signal transduction leading to production of plant secondary metabolites. Biotechnol. Adv. 2005, 23, 283–333. [Google Scholar] [CrossRef]
- Verma, N.; Shukla, S. Impact of various factors responsible for fluctuation in plant secondary metabolites. J. Appl. Res. Med. Aromat. Plants 2015, 2, 105–113. [Google Scholar] [CrossRef]
- Kim, H.J.; Fonseca, J.M.; Choi, J.H.; Kubota, C.; Dae, Y.K. Salt in irrigation water affects the nutritional and visual properties of romaine lettuce (Lactuca sativa L.). J. Agric. Food Chem. 2008, 56, 3772–3776. [Google Scholar] [CrossRef]
- Neocleous, D.; Koukounaras, A.; Siomos, A.S.; Vasilakakis, M. Assessing the Salinity Effects on Mineral Composition and Nutritional Quality of Green and Red “Baby” Lettuce. J. Food Qual. 2014, 37, 1–8. [Google Scholar] [CrossRef]
- Garrido, Y.; Tudela, J.A.; Marín, A.; Mestre, T.; Martínez, V.; Gil, M.I. Physiological, phytochemical and structural changes of multi-leaf lettuce caused by salt stress. J. Sci. Food Agric. 2014, 94, 1592–1599. [Google Scholar] [CrossRef]
- Klados, E.; Tzortzakis, N. Effects of substrate and salinity in hydroponically grown Cichorium spinosum. J. Soil Sci. Plant Nutr. 2014, 14, 211–222. [Google Scholar] [CrossRef]
- Petropoulos, S.A.; Fernandes, Â.; Dias, M.I.; Pereira, C.; Calhelha, R.C.; Chrysargyris, A.; Tzortzakis, N.; Ivanov, M.; Sokovic, M.D.; Barros, L.; et al. Chemical composition and plant growth of Centaurea raphanina subsp. mixta plants cultivated under saline conditions. Molecules 2020, 25, 2204. [Google Scholar] [CrossRef]
- Okasha, A.M.; Eldib, E.M.; Elmetwalli, A.H.; Farooque, A.A.; Yaseen, Z.M.; Elsayed, S. Maximization of Water Productivity and Yield of Two Iceberg Lettuce Cultivars in Hydroponic Farming System Using Magnetically Treated Saline Water. Agriculture 2022, 12, 101. [Google Scholar] [CrossRef]
- Carillo, P.; Soteriou, G.A.; Kyriacou, M.C.; Giordano, M.; Raimondi, G.; Napolitano, F.; Di Stasio, E.; Di Mola, I.; Mori, M.; Rouphael, Y. Regulated salinity eustress in a floating hydroponic module of sequentially harvested lettuce modulates phytochemical constitution, plant resilience, and post-harvest nutraceutical quality. Agronomy 2021, 11, 1040. [Google Scholar] [CrossRef]
- Sakamoto, K.; Kogi, M.; Yanagisawa, T. Effects of Salinity and Nutrients in Seawater on Hydroponic Culture of Red Leaf Lettuce. Environ. Control Biol. 2014, 52, 189–195. [Google Scholar] [CrossRef][Green Version]
- Petropoulos, S.A.; Fernandes, Â.; Dias, M.I.; Pereira, C.; Calhelha, R.; Gioia, F.D.; Tzortzakis, N.; Ivanov, M.; Sokovic, M.; Barros, L.; et al. Wild and cultivated Centaurea raphanina subsp. mixta: A valuable source of bioactive compounds. Antioxidants 2020, 9, 314. [Google Scholar] [CrossRef]
- Roshdy, A.E.D.; Alebidi, A.; Almutairi, K.; Al-Obeed, R.; Elsabagh, A. The effect of salicylic acid on the performances of salt stressed strawberry plants, enzymes activity, and salt tolerance index. Agronomy 2021, 11, 775. [Google Scholar] [CrossRef]
- Tari, I.; Csiszár, J.; Szalai, G.; Horváth, F.; Pécsváradi, A.; Kiss, G.; Szepesi, Á.; Szabó, M.; Erdei, L. Acclimation of tomato plants to salinity stress after a salicylic acid pre-treatment. Acta Biol. Szeged. 2002, 46, 55–56. [Google Scholar]
- Colla, G.; Kim, H.J.; Kyriacou, M.C.; Rouphael, Y. Nitrate in fruits and vegetables. Sci. Hortic. 2018, 237, 221–238. [Google Scholar] [CrossRef]
- Colonna, E.; Rouphael, Y.; Barbieri, G.; De Pascale, S. Nutritional quality of ten leafy vegetables harvested at two light intensities. Food Chem. 2016, 199, 702–710. [Google Scholar] [CrossRef]
- Kyriacou, M.C.; Rouphael, Y. Towards a new definition of quality for fresh fruits and vegetables. Sci. Hortic. 2018, 234, 463–469. [Google Scholar] [CrossRef]
- Colla, G.; Rouphael, Y.; Cardarelli, M.; Svecova, E.; Rea, E.; Lucini, L. Effects of saline stress on mineral composition, phenolic acids and flavonoids in leaves of artichoke and cardoon genotypes grown in floating system. J. Sci. Food Agric. 2013, 93, 1119–1127. [Google Scholar] [CrossRef]
- Borgognone, D.; Rouphael, Y.; Cardarelli, M.; Lucini, L.; Colla, G. Changes in biomass, mineral composition, and quality of cardoon in response to NO3−:Cl− ratio and nitrate deprivation from the nutrient solution. Front. Plant Sci. 2016, 7, 978. [Google Scholar] [CrossRef]
- Rubinigg, M.; Posthumus, F.; Ferschke, M.; Elzenga, J.T.M.; Stulen, I. Effects of NaCl salinity on 15N-nitrate fluxes and specific root length in the halophyte Plantago maritima L. Plant Soil 2003, 250, 201–213. [Google Scholar] [CrossRef]


Disclaimer/Publisher’s Note: The statements, opinions and data contained in all publications are solely those of the individual author(s) and contributor(s) and not of MDPI and/or the editor(s). MDPI and/or the editor(s) disclaim responsibility for any injury to people or property resulting from any ideas, methods, instructions or products referred to in the content. |
© 2023 by the authors. Licensee MDPI, Basel, Switzerland. This article is an open access article distributed under the terms and conditions of the Creative Commons Attribution (CC BY) license (https://creativecommons.org/licenses/by/4.0/).