Article

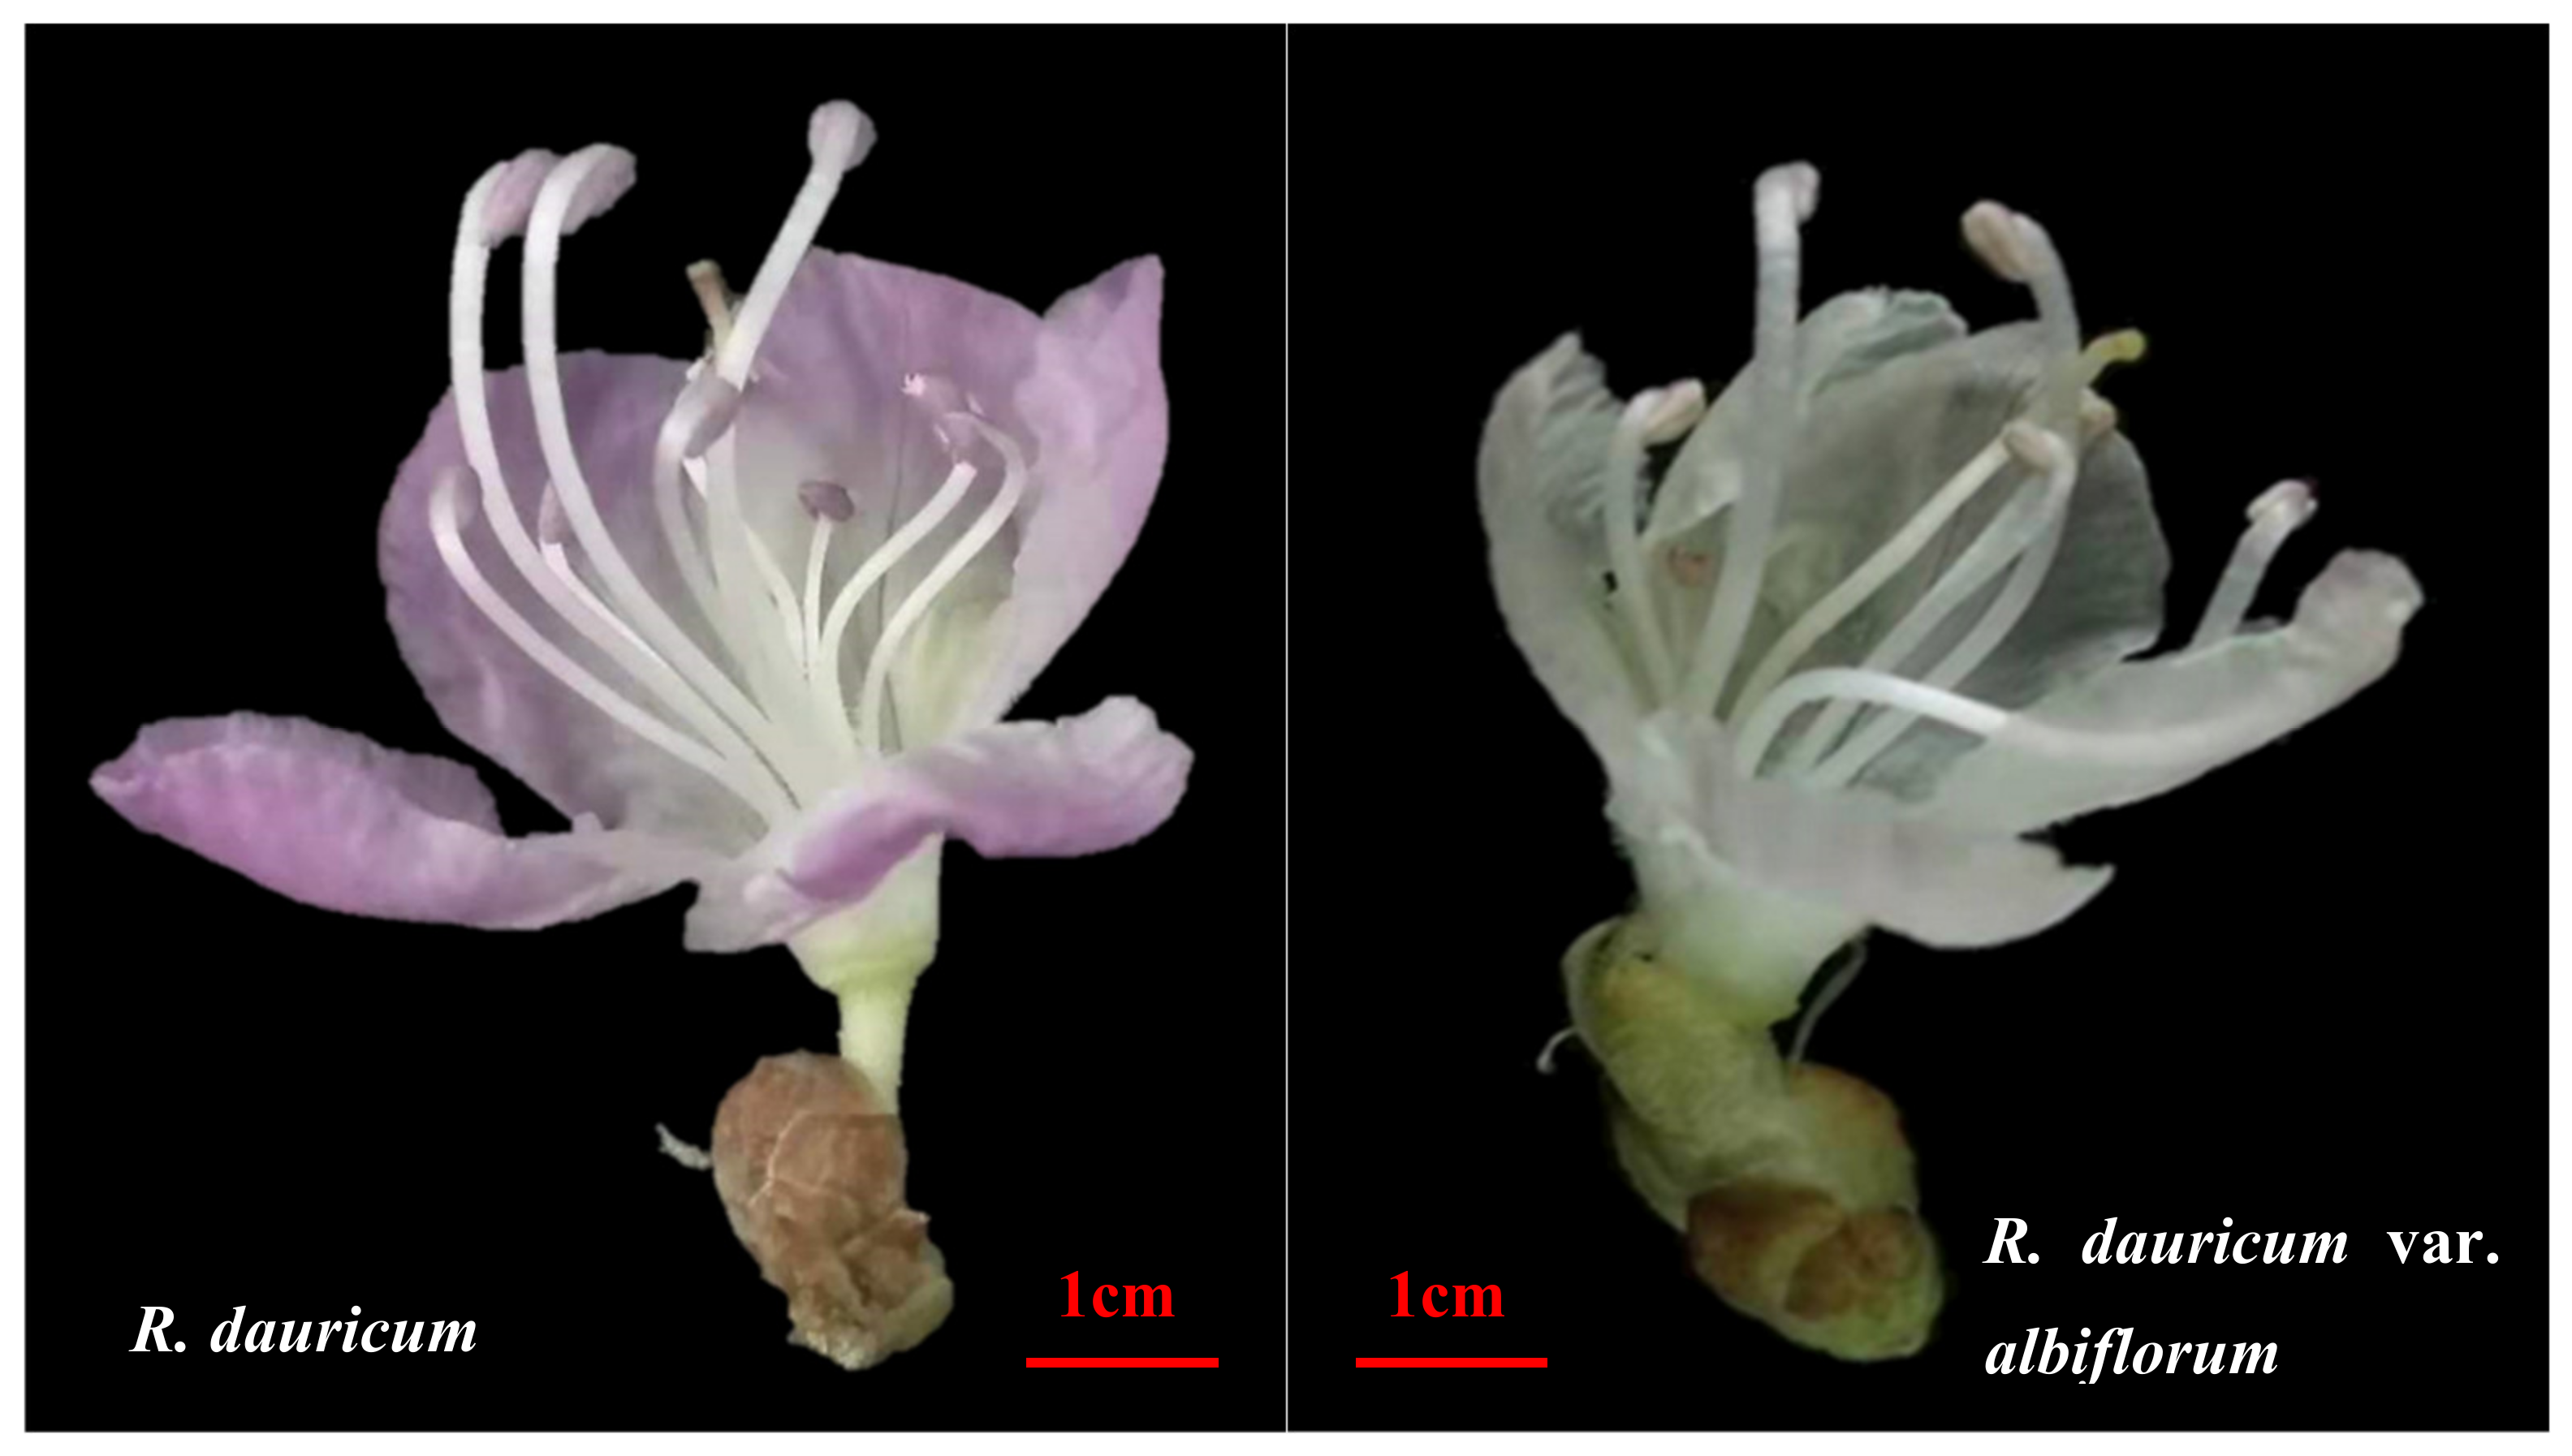
Anthocyanin Metabolite and Transcriptome Sequencing Analysis Reveals White Flowers in Rhododendron dauricum var. albiflorum

Engineering Research Centre of Forestry Biotechnology, Key Laboratory of State Forestry Administration on Conservation and Efficient Utilization of Precious and Rare Forest Resource in Changbai Mountain, Forestry College, Beihua University, Jilin 132013, China
*
Author to whom correspondence should be addressed.
Horticulturae 2023, 9(10), 1071; https://doi.org/10.3390/horticulturae9101071
Submission received: 22 August 2023 / Revised: 7 September 2023 / Accepted: 19 September 2023 / Published: 25 September 2023
(This article belongs to the Section Floriculture, Nursery and Landscape, and Turf)

Abstract

:
Rhododendron dauricum is a cold-hardy shrub integrating ornamental, medicinal, and aromatic functions. Flower color is an important feature related to ornamental value for breeders and consumers. Nevertheless, the coloration mechanism of flower color in R. dauricum is still unclear. R. dauricum var. albiflorum is a white flower variety of R. dauricum. In this study, an integrative analysis of the metabolome and transcriptome was conducted between R. dauricum var. albiflorum and R. dauricum. A total of nine anthocyanins and two proanthocyanidins were differentially accumulated between R. dauricum var. albiflorum and R. dauricum. A decrease in malvidin-, delphinidin-, cyanidin-, peonidin-, and petunidin-based anthocyanins and an increase in procyanidin A2 and procyanidin B2 were responsible for the white flowers of R. dauricum var. albiflorum. Furthermore, a total of 4376 differentially expressed genes (DEGs) were identified using transcriptome sequencing. Integrated analysis of the metabolome and transcriptome showed that 21 DEGs encoding 9 enzymes (PAL, C4H, CHS, CHI, F3H, F3′5′H, DFR, ANR, and UFGT) were identified as structural genes involved in anthocyanin and proanthocyanidin biosynthesis, and 15 MYBs and 10 bHLHs were the transcriptional regulators of the anthocyanin biosynthesis pathways in R. dauricum var. albiflorum. Our results deepen the understanding of variations in azalea flower color, which is helpful for identifying important genes in the genetic engineering of azalea shrubs.

1. Introduction

Flower color is an important ornamental feature of plants, directly related to their ornamental value and their probability of accepting pollination, which has fascinated botanists, ecologists, and horticulturists. The selection and cultivation of new flower color varieties is also the main objective in ornamental plant breeding programs [1]. The coloring of floral organs is influenced by several factors, including petal cell shape, vacuole pH, pigment composition, metal ions, and environmental conditions, such as temperature, light, and soil nutrients [2]. One of the most critical factors is pigment composition, which contains flavonoids, chlorophylls, carotenoids, and betalains [3]. A group of secondary metabolites belonging to flavonoids are the main determinants of coloration in plants, where anthocyanins are responsible for the pink, red, orange, purple, and violet pigments in leaves, flowers, fruits, seeds, and other tissues. Anthocyanins are the predominant compounds of floral coloration [4].
The basic carbon skeleton of anthocyanins is C6-C3-C6, which has many sites to bind with glycosides. On this basis, anthocyanins further undergo glycosylation, methylation, and acylation to form various anthocyanins, which make plants present different colors [5]. Anthocyanin biosynthesis is an important part of the flavonoid branch within the phenylpropanoid pathway [6]. As an initial precursor of anthocyanins, phenylalanine is sequentially catalyzed by phenylalanine ammonia-lyase (PAL), trans-cinnamate 4-monooxygenase (C4H), 4-coumarate-CoA ligase (4CL), chalcone synthase (CHS), chalcone isomerase (CHI), flavanone 3-hydroxylase (F3H), flavonoid 3′-hydroxylase (F3′H), flavonoid 3′,5′-hydroxylase (F3′5′H), and flavanone 4-reductase (DFR) to produce leucoanthocyanidins; anthocyanins are then synthesized from leucoanthocyanidins by anthocyanidin synthase (ANS). In specific tissues and cellular environments, these anthocyanins are further glycosylated, methylated, and acylated by glucosyltransferase (GT), methyltransferase (MT), and acyltransferase (AT), respectively [7]. To date, more than 600 anthocyanins have been well identified in flowers, fruits, and vegetables [8].
Anthocyanins have been isolated using paper chromatography (PC), thin-layer chromatography (TLC), high-performance liquid chromatography (HPLC), and ultra-performance liquid chromatography (UPLC). Moreover, their structures and chemical identification have been elucidated using nuclear magnetic resonance (NMR) and mass spectrometry (MS) [9]. However, the anthocyanin composition in some species is limited. Metabolome analysis, based on UPLC and MS technology, aims to analyze all anthocyanin metabolites in a biological sample comprehensively and shows great potential in elucidating anthocyanins’ metabolic processes [10]. As a third-generation sequencing technology, single-molecule real-time (SMRT) sequencing can generate full-length transcripts in transcriptomic investigations for non-model organisms without reference sequences. The full-length transcripts can solve the problem of incomplete sequences resulting from next-generation (NG) sequencing technology, such as Roche/454, SOLiD, and Illumina [11]. With the help of NG sequencing for error correction, SMRT sequencing has been used to generate comprehensive transcriptomic information [12]. Transcriptome analysis, based on SMRT sequencing and NG sequencing technology, has become an efficient tool for identifying key genes involved in anthocyanin biosynthesis in ornamental plant species [13]. Consequently, integrating transcriptomic and metabolomic analyses can identify the genes related to anthocyanins underlying the phenotype of interest and provide information on the gene-to-metabolite networks of a given species [14].
As the largest genus in the Ericaceae family, the genus Rhododendron, including approximately 1000 species and thousands of commercial hybrids, is widely distributed throughout the Northern Hemisphere [15]. A great many Rhododendron species, such as R. molle, R. simsii, and R. pulchrum, have become highly profitable ornamental flowers because of their attractive flower colors, which command a high economic value in the market [16,17,18]. Although the anthocyanin biosynthesis pathways in some Rhododendron cultivars have been studied, few studies have focused on the molecular mechanisms underlying anthocyanin accumulation with respect to the infraspecific color polymorphisms in wild Rhododendron species [19].
Rhododendron dauricum, a semi-evergreen, multi-branched, and cold-hardy shrub, is mainly distributed in Northeast China, Mongolia, the Russian Far East, the Korean Peninsula, and Japan, and is a woody plant integrating ornamental, medicinal, and aromatic functions [20,21]. At present, the only flower color of varieties on the market is purple, which is a narrow variety compared with other flowers, seriously limiting its ornamental application. However, there is a high demand for new flower colors and cold hardiness, especially in cold temperate zones [22]. R. dauricum var. albiflorum, an intraspecies variety of R. dauricum, is a valuable ornamental plant due to its white flowers, but information concerning metabolomic and transcriptomic changes that occur as a result of flower color changes in R. dauricum has been scant. In the present study, we combined metabolome and transcriptome analyses (SMRT and Illumina sequencing, respectively) to elucidate differences in anthocyanin content and gene expression between R. dauricum var. albiflorum and R. dauricum. By investigating changes in the expression of genes related to anthocyanin biosynthesis, this study deepens our understanding of variations in azalea flower color and identifies important genes for the genetic engineering of azalea shrubs.

2. Materials and Methods

2.1. Plant Materials

R. dauricum var. albiflorum and R. dauricum shrubs were planted at Xinshan Nursery Stock Cooperative (44.03° N, 126.76° E), located in Jiangmifeng Town, Longtan District, Jilin City. The original source was from Nianpan Mountain (43.88° N, 126.79° E), located in Jilin City. The shrubs underwent a period of five years of cultivation and were planted in a greenhouse with row spacing and plant spacing of 1 m × 2 m. Fresh flower buds were carefully gathered from three individual plants for both white and purple colors (Figure 1). The six samples were treated by freezing in liquid nitrogen and stored at −80 °C for further analysis involving anthocyanin metabolite and transcriptome sequencing.

2.2. Extraction, Identification, and Quantification of Anthocyanin Metabolites

Lyophilized flower buds were ground into powder using a mixer mill (MM400, Retsch, Germany) at 30 Hz for 1.5 min. A total of 100 mg of powder was extracted overnight at 4 °C with 1 mL 70% (v/v) methanol aqueous. Subsequently, the resulting mixture was centrifuged at 10,000× g for 10 min. Then, the supernatant was filtered through a 0.22 μm pore-size membrane and analyzed using ultra-performance liquid chromatography (Shim-pack UFLC SHIMADZU CBM30A, Kyoto, Japan) and tandem mass spectrometry (Applied Biosystems 4500 QTRAP, SCIEX, Waltham, MA, USA) (UPLC-MS/MS) system. The analytical conditions were conducted following the procedures outlined in the study of Wang et al. [23]. Metabolites were quantified using the multiple reaction monitoring (MRM) method [24]. Metabolites with significant differences in content were set with p-value thresholds < 0.05 and |log2(fold change)| ≥ 1 [25]. The differential metabolites were then annotated using the Kyoto Encyclopedia of Genes and Genomes (KEGG) database [26].

2.3. Transcriptome Sequencing

Total RNA was extracted from the six flower samples (two colors of flower and three biological replicates) using an RNA extraction kit (Tiangen, Beijing, China). RNA quantity and quality were determined using a NanoDrop 2000 spectrophotometer (NanoDrop Technologies, Wilmington, DE, USA) and an Agilent Bioanalyzer 2100 system (Agilent Technologies, Palo Alto, CA, USA), respectively. The purified RNAs from each sample were mixed in equal amounts for SMRT library construction. The mRNA was isolated from total RNA using magnetic beads with oligo (dT). A SMARTer PCR cDNA Synthesis Kit (TaKaRa, Dalian, China) was utilized to synthesize cDNA, and subsequent cDNA fractions in length selection were performed using a BluePippin™ Size selection system (Sage Science, Beverly, MA, USA). The SMRT library was generated using a Pacific Biosciences DNA Template Prep Kit 2.0 (Pacific Biosciences, Menlo Park, CA, USA), and SMRT sequencing was performed on the Pacific Bioscience (PacBio) platform.
Six RNA samples of the two colors of flowers and three biological replicates were used for cDNA library construction and Illumina sequencing. The strand-specific cDNA libraries were constructed using a cDNA Synthesis Kit (TaKaRa, Dalian, China) and sequencing was performed using an Illumina HiSeq 2500 platform (San Diego, CA, USA).
Full-length sequences were constructed using SMRT sequencing data and further polished using Illumina sequencing data. Circular consensus sequencing (CCS) reads were produced from SMRT subreads. The CCS reads were classified as full-length nonchimeric (FLNC) reads and non-full-length (NFL) reads by identifying poly (A) signals and 5′ and 3′ adaptors. The FLNC reads generated from the same isoform were clustered into one consensus isoform using iterative clustering for error (ICE) correction. Subsequently, the consensus isoforms were further polished using the Quiver program with the assistance of NFL reads, resulting in high-quality isoforms (accuracy > 99%) and low-quality isoforms. The low-quality isoforms were polished using filtered Illumina sequencing data, which had removed adaptor sequences, ambiguous reads with ‘N’ bases, and low-quality reads. The redundant isoforms (identity < 99%) were eliminated using the CD-HIT program [27] without considering the 5′ difference. Finally, a high-quality transcript dataset without redundant transcripts was obtained.

2.4. Structure and Functional Annotation of Transcripts

The transcript data were used for BLAST and SUPPA2 software, which met all criteria and were considered as the products of alternative splicing (AS) events. The AS gap was larger than 100 bp and, at least, 100 bp away from the 3′/5′ end [28]. Simple sequence repeats (SSRs) within the transcriptome were identified using MISA software. TransDecoder software was used to identify potential coding sequence (CDS) regions within the transcript sequences. lncRNAs were screened via coding potential calculator (CPC), coding-non-coding index (CNCI), coding potential assessment tool (CPAT), and protein family (Pfam) databases. LncTar tool was utilized to investigate the target genes of lncRNAs [29]. Transcription factors (TFs) were predicted using iTAK software from putative protein sequences [30].
All transcripts were subjected to functional annotation using BLAST against various databases including NCBI non-redundant protein (Nr), Swiss-Prot, clusters of orthologous groups (COGs), eukaryotic orthologous groups (KOGs), evolutionary genealogy of genes: non-supervised orthologous groups (eggNOGs), Pfam, gene ontology (GO), and KEGG. For each transcript in each database, the functional information of the best-matched sequence was assigned to the query transcript.

2.5. Differentially Expressed Gene (DEG) Analysis

For gene expression analysis, counts were mapped to the reading of each gene using RSEM software. Following this, normalization of the mapped reads was performed using fragments per kilobase of transcript per million mapped reads (FPKM) method [31]. DESeq software was used to analyze differentially expressed genes (DEGs). Screening of significant DEGs was performed using false discovery rate (FDR) < 0.01 and |log2(fold change)| ≥ 1 as the criteria [32]. WEGO software and KEGG database were employed for GO enrichment and KEGG pathway enrichment, respectively [26,33].

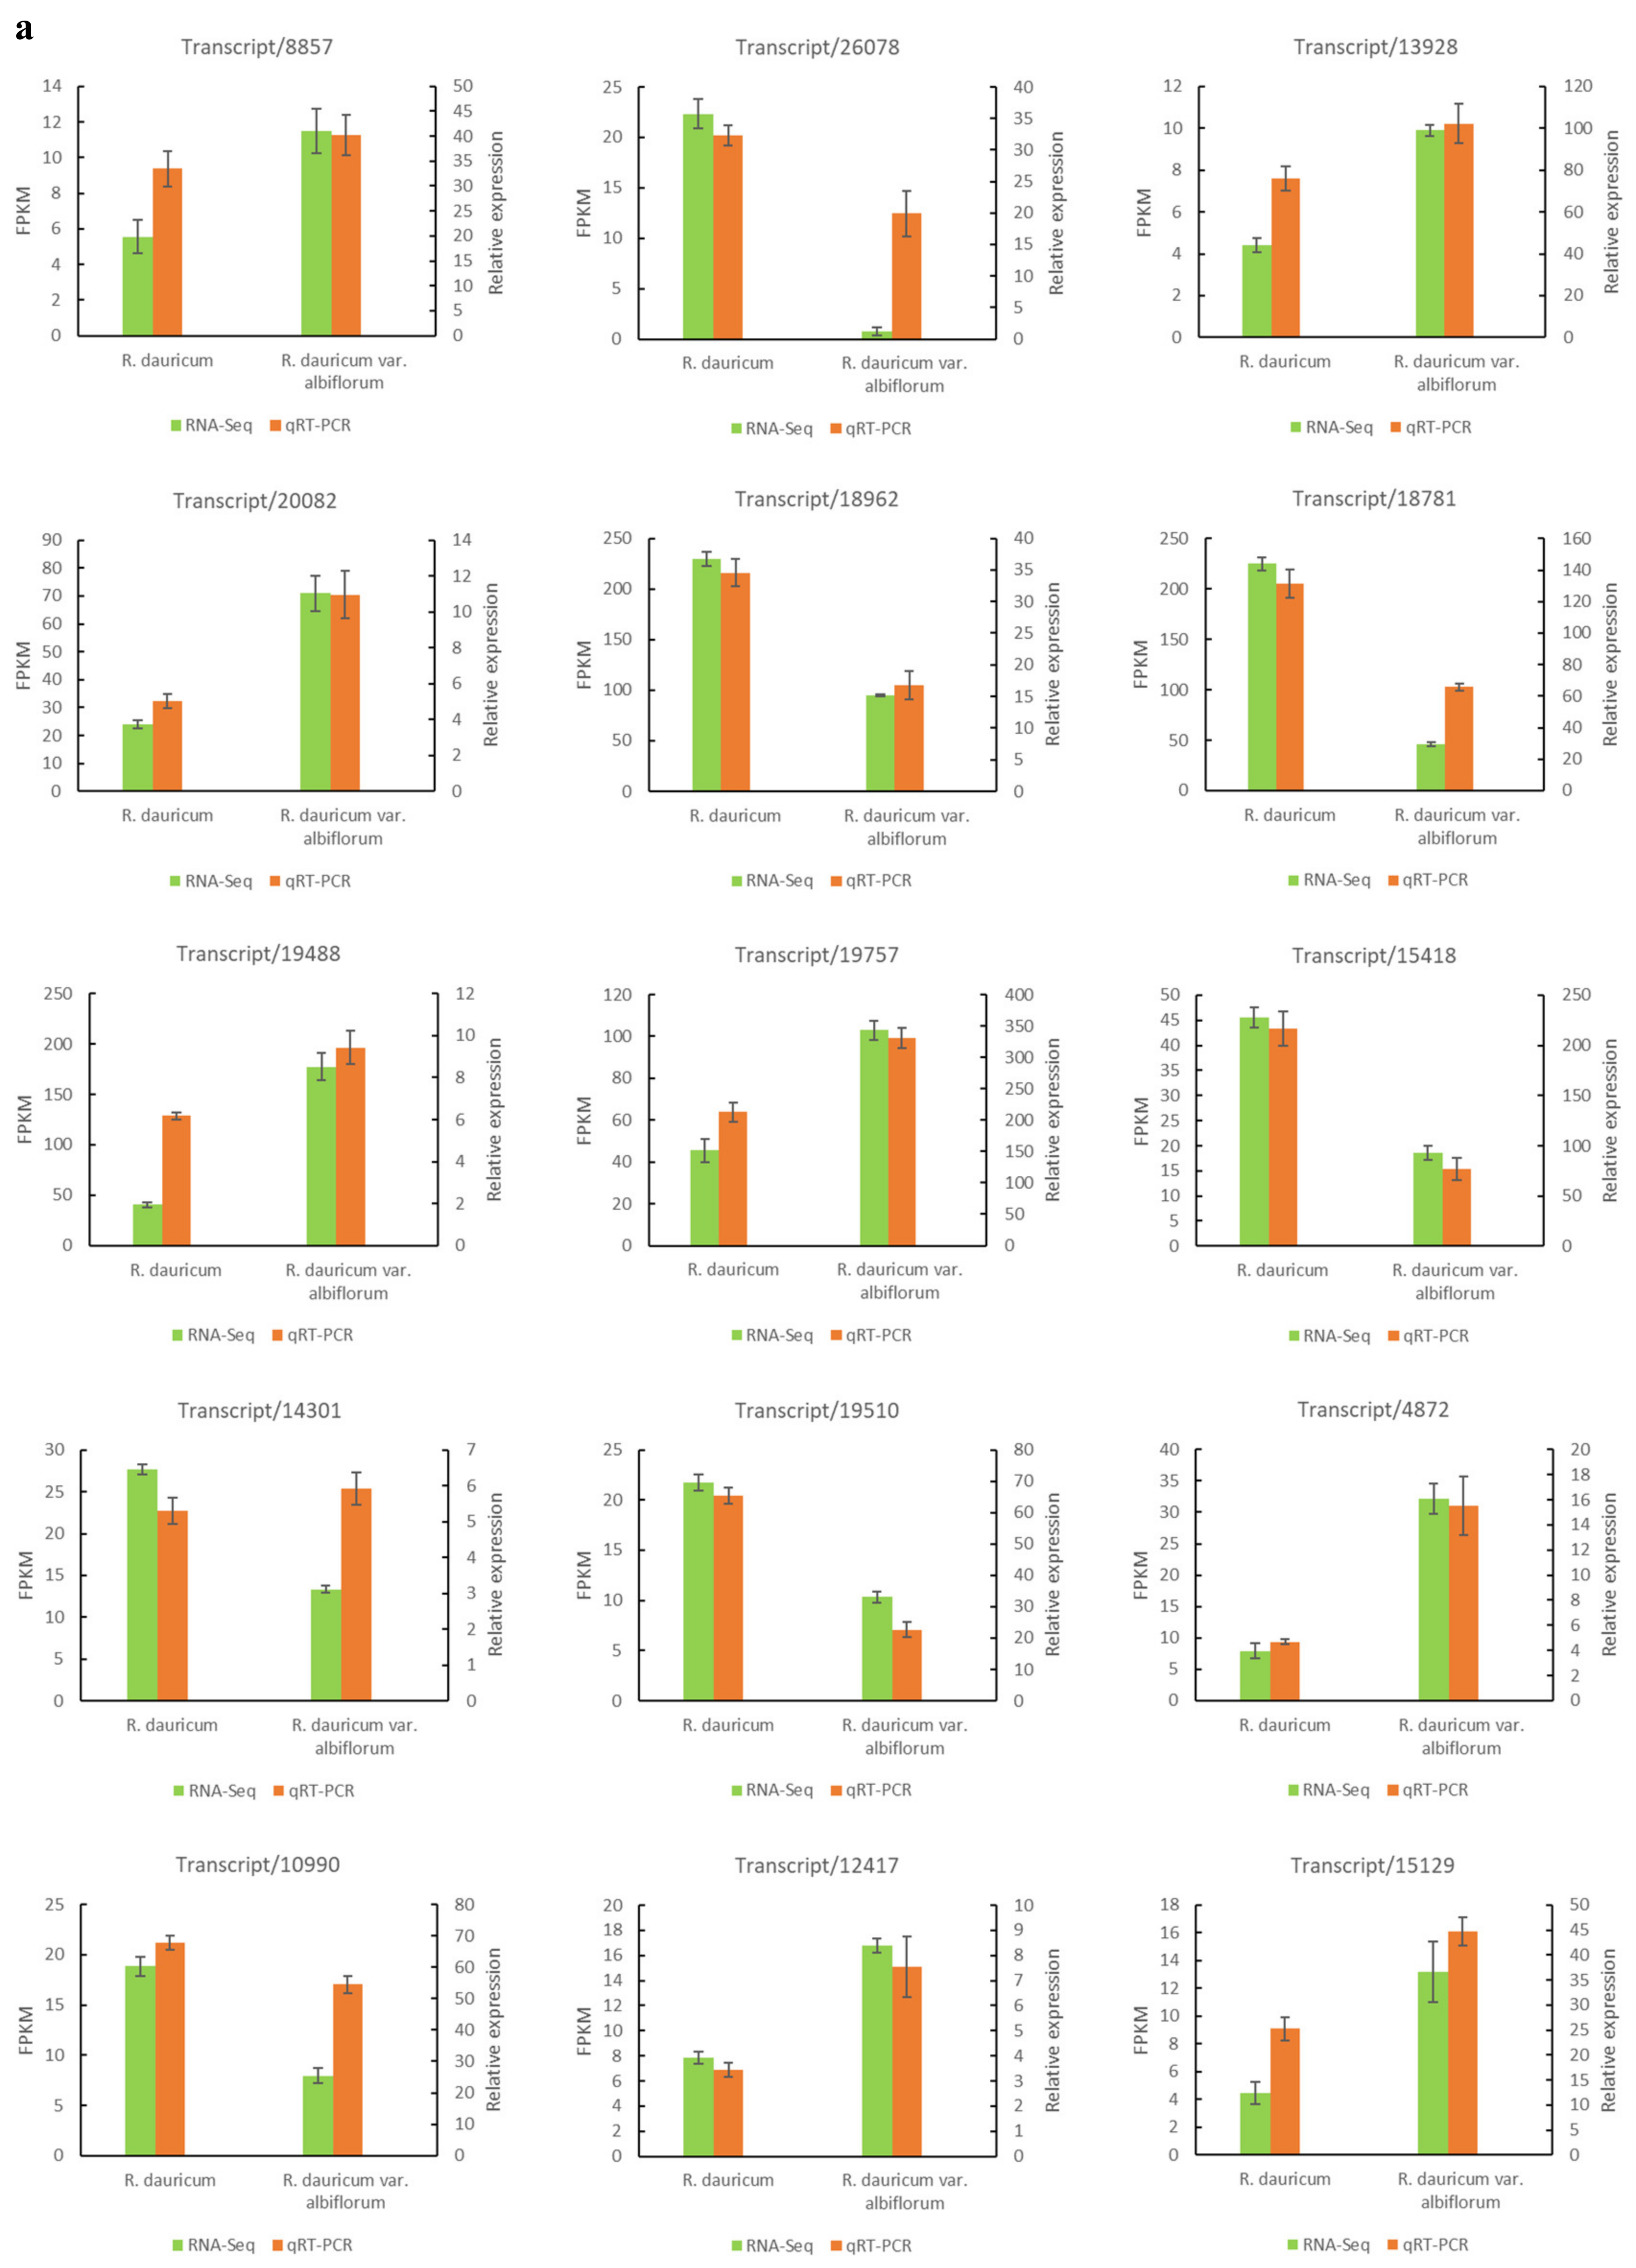
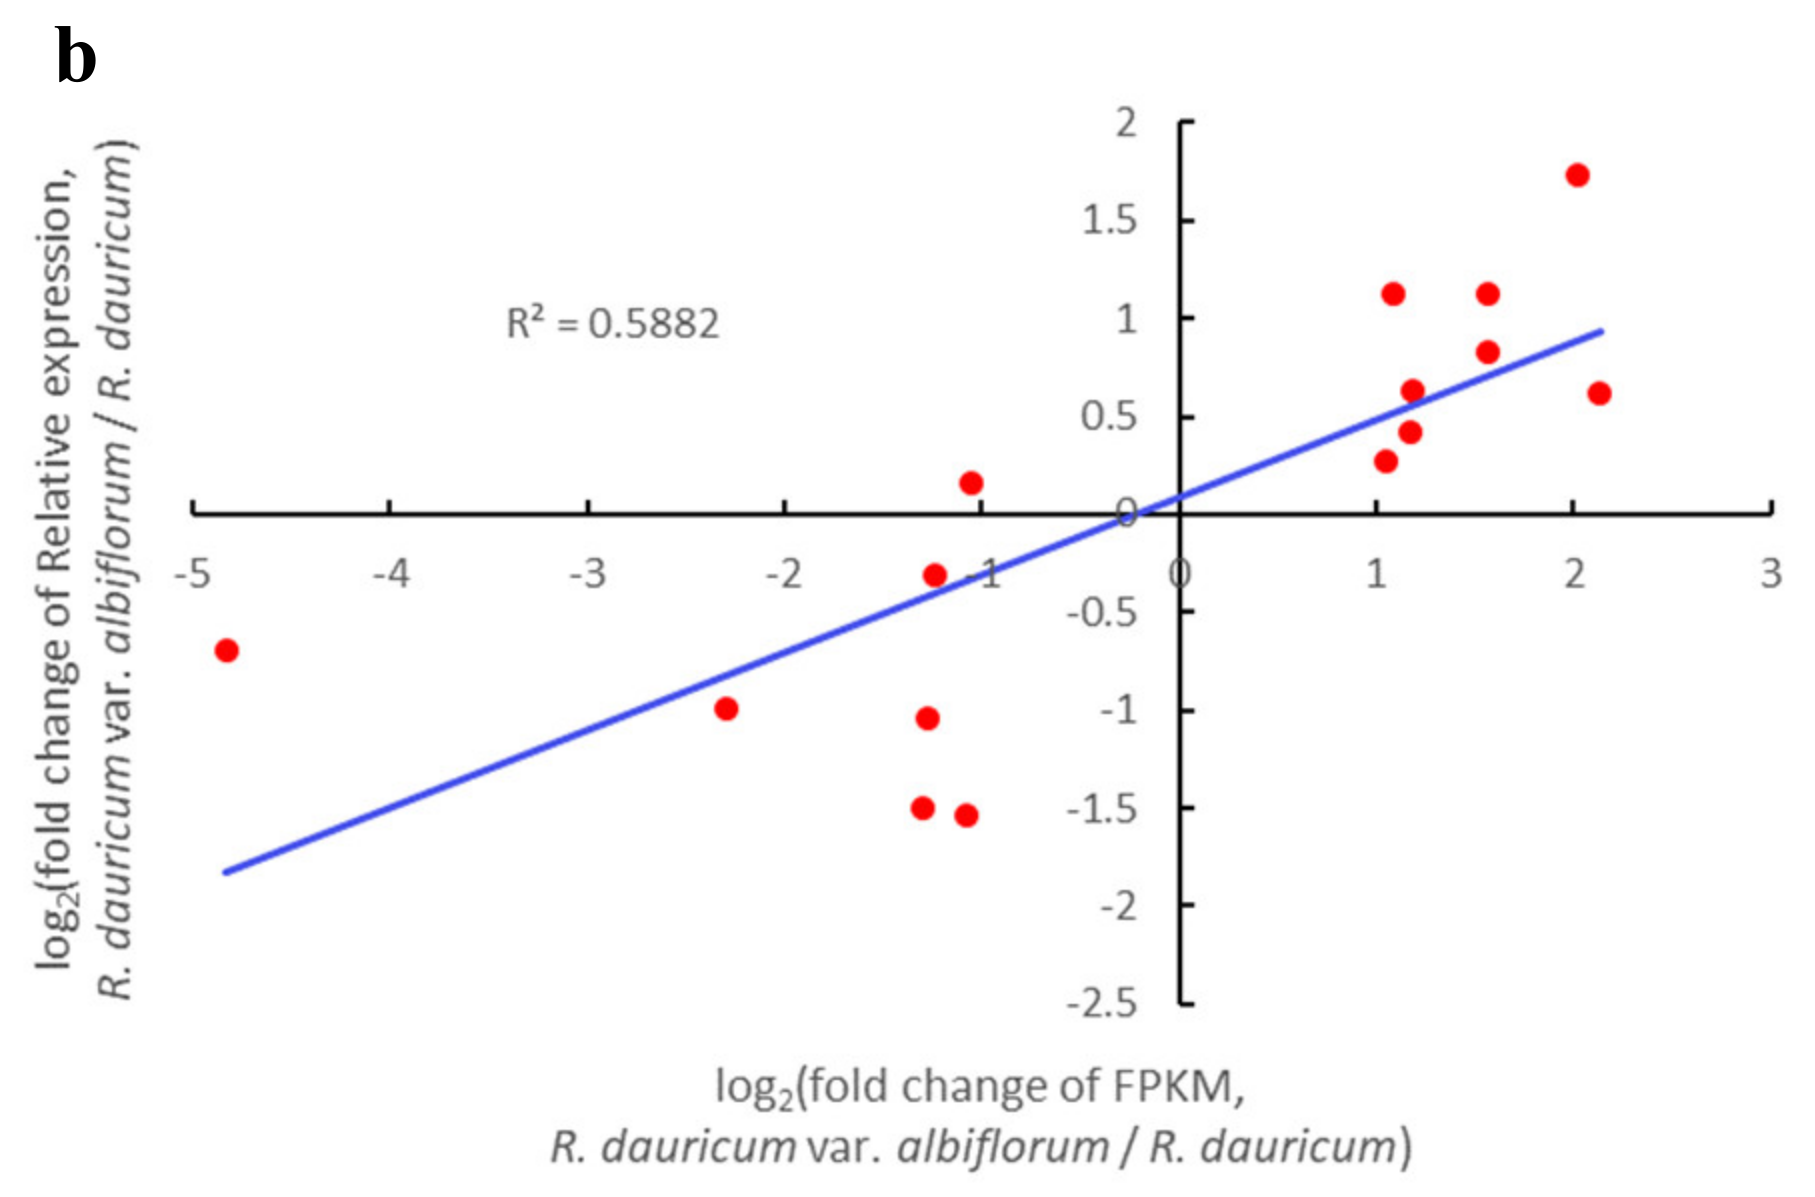
2.6. Quantitative Real-Time PCR (qRT-PCR) Validation

The expression of fifteen color-related genes was confirmed using qRT-PCR, including nine structural genes (one PAL, transcript/8857; one C4H, transcript/26078; one CHS, transcript/13928; one CHI, transcript/20082; one F3H, transcript/18962; one F3′5′H, transcript/18781; one DFR, transcript/19488; one ANR, transcript/19757; one UFGT, transcript/15418) and six transcription factor genes (three MYBs: transcript/14301, transcript/19510, and transcript/4872; three bHLHs: transcript/10990, transcript/12417, and transcript/15129), which covered most of the enzymes and TFs involved in anthocyanidin biosynthesis. Primers for these genes were designed manually (Table 1). RNA extraction was conducted using the method described above, and the first-strand cDNA was synthesized using ReverTra Ace qPCR RT Master Mix with gDNA Remover (Toyobo, Osaka, Japan) according to the manufacturer protocol. The cDNA was diluted tenfold and served as the template for qRT-PCR. The qRT-PCR mixture was prepared using a 0.5 μL template of RT reaction mixture, 5 μL of 2 × SYBR Green Master Mix (Toyobo, Osaka, Japan), and 0.3 μL of forward and reverse primer (10 μmol/L). The final volume was adjusted to 10 μL with water. The reactions were performed in a real-time PCR system (ABI QuantStudio5, Applied Biosystems, Waltham, MA, USA) using a two-step method that was initiated for 30 s at 95 °C followed by 40 cycles of 95 °C for 5 s, 56 °C for 15 s, 72 °C for 30 s. A melting curve was performed from 65 °C to 95 °C to check the specificity of the amplified product. All experiments were conducted with three biological replicates for each sample. The expression was calculated by 2−ΔΔCt and normalized to values obtained from the 18S rRNA and α-actin controls.

3. Results

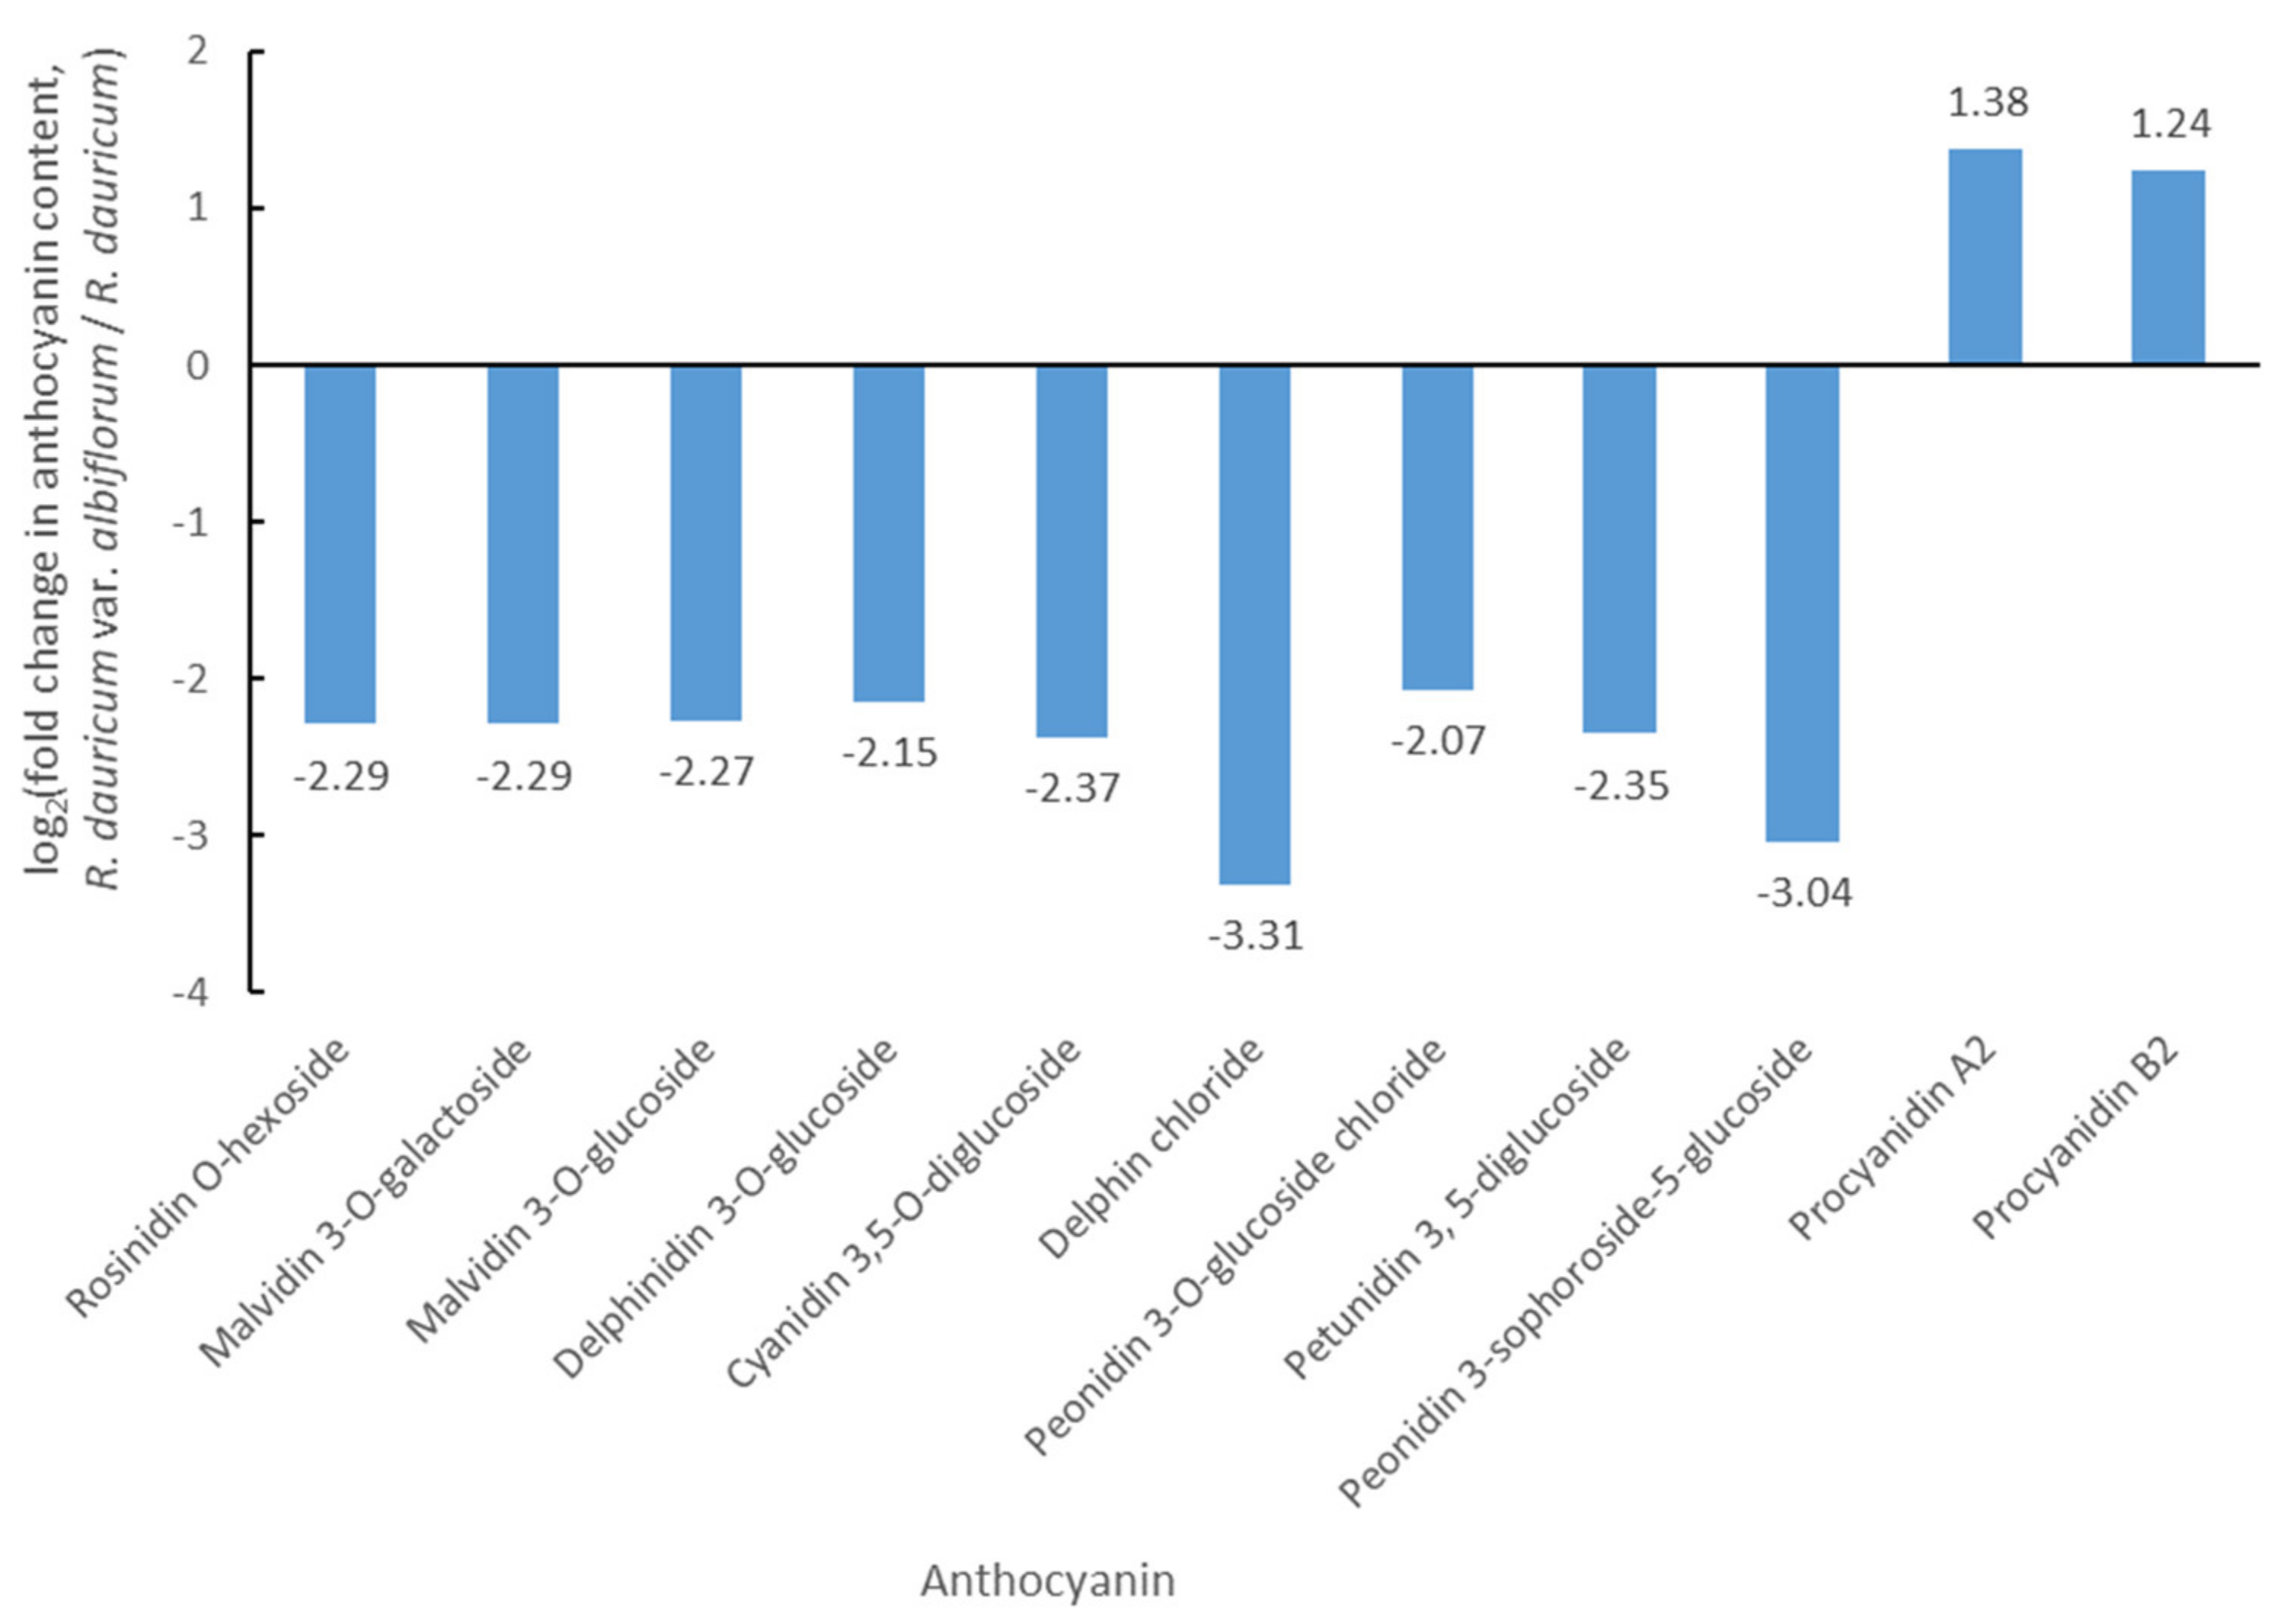
3.1. Differential Accumulation of Anthocyanins

In order to explore the coloration mechanism of white flowers in R. dauricum var. albiflorum, an anthocyanin metabolome analysis was performed using UPLC-MS/MS. In total, twelve anthocyanins and four proanthocyanidins were identified, among which nine anthocyanins and two proanthocyanidins were metabolites with significant differences between R. dauricum var. albiflorum and R. dauricum (Figure 2). It was observed that rosinidin O-hexoside, malvidin 3-O-galactoside, malvidin 3-O-glucoside, delphinidin 3-O-glucoside, cyanidin 3,5-O-diglucoside, delphin chloride, peonidin 3-O-glucoside chloride, petunidin 3, 5-diglucoside, and peonidin 3-sophoroside-5-glucoside, which were the sources of purple color, were significantly lower in R. dauricum var. albiflorum compared to R. dauricum. Delphin chloride and peonidin 3-sophoroside-5-glucoside showed 9.89- and 8.23-fold less accumulation in R. dauricum var. albiflorum, respectively. Proanthocyanidins, which are colorless, showed significantly higher levels in R. dauricum var. albiflorum when compared to R. dauricum. Procyanidin A2 and procyanidin B2 showed 2.60- and 2.37-fold greater accumulation in R. dauricum var. albiflorum, respectively. It was suggested that the lower levels of anthocyanins and the higher levels of proanthocyanidins might be the reasons for the white flower color in R. dauricum var. albiflorum.

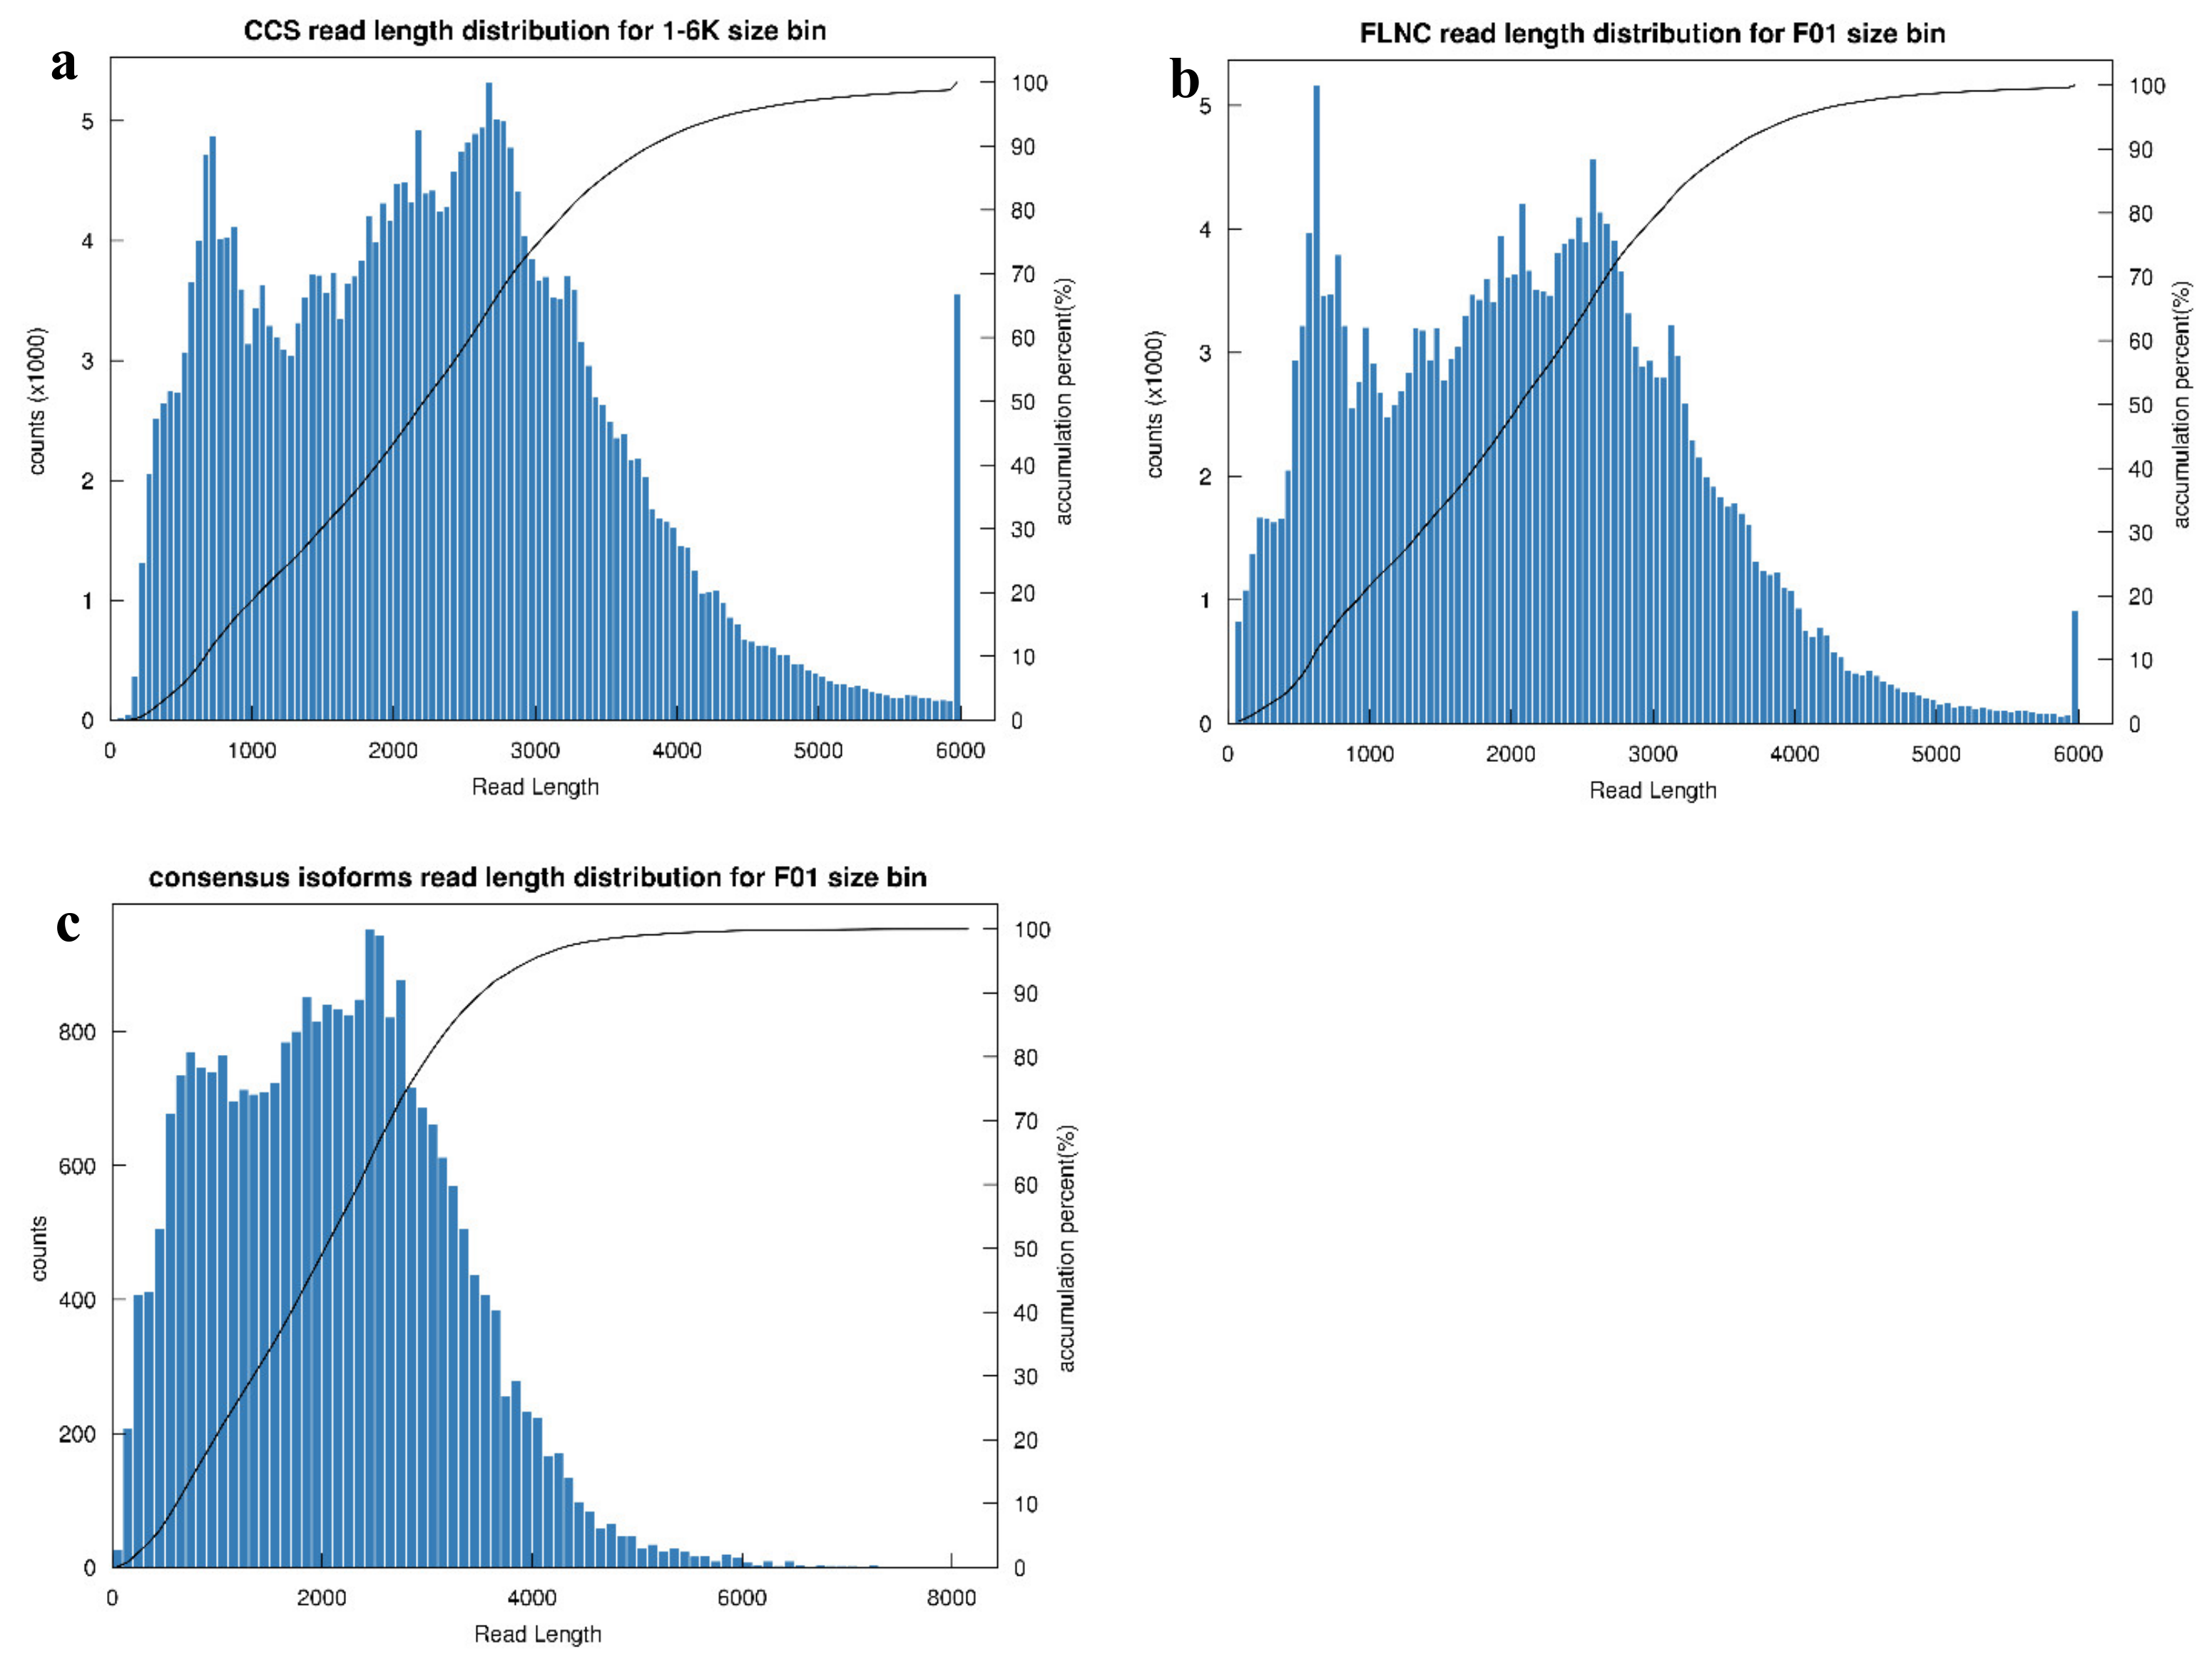
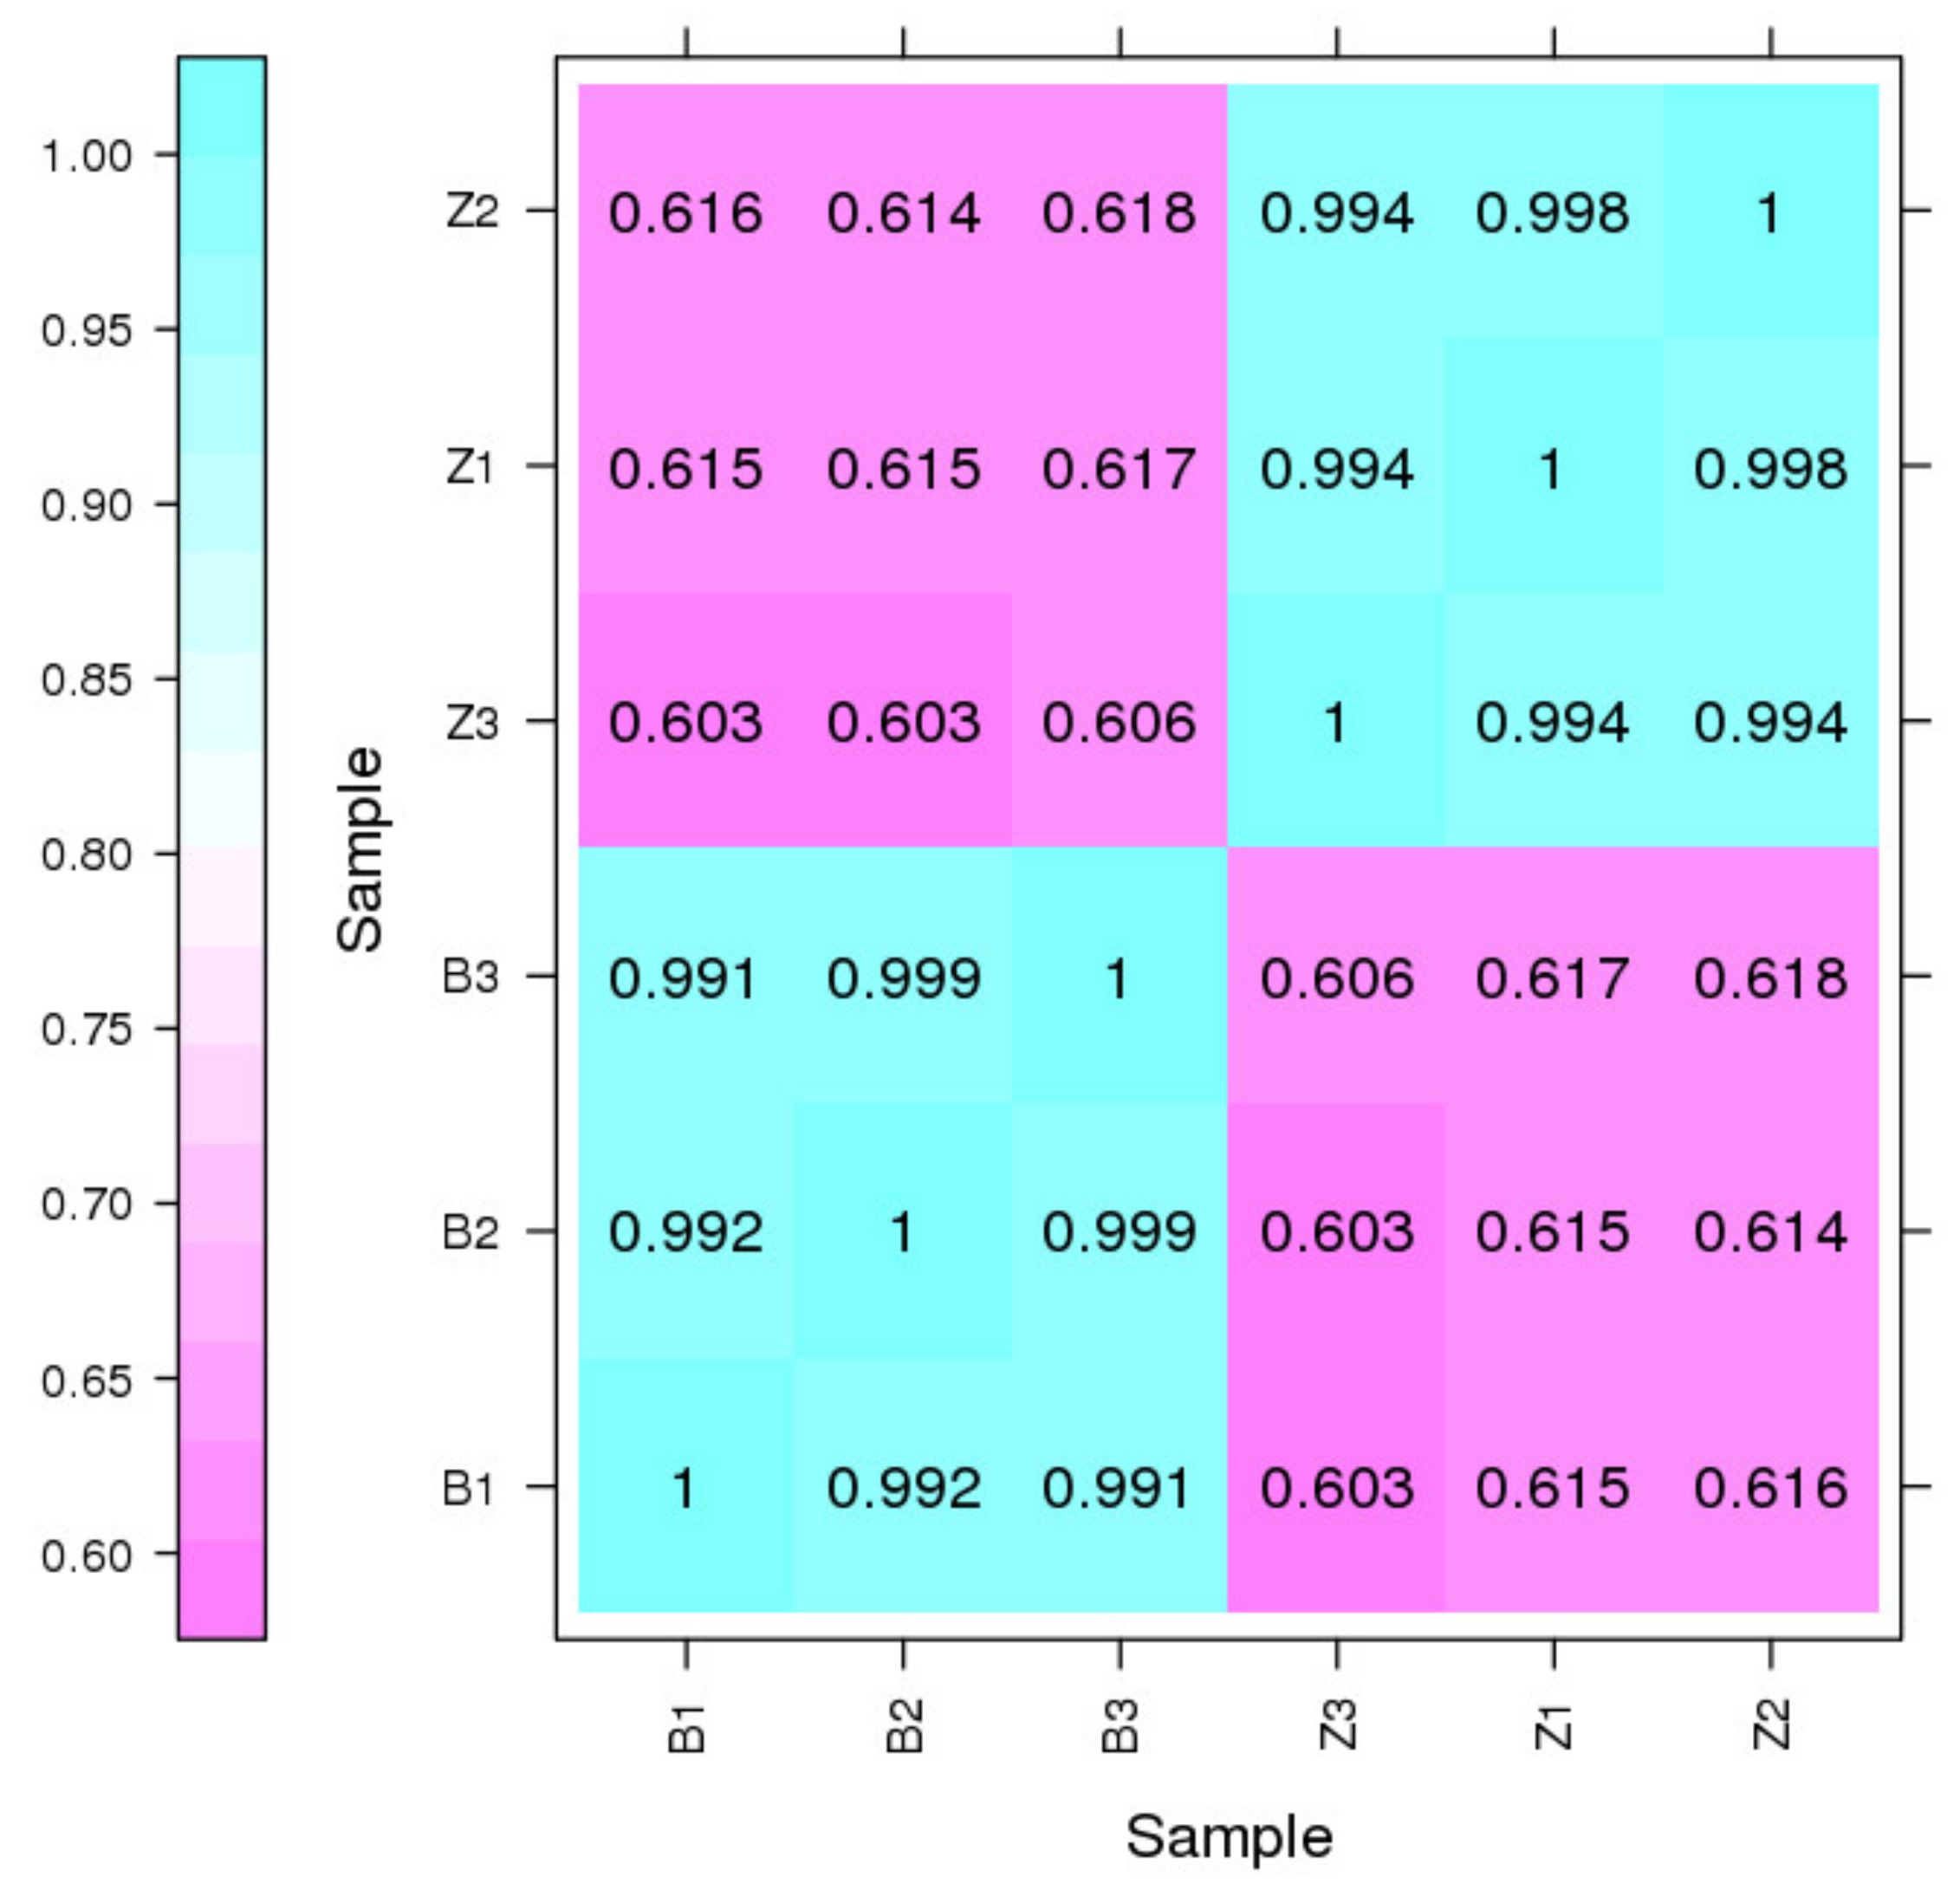
3.2. General Properties of Transcriptome Sequencing

To acquire a high-confidence transcriptome, six RNA samples representing two flower colors were equally pooled for library preparation, and SMRT sequencing and Illumina sequencing were employed to sequence the transcripts. A total of 21.20 Gb of clean data were generated from the PacBio platform. Within the dataset, a total of 295,966 CCS reads were obtained, encompassing 681,750,517 read bases, with a mean read length of 2303 bp (Figure 3a). Then, 237,163 FLNC reads were determined by searching for the poly (A) signal and 5′ and 3′ adaptors (Figure 3b). A total of 26,914 consensus isoforms with a mean read length of 2112 bp were obtained by clustering FLNC reads and polished NFL reads (Figure 3c), among which 26,814 consensus isoforms were identified as high-quality isoforms. Finally, 14,660 high-quality transcripts were obtained by Illumina sequencing data and CD-HIT program polishing.

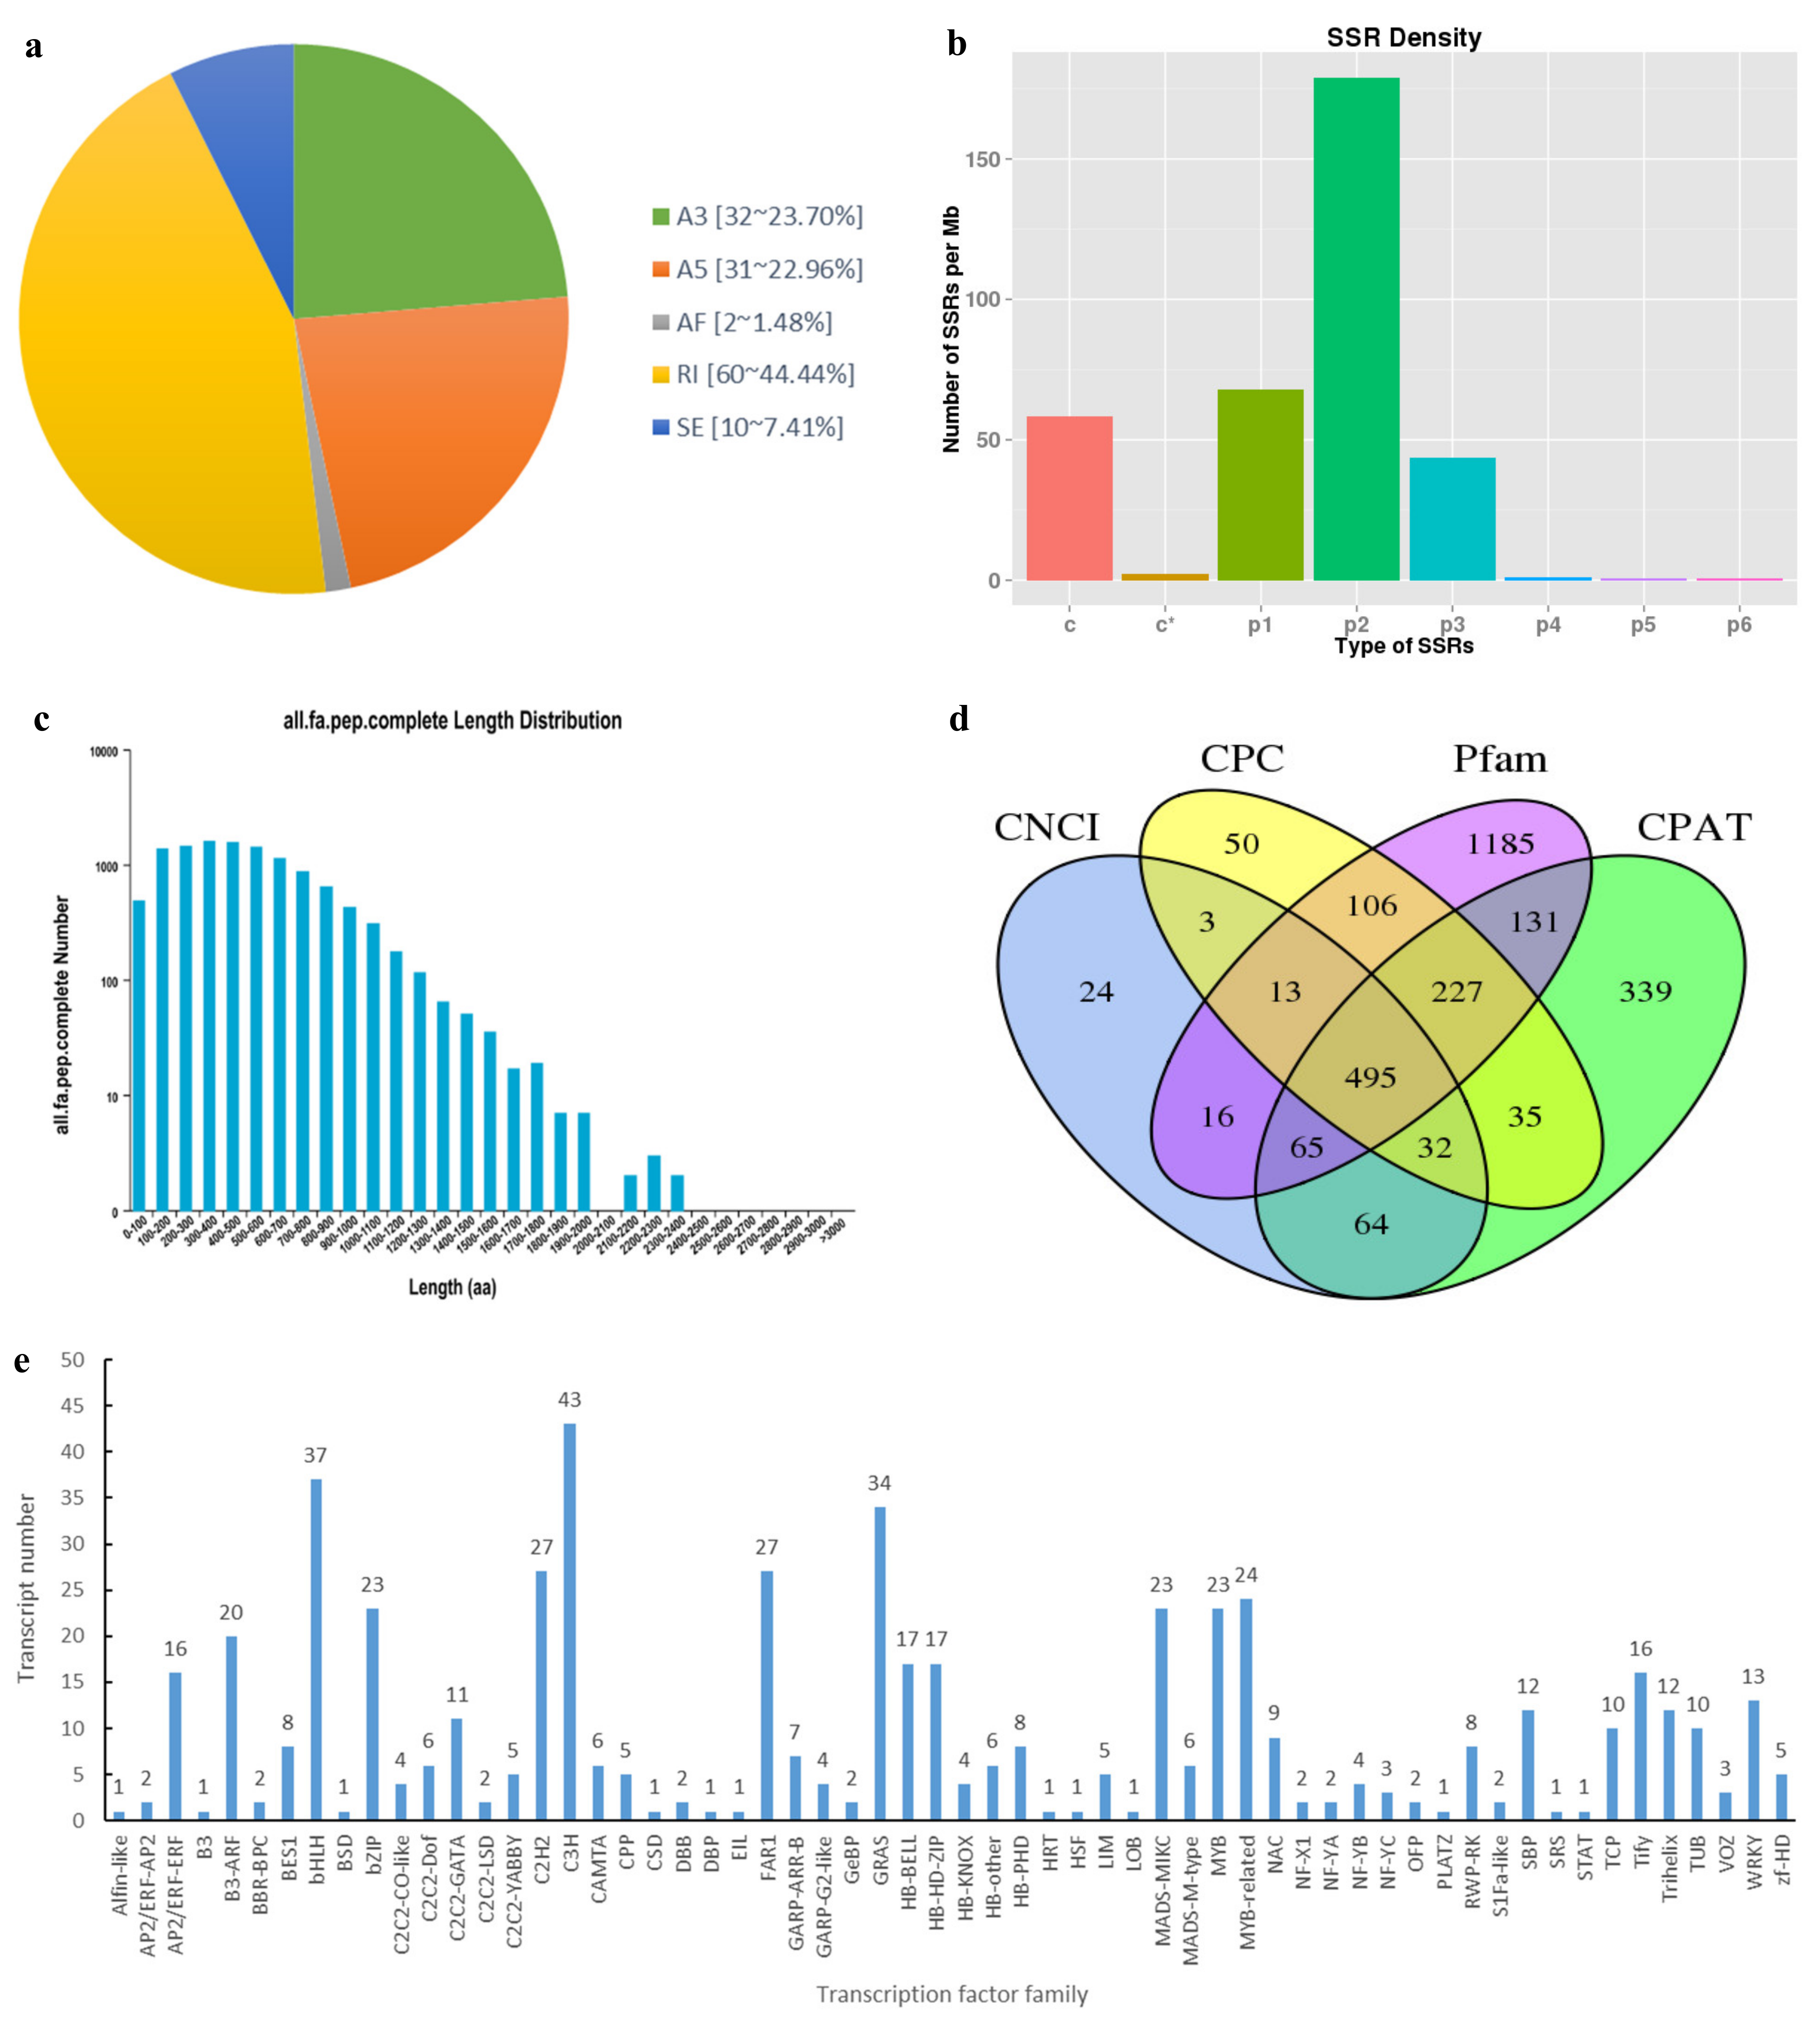
3.3. Characterization of Transcript Structure

One of the most important advantages of SMRT sequencing is its ability to identify AS events. In total, 135 AS events of 5 types were identified. Among these events, the quantities and percentages of retained introns (60, 44.44%), alternative 3′ splice sites (32, 23.70%), and alternative 5′ splice sites (31, 22.96%) were notably higher compared to skipped exons (10, 7.41%) and alternative first exon (2, 1.48%) events (Figure 4a).
Transcripts were subjected to SSR analysis via MISA software, and a total of 10,600 SSRs, including 8 SSR types, were detected. The types of SSR identified include mononucleotide, dinucleotide, trinucleotide, tetranucleotide, pentanucleotide, hexanucleotide, compound SSR, and compound SSR with overlapping positions. Variations in density distribution were observed across different SSR types, with dinucleotide (179.12/Mb) exhibiting the highest distribution density, followed by mononucleotide (67.85/Mb). Pentanucleotide (0.67/Mb) had the lowest distribution density among the identified SSR types (Figure 4b).
All new transcripts were predicted for protein sequence and CDS using TransDecoder software, and a total of 14,143 open reading frames (ORFs) were identified, among which 11,744 were complete ORFs. In the protein sequence encoded by the complete ORFs, 300~400 amino acids were most abundant, accounting for 13.56% of the protein sequence (Figure 4c).
Based on the prediction of CPC, CNCI, CPAT, and Pfam, a total of 2785 transcripts were identified as putative non-coding RNAs (Figure 4d). Among these, 495 candidates, which were identified across all four prediction results, were believed to be lncRNAs. Furthermore, 402 lncRNAs were predicted to have target mRNAs. Particularly, transcript/22027 had 7484 target mRNAs, which was the largest number of target mRNAs attributed to any lncRNA.
By predicting non-redundant transcripts using iTAK software, 551 transcripts were predicted to be TFs. The TFs were classified into 60 families, among which the most abundant type identified was C3H (43 transcripts), followed by bHLH (37 transcripts) and GRAS (34 transcripts), and Alfin-like, B3, BSD, CSD, DBP, EIL, HRT, HSF, LOB, PLATZ, SRS, and STAT were one matched transcript (Figure 4e).

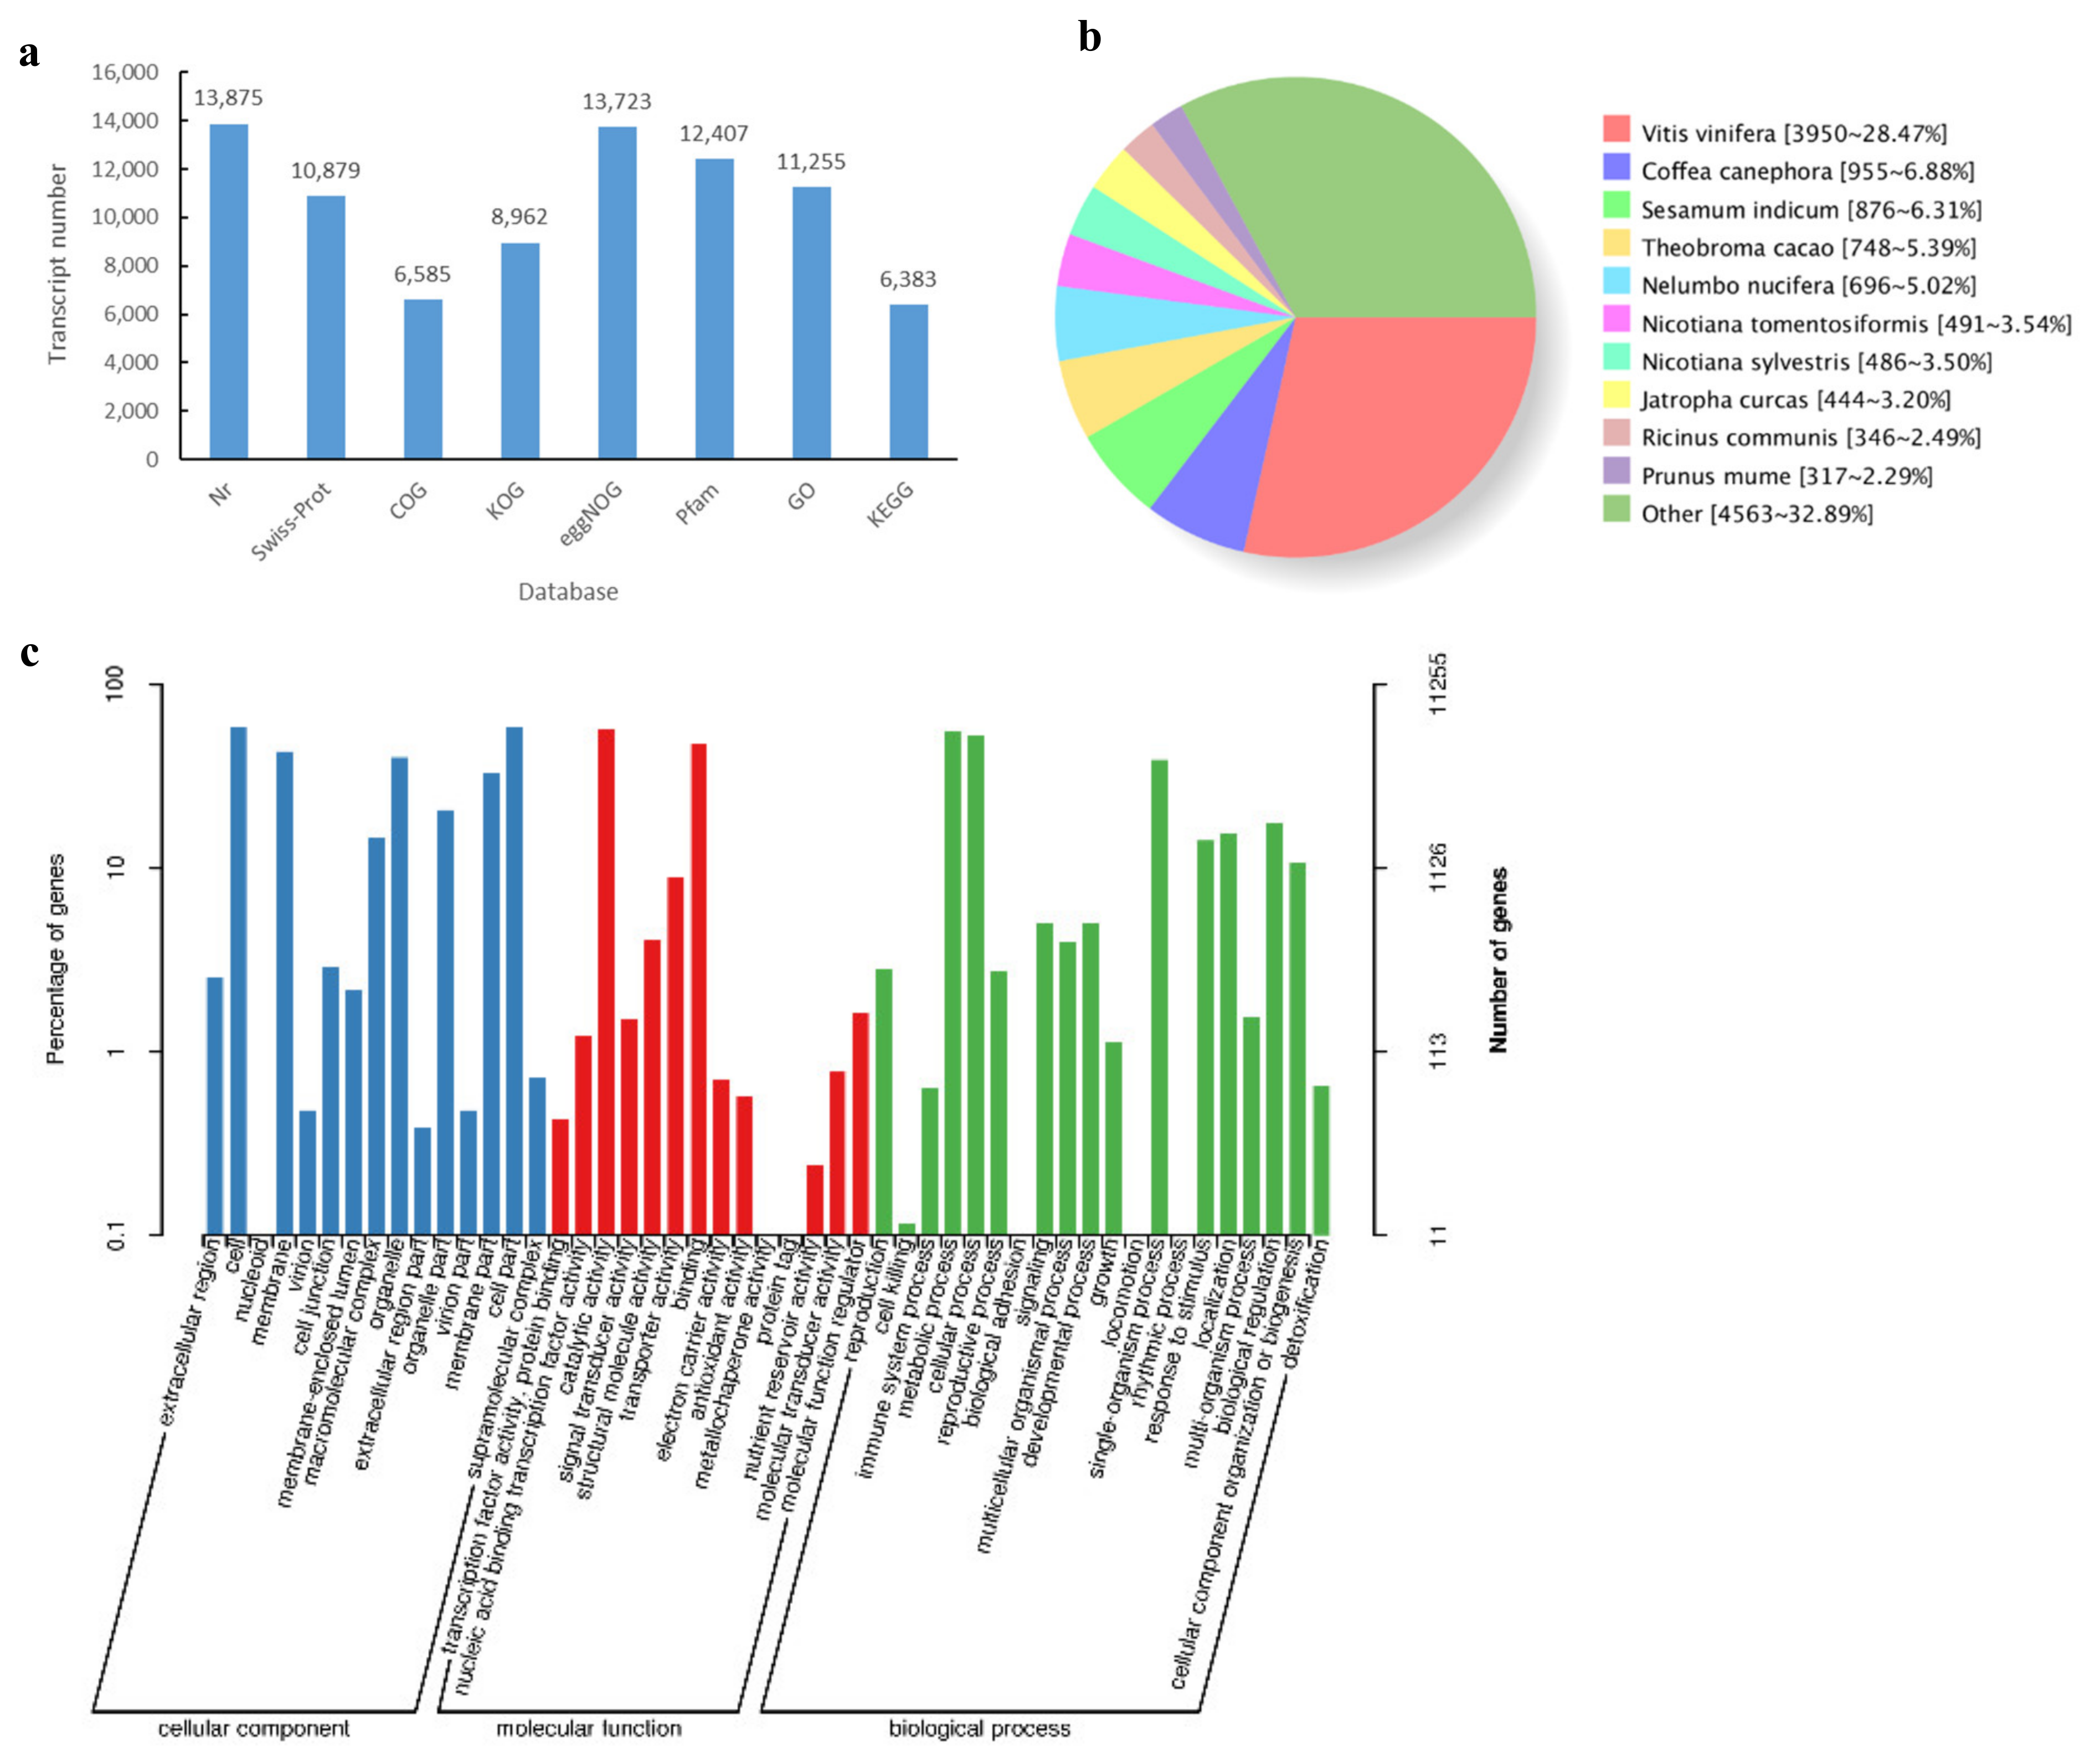
3.4. Functional Annotation of Transcripts

To obtain functional annotation information, the transcripts were subjected to alignment. In general, 13,919 transcripts of 14,660 non-redundant transcripts were annotated using BLAST on several databases, with 13,875, 10,879, 6585, 8962, 13,723, 12,407, 11,255, and 6383 transcripts annotated in Nr, Swiss-Prot, COG, KOG, eggNOG, Pfam, GO, and KEGG, respectively (Figure 5a). Nr sequence alignment showed that 28.47% of sequences could be aligned to Vitis vinifera, followed by Coffea canephora at 6.88% and Sesamum indicum at 6.31% (Figure 5b). In addition, 11,255 transcripts were annotated using the GO database and were classified into cellular component, molecular function, and biological process. Transcripts involved in cell (6551 transcripts), cell part (6546 transcripts), membrane (4873 transcripts), and organelle (4532 transcripts) were highly represented in cellular component. Catalytic activity (6366 transcripts) was the most abundant category within molecular function, followed by binding (5336 transcripts). In biological process, metabolic process (6194 transcripts) was the most prominent category, followed by cellular process (5999 transcripts) and single-organism process (4408 transcripts) (Figure 5c).

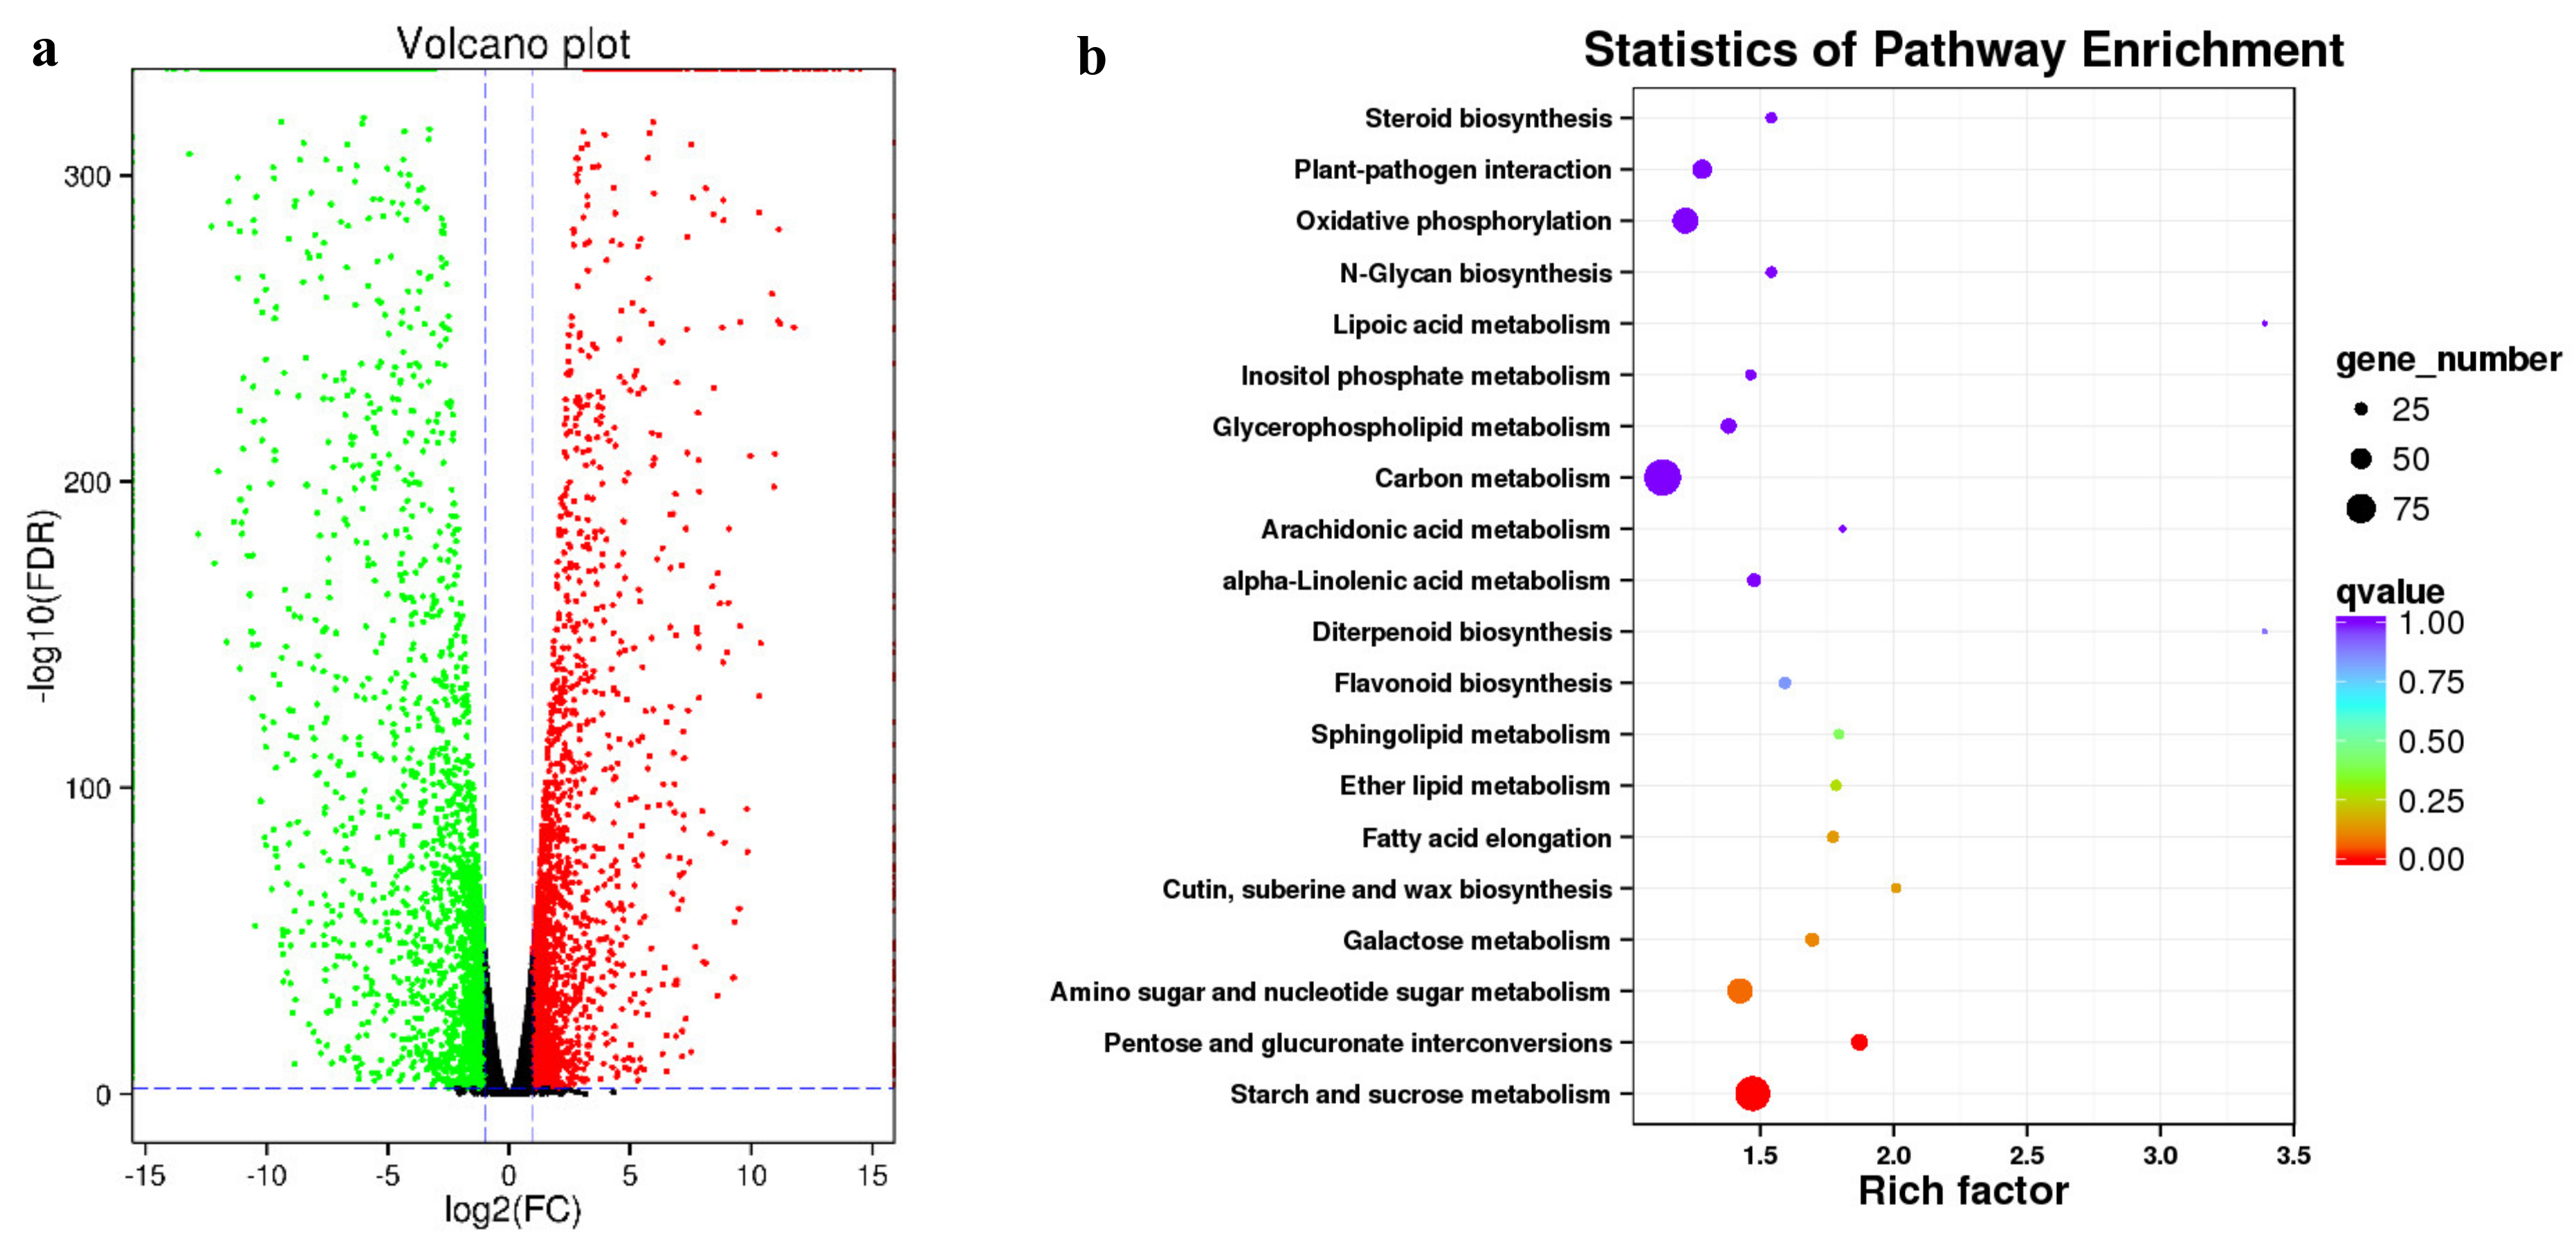
3.5. Identification and Enrichment of DEGs

For Illumina sequencing, 24,159,942~30,609,347 reads were obtained, and more than 68% of the sequences were mapped to the SMRT sequencing transcripts (Table 2). Pearson’s correlation coefficient showed that the correlation values between the three replicates ranged from 0.991 to 0.999 (Figure 6), indicating a perfect positive correlation and that the sequencing results could be used for DEG analysis. The DEGs between R. dauricum var. albiflorum and R. dauricum were characterized using DESeq with FDR < 0.01 and |log2(fold change)| ≥ 1. In total, 4376 DEGs were identified, including 1975 up-regulated genes and 2401 down-regulated genes in R. dauricum var. albiflorum relative to R. dauricum (Figure 7a).
In order to understand the role of DEGs in the formation of flower color, cellular component, molecular function, and biological process were classified using the GO classification system, and a total of 597 GO terms were significantly enriched. In cellular component, 70 GO terms were significantly enriched in DEGs, such as the integral component of membrane (GO:0016021), apoplast (GO:0048046), and trans-Golgi network (GO:0005802). In molecular function, 228 GO terms—such as protein serine/threonine kinase activity (GO:0004674); oxidoreductase activity, acting on the CH-OH group of donors, NAD or NADP as acceptor (GO:0016616); and oxidoreductase activity, acting on paired donors, with the incorporation or reduction of molecular oxygen, NAD(P)H as one donor, and the incorporation of one atom of oxygen (GO:0016709)—were found to be enriched. In biological process, 299 GO terms, such as oxidation–reduction process (GO:0055114), flavonoid glucuronidation (GO:0052696), and glycolytic process (GO:0006096), were identified to be enriched in DEGs. The KEGG database was used to examine the DEG-associated pathways, and a total of 119 pathways were enriched. The top 20 enrichment pathways of annotated DEGs across the comparisons of R. dauricum var. albiflorum and R. dauricum are shown in Figure 7b. Starch and sucrose metabolism (ko00500) and pentose and glucuronate interconversions (ko00040) were significantly enriched for DEGs in the KEGG pathway.

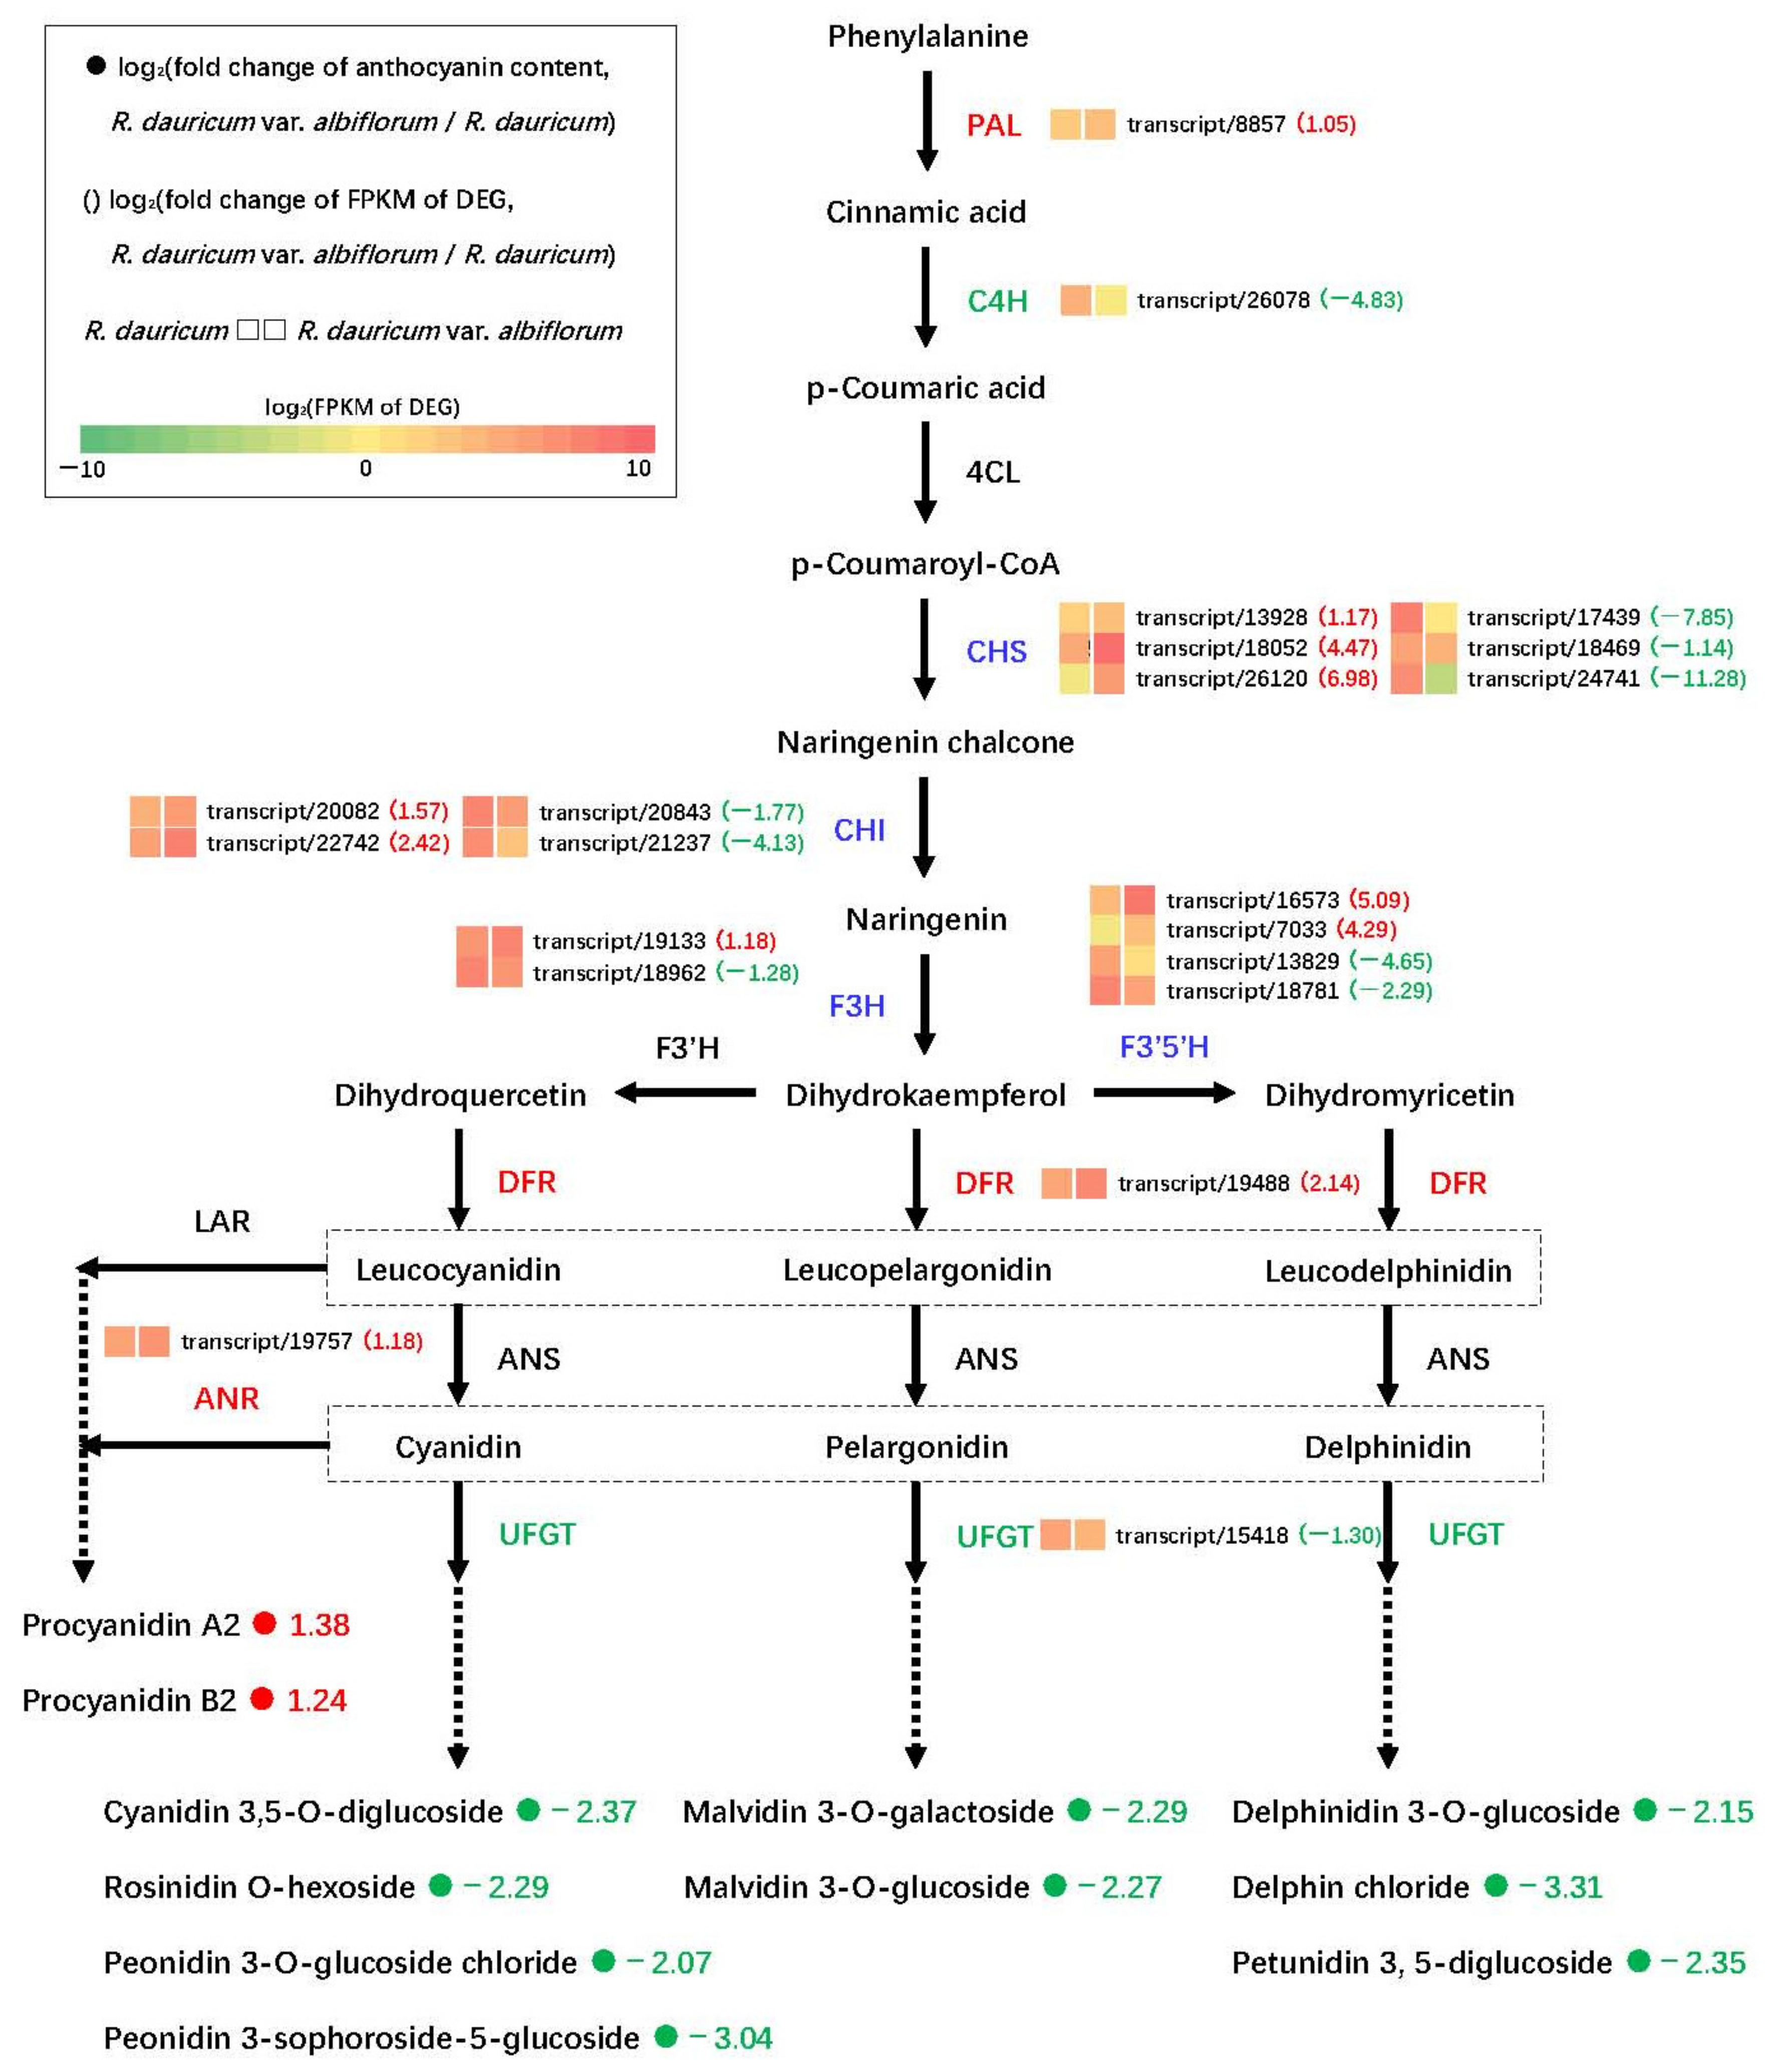
3.6. DEGs Related to Flower Color

The structural genes that participate in anthocyanidin and proanthocyanidin biosynthesis were examined to explore the flower coloration mechanisms. A total of 21 DEGs encoding nine enzymes had significant variation in expression levels between R. dauricum var. albiflorum and R. dauricum (Figure 8). DEGs were annotated as PAL (transcript/8857), C4H (transcript/26078), CHS (transcript/13928, transcript/18052, transcript/26120, transcript/17439, transcript/18469, and transcript/24741), CHI (transcript/20082, transcript/22742, transcript/20843, and transcript/21237), F3H (transcript/19133 and transcript/18962), F3′5′H (transcript/16573, transcript/7033, transcript/13829, and transcript/18781), DFR (transcript/19488), ANR (transcript/19757) and UFGT (transcript/15418). Among these genes, PAL, DFR, and ANR were up-regulated, and C4H and UFGT were down-regulated in R. dauricum var. albiflorum relative to R. dauricum. CHS, CHI, F3H, and F3′5′H were all mixed-regulated, that is, some transcripts were up-regulated and some transcripts were down-regulated. Moreover, ANR was 2.26-fold up-regulated, providing an explanation for the higher accumulation of procyanidin A2 and procyanidin B2 in R. dauricum var. albiflorum. Simultaneously, UFGT showed 2.46-fold down-regulation, which also supports the significantly lower accumulation of nine anthocyanins in R. dauricum var. albiflorum compared to R. dauricum.
In the anthocyanidin biosynthesis pathway, the expression of structural genes is regulated not only by DNA sequence variations but also by some TFs, such as MYB, bHLH, and WD40. In this experiment, 47 MYBs and 37 bHLH TFs were detected, and 15 MYBs and 10 bHLHs were differentially expressed between R. dauricum var. albiflorum and R. dauricum. Among these TFs, eight MYBs and five bHLHs were up-regulated, and seven MYBs and five bHLHs were down-regulated in R. dauricum var. albiflorum relative to R. dauricum (Table 3).
qRT-PCR was employed to test the reliability of RNA-seq. The relative expression results from qRT-PCR of these selected DEGs were generally consistent with the FPKM obtained through RNA-seq (Figure 9a). In addition, a significantly positive correlation (r = 0.767; p < 0.01; n = 15) was found between the results of RNA-Seq and q-PCR for these genes (Figure 9b). The results validated the relevance of RNA-Seq and qRT-PCR showed good consistency for both up- and down-regulated gene expression.

4. Discussion

4.1. Anthocyanin Identification in R. dauricum var. albiflorum

The genus Rhododendron contains brightly colored flowers and is of great use in horticulture [34]. Anthocyanins are the main pigments in Rhododendron, and their quantities determine the petal color ranging from white to blue [35]. Cyanidin, pelargonidin, delphinidin, peonidin, malvidin, and petunidin are the six common anthocyanidins in plants. Among them, cyanidin and peonidin derivatives contribute to a purplish-red color; delphinidin, petunidin, and malvidin derivatives result in a bluish-purple color; and pelargonidin derivatives result in a brick-red color [36]. The pink flower of R. obtusum is attributable to higher cyanidin, peonidin, and pelargonidin contents compared to white flowers [37]. The difference in color among violet, pink, and white flowers of R. pulchrum is caused by the presence or absence of delphinidin, malvidin, cyanidin, peonidin, and proanthocyanidin [38]. In this study, metabolomes of white and purple flowers were used to elucidate the differential anthocyanin between R. dauricum var. albiflorum and R. dauricum. As expected, R. dauricum var. albiflorum contained less anthocyanins and more proanthocyanidins. The results showed that a decrease in malvidin-, delphinidin-, cyanidin-, peonidin-, and petunidin-based anthocyanins, especially delphin chloride and peonidin 3-sophoroside-5-glucoside, and an increase in procyanidin A2 and procyanidin B2 are mainly responsible for the white flower of R. dauricum var. albiflorum.

4.2. Anthocyanin Biosynthesis Responsible for White Flower of R. dauricum var. albiflorum

Metabolites are the final products of the cell biological regulation process, and the combination of transcriptomic and metabolomic techniques provides a powerful approach to identifying genes regulating the determination of pigmentation in plants [39]. Anthocyanins are the final products of the flavonoid biosynthetic pathways, and the pathway from phenylalanine to anthocyanin is transcriptionally changed in R. dauricum var. albiflorum, which might explain the absence of anthocyanin and the presence of proanthocyanidin accumulation observed in R. dauricum var. albiflorum. Specifically, our research showed 21 DEGs between R. dauricum var. albiflorum and R. dauricum in this pathway, such as PAL, C4H, CHS, CHI, F3H, F3′5′H, DFR, ANR, and UFGT. Similar findings were also observed in comparisons between white flowers and violet and pink flowers in R. pulchrum [40], as well as between white flowers and yellow flowers in R. liliiflorum [41].
It is generally known that PAL is the first enzyme in anthocyanin biosynthesis, which can catalyze p-coumaroyl-CoA formation from phenylalanine together with C4H and 4CL [42]. PAL and C4H genes showed differential expression in R. dauricum var. albiflorum, suggesting that the enzymes they encode may be a key factor for anthocyanin biosynthesis. CHS is the core enzyme in the pathway of anthocyanin biosynthesis. CHS and CHI catalyze naringenin formation from p-coumaroyl-CoA, which is the primary precursor for flavonoids [43]. The high expression of CHS and CHI might help the formation of chalcone and naringenin, and has been significantly positively correlated with anthocyanin biosynthesis in some plants, such as R. sanguineum [19] and Acer pseudosieboldianum [44]. F3H, F3′H, and F3′5′H, as members of the cytochrome P450 superfamily, are critical enzymes for the determination of various anthocyanins [45]. Research on Phalaenopsis amabilis reported that changes in F3H gene expression could effectively modulate anthocyanin biosynthesis [46]. F3′5′H is mainly regulated in delphinidin and petunidin derivatives in Gossypium hirsutum [47]. Our study found that CHS, CHI, F3H, and F3′5′H genes were mixed-regulated, with three CHS genes, two CHI genes, one F3H gene, and two F3′5′H genes that were up-regulated and three CHS genes and two CHI genes that were down-regulated. This indicates that CHS, CHI, F3H, and F3′5′H were significantly changed in R. dauricum var. albiflorum, leading to the down-regulation of anthocyanins and the up-regulation of proanthocyanidins. DFR is the key enzyme at branch nodes that catalyzes the conversion of dihydroflavonol to the corresponding colorless leucoanthocyanidins [48]. In R. dauricum var. albiflorum, only one DFR gene was identified, which could generate leucocyanidin, leucopelargonidin, and leucodelphinidin from dihydroquercetin, dihydrokaempferol, and dihydromyricetin, respectively. It is possible that the DFR gene played an important role in anthocyanin and proanthocyanidin biosynthesis.
To generate various anthocyanins with different colors, anthocyanins must be glycosylated, methylated, and acylated in specific cellular environments [49]. UDP-glucose: flavonoid 3-O-glucosyltransferase (UFGT) is mainly responsible for transforming unstable anthocyanins into stable anthocyanins [50]. UFGT gene expression is associated with anthocyanin accumulation in some plants. For example, anthocyanin accumulation is positively correlated with UFGT expression in Clematis tientaiensis [51]. The repression of UFGT in Iris bulleyana leads to a change in their flower color from blue to white [52]. As a branch of the anthocyanin biosynthesis pathway, proanthocyanidin begins with the reduction of leucoanthocyanidin and anthocyanidin, which is catalyzed by leucoanthocyanidin reductase (LAR) and anthocyanidin reductase (ANR), respectively, while high levels of proanthocyanidins inhibit anthocyanin production [53]. It has been proven that ANR can convert anthocyanin into epicatechin and, finally, promote proanthocyanidin biosynthesis [54]. In flavonoid biosynthesis of Arabidopsis thaliana, a lack of anthocyanins and an abundance of proanthocyanidins are caused by the high expression of ANR genes [55]. Our results showed that UFGT expression was suppressed in R. dauricum var. albiflorum, which may explain the down-regulation of nine types of anthocyanins in R. dauricum var. albiflorum when compared to R. dauricum. On the other hand, the expression level of ANR was 2.26-fold higher in R. dauricum var. albiflorum compared to R. dauricum, which explains the up-regulation of procyanidin A2 and procyanidin B2 in white flowers. In summary, a total of 21 DEGs involved in PAL, C4H, CHS, CHI, F3H, F3′5′H, DFR, ANR, and UFGT were detected in the anthocyanin biosynthesis pathway, which play key roles in the accumulation of anthocyanins and proanthocyanidins.

4.3. TFs Related to Anthocyanin Biosynthesis

Apart from structural genes, anthocyanin biosynthesis is also regulated by several TFs, in which MYB, bHLH, and WD repeats form the MBW ternary complex to regulate transcription levels of the structural genes that participate in the anthocyanin and proanthocyanidin biosynthesis pathways [56]. MYB plays a critical role in MBW complexes for its tissue-specific expression and binding to specific DNA sequences [57]. Some studies have shown that MYB can enhance or inhibit anthocyanin biosynthesis. It was found that the expression of two MYBs exhibited a similar trend to anthocyanin content, and the expression of one MYB showed the opposite trend in Camellia japonica petals [58]. Similar results were also found in Pennisetum purpureum leaves [59]. bHLH can interact with MYB from various subgroups and form the MBW complex with WD repeat [60]. The overexpression of three bHLHs produced red bark with regulated anthocyanin and proanthocyanidin biosynthesis in Cinnamomum camphora [61]. In our research, a total of 551 TFs were identified by analyzing the transcriptome annotation results. Based on the expression level of TFs, fifteen MYBs and ten bHLHs were found to be differentially expressed between R. dauricum var. albiflorum and R. dauricum. Among these TFs, eight MYBs and five bHLHs positively regulated anthocyanin shortage and proanthocyanidin accumulation, and seven MYBs and five bHLHs negatively regulated anthocyanin shortage and proanthocyanidin accumulation. The above 25 TFs may be involved in the regulation of the expression of structural genes in the anthocyanin biosynthesis pathway, thereby affecting the content of anthocyanins and proanthocyanidins. The specific functions of these TFs remain to be further investigated.

5. Conclusions

In this study, the regulation mechanism of flower color in R. dauricum was first analyzed using metabolome and transcriptome analyses. A decrease in malvidin-, delphinidin-, cyanidin-, peonidin-, and petunidin-based anthocyanins and an increase in procyanidin A2 and procyanidin B2 contributed to the white flower of R. dauricum var. albiflorum. Several genes, especially PAL, C4H, CHS, CHI, F3H, F3′5′H, DFR, ANR, and UFGT, which play important roles in anthocyanin biosynthesis, were differently expressed between R. dauricum var. albiflorum and R. dauricum. Moreover, fifteen MYBs and ten bHLHs were differentially expressed and identified as candidate regulators responsible for the white flower of R. dauricum var. albiflorum. These results provide valuable information and new insights for a better understanding of the variations in azalea flower color, and more work needs to be completed regarding gene functional verification. Consequently, further research in the cloning and transformation of DEGs involved in flower color should be performed based on the present study. Such research should enable the production of new Rhododendron species for ornamental use.

Author Contributions

Conceptualization, H.M. and L.L.; formal analysis, X.J.; funding acquisition, L.L.; investigation, X.J. and Y.Z.; methodology, H.M.; resources, L.L.; supervision, L.L.; writing—original draft, X.J. and Y.Z.; writing—review and editing, H.M. and L.L. All authors have read and agreed to the published version of the manuscript.

Funding

This work was financially supported by a grant from the Science and Technology Research Program of Jilin Provincial Education Department (JJKH20220064KJ) and the Science and Technology Development Program of Jilin Province (20210202124NC).

Data Availability Statement

All the sequencing data were submitted to the National Center for Biotechnology Information (NCBI) Sequence Read Archive (SRA) database (accession numbers: PRJNA977980 and PRJNA978090).

Acknowledgments

We thank Xinshan Nursery Stock Cooperative for the support related to the plant material and greenhouse facilities.

Conflicts of Interest

The authors declare no conflict of interest.

References

  1. Kishi-Kaboshi, M.; Aida, R.; Sasaki, K. Genome engineering in ornamental plants: Current status and future prospects. Plant Physiol. Biochem. 2018, 131, 47–52. [Google Scholar] [CrossRef] [PubMed]
  2. Mekapogu, M.; Vasamsetti, B.M.K.; Kwon, O.K.; Ahn, M.S.; Lim, S.H.; Jung, J.A. Anthocyanins in floral colors: Biosynthesis and regulation in Chrysanthemum flowers. Int. J. Mol. Sci. 2020, 21, 6537. [Google Scholar] [CrossRef]
  3. Tanaka, Y.; Sasaki, N.; Ohmiya, A. Biosynthesis of plant pigments: Anthocyanins, betalains and carotenoids. Plant J. 2008, 54, 733–749. [Google Scholar] [CrossRef]
  4. Jiao, F.C.; Zhao, L.; Wu, X.F.; Song, Z.B.; Li, Y.P. Metabolome and transcriptome analyses of the molecular mechanisms of flower color mutation in tobacco. BMC Genom. 2020, 21, 611. [Google Scholar] [CrossRef]
  5. Liu, W.X.; Feng, Y.; Yu, S.H.; Fan, Z.Q.; Li, X.L.; Li, J.Y.; Yin, H.F. The flavonoid biosynthesis network in plants. Int. J. Mol. Sci. 2021, 22, 12824. [Google Scholar] [CrossRef]
  6. Petroni, K.; Tonelli, C. Recent advances on the regulation of anthocyanin synthesis in reproductive organs. Plant Sci. 2011, 181, 219–229. [Google Scholar] [CrossRef]
  7. LaFountain, A.M.; Yuan, Y.W. Repressors of anthocyanin biosynthesis. New Phytol. 2021, 231, 933–949. [Google Scholar] [CrossRef]
  8. Saigo, T.; Wang, T.; Watanabe, M.; Tohge, T. Diversity of anthocyanin and proanthocyanin biosynthesis in land plants. Curr. Opin. Plant Biol. 2020, 55, 93–99. [Google Scholar] [CrossRef]
  9. Sinopoli, A.; Calogero, G.; Bartolotta, A. Computational aspects of anthocyanidins and anthocyanins: A review. Food Chem. 2019, 297, 124898. [Google Scholar] [CrossRef]
  10. Guo, X.L.; Shakeel, M.; Wang, D.L.; Qu, C.P.; Yang, S.M.; Ahmad, S.; Song, Z.J. Metabolome and transcriptome profiling unveil the mechanisms of light-induced anthocyanin synthesis in rabbiteye blueberry (Vaccinium ashei: Reade). BMC Plant Biol. 2022, 22, 223. [Google Scholar] [CrossRef]
  11. Amarasinghe, S.L.; Su, S.A.; Dong, X.Y.; Zappia, L.; Ritchie, M.E.; Gouil, Q. Opportunities and challenges in long-read sequencing data analysis. Genome Biol. 2020, 21, 30. [Google Scholar] [CrossRef]
  12. Byrne, A.; Cole, C.; Volden, R.; Vollmers, C. Realizing the potential of full-length transcriptome sequencing. Philos. Trans. Roy. Soc. B 2019, 374, 20190097. [Google Scholar] [CrossRef] [PubMed]
  13. Chen, Z.; Lu, X.Y.; Xuan, Y.; Tang, F.; Wang, J.J.; Shi, D.; Fu, S.L.; Ren, J. Transcriptome analysis based on a combination of sequencing platforms provides insights into leaf pigmentation in Acer rubrum. BMC Plant Biol. 2019, 19, 240. [Google Scholar] [CrossRef] [PubMed]
  14. Rothenberg, D.O.N.; Yang, H.J.; Chen, M.B.; Zhang, W.T.; Zhang, L.Y. Metabolome and transcriptome sequencing analysis reveals anthocyanin metabolism in pink flowers of anthocyanin-rich tea (Camellia sinensis). Molecules 2019, 24, 1064. [Google Scholar] [CrossRef]
  15. Liu, X.W.; Wang, Y.H.; Shen, S.K. Transcriptomic and metabolomic analyses reveal the altitude adaptability and evolution of different-colored flowers in alpine Rhododendron species. Tree Physiol. 2022, 42, 1100–1113. [Google Scholar] [CrossRef]
  16. Wang, S.Z.; Li, Z.L.; Jin, W.B.; Fang, Y.P.; Yang, Q.F.; Xiang, J. Transcriptome analysis and identification of genes associated with flower development in Rhododendron pulchrum Sweet (Ericaceae). Gene 2018, 679, 108–118. [Google Scholar] [CrossRef]
  17. Li, Z.L.; Yang, Q.F.; Dong, X.; Zhu, Y.; Zhao, S.; Zhang, W.Y.; Wang, S.Z. Transcriptome analysis of flower color variation in five Rhododendron species (Ericaceae). Braz. J. Bot. 2021, 44, 685–695. [Google Scholar] [CrossRef]
  18. Nie, S.; Zhao, S.W.; Shi, T.L.; Zhao, W.; Zhang, R.G.; Tian, X.C.; Guo, J.F.; Yan, X.M.; Bao, Y.T.; Li, Z.C.; et al. Gapless genome assembly of azalea and multi-omics investigation into divergence between two species with distinct flower color. Hortic. Res.-Engl. 2023, 10, uhac241. [Google Scholar] [CrossRef]
  19. Ye, L.J.; Möller, M.; Luo, Y.H.; Zou, J.Y.; Zheng, W.; Wang, Y.H.; Liu, J.; Zhu, A.D.; Hu, J.Y.; Li, D.Z.; et al. Differential expressions of anthocyanin synthesis genes underlie flower color divergence in a sympatric Rhododendron sanguineum complex. BMC Plant Biol. 2021, 21, 204. [Google Scholar] [CrossRef]
  20. Polezhaeva, M.A.; Pimenova, E.A.; Tikhonova, N.A.; Korchagina, O.S. Plastid DNA diversity and genetic divergence within Rhododendron dauricum s.l. (R. dauricum s.s., R. ledebourii, R. sichotense and R. mucronulatum; Ericaceae). Plant Syst. Evol. 2018, 304, 763–774. [Google Scholar] [CrossRef]
  21. Peng, X.; Zhang, H.Q.; Yuan, X.H.; Chen, Z.B.; Gao, J.B.; Teng, Y.; Yao, G.M. Grayanane diterpenoids from the leaves of Rhododendron dauricum. Biochem. Syst. Ecol. 2020, 89, 104009. [Google Scholar] [CrossRef]
  22. Wang, D.; Yang, Y.; Li, F.Y.; Zhou, S.; Liu, G.L.; Yang, J.; Ye, W.B.; Wang, L. ‘Ao Xue’: A new Rhododendron cultivar. HortScience 2022, 57, 330–331. [Google Scholar] [CrossRef]
  23. Wang, Z.R.; Cui, Y.Y.; Vainstein, A.; Chen, S.W.; Ma, H.Q. Regulation of fig (Ficus carica L.) fruit color: Metabolomic and transcriptomic analyses of the flavonoid biosynthetic pathway. Front. Plant Sci. 2017, 8, 1990. [Google Scholar] [CrossRef] [PubMed]
  24. Kitteringham, N.R.; Jenkins, R.E.; Lane, C.S.; Elliott, V.L.; Park, B.K. Multiple reaction monitoring for quantitative biomarker analysis in proteomics and metabolomics. J. Chromatogr. B 2009, 877, 1229–1239. [Google Scholar] [CrossRef]
  25. Zhou, C.B.; Mei, X.; Rothenberg, D.O.N.; Yang, Z.B.; Zhang, W.T.; Wan, S.H.; Yang, H.J.; Zhang, L.Y. Metabolome and transcriptome analysis reveals putative genes involved in anthocyanin accumulation and coloration in white and pink tea (Camellia sinensis) flower. Molecules 2020, 25, 190. [Google Scholar] [CrossRef]
  26. Kanehisa, M.; Goto, S.; Sato, Y.; Kawashima, M.; Furumichi, M.; Tanabe, M. Data, information, knowledge and principle: Back to metabolism in KEGG. Nucleic Acids Res. 2014, 42, D199–D205. [Google Scholar] [CrossRef]
  27. Li, W.Z.; Godzik, A. Cd-hit: A fast program for clustering and comparing large sets of protein or nucleotide sequences. Bioinformatics 2006, 22, 1658–1659. [Google Scholar] [CrossRef]
  28. Liu, X.X.; Mei, W.B.; Soltis, P.S.; Soltis, D.E.; Barbazuk, W.B. Detecting alternatively spliced transcript isoforms from single-molecule long-read sequences without a reference genome. Mol. Ecol. Resour. 2017, 17, 1243–1256. [Google Scholar] [CrossRef]
  29. Li, J.W.; Ma, W.; Zeng, P.; Wang, J.Y.; Geng, B.; Yang, J.C.; Cui, Q.H. LncTar: A tool for predicting the RNA targets of long noncoding RNAs. Brief. Bioinform. 2015, 16, 806–812. [Google Scholar] [CrossRef]
  30. Zheng, Y.; Jiao, C.; Sun, H.H.; Rosli, H.G.; Pombo, M.A.; Zhang, P.F.; Banf, M.; Dai, X.B.; Martin, G.B.; Giovannoni, J.J.; et al. iTAK: A program for genome-wide prediction and classification of plant transcription factors, transcriptional regulators, and protein kinases. Mol. Plant 2016, 9, 1667–1670. [Google Scholar] [CrossRef]
  31. Li, B.; Dewey, C.N. RSEM: Accurate transcript quantification from RNA-Seq data with or without a reference genome. BMC Bioinform. 2011, 12, 323. [Google Scholar] [CrossRef] [PubMed]
  32. Anders, S.; Huber, W. Differential expression analysis for sequence count data. Genome Biol. 2010, 11, R106. [Google Scholar] [CrossRef] [PubMed]
  33. Ye, J.; Zhang, Y.; Cui, H.H.; Liu, J.W.; Wu, Y.Q.; Cheng, Y.; Xu, H.X.; Huang, X.X.; Li, S.T.; Zhou, A.; et al. WEGO 2.0: A web tool for analyzing and plotting GO annotations, 2018 update. Nucleic Acids Res. 2018, 46, W71–W75. [Google Scholar] [CrossRef]
  34. Du, H.; Lai, L.M.; Wang, F.; Sun, W.B.; Zhang, L.H.; Li, X.H.; Wang, L.S.; Jiang, L.H.; Zheng, Y.R. Characterization of flower coloration in 30 Rhododendron species via anthocyanin and flavonol identification and quantitative traits. Plant Biol. 2018, 20, 121–129. [Google Scholar] [CrossRef]
  35. Liu, L.; Zhang, L.Y.; Wang, S.L.; Niu, X.Y. Analysis of anthocyanins and flavonols in petals of 10 Rhododendron species from the Sygera Mountains in Southeast Tibet. Plant Physiol. Bioch. 2016, 104, 250–256. [Google Scholar] [CrossRef] [PubMed]
  36. Zhang, Y.; Butelli, E.; Martin, C. Engineering anthocyanin biosynthesis in plants. Curr. Opin. Plant Biol. 2014, 19, 81–90. [Google Scholar] [CrossRef]
  37. Sun, X.B.; He, L.S.; Guo, Z.H.; Xiao, Z.; Su, J.L.; Liu, X.Q.; Zhou, H.M.; Li, C.; Gao, H.D. Comparative transcriptome analyses reveal genes related to pigmentation in the petals of a flower color variation cultivar of Rhododendron obtusum. Mol. Biol. Rep. 2022, 49, 2641–2653. [Google Scholar] [CrossRef]
  38. Wang, S.Z.; Huang, S.Y.; Yang, J.; Li, Z.L.; Zhang, M.J.; Fang, Y.P.; Yang, Q.F.; Jin, W.B. Metabolite profiling of violet, white and pink flowers revealing flavonoids composition patterns in Rhododendron pulchrum Sweet. J. Biosci. 2021, 46, 3. [Google Scholar] [CrossRef]
  39. Wang, M.; Chen, L.; Liang, Z.J.; He, X.M.; Liu, W.R.; Jiang, B.; Yan, J.Q.; Sun, P.Y.; Cao, Z.Q.; Peng, Q.W.; et al. Metabolome and transcriptome analyses reveal chlorophyll and anthocyanin metabolism pathway associated with cucumber fruit skin color. BMC Plant Biol. 2020, 20, 386. [Google Scholar] [CrossRef]
  40. Xia, X.; Gong, R.; Zhang, C.Y. Integrative analysis of transcriptome and metabolome reveals flavonoid biosynthesis regulation in Rhododendron pulchrum petals. BMC Plant Biol. 2022, 22, 401. [Google Scholar] [CrossRef]
  41. Zhang, H.; Chen, M.F.; Wang, X.L.; Dai, J.; Zhang, X.; Zhang, Z.D.; Zhang, X.M.; Tang, M.; Tang, J.; Gong, J.Y.; et al. Transcriptome analysis of Rhododendron liliiflorum H. Lév. flower colour differences. Horticulturae 2023, 9, 82. [Google Scholar] [CrossRef]
  42. Chen, X.J.; Wang, P.J.; Gu, M.Y.; Hou, B.H.; Zhang, C.R.; Zheng, Y.C.; Sun, Y.; Jin, S.; Ye, N.X. Identification of PAL genes related to anthocyanin synthesis in tea plants and its correlation with anthocyanin content. Hortic. Plant J. 2022, 8, 381–394. [Google Scholar] [CrossRef]
  43. Lu, J.J.; Zhang, Q.; Lang, L.X.; Jiang, C.; Wang, X.F.; Sun, H.M. Integrated metabolome and transcriptome analysis of the anthocyanin biosynthetic pathway in relation to color mutation in miniature roses. BMC Plant Biol. 2021, 21, 257. [Google Scholar] [CrossRef] [PubMed]
  44. Gao, Y.F.; Zhao, D.H.; Zhang, J.Q.; Chen, J.S.; Li, J.L.; Weng, Z.; Rong, L.P. De novo transcriptome sequencing and anthocyanin metabolite analysis reveals leaf color of Acer pseudosieboldianum in autumn. BMC Genom. 2021, 22, 383. [Google Scholar] [CrossRef]
  45. Vikhorev, A.V.; Strygina, K.V.; Khlestkina, E.K. Duplicated flavonoid 3′-hydroxylase and flavonoid 3′, 5′-hydroxylase genes in barley genome. PeerJ 2019, 7, e6266. [Google Scholar] [CrossRef] [PubMed]
  46. Meng, X.Q.; Li, G.; Gu, L.Y.; Sun, Y.; Li, Z.Y.; Liu, J.R.; Wu, X.Q.; Dong, T.T.; Zhu, M.K. Comparative metabolomic and transcriptome analysis reveal distinct flavonoid biosynthesis regulation between petals of white and purple Phalaenopsis amabilis. J. Plant Growth Regul. 2020, 39, 823–840. [Google Scholar] [CrossRef]
  47. Shao, D.N.; Liang, Q.; Wang, X.F.; Zhu, Q.H.; Liu, F.; Li, Y.J.; Zhang, X.Y.; Yang, Y.L.; Sun, J.; Xue, F. Comparative metabolome and transcriptome analysis of anthocyanin biosynthesis in white and pink petals of cotton (Gossypium hirsutum L.). Int. J. Mol. Sci. 2022, 23, 10137. [Google Scholar] [CrossRef] [PubMed]
  48. Sun, W.; Zhou, N.N.; Wang, Y.H.; Sun, S.Y.; Zhang, Y.; Ju, Z.G.; Yi, Y. Characterization and functional analysis of RdDFR1 regulation on flower color formation in Rhododendron delavayi. Plant Physiol. Biochem. 2021, 169, 203–210. [Google Scholar] [CrossRef]
  49. Jaakola, L. New insights into the regulation of anthocyanin biosynthesis in fruits. Trends Plant Sci. 2013, 18, 477–483. [Google Scholar] [CrossRef]
  50. Muhammad, N.; Luo, Z.; Yang, M.; Li, X.S.; Liu, Z.G.; Liu, M.J. The joint role of the late anthocyanin biosynthetic UFGT-encoding genes in the flowers and fruits coloration of horticultural plants. Sci. Hortic. 2022, 301, 111110. [Google Scholar] [CrossRef]
  51. Qian, R.J.; Ye, Y.J.; Hu, Q.D.; Ma, X.H.; Zhang, X.L.; Zheng, J. Metabolomic and transcriptomic analyses reveal new insights into the role of metabolites and genes in modulating flower colour of Clematis tientaiensis. Horticulturae 2023, 9, 14. [Google Scholar] [CrossRef]
  52. Ma, L.L.; Zhang, Y.P.; Cui, G.F.; Duan, Q.; Jia, W.J.; Xu, F.; Du, W.W.; Wang, X.N.; Li, X.; Chen, F.D.; et al. Transcriptome analysis of key genes involved in color variation between blue and white flowers of Iris bulleyana. BioMed Res. Int. 2023, 2023, 7407772. [Google Scholar] [CrossRef] [PubMed]
  53. Li, H.; Tian, J.; Yao, Y.Y.; Zhang, J.; Song, T.T.; Li, K.T.; Yao, Y.C. Identification of leucoanthocyanidin reductase and anthocyanidin reductase genes involved in proanthocyanidin biosynthesis in Malus crabapple plants. Plant Physiol. Biochem. 2019, 139, 141–151. [Google Scholar] [CrossRef] [PubMed]
  54. Han, Y.P.; Vimolmangkang, S.; Soria-Guerra, R.E.; Korban, S.S. Introduction of apple ANR genes into tobacco inhibits expression of both CHI and DFR genes in flowers, leading to loss of anthocyanin. J. Exp. Bot. 2012, 63, 2437–2447. [Google Scholar] [CrossRef]
  55. Shi, M.F.; Xie, D.Y. Biosynthesis and metabolic engineering of anthocyanins in Arabidopsis thaliana. Recent. Pat. Biotechnol. 2014, 8, 47–60. [Google Scholar] [CrossRef]
  56. Qiu, L.K.; Zheng, T.C.; Liu, W.C.; Zhuo, X.K.; Li, P.; Wang, J.; Cheng, T.R.; Zhang, Q.X. Integration of transcriptome and metabolome reveals the formation mechanism of red stem in Prunus mume. Front. Plant Sci. 2022, 13, 884883. [Google Scholar] [CrossRef]
  57. Long, F.F.; Wu, H.R.; Li, H.E.; Zuo, W.W.; Ao, Q. Genome-wide analysis of MYB transcription factors and screening of MYBs involved in the red color formation in Rhododendron delavayi. Int. J. Mol. Sci. 2023, 24, 4641. [Google Scholar] [CrossRef]
  58. Fu, M.Y.; Yang, X.; Zheng, J.R.; Wang, L.; Yang, X.Y.; Tu, Y.; Ye, J.B.; Zhang, W.W.; Liao, Y.L.; Cheng, S.Y.; et al. Unraveling the regulatory mechanism of color diversity in Camellia japonica petals by integrative transcriptome and metabolome analysis. Front. Plant Sci. 2021, 12, 685136. [Google Scholar] [CrossRef]
  59. Zhou, S.F.; Chen, J.; Lai, Y.S.; Yin, G.H.; Chen, P.L.; Pennerman, K.K.; Yan, H.D.; Wu, B.C.; Zhang, H.; Yi, X.F.; et al. Integrative analysis of metabolome and transcriptome reveals anthocyanins biosynthesis regulation in grass species Pennisetum purpureum. Ind. Crops Prod. 2019, 138, 111470. [Google Scholar] [CrossRef]
  60. Deng, J.; Li, J.J.; Su, M.Y.; Lin, Z.Y.; Chen, L.; Yang, P.F. A bHLH gene NnTT8 of Nelumbo nucifera regulates anthocyanin biosynthesis. Plant Physiol. Biochem. 2021, 158, 518–523. [Google Scholar] [CrossRef]
  61. Zhong, Y.D.; Chen, C.H.; Gong, X.; Luan, X.Y.; Wu, Z.X.; Li, H.H.; Liu, Q.L.; Xu, M.; Yu, F.X. Transcriptome and metabolome analyses reveal a key role of the anthocyanin biosynthetic pathway cascade in the pigmentation of a Cinnamomum camphora red bark mutant (‘Gantong 1’). Ind. Crops Prod. 2022, 175, 114236. [Google Scholar] [CrossRef]
Figure 1. Flowers of R. dauricum var. albiflorum and R. dauricum.
Horticulturae 09 01071 g001
Figure 2. The differences in anthocyanins between R. dauricum var. albiflorum and R. dauricum.
Horticulturae 09 01071 g002
Figure 3. Length distribution of sequences from Pacbio platform. (a) CCS reads; (b) FLNC reads; (c) consensus isoforms.
Horticulturae 09 01071 g003
Figure 4. Overview of transcript structure. (a) Number and percentage of different AS events. A3, A5, AF, RI, and SE represent alternative 3′ splice sites, alternative 5′ splice sites, alternative first exon, retained introns, and skipped exons, respectively; (b) distribution of different SSR types. c, c*, p1, p2, p3, p4, p5, and p6 represent compound SSR, compound SSR with overlapping positions, mononucleotide, dinucleotide, trinucleotide, tetranucleotide, pentanucleotide, and hexanucleotide, respectively; (c) length distribution of protein sequence encoded by the complete ORFs; (d) candidate lncRNAs predicted by CPC, CNCI, CPAT, and Pfam databases; (e) distribution of different TF families.
Horticulturae 09 01071 g004
Figure 5. Overview of transcript functional annotation. (a) Number of transcripts annotated in different databases; (b) number and percentage of transcripts matching species in Nr database; (c) GO classification of transcripts.
Horticulturae 09 01071 g005
Figure 6. Pearson correlation evaluation among six samples from Illumina HiSeq 2500 platform. B1, B2, and B3 represent three biological replicates of R. dauricum var. albiflorum; Z1, Z2, and Z3 represent three biological replicates of R. dauricum.
Horticulturae 09 01071 g006
Figure 7. Comparison and KEGG enrichment of DEGs between R. dauricum var. albiflorum and R. dauricum. (a) Volcano plot showing the DEGs. Red, green, and black correspond to up-regulated, down-regulated, and unchanged genes, respectively; (b) dot plots showing the top 20 KEGG enrichment pathways of the DEGs.
Horticulturae 09 01071 g007
Figure 8. The DEGs in anthocyanidin biosynthesis pathway between R. dauricum var. albiflorum and R. dauricum.
Horticulturae 09 01071 g008
Figure 9. Verification of RNA-Seq using qRT-PCR. (a) Expression of representative genes by comparing RNA-Seq and qRT-PCR; (b) scatter plot showing similar expression patterns between RNA-Seq and qRT-PCR.
Horticulturae 09 01071 g009aHorticulturae 09 01071 g009b
Table 1. Primers used for quantitative real-time PCR verification.
Gene-IDForward Primer (5′-3′)Reverse Primer (5′-3′)
18S rRNAGTAGGCGGTGAATCGGGTTGTGGCGTTCCTTCGTAGATGGTT
α-actinTGACTATGAGCAAGAGCTGGAGACAAAGATGGCTGGAAGAGGAC
Transcript/8857CCATACCCTGCCTCGTTCAATTCGGGCTTTCCTTGC
Transcript/26078GCCGATTCTCAGCATCACCAATTCCTCCACAAACCC
Transcript/13928CCCGATTACTACTTTCGTATCCGTCTATTGCGTGTTTGAG
Transcript/20082TCCGTTGAGTTCTTTAGGGTTCTTGATTACCGCTTT
Transcript/18962TGGATGCGGGTCTGATTTCCAACCTGGTCCTGAAGC
Transcript/18781ATAGAGGGCGGGATGAAAGCTTGTAGGTAAGGCAGGTT
Transcript/19488GTCAAGAGGCTGGTGTTCTCGCCAAATCGTAGATAG
Transcript/19757TTTTAGGTCGTGGGTTAGCAGACTCCCAAATGCTAC
Transcript/15418ACCGTCACTTTCTCCTTCTGACCATAAACGAGACCCAC
Transcript/14301TGCGTTGTCGTGGTTTGAATGCGAGCCCATTTGTTA
Transcript/19510AGACAACAATAGCGACATAATCTTAGCCAATTCTACATC
Transcript/4872TGTGCCAATGGTAGTATGTTTTGTTAATGGGTTAGGG
Transcript/10990CAAGGGTATGGTGGAATCGGAGTAGAGGGCTTATCAA
Transcript/12417GAAAGGGAGTGAGGTTGGATGCCTGAGAAGGAGTAGAG
Transcript/15129GAGACGATGGTCCAGTTCACCCAACCTGCTCATACTCA
Table 2. Summary of Illumina sequencing data mapping on SMRT sequencing transcripts.
SampleTotal ReadsMapped Reads Percentage (%)Uniquely Mapped Reads Percentage (%)Multiple Mapped Reads Percentage (%)
R. dauricum var. albiflorumReplicate125,896,22368.6547.2721.38
Replicate230,609,34768.5448.0020.54
Replicate326,848,64668.8248.3720.45
R. dauricumReplicate124,159,94268.1047.7820.32
Replicate227,634,34868.1847.9120.27
Replicate326,275,26268.0347.6820.35
Table 3. Differentially expressed TFs involved in anthocyanin biosynthesis in R. dauricum var. albiflorum compared to R. dauricum.
Transcription FactorGene-IDlog2(Fold Change)Up/Down
MYBTranscript/1227−1.52Down
Transcript/14301−1.05Down
Transcript/187954.21Up
Transcript/19510−1.08Down
Transcript/226133.74Up
Transcript/247604.24Up
Transcript/2607−1.42Down
Transcript/30244.34Up
Transcript/3462−1.52Down
Transcript/48722.02Up
Transcript/6971−11.70Down
Transcript/7286−1.38Down
Transcript/73882.30Up
Transcript/84732.92Up
Transcript/9651.28Up
bHLHTranscript/10990−1.24Down
Transcript/124171.09Up
Transcript/128379.35Up
Transcript/151291.57Up
Transcript/16447−3.04Down
Transcript/16636−12.21Down
Transcript/19483−1.47Down
Transcript/708410.83Up
Transcript/78311.33Up
Transcript/9298−5.96Down
Disclaimer/Publisher’s Note: The statements, opinions and data contained in all publications are solely those of the individual author(s) and contributor(s) and not of MDPI and/or the editor(s). MDPI and/or the editor(s) disclaim responsibility for any injury to people or property resulting from any ideas, methods, instructions or products referred to in the content.

