Article

Morphological Characters, Phytochemical Profile and Biological Activities of Novel Garden Roses Edible Cultivars

by
Nataša Simin
1,
Marija Lesjak
1,
Nemanja Živanović
1,
Biljana Božanić Tanjga
2,
Dejan Orčić
1 and
Mirjana Ljubojević
3,*
1
Faculty of Sciences, University of Novi Sad, Trg Dositeja Obradovića 3, 21000 Novi Sad, Serbia
2
Breeding Company ‘Pheno Geno Roses’, Maršala Tita 75, 23326 Ostojićevo, Serbia
3
Faculty of Agriculture, University of Novi Sad, Trg Dositeja Obradovića 8, 21000 Novi Sad, Serbia
*
Author to whom correspondence should be addressed.
Horticulturae 2023, 9(10), 1082; https://doi.org/10.3390/horticulturae9101082
Submission received: 2 September 2023 / Revised: 17 September 2023 / Accepted: 24 September 2023 / Published: 27 September 2023
(This article belongs to the Special Issue Horticulturalization of the 21st Century Cities)

Abstract

:
Modern roses (Rosa × hybrida) are among the most important and economically profitable horticultural plants. Besides their beauty and remarkable fragrance, they are also rich sources of biologically active compounds with potential health benefits. The aim of this study was to valorize the prospective of six new genotypes of edible roses to be utilized as functional foods. Rose flowers were subjected to detailed characterization of morphological traits, fragrance analysis, GC-MS analysis of aroma carriers, determination of phenolic profile and vitamin C content, and evaluation of biological activities. The results showed that all the investigated cultivars have a favorable aroma for human consumption (pear-like, strawberry-like or fruity), high contents of phenolics and vitamin C, strong antioxidant content and moderate neuroprotective activity. They are characterized by large amounts of quercetin 3-O-glycosydes and quinic acid. The genotype ‘Marija Frayla’ stands out from others due to facilitated flower morphology, the highest level of total phenolics (217 mg of galic acid equivalents/g of dry extract) and the strongest antioxidant activity (in the DPPH assay, IC50 = 9.24 µg/mL; and antioxidant potential in the FRAP assay was 220 mg ascorbic acid equivalents/g of dry extract), thus represents the most valuable amendment to the development of novel functional food products. The ‘Eveline Wild’ genotype has the highest neuroprotective activity (68.5 ng of eserine equivalents/g of dry extract), thus might be applied in the prevention of dementia. The ‘Pear’ cultivar with the lowest phenolics content and biological activity has a mild, fruity aroma, thus can be used in everyday eating.

Graphical Abstract

1. Introduction

Modern roses (Rosa × hybrida), which belong to the genus Rosa L. from the Rosaceae family, have resulted from extensive hybridization of wild rose species. They are among the most important and economically profitable horticultural plants [1]. R. × hybrida comprises over 30,000 different registered cultivars. Owing to their complex hybridization history, numerous varieties have appeared, with different flower colors and shapes, as well as various chemical compositions and scent notes [2].
Besides their great horticultural value, roses have been cultivated for over a thousand years for their nutritional, medicinal and cosmetic properties [3]. Fragrant compounds from rose petals are indispensable components in the perfumery industry [4]. On the other hand, rose petals have been used to add aroma, flavor and aesthetic value to foods and beverages in Persian, Indian and European cooking [5,6].
Previous studies have demonstrated that some rose cultivars have a higher nutritional value than certain types of fruits and vegetables [6]. This is due to the fact that rose petals contain significant amounts of vitamin C, as well as phenolic compounds, organic acids, sugars, lipids, proteins, pectins, amino acids, and essential oils [7,8,9]. These compounds contribute to the nutritional and functional value of roses as a food source. Compounds responsible for the characteristic aroma and flavor of rose petals are volatile components of essential oil, such as nonadecane, heneicosane docosane, citronellol, 9-nonadecene, β-phenylethyl benzoate, n-tricosane, geraniol, linalool, nerol, eugenol and farnesol [10,11,12,13]. These compounds are responsible for the distinct aroma of roses and some of them are highly valued in the food and fragrance industries. Additionally, essential oil of rose petals is proven to exhibit antimicrobial activity towards different bacteria and fungi [10,14]. Besides essential oils, the presence of high quantities of phenolic compounds in roses, particularly anthocyanins, has been reported in several studies [9]. In addition to anthocyanins, flavonoids, phenolic acids and tannins have also been found in roses [15,16,17,18]. These compounds have been shown to have various biological activities, including antioxidant, anti-elastase and anti-inflammatory properties [8,15,19]. Vanderjagt et al. [20] found that among 30 investigated medicinal plants, R. × centifolia expressed the second-highest antioxidant activity, right after Ilex paraguariensis.
Thus, the consumption of rose petals as fresh culinary crops, in cooked form or in a form of functional beverages, could provide various beneficial effects on human health [5,9]. However, despite the fact that they have a huge nutritional and functional potential, rose petals have not been extensively used as food. Until now, they are mainly used in wine, juice and jam production, for making teas and sweets such as ‘ratluk’ [9]. Recently, more innovative rose petal products are being sought, including rose petal gelato, refreshments and chocolate.
Over the past decade, the Grubbenvorst Company from the Netherlands has developed a significant collection of novel garden rose genotypes through planned hybridization [7]. This involves the controlled pollination of parent plants with desirable traits to produce offspring with improved characteristics. One of the aims of this breeding program was to identify genotypes with suitable sensory properties, particularly in terms of their aroma, for potential use in human consumption as food. The sensory properties were evaluated using standardized sensory analysis techniques to ensure consistency and accuracy in the assessments. The aroma profile of each genotype was characterized, taking into account factors such as intensity, complexity and pleasantness smell for food. After careful evaluation and selection, six genotypes were found to possess desirable sensory properties, making them valuable candidates for potential use in food products.
This research was undertaken to additionally valorize these genotypes. Thus, the specific objectives of this study were to assess the (i) morphological characteristics of six edible garden roses in terms of the flowering shoot and flower abundance, as well as flower petals’ size and number; (ii) fragrance intensity and human sensory panel scoring for major top, hearth and base fragrance notes according to olfactory pyramid; (iii) phytochemical profile and antioxidant capacity of investigated garden rose cultivars; as well as (iv) neuroprotective activity thought the acetylcholinesterase inhibitory potential determination. The detailed determination of the phytochemical profile of rose petals included an analysis of the contents of total phenolics, flavonoids, anthocyanins and vitamin C, as well as identification and quantification of individual compounds, including volatile compounds responsible for the aroma of the roses and phenolic compounds with potential health benefits. Antioxidant activity was evaluated by 2,2-diphenyl-1-picrylhydrazyl (DPPH) and ferric reducing antioxidant potential (FRAP) assays.
By identifying specific compounds and evaluating their biological activities, we were able to single out those with the highest prospective to be promoted for their potential health benefits, in addition to their sensory properties. This may increase the market value of new rose genotypes and make them more attractive to consumers looking for natural and healthy food options.

2. Materials and Methods

2.1. Plant Material and Sample Preparation

The plant material used in the experiments (Figure 1) included six tetraploid (4n) garden rose cultivars, namely, ‘Theo Clevers’ (TC), ‘Eveline Wild’ (EV), ‘Pear’ (P), ‘Olivera Frayla’ (OF), ‘Marija Frayla’ (MF) and ‘Lavander Vaza’ (LV) currently marketed mainly in Serbia, Netherlands, Poland, France, Italy, Hungary, Germany and the UK. All genotypes belong to R × hybrida. They were grown according to the conventional breeding system without the use of any chemical protection.
Garden roses used in the experiment were two years old and grew in the open field conditions, at the ‘Pheno Geno Roses’ private company in Temerin, Northern Serbia (45°24′19″ N 19°53′13″ E/45.105166° N 19.886833° E). This rose nursery is situated 20 km from Novi Sad, the second largest city in Serbia. The area is characterized as a typical continental climate with extremely warm summers and cold winters.
The experimental field (30 m long × 20 m wide) was established in the fall of 2015, by in situ bud grafting. The number of grafted plants was 150 per cultivar and the distance between plants was 10 cm, while the row distance amounted to 1 m.
Thirty flowers of each cultivar were collected in June of 2021 during the first flash of flowering. Fresh flowers were frozen at −80 °C until the analysis.
In larger tables, investigated cultivars were abbreviated as the following: LV—‘Lavander Vaza’; P—‘Pear’; MF—‘Marija Frayla’; OF—‘Olivera Frayla’; TC—‘Theo Clevers’; EV—‘Evelin Wild’.

2.2. Morphological Traits

Morphological—qualitative and quantitative characterization following the UPOV protocol [21] for roses (Rosa L.) was performed during the full blossom, when the intensive spring vegetative growth was fully achieved. Qualitative analyses were performed in the late spring–early summer of 2021 on 10 plants per cultivar by two independent researchers to reduce the subjectivity.
Qualitative traits included the characters presented in Table 1.
Quantitative—metrical characterization was performed for plant height, leaf length and width (all in cm), as well as following generative traits: number of flowering shoots (only varieties with no flowering laterals)—NFS; number of flowering laterals—NFL; number of flowers per lateral (only varieties with flowering laterals)—NF/L; number of petals—NOP; diameter—DM (cm); petal length—PL (cm) and petal width—PW (cm);
Quantitative analyses were also performed in the late spring–early summer of 2021 on three plants per cultivar as well as three stems per plant. On each stem, five leaves and five flowers were considered for subsequent morphological analyses. Three plants per cultivar were considered appropriate for quantitative analyses due to the clonal propagation with buds originating from a single mother plant.

2.3. Fragrance Analysis and Volatile Compounds Investigation

2.3.1. Sensory Analysis

Fragrance evaluation as a qualitative trait was performed by human perception (Table S1). Namely, 15 panel specialists were gathered to perform the scoring of the specific fragrance components—top notes (citrus, aromatic), heart notes (floral, green, fruity, spicy) and base notes (woody, earthy/balsamic). Fragrance scoring was performed on fully open flowers on intact rose bushes in the morning. Every cultivar was smelled 3 times corresponding to three random flowers per plant (in one-hour intervals) on 5 replicate plants per cultivar, for each top, heart and base note by 15 people of different gender, seniority, specialties and interests in roses, reducing the subjective scoring. The same 5 replicate plants per cultivar were chosen for smelling, but the flowers on these bushes were randomly selected by each of the 15 panelists. Values obtained from 5 plants for each cultivar by all 15 panelists were subsequently averaged in order to simplify the presentation of the results.

2.3.2. GC-MS Analysis

To chemically characterize the fragrant compounds, gas chromatography–mass spectrometry (GC-MS) analysis of essential oils was performed. The essential oils were isolated by hydro-distillation according to the recommended procedure by the European Directorate for the Quality of Medicines (EDQM) [22], where petals were finely ground immediately after being removed from the freezer. The obtained essential oils were stored at −20 °C prior to the analysis. Qualitative and semi-quantitative chemical characterization of essential oil was performed using Agilent Technologies 6890N gas chromatograph coupled with an Agilent Technologies 5975B electron ionization mass-selective detector, according to the method described in Lesjak et al. [23]. Briefly, an aliquot of 1 μL of essential oil dissolved in hexane (10 μL/mL) was injected into a split/splitless inlet at 250 °C, with a split ratio 1:10. Helium (purity 5.0) was used as a carrier, with a constant flow of 1 mL/min. Components were separated on a non-polar Agilent Technologies HP-5 ms column (30 m × 0.25 mm, 0.25 μm), using the temperature program starting at 50 °C, increasing 8 °C/min to 120 °C, then 15 °C/min to 230 °C, and finally 20 °C/min to 270 °C, and holding at 270 °C for 16.9 min (total run time 35 min). Effluent was delivered to the mass spectrometer via a transfer line held at 280 °C. The ion source temperature was 230 °C, electron energy 70 eV and quadrupole temperature 150 °C. To achieve better correlation between experimental and library spectra, a standard spectra tune was used. Data were acquired in scan mode (m/z range 35–400), with a solvent delay of 2.30 min. Data were processed using Agilent Technologies MSD ChemStation software (revision E01.01.335) combined with AMDIS (ver. 2.64) and NIST MS Search (ver. 2.0d). AMDIS was used for deconvolution, i.e., co-eluting compounds peak area determination and pure spectra extraction, and NIST MS Search provided a search algorithm complementary to the PBM algorithm of ChemStation. The compounds were identified by comparison of mass spectra with data libraries [24] and confirmed by comparison of linear retention indices with literature data [25]. The relative amount of each component is expressed as the percentage of its peak area relative to the total peak area. A homologous series of n-alkanes (C8–C28), injected under the same conditions, was used as a standard for the determination of retention indices.

2.4. Chemical Characterization of Rose Petal Methanol Extracts

2.4.1. Preparation of Methanol Extracts

Methanol extracts of rose petals were prepared by maceration with 80% MeOH (1:10 ratio) for 48 h at room temperature without shaking. The obtained macerate was filtered and maceration was repeated one more time. Macerates were evaporated to dryness under vacuum at 35 °C, dry extracts were dissolved in dimetilsulfoksid (DMSO) to the final concentration of 200 mg/mL and kept frozen at −20 °C until the analysis.

2.4.2. Determination of Total Phenolic Content

Total phenolic content (TPC) was determined by using Folin–Ciocalteu (FC) reagent according to the method described in Lesjak et al. [26]. Briefly, 30 µL of the methanol extract (0.1, 0.2 and 0.4 mg/mL) or standard (gallic acid, 0.625–80.0 µg/mL) was mixed with 150 µL 0.1 M FC reagent and incubated for 10 min in the dark, after which 120 µL of 0.7 M sodium carbonate was added and absorbance was measured after 2 h at 720 nm. All tests were carried out in triplicate and the total phenolic content was expressed as mg of gallic acid equivalents per g of dry extract (mg GAE/g de) or per g of fresh petals (mg GAE/g of fresh petals).

2.4.3. Determination of Total Flavonoid Content

Total flavonoid content (TFC) was determined by a colorimetric method described in Lesjak et al. [26]. Briefly, 30 µL of the methanol extract (0.1, 0.2 and 0.4 mg/mL) or standard (quercetin, 0.625–80.0 µg/mL) was mixed with 6 µL of 10% aluminum chloride, 6 µL of 1 M sodium acetate, 90 µL of methanol and 170 µL of distilled water. Absorbance was measured after 30 min at 415 nm. All tests were carried out in triplicate and results were expressed as mg of quercetin equivalents per g of dry extract (mg QE/g de) or per g of fresh petals (mg QE/g of fresh petals).

2.4.4. Determination of Total Monomeric Anthocyanin Content

The content of the total monomeric anthocyanin (TAC) was determined using the pH differential method according to the previously published procedure [27], adapted to 96-well micro plates. Briefly, 15 μL of the methanol extract was mixed with 285 μL of buffer pH 4 (0.4 mol/L sodium acetate) and pH 1 (0.025 mol/L potassium chloride), and the absorbance was measured after 40 min at 520 and 700 nm.
The TAC was calculated using the Equation (1):
TAC = A × Mr × DF × 1000/(ε × l × C)
where A = (A510–A700)pH1 – (A510–A700)pH4, Mr is a relative molecular mass of cyanidin-3-O-glucoside, DF is the dilution factor, 1000 is a conversion factor (g to mg), ε is the molar extinction coefficient (L/(mol × cm)) for cyanidin-3-O-glucoside, l is the pathlength (cm) and C is the extract concentration (mg/mL). All tests were carried out in triplicate and TAC was expressed as µg of cyanidin-3-O-glucoside equivalents per g of dry extract (µg CE/g de) or per g of fresh petals (µg CE/g of fresh petals).

2.4.5. Determination of Vitamin C Content

The content of vitamin C (vit C) was determined according to the previously published procedure [28] adapted to 96-well micro plates with small modifications. The method is based on the redox reaction of ascorbic acid with redox dye 2,6-dichlorophenolindophenol (DCPIP). Briefly, 270 μL of 72 mg/L DCPIP reagent was mixed with 30 μL of the rose extract (30 mg/mL) or standard solution and after 5 min of incubation, the absorbance was measured at 515 nm. In the blank probe, DCPIP reagent was substituted with dH2O. All dilutions of the extracts and standards were made with 5% metaphosphoric acid, which serves to protect vit C in solution from oxidation with atmospheric oxygen. All tests were carried out in triplicate and the content of vit C was expressed in mg per g of dry extract (mg/g de) or per g of fresh petals (mg/g of fresh petals).

2.4.6. Quantitative Analysis of Selected Phenolic Compounds

The content of quinic acid and 44 selected phenolic compounds (14 phenolic acids, 25 flavonoids, 3 coumarins and 2 lignans) was investigated by liquid chromatography with tandem mass spectrometry (LC-MS/MS) according to the previously reported method [29]. Standards of the compounds were purchased from SigmaeAldrich Chem (Steinheim, Germany), Fluka Chemie GmbH (Buchs, Switzerland) or from ChromaDex (Santa Ana, CA, USA). Samples and standards were analyzed using Agilent Technologies 1200 Series high-performance liquid chromatograph coupled with Agilent Technologies 6410A Triple Quad tandem mass spectrometer with electrospray ion source, and controlled by Agilent Technologies MassHunter Workstation software—Data Acquisition (ver. B.06.00). All extracts were diluted with 50% aqueous MeOH to the concentrations of 20 mg/mL and 0.1 mg/mL. The sample (5 μL) was injected into the system, and compounds were separated on a Zorbax Eclipse XDB-C18 (50 mm × 4.6 mm, 1.8 μm) rapid resolution column. Data were acquired in dynamic Multiple Reaction Monitoring (MRM) mode. Peak areas were determined using Agilent MassHunter Workstation Software—Qualitative Analysis (ver. B.06.00). Calibration curves were plotted by OriginLabs Origin Pro (ver. 2019b) software and used for calculating the investigated compound concentrations in the extracts.

2.5. Antioxidant Potential

2.5.1. DPPH Assay

Ability of the extracts to neutralize 2,2-diphenyl-1-picrylhydrazyl (DPPH) radical was determined according to Lesjak et al. [26]. Briefly, 10 µL of the sample (concentration range 0.047–3.0 mg/mL) was mixed with 100 µL of 90 µM DPPH solution in methanol and 190 µL of methanol. Absorbance was measured after 1 h at 515 nm. All tests were carried out in triplicate and the results were expressed as IC50 value (the concentration of the sample that neutralizes 50% of DPPH radicals (μg/mL)).

2.5.2. FRAP Assay

A ferric reducing antioxidant potential (FRAP) assay was carried out according to Lesjak et al. [26]. Briefly, 10 µL of the sample (0.1, 0.2 and 0.4 mg/mL) or standard solution (ascorbic acid, 1.0–160.0 µg/mL) was mixed with 290 µL of FRAP reagent. Absorbance was measured after 6 min at 593 nm. All tests were carried out in triplicate and results were expressed as mg of ascorbic acid equivalents per g of dry extract (mg AAE/g de).

2.6. Neuroprotective Activity

The neuroprotective activity of the extracts was assessed by measuring the potential to inhibit acetyl cholinesterase (AChE-IP) using Ellman’s method with certain modifications as previously described in Pintać et al. (2019) [30]. Briefly, 20 µL of AChE (0.5 U/mL) was added to 110 µL of 20 mM Tris-HCl buffer pH 8 along with 10 µL of extract (1 or 1.25 mg/mL) or standard (eserine, 1.35 × 10⁻⁶–1.38 × 10⁻³ mg/mL). In the blank probe, AChE was substituted with 20 mM Tris-HCl buffer pH 7.5, and in the control 20 mM Tris-HCl buffer pH 8 was added instead of the sample. The 96-well plate was then incubated for 15 min at 37 °C with constant shaking. After the incubation, 40 µL of 3 mM 5,5′-dithio-bis (2-nitrobenzoic acid) solution and 20 µL of 15 mM acetylthiocholine iodide were added to the plate. The absorbance was measured at 412 nm after 3 min of the reaction start. All tests were carried out in triplicate and results were expressed as nanogram of eserine equivalents per g of dry extract (ng EE/g de).

2.7. Statistical Analysis

The data of all morphometric and spectrophotometric measurements were analyzed by one-way ANOVA followed by the post hoc Tukey’s Honest Significant Difference (HSD) test for multiple comparisons of means in order to determine whether the data obtained for different rose genotypes differed significantly between each other (Real Statistics Resource Pack add in for Excel 2013). Statistical significance was set at p < 0.05. Principal component analysis and hierarchical clustering analysis of results for GC-MS and LC-MS/MS analysis was carried out by using the software Past version 4.03.

3. Results and Discussion

3.1. Morphological Traits

The growth type (shrub) was uniform in all the investigated cultivars, whilst the growth habit varied from semi-upright in ‘Olivera Frayla’, ‘Lavender Vaza’ and ‘Pear’, to upright in ‘Eveline Wild’, ‘Theo Clevers’ and ‘Marija Frayla’ rose cultivars (Table 2). Plant height significantly varied, taking values from 38.8 cm in ‘Marija Frayla’ to 108 cm in ‘Theo Clevers’. Regarding the leaf properties, color differed among the cultivars, from light in ‘Eveline Wild’ to dark in ‘Theo Clevers’, while all other genotypes had a medium intensity of a green color. Leaf anthocyanin coloration was present or absent in equal number or genotype. Similarly, glossiness of upper side was weak or very weak in equal number or genotype (3). Leaf length and width were less variable than the plant height according to Tukey’s HSD test, taking values from 3.32 cm to 6.32 cm and 2.14 cm to 4.82 cm, respectively.
Regarding the flowering shoot qualitative characteristics (Table 3), shoots were absent in ‘Olivera Frayla’ and ‘Theo Clevers’. Where present, the flowering shoots obtained values from 4.60 in ‘Lavender Vaza’ to 6.20 in ‘Marija Frayla’. Flowering laterals were present in ‘Olivera Frayla’, ‘Pear’ and ‘Theo Clevers’ rose cultivars, while they were absent in others. The number of flowering laterals ranged from 1.80 in ‘Pear’ cultivar to 3.00 in ‘Olivera Frayla’, while the number of flowers per lateral varied from 1.00 to 7.61 in the same cultivars. As for the flower type, it was double in all the investigated cultivars, belonging to various color groups (from white to yellow, pink, orange blend and purple). In relation to the double flower type, the color of flower center ranged from yellow to orange and pink. The flower shape was rounded in all the investigated cultivars except for ‘Lavender Vaza’ that had irregular shape. Profile of the upper part was described as flat or flat convex in three cultivars, respectively, whilst the profile of the lower part varied from flat in two cultivars (‘Eveline Wild’ and ‘Marija Frayla’) to over-flattened convex in ‘Pear’ cultivar to concave in the rest of the cultivars. Regarding the quantitative characteristics, flower diameter varied from 5.68 cm in ‘Olivera Frayla’ to albeit 9.54 cm in ‘Marija Frayla’, with the petals achieving the largest dimensions (both petal length and width) also in ‘Marija Frayla’. Khaleghi and Khadivi [31] investigated 327 accessions of wild Damask rose from 21 geographically distinct regions, concluding the petal number between 17 and 159, very similar to the presented results. Petal length ranged from 20.09 to 60.73 mm, which is slightly higher than in the investigated cultivars, while petal width varied from 15.26 to 44.75 mm, similar to our results.

3.2. Fragrance Analysis and Volatile Compounds Investigation

3.2.1. Sensory Evaluation

Fragrance was described as 3—medium for ‘Lavender Vaza’ and ‘Pear’, 4—medium strong for ‘Marija Frayla’ and 5—strong in the rest of the genotypes and subsequently scored by the panel according to the presence of different fragrance components (Table 4). In addition to being highly scored for overall fragrance, cultivars are described as a complex combination of different top, heart and base notes. Overall, fruity notes dominate, with panelists associating with different standard fruit species (orange, lemon, apple, peach), with combined results of a pear-like scent in ‘Pear’ and strawberry-like scent in ‘Theo Clevers’, while ‘Eveline Wild’ and ‘Marija Frayla’ are noted as fruity. The cultivar ‘Pear’ seems to be the most complex, since panelists’ recoded notes from all eight groups.

3.2.2. Chemical Profile of Essential Oils

In order to identify the volatile compounds responsible for the specific flavor and aroma of the investigated rose genotypes, essential oils were isolated from the petals and subjected to GC-MS analysis. A total of 50 components were detected and their relative amounts were determined (Table 5). Out of 50 of the detected components, 36 were fully identified. Linear hydrocarbons were the most dominant of all the investigated genotypes. Their total amount in the investigated samples was in the range from 50.8% in MF to 90.8% in P. The total amount of monoterpenes ranged from 0.24% in P to 26.9% in EW, while for sesquiterpenes, it was between 3.35% in EW and 36.0% in MF.
The results showed that all samples contain medium-chain alkyl aldehydes, specifically hexanal and 2-hexenal. These compounds contribute to the fruity fragrance of the investigated rose flowers. Hexanal’s scent is reminiscent of freshly cut grass and is often described as green, fatty, leafy, vegetative, fruity and clean, with a woody nuance. Its taste is characterized as green, woody, apple-like, grassy, citrusy and slightly orange flavored, with a fresh lingering aftertaste [32]. It naturally occurs in many fruits and vegetables [32] and is commonly used in the flavor industry to create fruity flavors [33]. The odor of 2-hexenal is described as sweet, fragrant and almond-like, with fresh fruity, green, leafy, apple, plum, watermelon and vegetable pungent notes. Its taste characteristics are fruity, green and herbal, with hints of apple and melon. This compound can be naturally found in various foods, including fruits and vegetables [32]. Additionally, all samples contain significant amounts of long-chain linear aliphatic hydrocarbons (LCLAHC), including nonadecane (C19H40), 9-nonadecene (C19H38), heneicosan (C21H44), 9-tricosene (C23H46), tricosane (C23H48), pentacosane (C25H52) and heptacosane (C27H56). LCLAHC compounds are common constituents of rose essential oil. Although lacking their own scent, LCLAHC exert a notable influence on the release properties and fragrance of the aromatic components present in the oil [34].
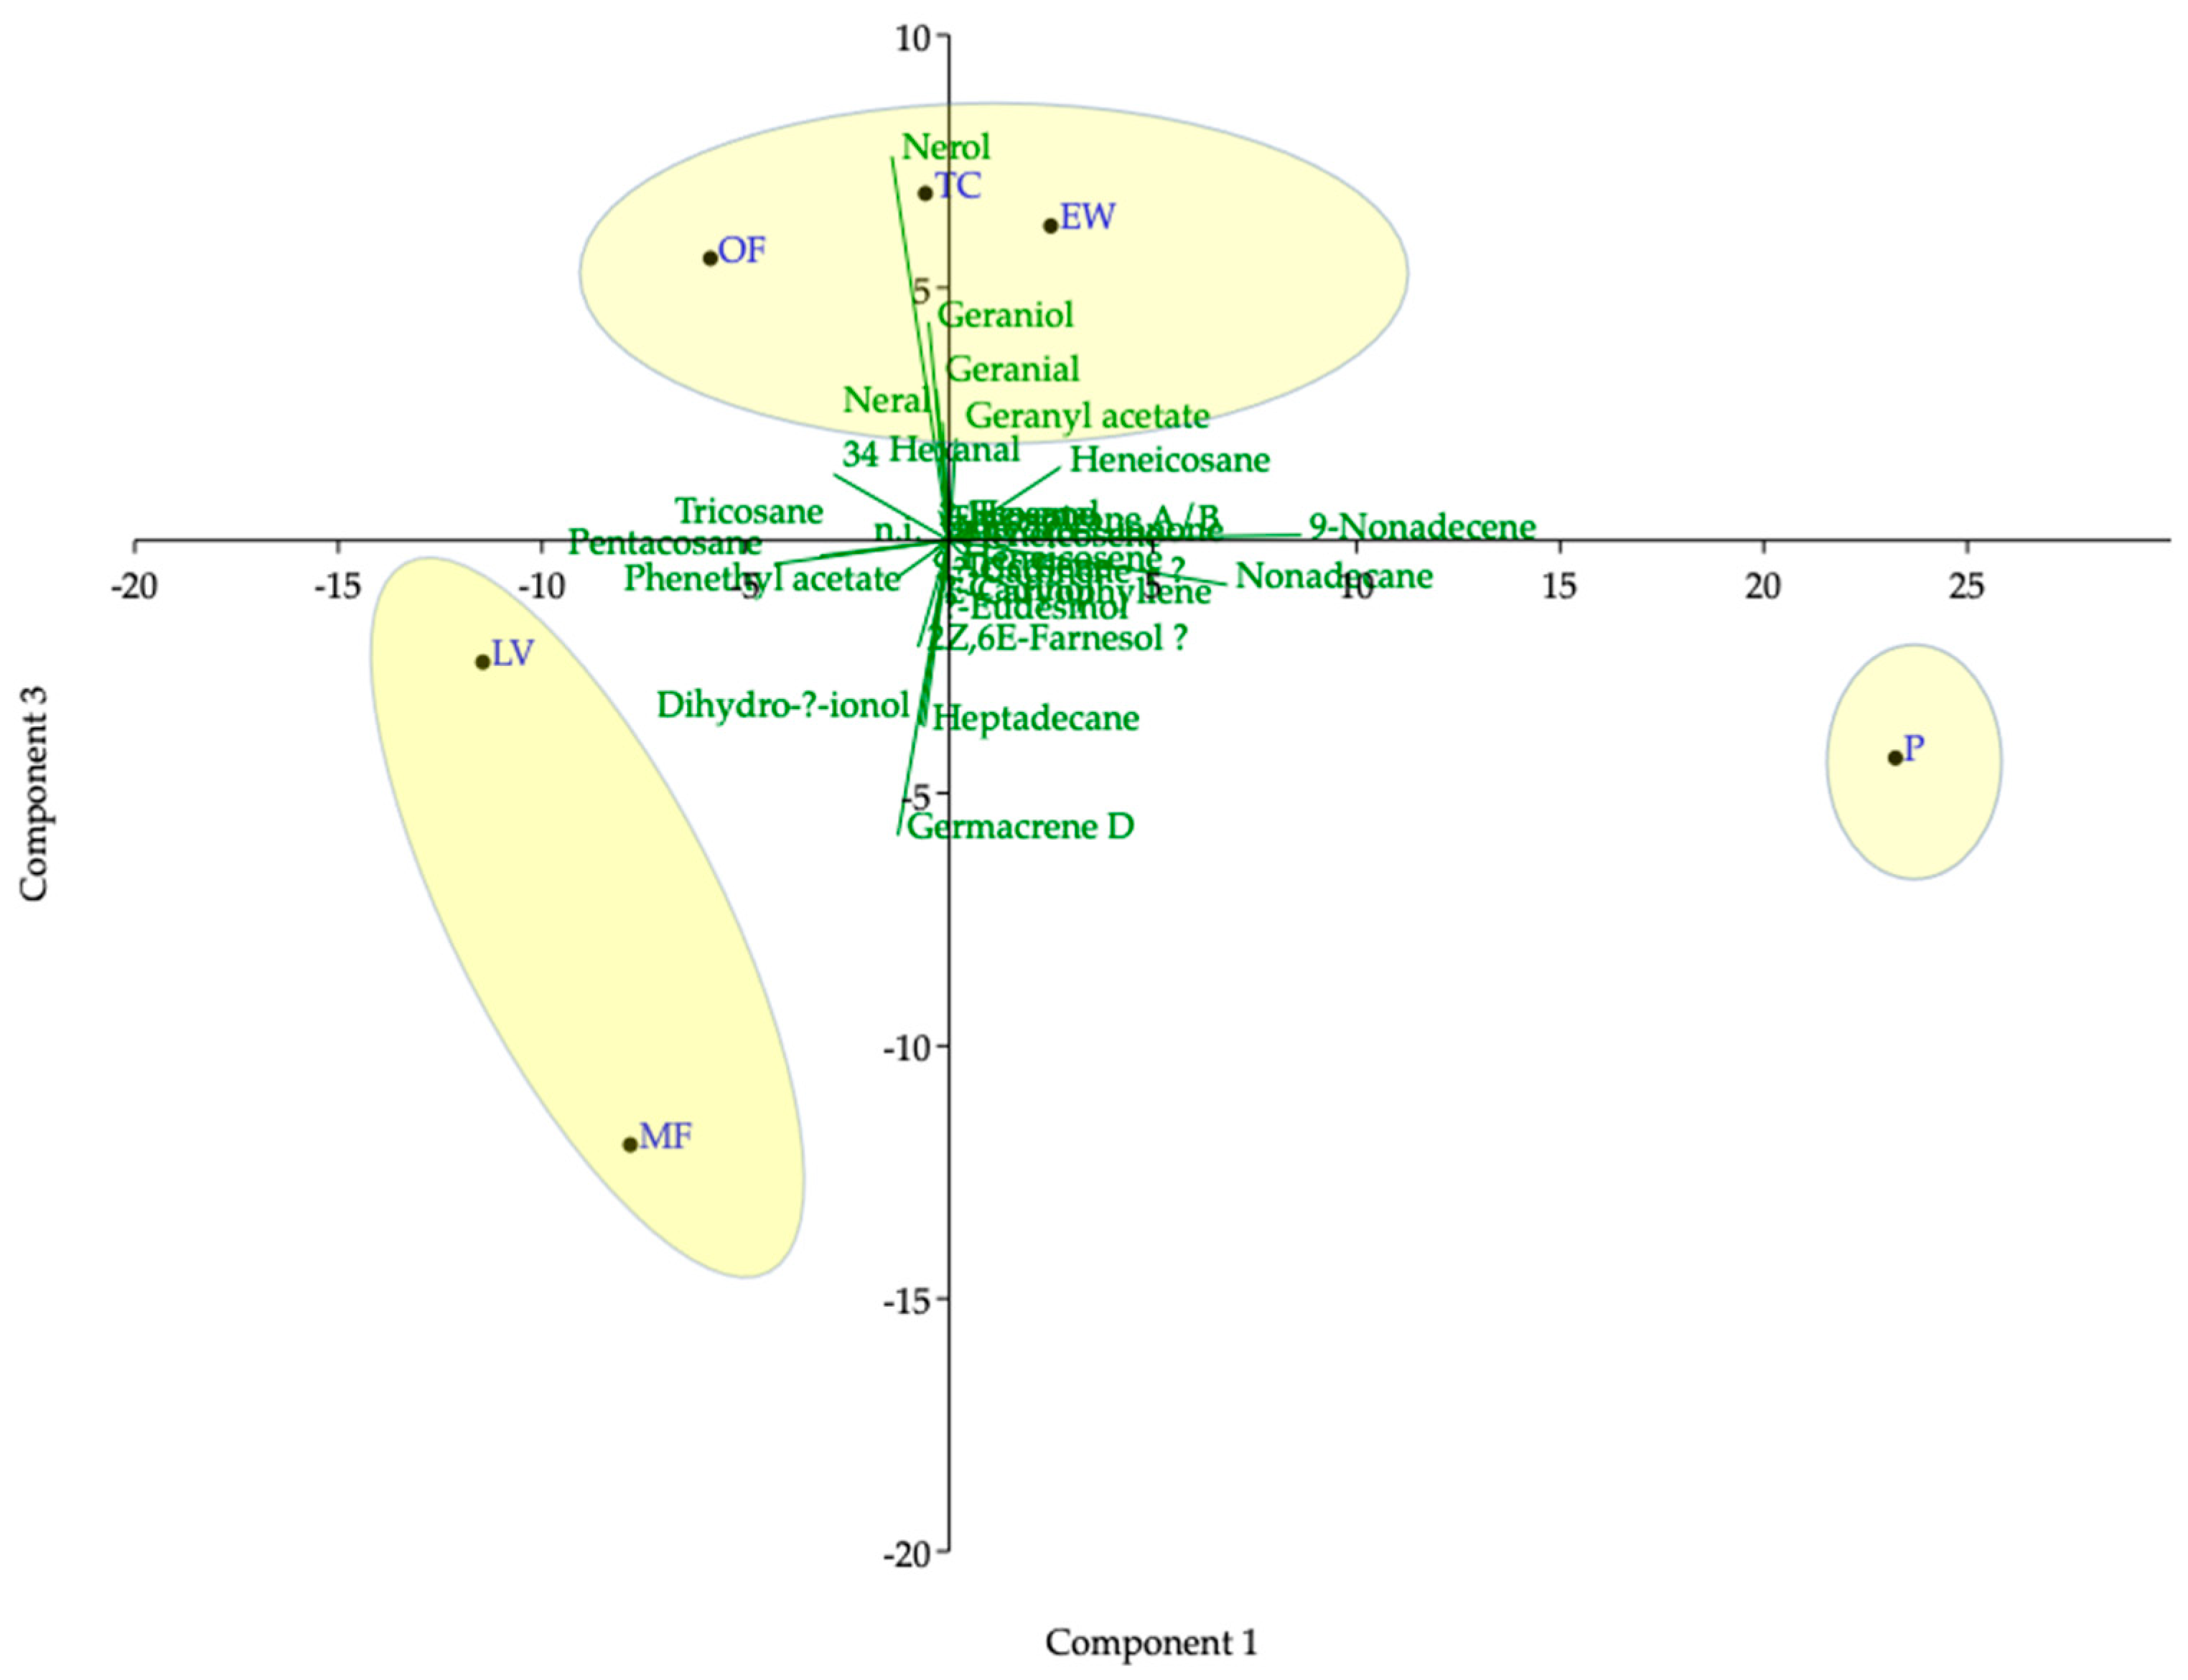
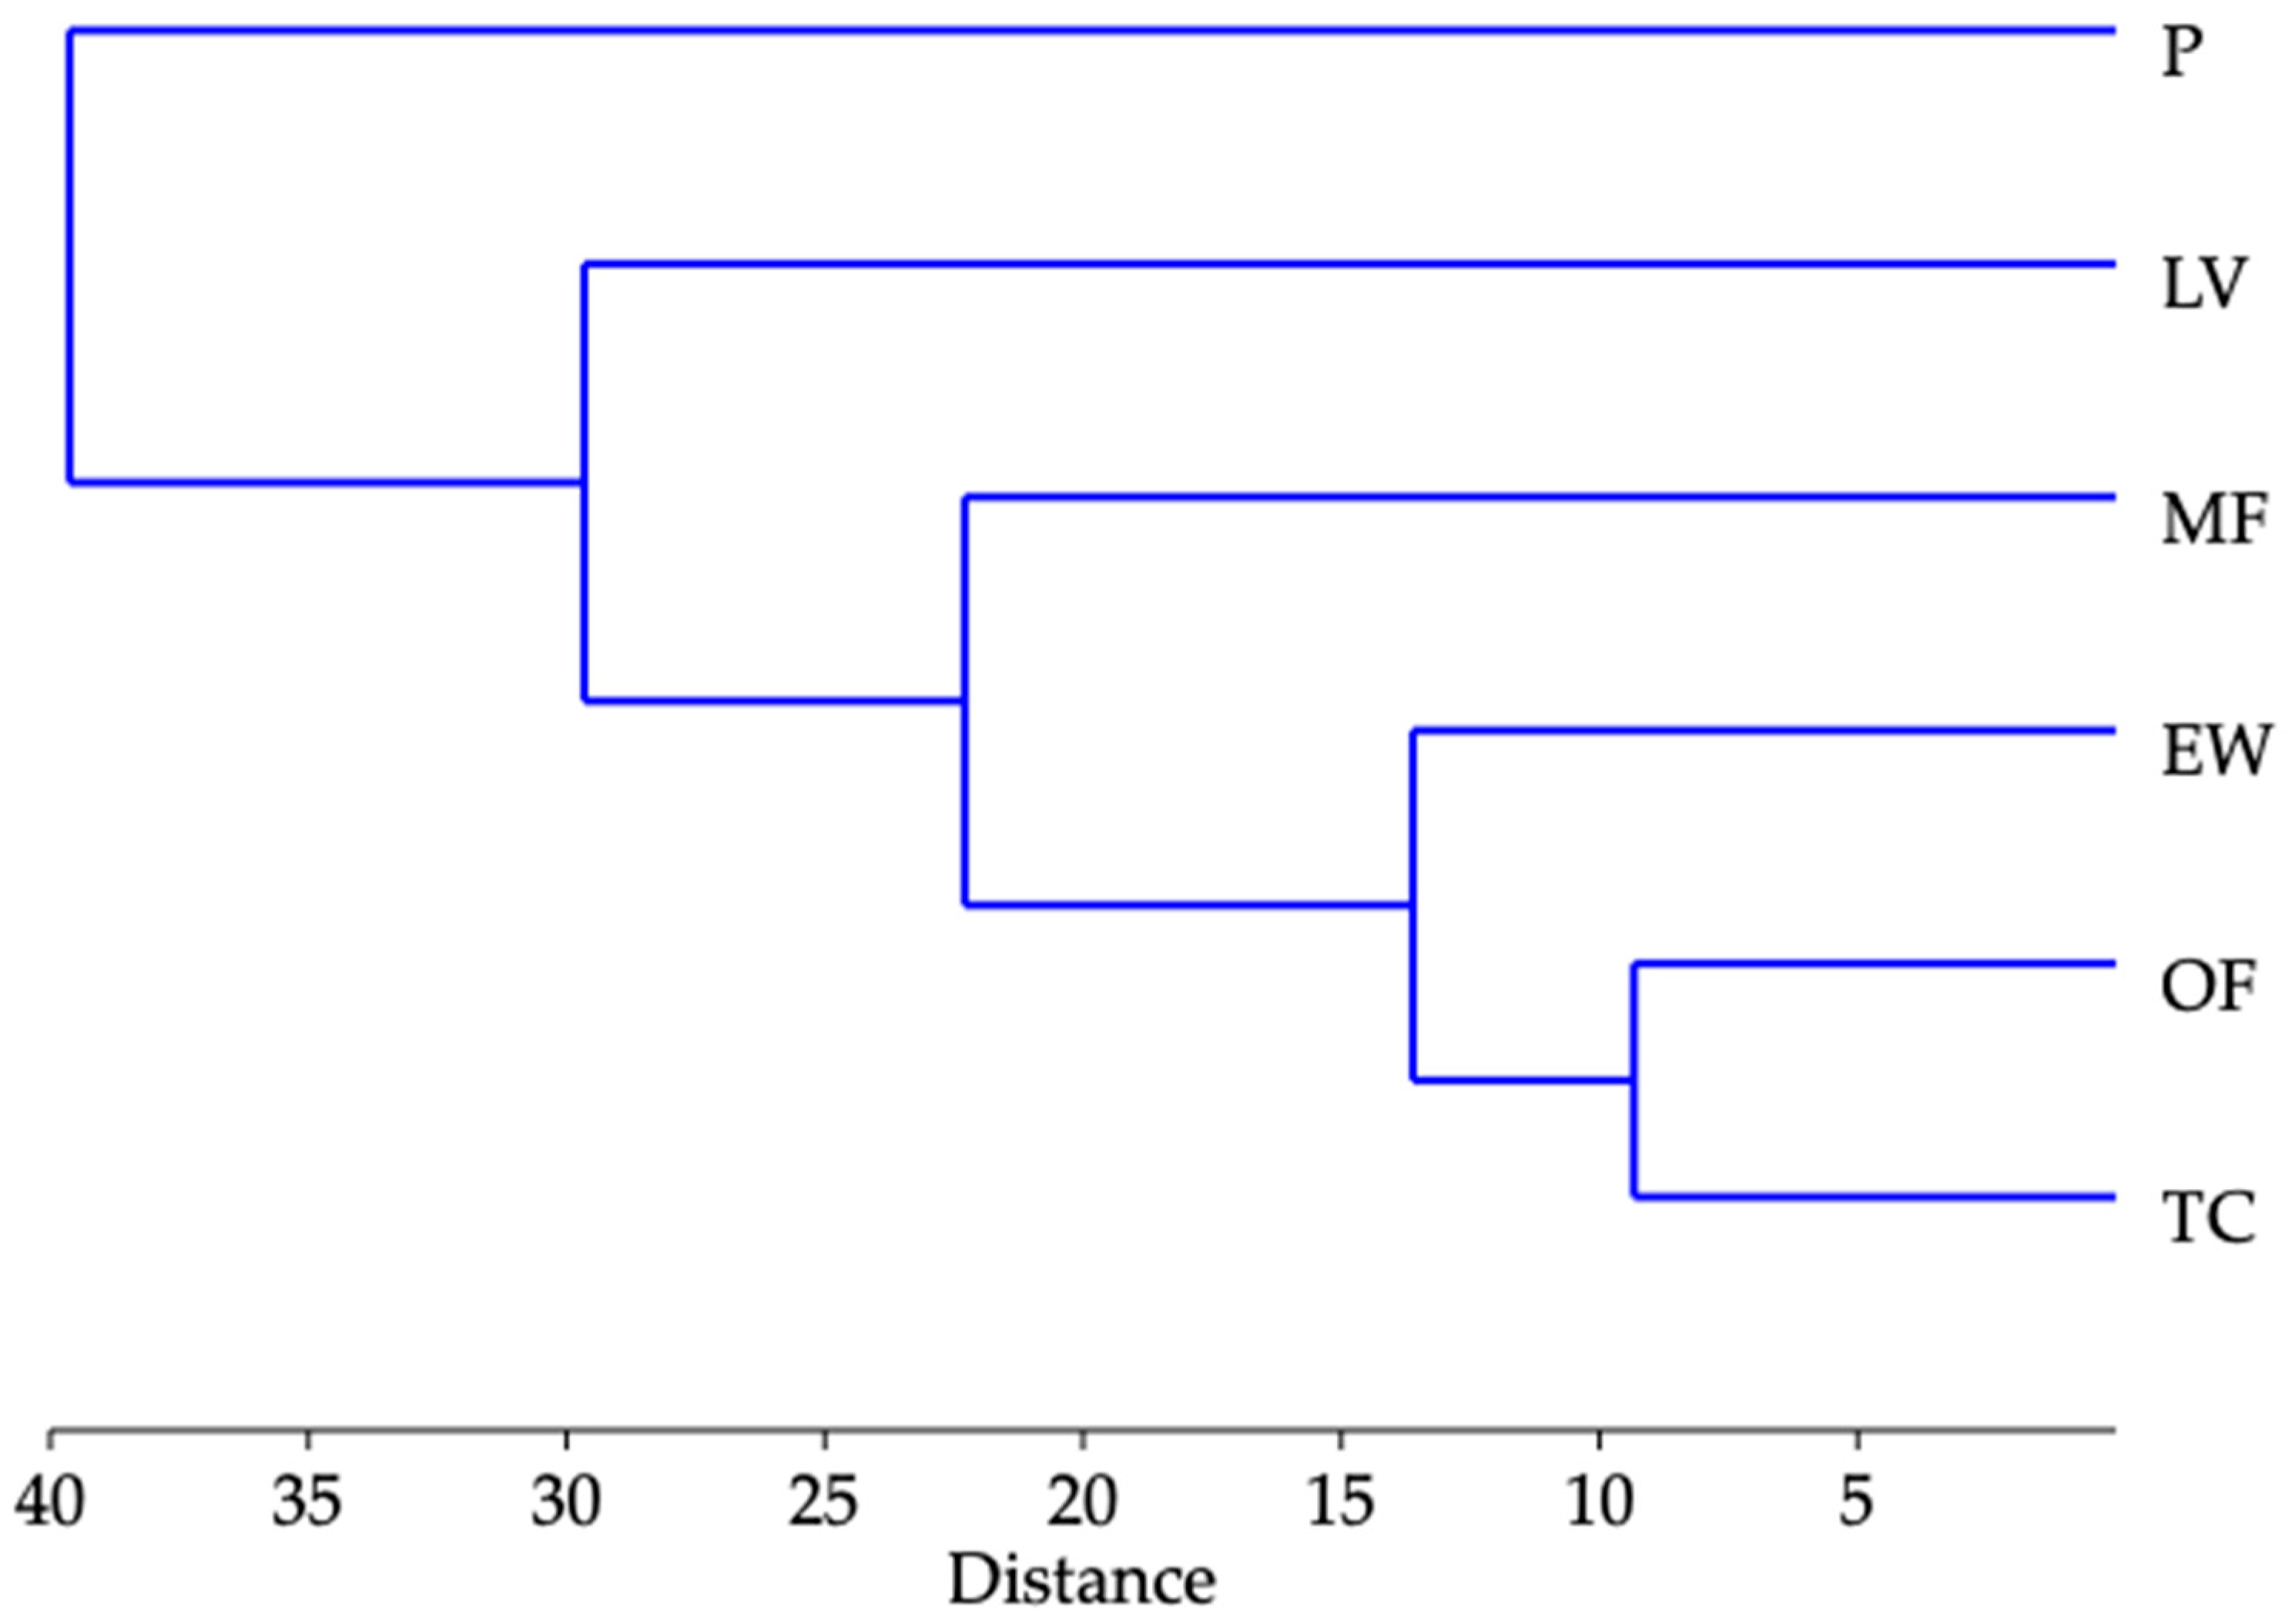
Regarding the monoterpene profile, a certain grouping among the samples can be observed. Samples EW, OF and TC share similarities with each other but differ from samples P, MF and LV, primarily due to the presence of neral, geraniol and geranial, which were exclusively detected in the former group. Additionally, EW, OF and TC also contain higher concentrations of nerol compared to other samples. These patterns of grouping and similarity among EW, OF and TC samples are consistent with the scatter plot generated through PCA analysis of the 30 dominant volatiles (compounds present in more than 1% in at least one sample) (Figure 2) and the dendogram obtained from hierarchical clustering analysis of the same data (using the Ward’s method, where closeness was measured by Euclidean distance, Figure 3). The first, second and third principal components in PCA analysis (PC1, PC2 and PC3) accounted for 49.2%, 24.5% and 18.1% of the total variance, respectively, which indicated significant metabolic differences among the rose genotypes. As monoterpene compounds serve as the primary carriers of aroma in the examined samples, the higher levels of nerol, neral, geraniol and geranial in samples EW, OF and TC are responsible for their ‘strong’ fragrance described by panelists during sensory analysis. Geraniol has a characteristic rose-like odor and a sweet, floral taste reminiscent of roses, with hints of citrus and fruity, waxy nuances [32]. Nerol has a fresh, sweet, rose-like, slightly citrus odor with fruity nuances and a bitter, fruity, pear-like flavor with floral and citrus nuances [32]. Neral (cis-citral) and geranial (trans-citral) are stereoisomers of an acyclic monoterpene aldehyde collectively referred to as citral. They typically occur as a mixture and have a strong lemony (citrus) scent and bittersweet taste featuring floral, juicy, woody and candy notes [32]. Geranyl acetate, which was found only in samples EW and TC, has a pleasant flowery odor reminiscent of lavender rose. It has an initially somewhat bitter and then sweet taste with floral, fruity and citrus nuance [32].
Phenethyl acetate, an ester formed from acetic acid and phenethyl alcohol, was exclusively detected in sample LV. It possesses a floral scent reminiscent of roses with a honey-like undertone and a sweet, fruit-like, tropical, rosy taste reminiscent of raspberries and cocoa [32]. Given that the LV sample contains low amounts of monoterpenes, phenethyl acetate significantly contributes to the overall fragrance of LV.
Theaspiran is present in considerable amounts only in sample OF and contributes to its overall aroma by a powerful fresh woody, pine-like, tea-like and slightly camphoraceous scent, with hints of tobacco leaf and a woody pine nuance. It possesses a cooling, green, mentholic, woody, pine and cedar-like taste [32].
Sample MF stands out from the rest due to its high concentration of total sesquiterpenes (36%) and low concentration of monoterpenes. The other samples, on the contrary, contain very low levels of total sesquiterpenes (up to 6.78%). Germacrene D, the dominant sesquiterpene in MF, but also in EW, LV and P, has a woody and spicy odor, contributing to the piquancy of food [35]. Sesquiterpenes, caryophyllene and δ-cadinene have a primarily woody odor, while α-eudesmol and farnesol have a sweet floral and woody fragrance [32,36].
Dihydro-α-ionol and dihydro-β-ionone, C13-norisoprenoids, which are degradation products of carotenoids, were found in MF, OF and TC. They are also important odorants contributing to rose essential oil aroma with floral and fruity, berry-like notes [37].
From the scatter plot generated by PCA analysis (Figure 2), it is evident that sample P is distinctly separated from others, positioned in the lower right quadrant. It is also separated from others on the dendogram obtained from hierarchical clustering analysis (Figure 3). Its composition is markedly unique compared to the rest, with only 0.24% of total monoterpenes and 5.06% of total sesquiterpenes. The majority of its composition consists of linear hydrocarbons (90.8%), with notably high levels of 9-nonadecene, nonadecane and heneicosane. These compounds are mostly unscented. Therefore, the aroma and taste of the P cultivar are primarily derived from hexanal, 2-hexenal, dihydro-α-ionol, germacrene D, theaspiran and several sesquiterpenes present in small quantities. Since the specific sweet floral fragrance characteristic of roses typically originates from monoterpenes such as geraniol, geranial, nerol and neral —none of which are present in sample P—it is primarily characterized by a not very strong fruity aroma and taste. There is a consistency between the metabolome and sensory evaluation data obtained from panelists, indicating the reliability of human sensory scoring for initial screening of the most suitable and preferable cultivars.
When comparing the chemical profiles of the essential oils from the rose genotypes investigated in this study with one of the most economically important Rosa species, Damask rose (R. damascena), significant differences can be observed. Damask rose has a more complex composition of long-chain hydrocarbons, but does not contain sesquiterpenes. Among monoterpenes, both geranial and geraniol are present in R. damascene as with most of the genotypes from our study. However, a distinctive component unique to R. damascena is citronellol, whereas nerol is unique to the genotypes from our study, with the exception of the P sample [11,12]. Differences between the Damask rose and suggested edible garden roses do not surprise taking into consideration that the Damask rose is not preferred as edible, but the source of fragrant rose oil, a feedstock for various cosmetical products and perfumes.

3.3. Chemical Profile of Methanol Extracts of Rose Petals

In addition to the determination of the volatiles’ profiles described in the previous section, rose petals were further chemically characterized in terms of elucidation of phenolic profile and measuring vitamin C content.
Plant phenolic compounds, commonly known as polyphenols, are a large group of naturally occurring chemical compounds characterized by their phenolic structure, which includes one or more phenol rings with hydroxyl groups. They are widely distributed in food from plant origin, including fruits, vegetables, whole grains, nuts, seeds, tea and coffee. Polyphenols are known for their diverse biological activities and potential health benefits, including antioxidant properties, anti-inflammatory, anticancer and cardioprotective effects [38]. Common classes of polyphenols include phenolic acids (such as hydroxybenzoic acids and hydroxycinnamic acids), flavonoids (such as flavonols, flavones, flavanols, anthocyanins) and other compounds such as stilbenes and lignans. The specific polyphenol content and composition in foods can vary widely based on factors such as plant type, variety, growing conditions, maturity state and food processing methods [39].
In the present study, isolation of phenolic compounds and vitamin C from rose petals was conducted by extraction with 80% methanol which was recommended as the most effective solvent for this purpose [40]. In the obtained extracts, determination of total phenolics, total flavonoids, total monomeric anthocyanins and vitamin C content was conducted using spectrophotometric methods. Additionally, 44 selected phenolic compounds were quantified by LC-MS/MS.
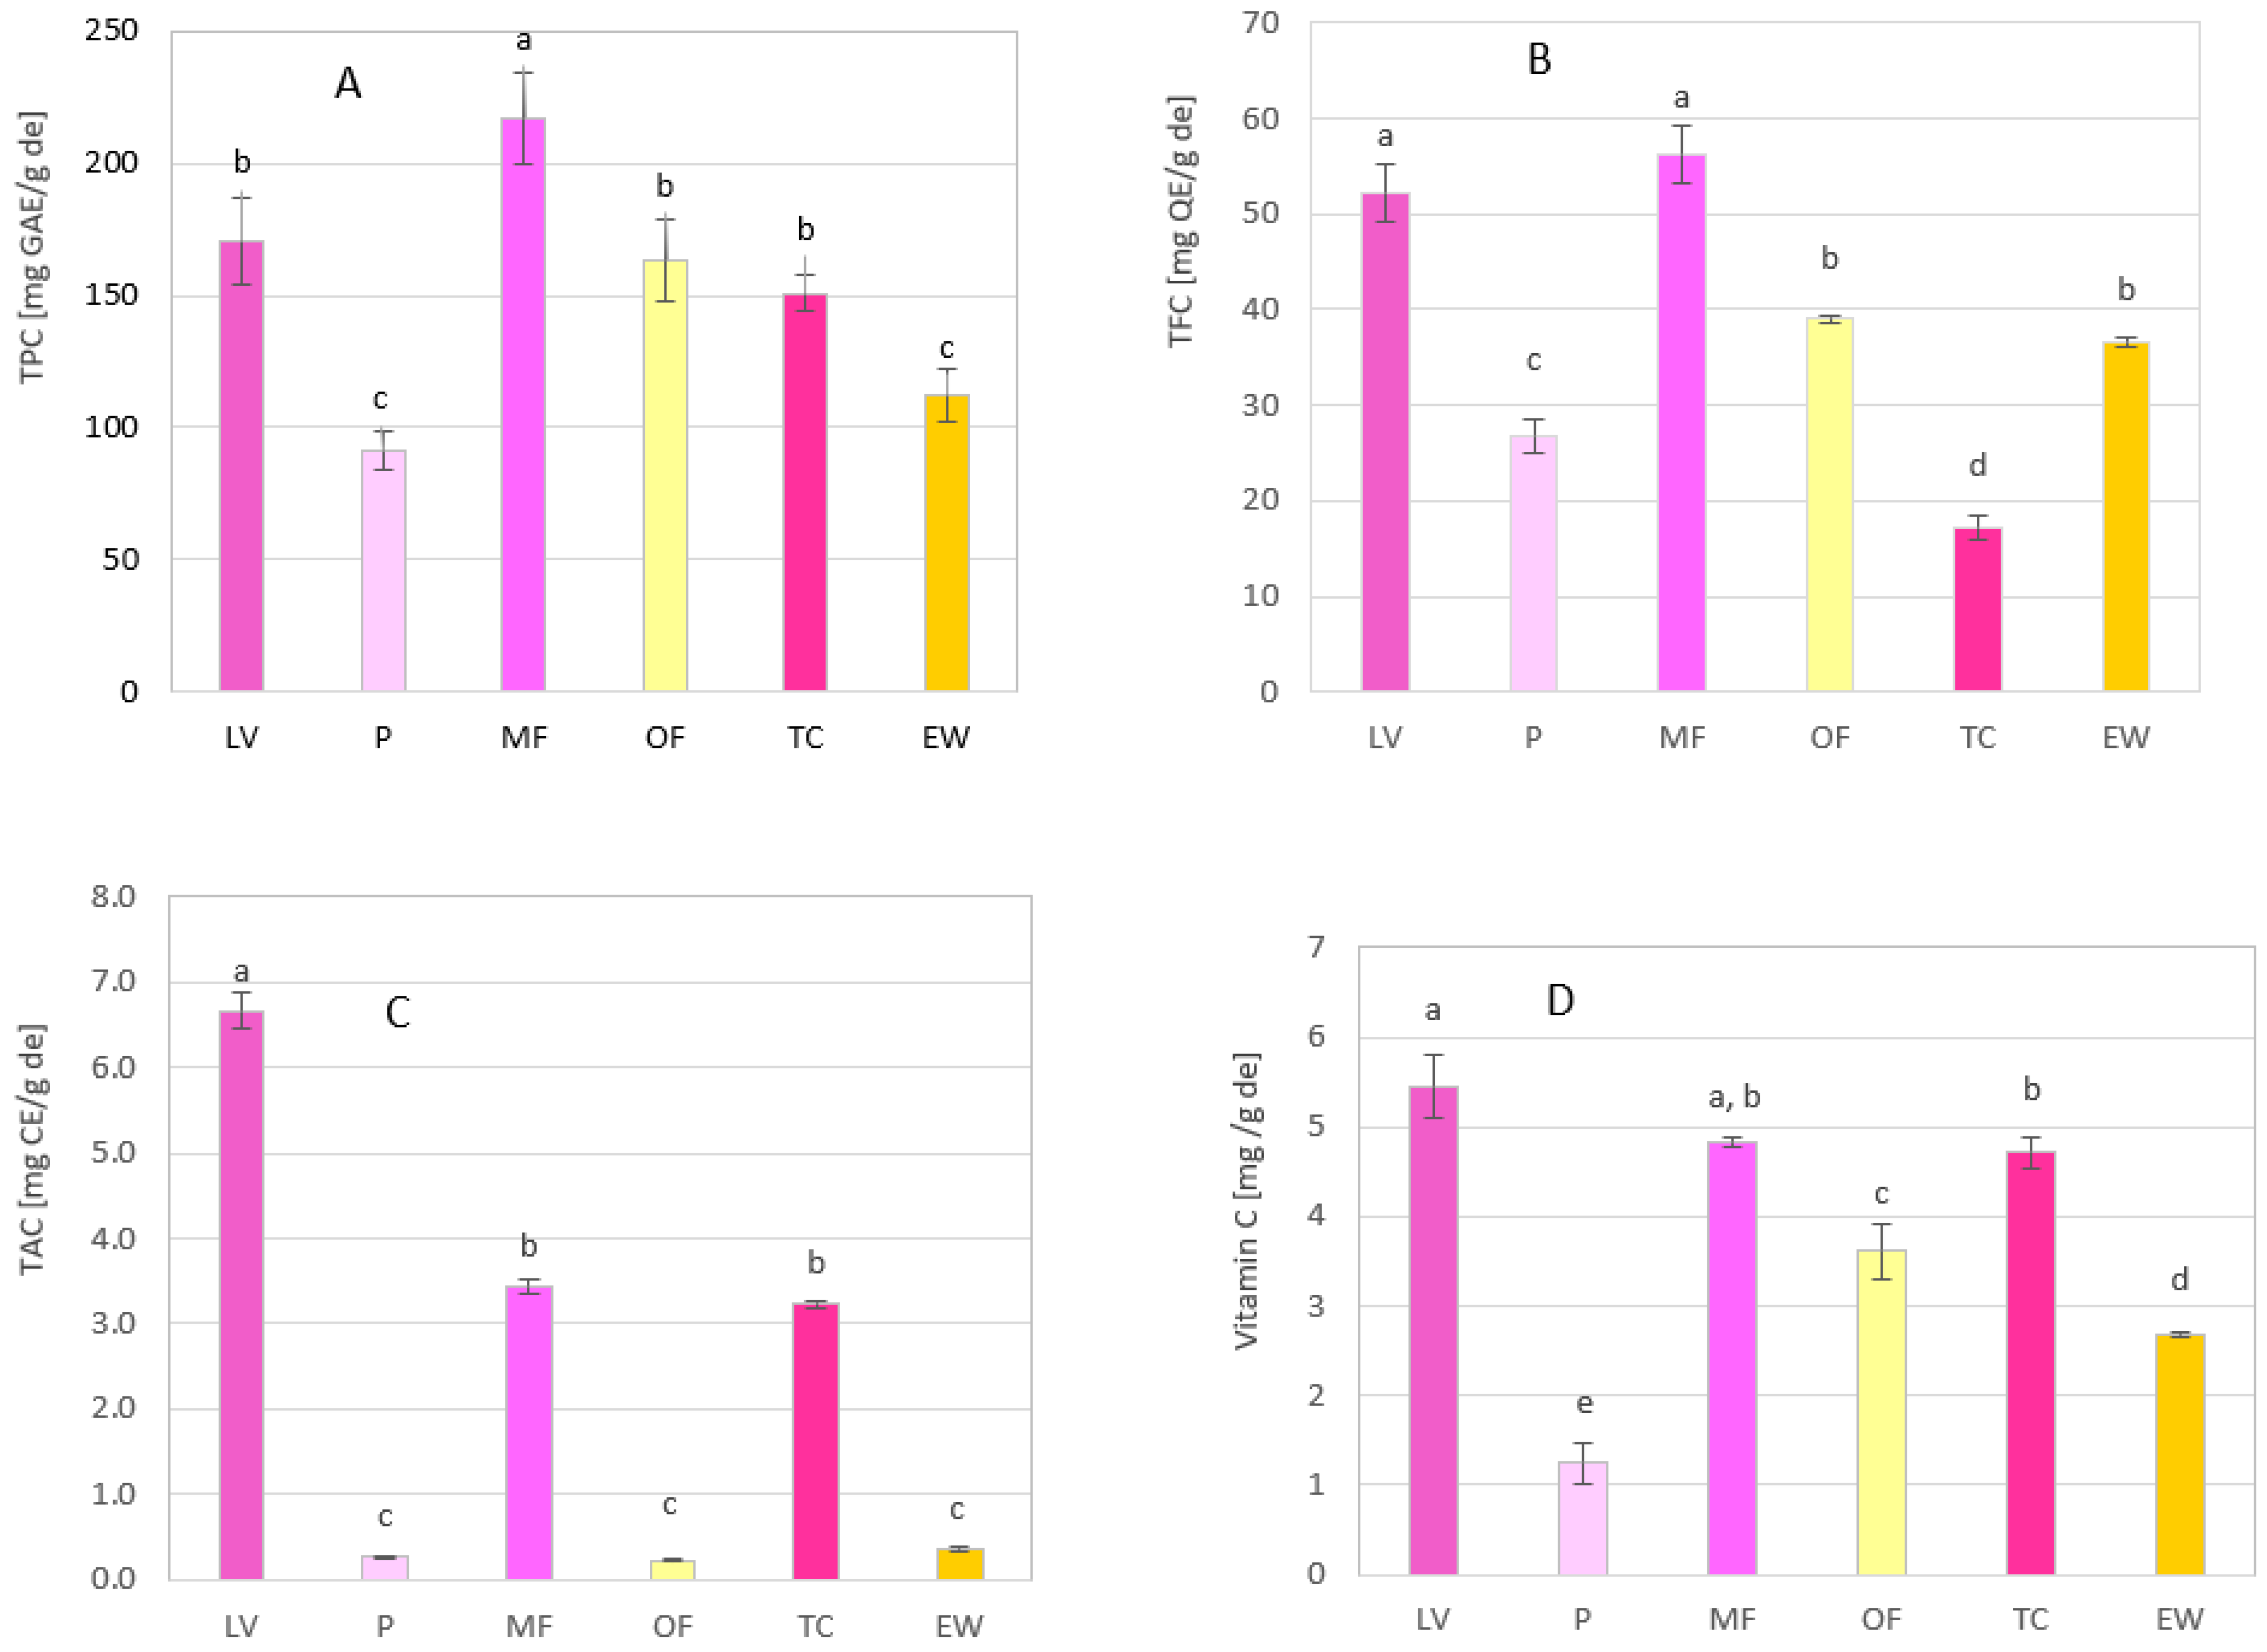
The results showed that methanol extracts of petals of the examined rose genotypes are abundant in phenolic compounds (Table 6 and Figure 4A). However, there was a high variability in total phenolics (TPC) among different genotypes, with MF exhibiting the highest TPC value (217 mg GAE/g de) and sample P the lowest TPC value (91.4 mg GAE/g de). When expressed per gram of fresh petals, the TPC ranged from 8.19 mg GAE/g fw in sample P to 21.5 mg GAE/g fw in MF. The results for previously tested methanol extracts of R. brunonii, R. baurboniana and R. damascena (254 mg GAE/g de, 178 mg GAE/g de and 145 mg GAE/g de, respectively) [41], as well as for ethanol extracts of nine cultivars of R. × hybrida (7.99–29.79 mg/g fw) [42] were very similar to those obtained for our samples. Moreover, it is noteworthy to mention that TPC of rose petals, particularly in MF, LV and OW samples, is similar to the levels found in phenolic-rich fruits, such blackberry and blueberry, while being much higher than in vegetables, such as carrot and tomato [43].
Flavonoids are a diverse subclass of plant polyphenols, naturally occurring in various plant-based foods and beverages. Their chemical structure is characterized by two aromatic rings (A and B) linked with a three-carbon chain, forming a C6-C3-C6 structure. Flavonoids play essential roles in plants, such as coloring the flowers and fruits and acting as antioxidants to protect plants from UV radiation and environmental stressors [44]. The results of total flavonoids (TFC) obtained for the examined extracts ranging from 17.3 mg QE/g de to 56.3 mg QE/g de and decreasing in the following order: MF > LV > OF > EW > P > TC (Table 6 and Figure 4B). If expressed per gram of fresh petals, the TFC ranged from 1.61 mg QE/g fw to 5.58 mg QE/g fw. The similar content of total flavonoids was found previously in ethanol–water extract of petals of white rose (23.7 mg catechin equivalents/g de) [45], as well as in ethanol extracts of nine cultivars of R. × hybrida (0.786–5.31 mg catechin equivalents/g fw) [42]. If the TFC and TPC results are compared, it is evident that the TFC of each sample is considerably lower than its TPC. This indicates that only a small portion of the TPC is attributed to flavonoids, while the extracts also contain significant amounts of phenolic compounds from other classes.
Anthocyanins are a subgroup of flavonoids and represent water-soluble pigments responsible for the red, purple, blue and violet colors found in many fruits, vegetables, flowers and other plants. Due to their vibrant and diverse range of colors, anthocyanins are important contributors to the visual appeal of various flowers. They are widely distributed in the food of plant origin and contribute to its potential health benefits. Various studies have indicated that anthocyanins from rose petals exhibit potent anti-inflammatory, antioxidant, anticancer, antimicrobial and antiallergic properties that can be utilized in functional foods and cosmetics [46].
As was expected, the results obtained for total anthocyanins (TAC) in this study (Table 6 and Figure 4C) showed that there was a strong correlation between flower color and the level of anthocyanins. Genotypes possessing pink/red/purple flowers (both complete petals and/or petal center), specifically LV, MF and TC, contain significantly higher levels of anthocyanins, as indicated by the values of 6.66 mg CE/g de, 3.43 mg CE/g de and 3.23 mg CE/g de, respectively. In contrast, genotype EW with orange flowers exhibited substantially lower levels of anthocyanins (0.355 µg CE/g de), while genotype OF with yellow flowers and P with white flowers had even lower levels of anthocyanins, with respective values of 0.230 µg CE/g de and 0.260 mg CE/g de. If expressed per gram of fresh petals, the TAC ranged from 0.019 mg CE/g fw to 0.517 mg CE/g fw. In a recently published study [42], the range of TAC values for ethanol extracts of nine cultivars of R. × hybrida was even wider, spanning from 0.006 to 5.03 mg CE/g fw. This indicates that in certain cultivars, particularly those with white and yellow flowers, anthocyanis may be entirely absent, while in others, especially those with intensively red colors, the content of anthocyanins can be up to 10 times greater than that found in the richest rose cultivar (MF) in our study. The existing literature indicates that red- and pink-colored varieties primarily contain glycosides of cyanidin, while varieties with orange flowers contain pelargonidin glycosides as major anthocyanins [46].
Vitamin C is an essential nutrient in the human diet, since it acts as a cofactor of the monooxygenase and dioxygenase enzymes which are necessary for several metabolic pathways such as collagen and catecholamine neurotransmitters biosynthesis [47]. Vitamin C also improves the absorption of non-heme iron and folic acid [47,48] and is a potent antioxidant. Most plants and animals synthesize ascorbic acid for their own requirement. However, humans cannot synthesize ascorbic acid due to the lack of gulonolactone oxidase. Hence, ascorbic acid has to be taken into the body through food. The current recommended daily allowance (RDA) for ascorbic acid is 90 mg for men and 75 mg for women [49]. The results obtained in the present study suggest that in general, methanol extracts of rose petals for all the investigated genotypes are rich in vitamin C (Table 6 and Figure 4D). The extremely high content of vit C was found in MF, TC and LV genotypes (479 µg/g fw, 438 µg/g fw and 424 µg/g fw, respectively), which is comparable to well-known sources of vit C, such as fruits and vegetables including strawberry, grapefruit, orange and broccoli [50]. Samples OF and EW had significantly lower vitamin C content (299 µg/g fw and 238 µg/g fw, respectively), with P having the lowest (111 µg/g fw).
In LC-MS/MS quantitative analysis of methanol extracts, the MRM mode was used as the acquisition method. This type of analysis provides high sensitivity and specificity, since only ions specific to targeted analytes are monitored. The results indicated that out of the 44 phenolic compounds targeted for quantification, only 14 were detected (Table 7). Quercetin 3-O-glycosides, specifically quercetin 3-O-glucoside, quercetin 3-O-galactoside, quercitrin (quercetin 3-O-rhamnoside) and rutin (quercetin 3-O-rutinoside), were identified as the predominant flavonoids in all the investigated samples. Peaks of quercetin 3-O-glucoside and quercetin 3-O-galactoside were overlapped in the chromatogram, thus it was only possible to quantify their total amount (quercetin 3-O-Glc + Gal). Flavonoid aglycones, catechin, quercetin and kaempferol were also present, but in significantly lower amounts. Among benzoic acid derivatives, considerable quantities of protocatechuic and gallic acids were identified, with levels ranging from 11.1 to 44.8 μg/g de. Chlorogenic and p-coumaric acids were the only hydroxycinnamic acids found in analyzed samples, although their quantity was very low (0.33–7.34 μg/g de). It is worth noting that the content of quinic acid, a non-phenolic intermediate in plant phenolics biosynthesis, was found to be very high in all the investigated samples, ranging from 17.5 mg/g de in the EW genotype to 36.8 mg/g de in TC. On the other hand, a number of compounds were not detected in any of the examined methanol extracts, specifically, 2,5-dihydroxybenzoic acid, epigallocatechin gallate, aesculetin, caffeic acid, vanillic acid, syringic acid, umbelliferone, scopoletin, ferulic acid, vitexin, sinapic acid, luteolin-7-O-glucoside, hyperoside, apiin, o-coumaric acid, myricetin, apigenin-7-O-glucoside, secoisolariciresinol, 3,4-dimethoxycinnamic acid, baicalin, daidzein, matairesinol, cinnamic acid, luteolin, genistein, apigenin, izorhamnetin, chrysoeriol, baicalein and amentoflavone.
In the study of Mikangi et al. [15], the dominant flavonoids in 120 taxa of subgenus Rosa were kaempferol 3-O-glycosides and quercetin 3-O-glycosides, which were present in large amounts. These results partially correspond to the results of our study, since we found large amounts of quercetin 3-O-glycosides, but much lower amounts of kaempferol 3-O-glycosides.
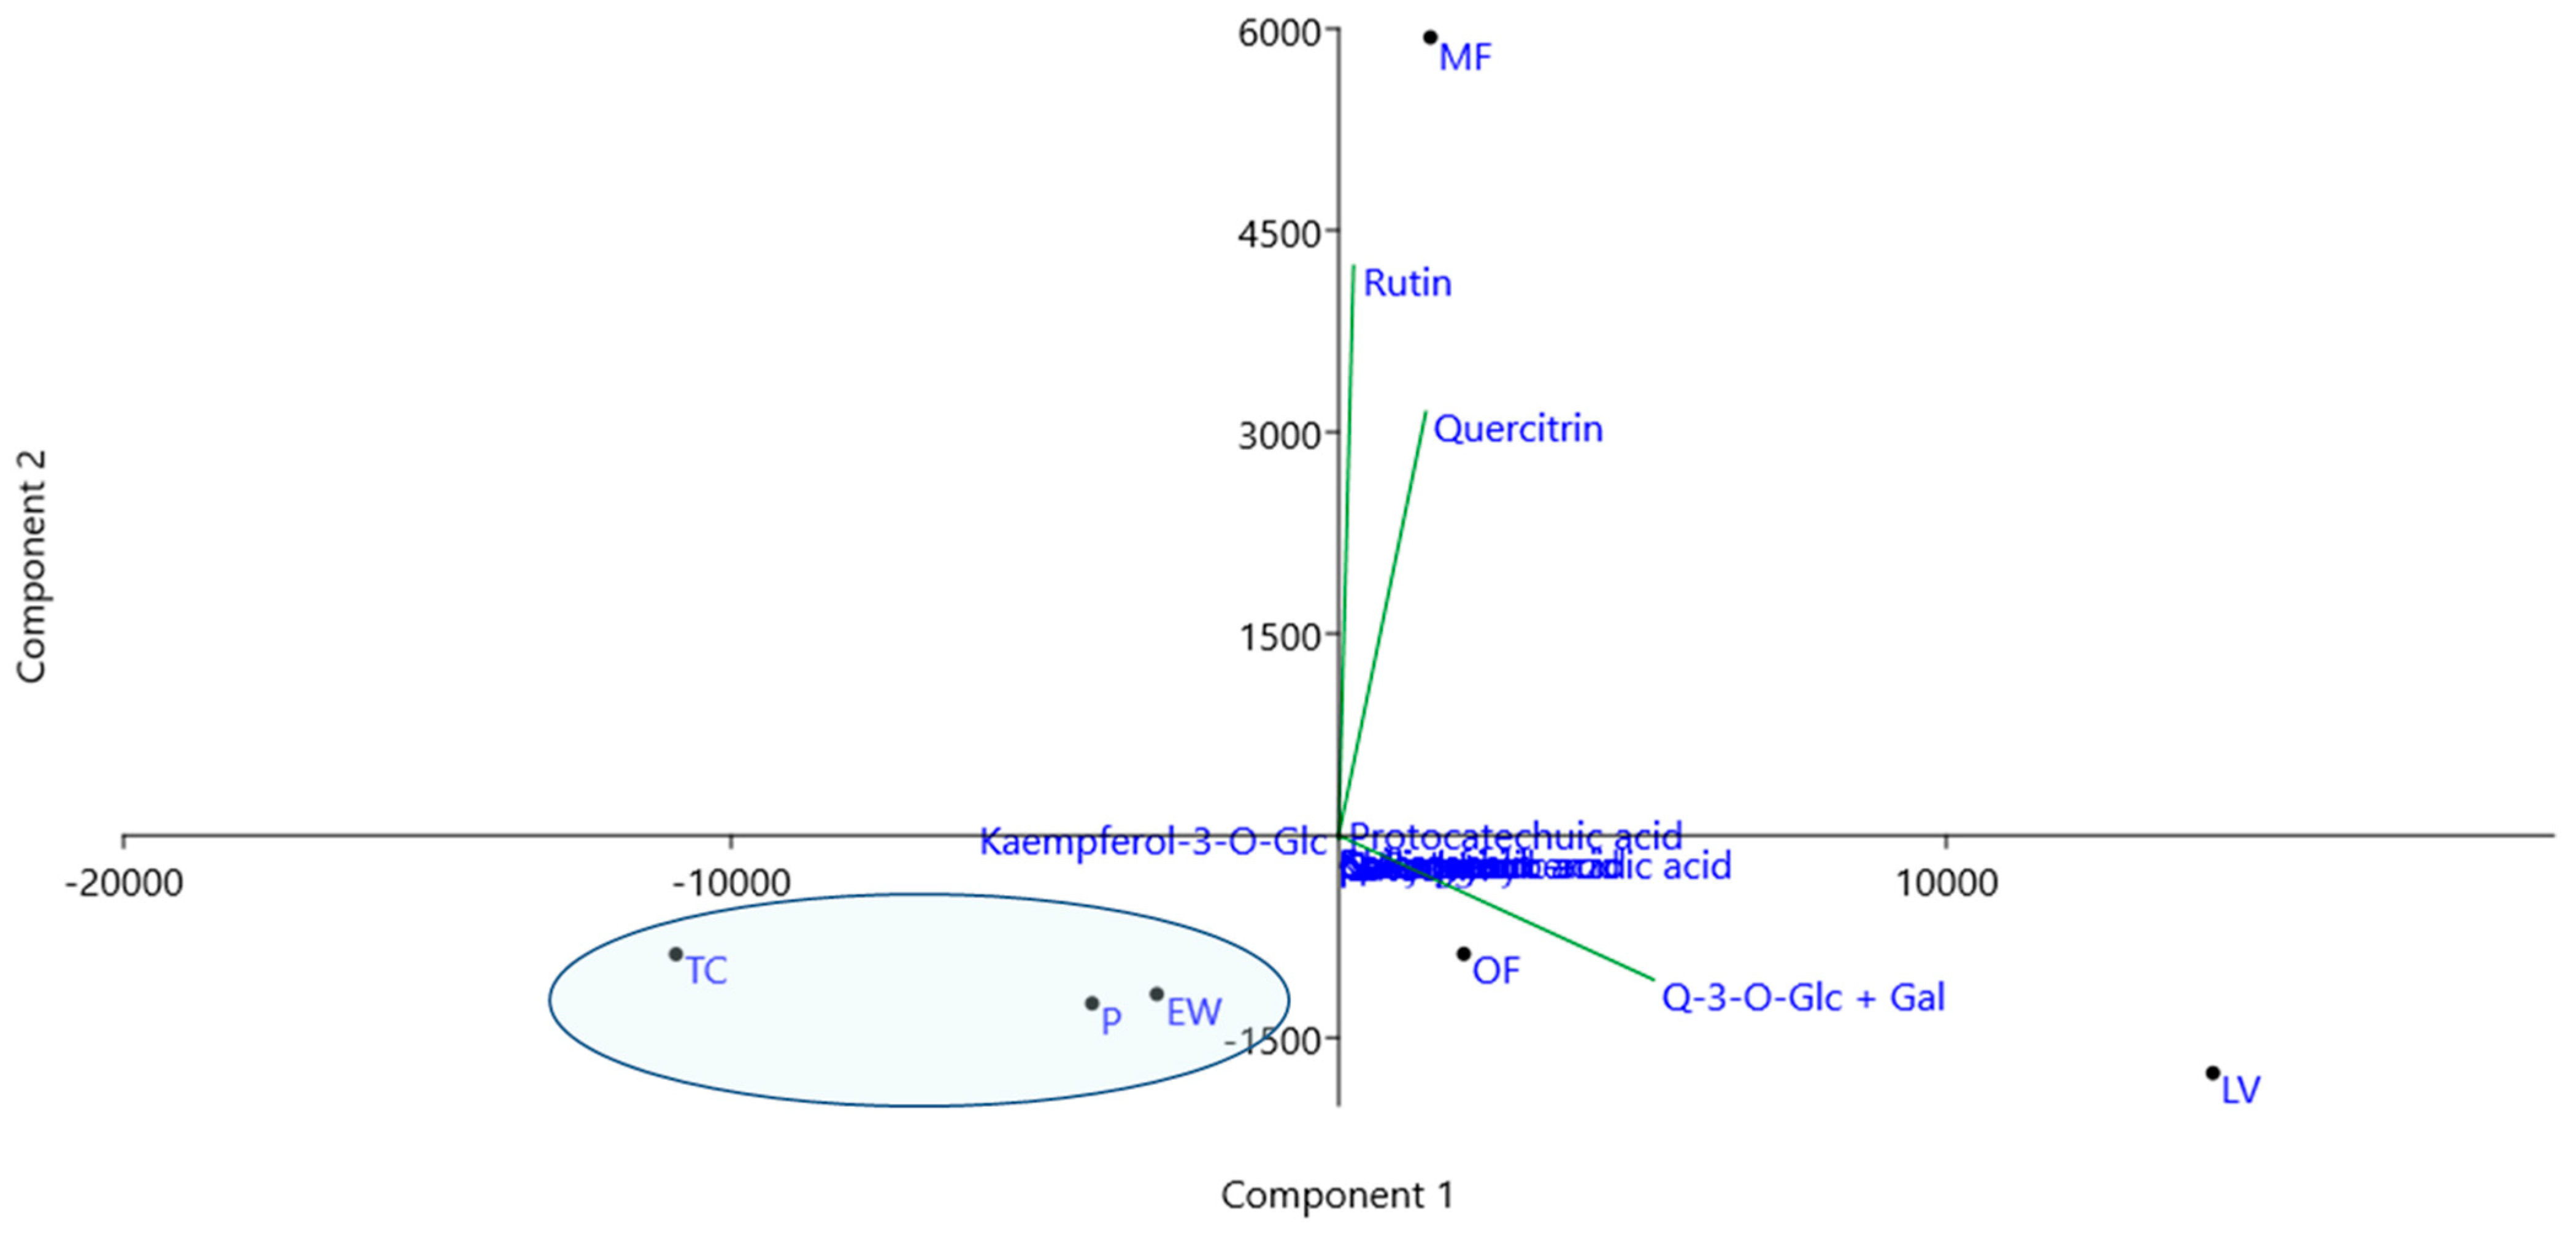
The principal component analysis (PCA) was performed on the dataset of 14 phenolic compounds that were determined in methanol extracts (Figure 5). The analysis revealed a certain level of grouping or similarity among the individual samples, which could mainly be attributed to the differences in the content of quercetin glycosides, namely quercitrin, quercetin-3-O-Glc + Gal and rutin. Samples P, TC and EW exhibited negative loadings in both PC1 and PC2, which indicated a relatively low content of all quercetin glycosides. Conversely, the remaining three samples (LV, MF and OF) were found to be rich in these compounds. Of note, the sample MF stood out from the others as it contains a much higher amount of rutin than all other samples, as well the highest level of quercitrin. In contrast, LV was separated from the rest due to its notably higher content of quercetin-3-O-Glc + Gal.

3.4. Antioxidant Activity of Methanol Extracts of Rose Petals

The antioxidant potential of methanol extracts of rose petals was estimated by determining the ability of the extracts to neutralize DPPH radical (DPPH assay) and to reduce Fe3+ to Fe2+ (FRAP assay). Both assays are based on a single electron transfer mechanism. In the DPPH assay, DPPH is a stable free radical with an unpaired electron. When antioxidants are added to the DPPH solution, they donate electrons to the DPPH radical, reducing it to a stable molecule. This reduction involves a single electron transfer from the antioxidant to the DPPH radical. Similarly, in the FRAP assay, a reagent containing a ferric ion (Fe3+) is reduced to a ferrous ion (Fe2+) by single electron transfer from the antioxidants. Both assays are commonly used to measure the antioxidant capacity of compounds or extracts, as they provide information about the ability of these substances to donate electrons and neutralize free radicals, which is a key aspect of their antioxidant activity.
Overproduction of free radicals in the body can lead to oxidative stress. Oxidative stress can have detrimental effects on cells, tissues and organs, as the reactive nature of free radicals can lead to damage to important biomolecules such as lipids, proteins and DNA, leading to cellular dysfunction and potential tissue or organ damage. This damage, if not adequately repaired, can contribute to a wide range of health issues, including aging and development and the progression of inflammatory conditions, atherosclerosis and various chronic diseases, including cardiovascular diseases, neurodegenerative disorders (such as Alzheimer’s and Parkinson’s) and cancer [38]. Maintaining a healthy balance between free radicals and antioxidants is crucial for preventing or minimizing oxidative stress and its associated negative effects. This balance can be achieved through a combination of a balanced diet rich in antioxidants, regular physical activity and avoidance of excessive exposure to environmental toxins and stressors [51]. A greater capacity of any food or beverage to neutralize free radicals, particularly during oxidative stress, significantly enhances their health-promoting properties.
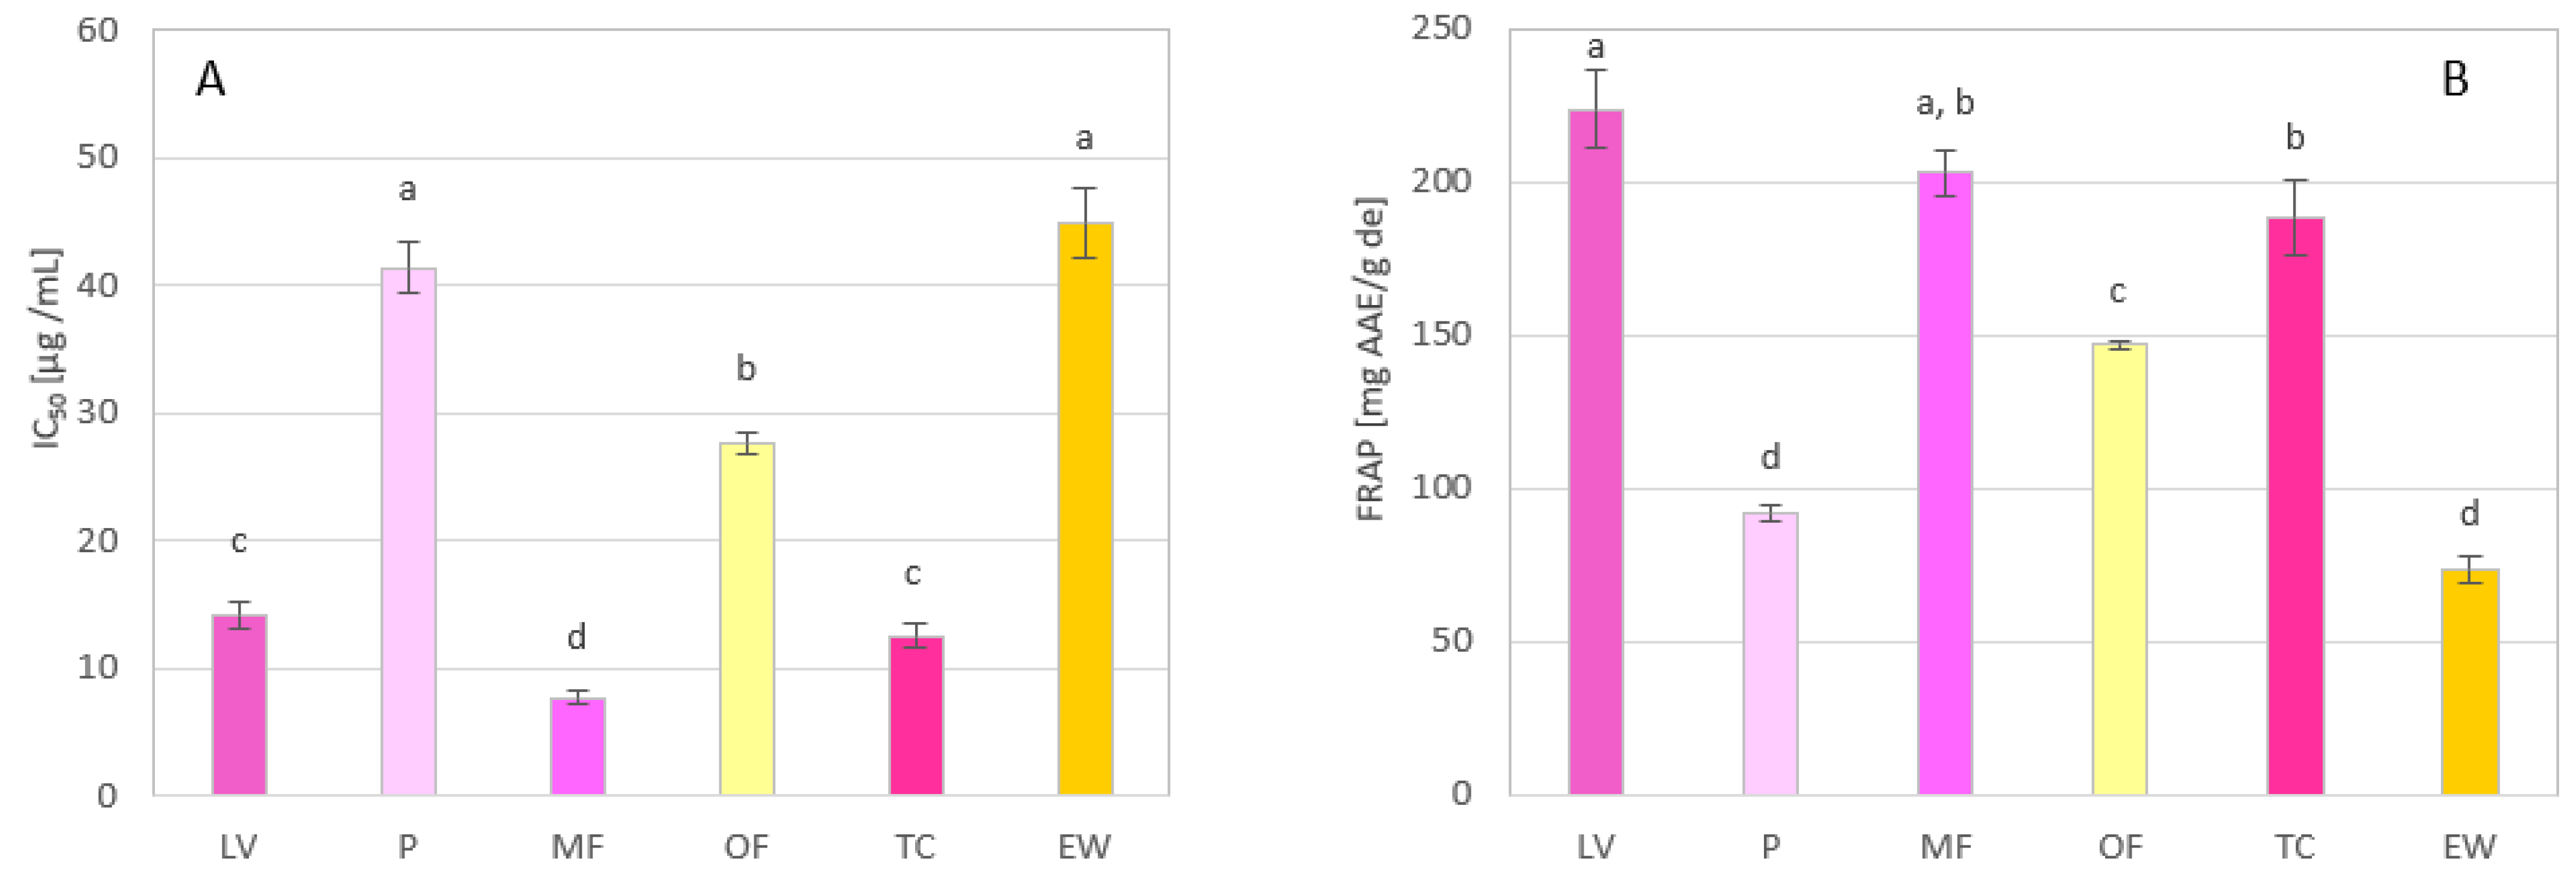
All rose petal extracts investigated in the present study expressed very high antioxidant activity (Table 8 and Figure 6). There was a strong correlation between the results obtained from the two antioxidant assays applied (R = −0.994). The extracts of MF, LV and TC genotypes were the strongest antioxidants (in DPPH assay IC50 values were 9.24 µg/mL, 11.45 µg/mL and 15.78 µg/mL, and in FRAP assay the antioxidant potential was 220 mg AAE/g de, 227 mg AAE/g de and 189 mg AAE/g de, respectively), with the activity comparable to synthetic antioxidant butylated hydroxyanisole (BHA) widely used in the food industry (IC50 in DPPH assay is 11.08 µg/mL) [29] and much higher than the activity of vit C, which is also known as a potent antioxidant (IC50 in DPPH assay is 30.0 µg/mL) [41]. The extracts of the OF cultivar exhibited significantly lower activity (IC50 value in DPPH assay was 27.07 µg/mL and antioxidant potential in FRAP assay was 148 mg AAE/g de) than MF, LV and TC, but very similar to that of previously tested methanol extracts of R. brunonii, R. baurboniana and R. damascene (IC50 values in DPPH assay were 35.2 µg/mL, 25.0 µg/mL and 21.4 µg/mL, respectively) [41]. Among all the samples, P and EW had the lowest antioxidant activity (in DPPH assay IC50 values were 37.8 µg/mL and 42.5 µg/mL, and in the FRAP assay, the antioxidant potential was 91.9 mg AAE/g de and 74.6 mg AAE/g de, respectively).
High antioxidant capacity was expected for the extracts of rose genotypes investigated in the present study, considering that they are rich in polyphenol compounds and vitamin C. Plant phenolics as well as vitamin C are powerful antioxidants because they act as reducing agents. By donating electrons, they scavenge harmful free radicals, while they themselves undergo transformation into a radical form that is relatively stable and unreactive [52].
The antioxidant potential of rose species has also been investigated in previous studies in the 2,2′-azino-bis(3-ethylbenzothiazoline-6-sulphonic acid (ABTS) assay. The results from Vinokur et al. [5] revealed that rose petal teas of R. damascena, and 11 different cultivars of R. × hybrida (Floribunda, Polyantha, English rose, Hybrid tea) expressed remarkable antioxidant capacities in the ABTS assay, similar to that of green tea, which is renowned for its potent antioxidant properties. Additionally, strong antioxidant activity was confirmed for ethanol extract of petals of R × hybrida cultivar with white flowers (651 mg of ascorbic acid equivalents/g of dry extract, in ABTS assay) [19].

3.5. Neuroprotective Activity of Methanol Extracts of Rose Petals

In order to estimate the neuroprotective activity of the rose petal extracts, their ability to inhibit acetylcholinesterase (AChE) was determined. This approach is a common method used in pharmacological and natural product research to evaluate the potential therapeutic benefits of various compounds or extracts.
AChE is a key enzyme in cholinergic systems, predominantly located at postsynaptic neuromuscular junctions in both muscle and nerve tissues. Its primary role is the swift hydrolysis or breakdown of acetylcholine (ACh), an endogenous neurotransmitter, into acetic acid and choline. Thus, AChE plays a critical role in the regulation of ACh level. A reduction in Ach level can have detrimental effects on cognitive functions, including learning, memory, behavior and emotional responses, which is all often observed in neurodegenerative conditions such as Alzheimer’s disease and other types of dementia. Therefore, current treatments of dementia include the use of AChE inhibitors, such as rivastigmine, galantamine and donepezil. However, these drugs are often associated with side effects including gastrointestinal issues, fatigue, cramps and sinus node dysfunction [53]. Therefore, there is a continuous search for new AChE inhibitors that are effective but with fewer adverse effects. Various phenolic compounds from plants with different structural characteristics were reported as AChE inhibitors [54]. Since most plant phenolics besides AChE inhibitory activity generally express additional pharmacological properties, particularly antioxidants, it enables them to be applied as multi-target strategies to combat the onset and progression of Alzheimer’s disease.
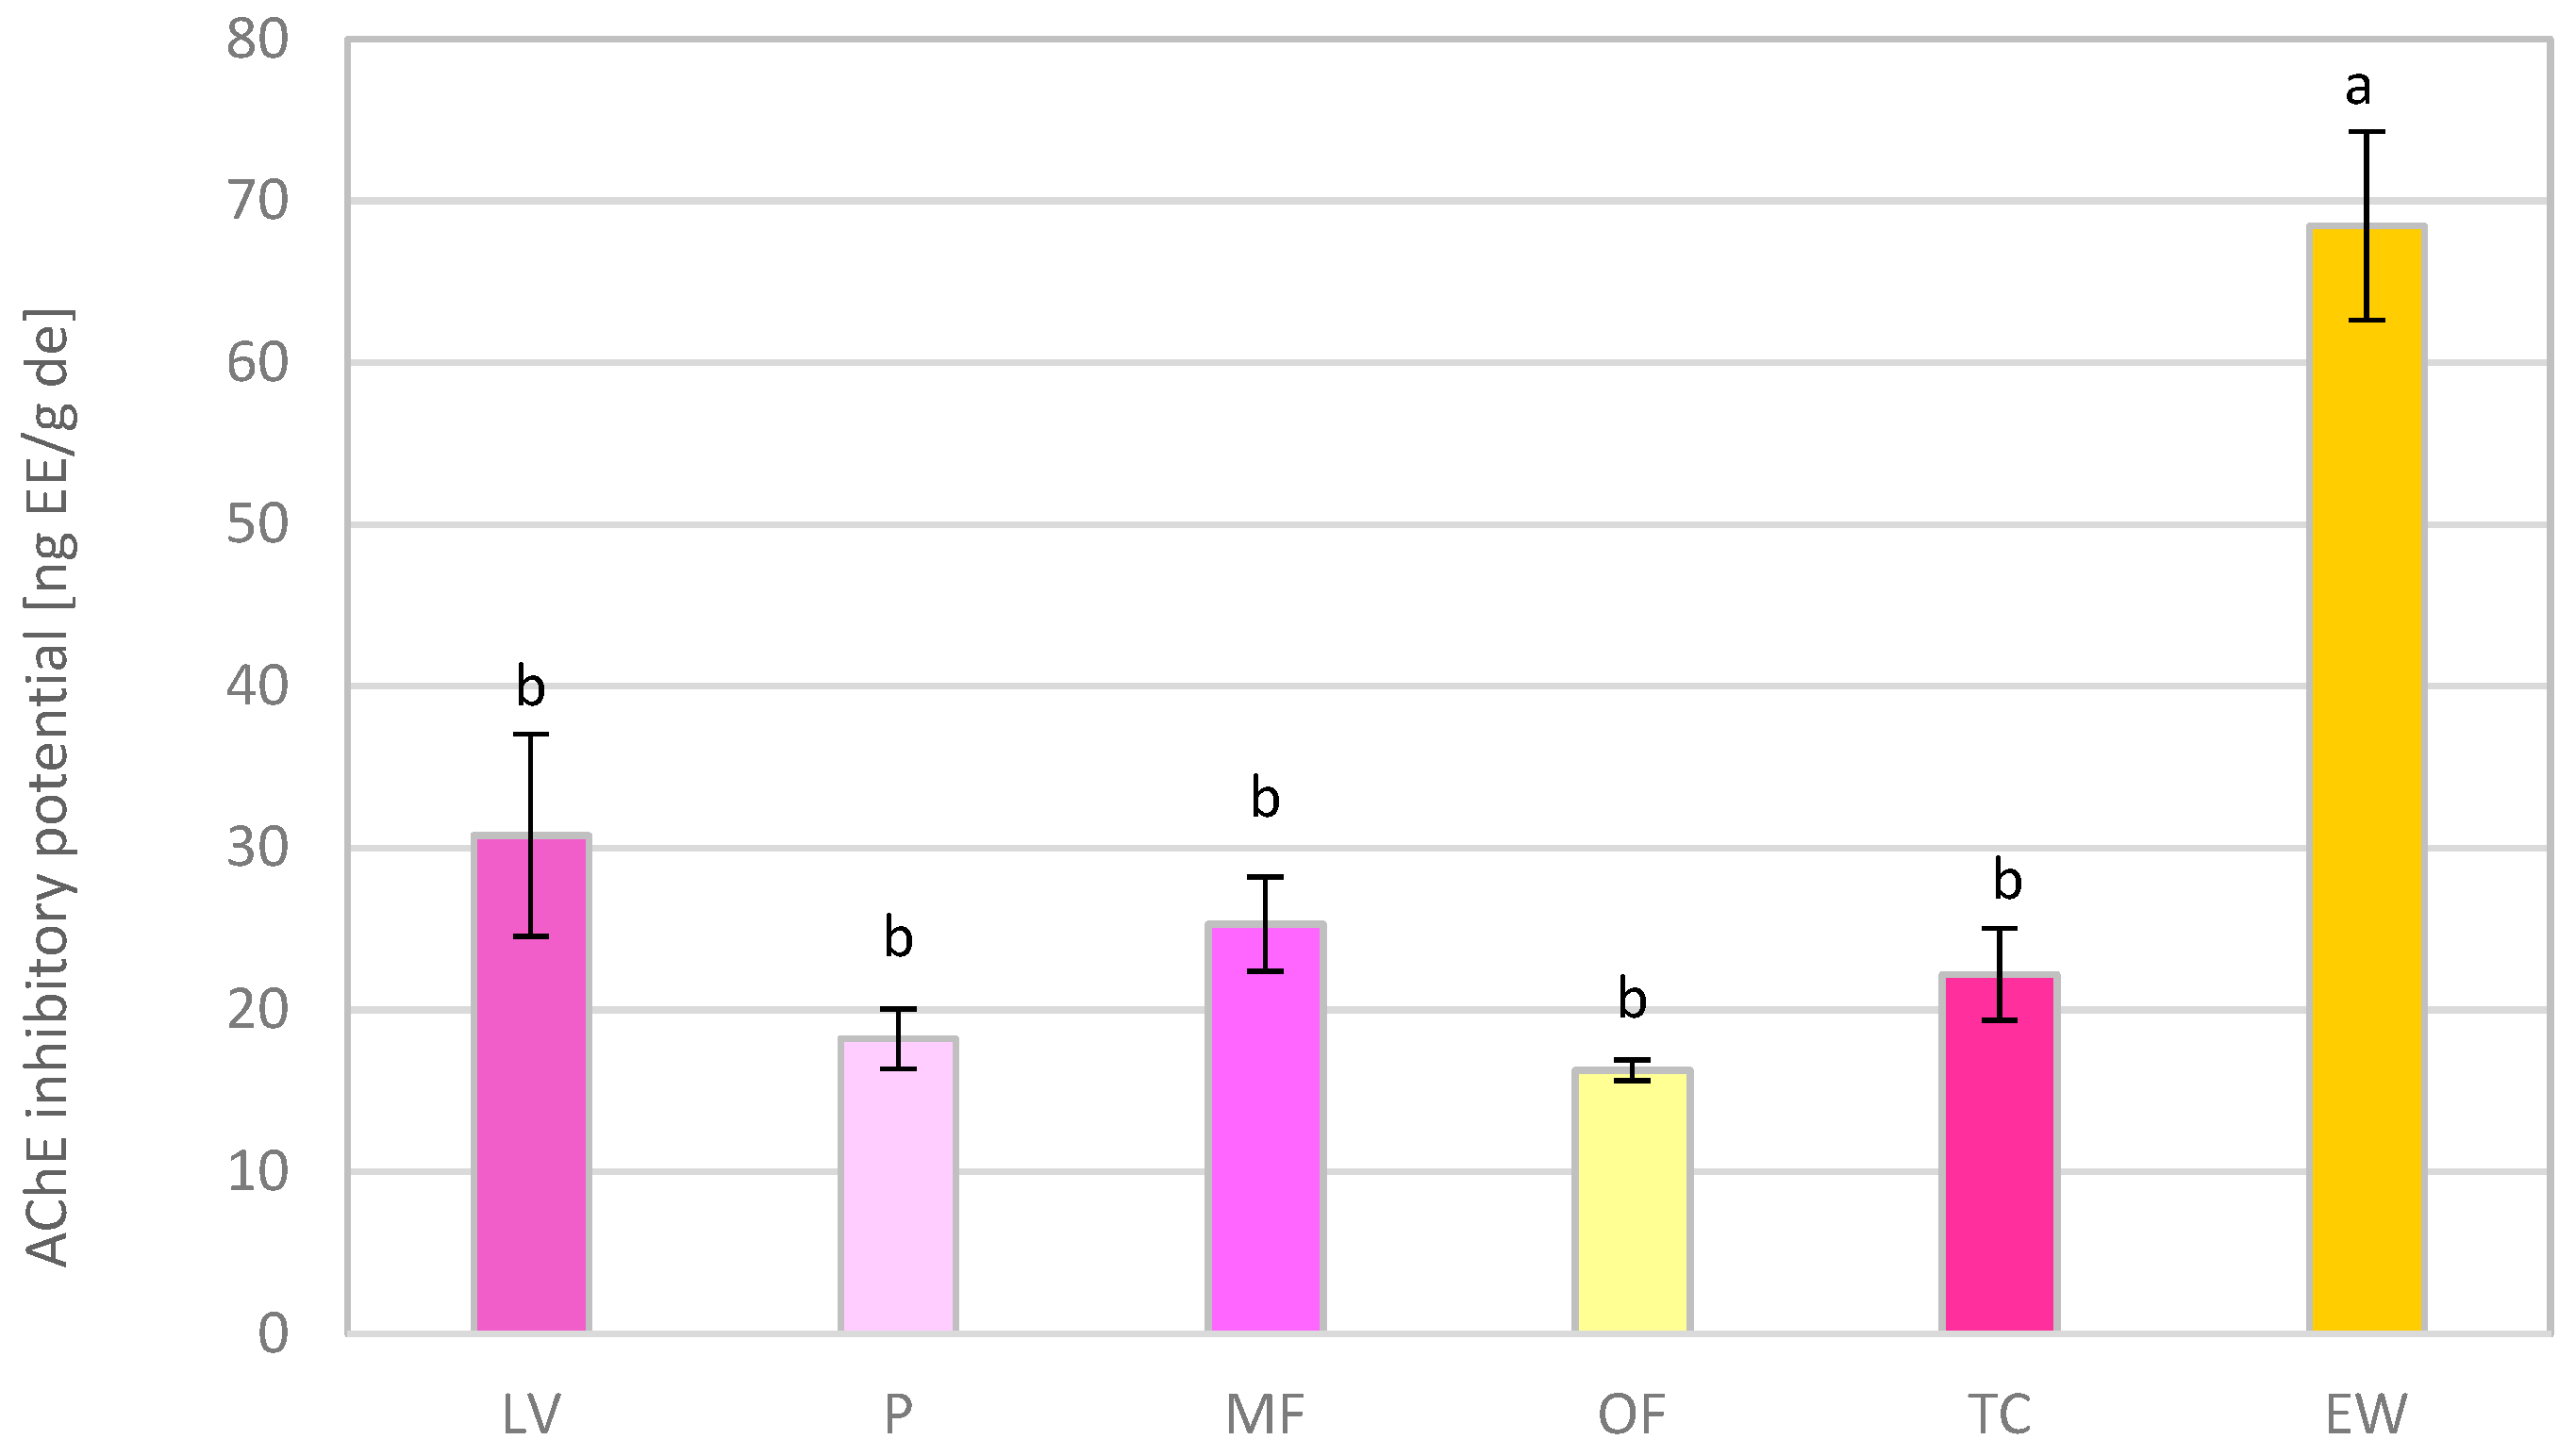
To investigate AChE inhibitory activity (anti-AChE activity), we applied the most common—Ellman’s method, with some modifications. The results obtained for the tested samples were compared to the activity of the alkaloid physostigmine (also known as eserine), which is a well-known and highly potent AChE inhibitor. The comparison was expressed in terms of nanograms of eserine equivalents per gram of dry extract. The AChE inhibitory activity of the rose petal extracts at a concentration of 50 µg/mL was considerable and ranged from 41.4% to 69.4%, indicating that these extracts have the potential to inhibit AChE to varying extents. When expressed in eserine equivalents, anti-AChE activity was in the range of 16.3–68.5 ng EE/g de (Table 8 and Figure 7). The highest activity was exhibited by the extract of EW genotype (68.5 ng EE/g de), indicating its potential application in prevention of Alzheimer’s disease and other types of dementia. All other extracts expressed significantly lower levels of activity (16.3–30.8 ng EE/g de). Upon analyzing the results of the chemical composition of the investigated extracts, no obvious differences were observed that could pinpoint the specific compounds responsible for the elevated AChE inhibitory activity. It is certainly required in further investigations to elucidate and identify the exact chemical constituents within the EW extract that are responsible for substantial in vitro anti-AChE activity. Conversely, it is noteworthy that the EW sample exhibited the lowest antioxidant potential among the tested extracts. This suggests that there is no correlation between the antioxidant and anti-AChE activity of the samples, likely indicating that different individual constituents of the extracts are responsible for each activity.
Until now, anti-AChE activity of R × hybrida was not investigated. Esmaeili et al. [55] reported that 80% methanol extracts of R. canina and R. damascena express very low anti-AChE activity (31.3% and 10.9% at a concentration of 300 µg/mL, respectively), while 50% ethanol extract of R. damascena from Iran showed considerable activity (IC50 value of 93.10 μg/mL) [56]. Furthermore, in the study by Tarbiat et al. [57], ethanolic extracts of five cultivars of R. damascena from Turkey showed a high concentration-dependent AChE inhibitory effect (IC50 value was in the range from 3.9 μg/mL–32.0 μg/mL), which is comparable to the results obtained for samples of R × hybrida in the present study.
Future research directions should utilize the vast rose gene pool available worldwide, represented in species and cultivar richness, as well as intraspecific, interspecific and intergenus hybridization possibilities. Mutual involvement of breeders/geneticists, landscape architects, horticulturalists and biochemists can lead to the selection of ornamental edible roses with both sweet fruity flavors and nutrient richness. Rethinking rose breeding goals should take into account global environmental challenges, food insecurity and gardening trends. Aligning with the European Green Deal, rose breeding goals must integrate both producers’ and users’ demands to create cultivars that shall concomitantly foster the Sustainable Developmental Goals.

4. Conclusions

While roses continue to be predominantly utilized as ornamental plants, there is a growing trend towards their utilization as functional foods. This trend can be supported by the findings of our study. All the investigated cultivars are rich sources of phenolic compounds and vit C, which have potential health benefits due to their antioxidant and neuroprotective activity, and have a favorable aroma and taste for human consumption. They are characterized by large amounts of quercetin 3-O-glycosydes and quinic acid.
The ‘Marija Frayla’ cultivar, characterized by the highest number of flowering shoots, double red purple flowers with a significantly greater number of larger petals, accompanied with the highest level of total phenolic compounds and the strongest antioxidant activity, represents the most valuable amendment to the production of novel functional food products and dietary supplements. On the other hand, ‘Eveline Wild’ had no notable flowering shoot and flower characteristics, but exhibited the strongest anti-AChE activity, that might be applied in the prevention of Alzheimer’s disease and other types of dementia. The ‘Pear’ cultivar possesses the lowest content of phenolic compounds and the lowest biological activity, but it has a pleasant, mild and fruity (pear-like) aroma. As such, it can be considered as a seasoning or condiment for various dishes and cuisines in everyday eating.

Supplementary Materials

The following supporting information can be downloaded at: https://www.mdpi.com/article/10.3390/horticulturae9101082/s1, Table S1: Human perception of floral scent in the investigated rose cultivars.

Author Contributions

Conceptualization, N.S. and M.L. (Marija Lesjak); methodology, M.L. (Marija Lesjak), D.O. and N.Ž.; software, N.S., D.O. and N.Ž; validation, N.Ž. and D.O.; investigation, B.B.T. and N.Ž.; resources, B.B.T.; data curation, N.S. and N.Ž.; writing—original draft preparation, N.S.; writing—review and editing, M.L. (Marija Lesjak), B.B.T. and M.L. (Mirjana Ljubojević); project administration, M.L. (Mirjana Ljubojević); funding acquisition, M.L. (Mirjana Ljubojević) and B.B.T. All authors have read and agreed to the published version of the manuscript.

Funding

This research was funded and conducted within the frame of a four-year project entitled ‘Biochemically assisted garden roses’ selection aiming towards the increased quality and marketability of producers in Vojvodina’, grant number 142-451-3153/2022-01/01, financed by the Provincial Secretariat for Higher Education and Scientific Research, Autonomous Province of Vojvodina, Republic of Serbia.

Data Availability Statement

The datasets used and/or analyzed during the current study are available from the corresponding author on reasonable request.

Conflicts of Interest

Because of the perception of a conflict of interest and in the interest of full transparency, authors Biljana Božanić Tanjga is disclosing the relationship with Breeding Company ‘Pheno Geno Roses’. The funder, the Provincial Secretariat for Higher Education and Scientific Research, Autonomous Province of Vojvodina, Republic of Serbia and employees of the Breeding company ‘Pheno Geno Roses’ had no influence on the trial design, results acquisition, data processing or interpretation and delivery of the conclusions.

References

  1. Khosh-Khui, M.; Teixeira da Silva, J. In vitro culture of the Rosa species. In Floriculture, Ornamental and Plant Biotechnology: Advances and Topical Issues Vol. II, 1st ed.; Teixeira da Silva, J., Ed.; Global Science Books: London, UK, 2006; pp. 514–526. [Google Scholar]
  2. Moein, M.; Zarshenas, M.M.; Delnavaz, S. Chemical composition analysis of rose water samples from Iran. Pharm. Biol. 2014, 52, 1358–1361. [Google Scholar] [CrossRef] [PubMed]
  3. Jabbarzadeh, Z.; Khosh-Khui, M. Factors affecting tissue culture of Damask rose (Rosa damascena Mill.). Sci. Hortic. 2005, 105, 475–482. [Google Scholar] [CrossRef]
  4. Baydar, H.; Baydar, N.G. The effects of harvest date, fermentation duration and Tween 20 treatment on essential oil content and composition of industrial oil rose (Rosa damascena Mill.). Ind. Crop. Prod. 2005, 21, 251–255. [Google Scholar] [CrossRef]
  5. Vinokur, Y.; Rodov, V.; Reznick, N.; Goldman, G.; Horev, B.; Umiel, N.; Friedman, H. Rose petal tea as an antioxidant rich beverage: Cultivar effects. J. Food Sci. Educ. 2006, 71, 42–47. [Google Scholar] [CrossRef]
  6. Mlcek, J.; Rop, O. Fresh edible flowers of ornamental plants–A new source of nutraceutical foods. Trends Food Sci. Technol. 2011, 22, 561–569. [Google Scholar] [CrossRef]
  7. Vukosavljev, M.; Stranjanac, I.; van Dongen, B.W.P.; Voorrips, R.E.; Miric, M.; Bozanic Tanjga, B.; Arens, P.; Smulders, M.J.M. A novel source of food–garden rose petals. Acta Hortic. 2023, 1362, 165–171. [Google Scholar] [CrossRef]
  8. Mawarni, E.; Ginting, C.N.; Chiuman, L.; Girsang, E.; Handayani, R.A.S.; Widowati, W. Antioxidant and elastase inhibitor potential of petals and receptacle of rose rlower (Rosa damascena). Pharm. Sci. Res. (PSR) 2020, 7, 105–113. [Google Scholar]
  9. Hegde, A.S.; Gupta, S.; Sharma, S.; Srivatsan, V.; Kumari, P. Edible rose flowers: A doorway to gastronomic and nutraceutical research. Food Res. Int. 2022, 162, 111977. [Google Scholar] [CrossRef]
  10. Mahboubi, M.; Kazempour, N.; Khamechian, T.; Fallah, M.H.; Kermani, M.M. Chemical composition and antimicrobial activity of Rosa damascena Mill essential oil. J. Biol. Act. Prod. Nat. 2011, 1, 19–26. [Google Scholar]
  11. Yousefi, B.; Jaimand, K. Chemical variation in the essential oil of Iranian Rosa damascena landraces under semi-arid and cool conditions. Int J Hortic Sci Technol 2018, 5, 81–92. [Google Scholar]
  12. Yaghoobi, M.; Farimani, M.M.; Sadeghi, Z.; Asghari, S.; Rezadoost, H. Chemical analysis of Iranian Rosa damascena essential oil, concrete, and absolute oil under different bio-climatic conditions. Ind. Crop. Prod. 2022, 187, 115266. [Google Scholar] [CrossRef]
  13. Moein, M.; Karami, F.; Tavallali, H.; Ghasemi, Y. Composition of the essential oil of Rosa damascena Mill. from south of Iran. Iran. J. Pharm. Sci. 2010, 6, 59–62. [Google Scholar]
  14. Shohayeb, M.; Abdel-Hameed, E.S.S.; Bazaid, S.A.; Maghrabi, I. Antibacterial and antifungal activity of Rosa damascena MILL essential oil, different extracts of rose petals. Glob. J. Pharmacol 2014, 8, 1–7. [Google Scholar]
  15. Mikanagi, Y.; Yokoi, M.; Ueda, Y.; Saito, N. Flower flavonol and anthocyanin distribution in subgenus Rosa. Biochem. Syst. Ecol. 1995, 23, 183–200. [Google Scholar] [CrossRef]
  16. Cai, Y.-Z.; Xing, J.; Sun, M.; Zhan, Z.Q.; Corke, H. Phenolic antioxidants (hydrolyzable tannins, flavonols, and anthocyanins) identified by LC-ESI-MS and MALDI-QIT-TOF MS from Rosa chinensis flowers. J. Agric. Food Chem. 2005, 53, 9940–9948. [Google Scholar] [CrossRef]
  17. Schmitzer, V.; Stampar, F. Changes in anthocyanin and selected phenolics in “KORcrisett” rose flowers due to substrate pH and foliar application of sucrose. Acta Hortic. 2010, 870, 89–96. [Google Scholar] [CrossRef]
  18. Schmitzer, V.; Veberic, R.; Osterc, G.; Stampar, F. Changes in the phenolic concentration during flower development of rose ‘KORcrisett’. J. Am. Soc. Hortic. Sci. 2009, 134, 491–496. [Google Scholar] [CrossRef]
  19. Yon, J.M.; Kim, Y.B.; Park, D. The ethanol fraction of white rose petal extract abrogates excitotoxicity-induced neuronal damage in vivo and in vitro through inhibition of oxidative stress and proinflammation. Nutrients 2018, 10, 1375. [Google Scholar] [CrossRef]
  20. Vanderjagt, T.J.; Ghattas, R.; VanderJagt, D.J.; Crossey, M.; Glew, R.H. Comparison of the total antioxidant content of 30 widely used medicinal plants of New Mexico. Life Sci. 2002, 70, 1035–1040. [Google Scholar] [CrossRef]
  21. UPOV. Guidelines for the Conduct of Tests Distinctness, Uniformity and Stability-Rosa L.; International Union for The Protection of New Varieties of Plants: Geneva, Switzerland, 2010. [Google Scholar]
  22. EDQM (Council of Europe). European Pharmacopoeia, 3rd ed; Directorate for the Quality of Medicines, Council of Europe: Strasbourg, France, 1996; pp. 121–122. [Google Scholar]
  23. Lesjak, M.; Simin, N.; Orcic, D.; Franciskovic, M.; Knezevic, P.; Beara, I.; Aleksic, V.; Svircev, E.; Buzas, K.; Mimica-Dukic, N. Binary and tertiary mixtures of Satureja hortensis and Origanum vulgare essential oils as potent antimicrobial agents against Helicobacter pylori. Phytother. Res. 2015, 30, 476–484. [Google Scholar] [CrossRef]
  24. McLafferty, F.W. Wiley Registry of Mass Spectral Data 7th edition with NIST 2005 Spectral Data; Wiley: Hoboken, NJ, USA, 2005. [Google Scholar]
  25. Adams, R.P. Identification of Essential Oil Components by Gas Chromatography/Mass Spectrometry, 4th ed.; Allured Business Media: Carol Stream, IL, USA, 2012. [Google Scholar]
  26. Lesjak, M.M.; Beara, I.N.; Orčić, D.Z.; Anačkov, G.T.; Balog, K.J.; Francišković, M.M.; Mimica-Dukić, N.M. Juniperus sibirica Burgsdorf. as a novel source of antioxidant and anti-inflammatory agents. Food Chem. 2011, 124, 850–856. [Google Scholar] [CrossRef]
  27. Lee, J.; Durst, R.W.; Wrolstad, R.E. Determination of total monomeric anthocyanin pigment content of fruit juices, beverages, natural colorants, and wines by the pH differential method: Collaborative study. J. AOAC Int. 2005, 88, 1269–1278. [Google Scholar] [CrossRef] [PubMed]
  28. Nielsen, S.S. Food Analysis Laboratory Manual, 2nd ed.; Springer: New York, NY, USA, 2010; pp. 55–60. [Google Scholar]
  29. Simin, N.; Orcic, D.; Cetojevic-Simin, D.; Mimica-Dukic, N.; Anackov, G.; Beara, I.; Mitic-Culafic, D.; Bozin, B. Phenolic profile, antioxidant, anti-inflammatory and cytotoxic activities of small yellow onion (Allium flavum L. subsp. flavum, Alliaceae). LWT Food Sci. Technol. 2013, 54, 139–146. [Google Scholar] [CrossRef]
  30. Pintać, D.; Četojević-Simin, D.; Berežni, B.; Orčić, D.; Mimica-Dukić, N.; Lesjak, M. Investigation of the chemical composition and biological activity of edible grapevine (Vitis vinifera L.) leaf varieties. Food Chem. 2019, 286, 686–695. [Google Scholar] [CrossRef]
  31. Khaleghi, A.; Khadivi, A. Morphological characterization of Damask rose (Rosa × damascena Herrm.) germplasm to select superior accessions. Genet. Resour. Crop Evol. 2020, 67, 1981–1997. [Google Scholar] [CrossRef]
  32. Burdock, G.A. Fenaroli’s Handbook of Flavor Ingredients, 6th ed.; CRC Press: Boca Raton, FL, USA, 2010; pp. 307–1899. [Google Scholar]
  33. Chemical Entities of Biological Interest (ChEBI). Available online: https://www.ebi.ac.uk/chebi/searchId.do?chebiId=88528 (accessed on 20 August 2023).
  34. Fu, Y.; Zhang, Y.; Zeng, S.; Luo, L.; Xi, H.; Li, P.; Wang, D.; Liao, T.; Chen, J.; Sun, S.; et al. The effect of long-chain alkanes on flavour release and olfactory characteristics of rose essential oil. Flavour Fragr. J. 2021, 37, 72–80. [Google Scholar] [CrossRef]
  35. Rusdi, N.; Goh, H.H.; Baharum, S. GC-MS/Olfactometric characterisation and aroma extraction dilution analysis of aroma active compounds in Polygonum minus essential oil. Plant Omics 2016, 9, 289–291. [Google Scholar] [CrossRef]
  36. Li, Z.; Howell, K.; Fang, Z.; Zhang, P. Sesquiterpenes in grapes and wines: Occurrence, biosynthesis, functionality, and influence of winemaking processes. Compr. Rev. Food Sci. Food Saf. 2019, 19, 247–281. [Google Scholar] [CrossRef]
  37. Adams, T.B.; Hallagan, J.B.; Putnam, J.M.; Gierke, T.L.; Doull, J.; Munro, I.C.; Newberne, P.; Portoghese, P.S.; Smith, R.L.; Wagner, B.M.; et al. The FEMA GRAS assessment of alicyclic substances used as flavour ingredients. Food Chem. Toxicol. 1996, 34, 763–828. [Google Scholar] [CrossRef]
  38. Beara, I.; Torović, L.j.; Pintać, D.; Majkić, T.; Orčić, D.; Mimica-Dukić, N.; Lesjak, M. Polyphenolic profile, antioxidant and neuroprotective potency of grape juices and wines from Fruška Gora region (Serbia). Int. J. Food Prop. 2017, 20, S2552–S2568. [Google Scholar] [CrossRef]
  39. Faller, A.L.K.; Fialho, E. Polyphenol content and antioxidant capacity in organic and conventional plant foods. J. Food Compos. Anal. 2010, 23, 561–568. [Google Scholar] [CrossRef]
  40. Šibul, F.S.; Orčić, D.Z.; Svirčev, E.; Mimica-Dukić, N.M. Optimization of extraction conditions for secondary biomolecules from various plant species. Chem. Ind. 2016, 70, 473–483. [Google Scholar] [CrossRef]
  41. Kumar, N.; Bhandari, P.; Singh, B.; Shamsher, S.B. Antioxidant activity and ultra-performance LC-electrospray ionization-quadrupole time-of-flight mass spectrometry for phenolics-based fingerprinting of Rose species: Rosa damascena, Rosa bourboniana and Rosa brunonii. Food Chem. Toxicol. 2009, 47, 361–367. [Google Scholar] [CrossRef] [PubMed]
  42. Yang, H.; Shin, Y. Antioxidant compounds and activities of edible roses (Rosa hybrida spp.) from different cultivars grown in Korea. Appl. Biol. Chem. 2017, 60, 129–136. [Google Scholar] [CrossRef]
  43. Lutz, M.; Hernández, J.; Henríquez, C. Phenolic content and antioxidant capacity in fresh and dry fruits and vegetables grown in Chile. CyTA J. Food 2015, 13, 541–547. [Google Scholar]
  44. Panche, A.N.; Diwan, A.D.; Chandra, S.R. Flavonoids: An overview. J. Nutr. Sci. 2016, 5, e47. [Google Scholar] [CrossRef]
  45. Choi, J.K.; Lee, Y.B.; Lee, K.H.; Im, H.C.; Kim, Y.B.; Choi, E.K.; Joo, S.S.; Jang, S.K.; Han, N.S.; Kim, C.H. Extraction conditions for phenolic compounds with antioxidant activities from white rose petals. J. Appl. Biol. Chem. 2015, 58, 117–124. [Google Scholar] [CrossRef]
  46. Kumari, P.; Raju, D.V.S.; Prasad, K.V.; Saha, S.; Panwar, S.; Paul, S.; Banyal, N.; Bains, A.; Chawla, P.; Fogarasi, M.; et al. Characterization of anthocyanins and their antioxidant activities in Indian rose varieties (Rosa × hybrida) using HPLC. Antioxidants 2022, 11, 2032. [Google Scholar] [CrossRef]
  47. Morelli, M.B.; Gambardella, J.; Castellanos, V.; Trimarco, V.; Santulli, G. Vitamin C and cardiovascular disease: An update. Antioxidants 2020, 9, 1227. [Google Scholar] [CrossRef]
  48. Magana, A.A.; Reed, R.L.; Koluda, R.; Miranda, C.L.; Maier, C.S.; Stevens, J.F. Vitamin C activates the folate-mediated one-carbon cycle in C2C12 myoblasts. Antioxidants 2020, 9, 217. [Google Scholar] [CrossRef]
  49. Food and Nutrition Board Panel on Dietary Antioxidants and Related Compounds. Dietary Reference Intakes for Vitamin C, Vitamin E, Selenium, and Carotenoids; National Academy Press: Washington, DC, USA, 2000; pp. 95–185. [Google Scholar]
  50. Proteggente, A.R.; Pannala, A.S.; Paganga, G.; van Buren, L.; Wagner, E.; Wiseman, S.; van de Put, F.; Dacombe, C.; Rice-Evans, C.A. The antioxidant activity of regularly consumed fruit and vegetables reflects their phenolic and Vitamin C composition. Free. Radic. Res. 2002, 36, 217–233. [Google Scholar] [CrossRef] [PubMed]
  51. Sharifi-Rad, M.; Anil Kumar, N.V.; Zucca, P.; Varoni, E.M.; Dini, L.; Panzarini, E.; Rajkovic, J.; Tsouh Fokou, P.V.; Azzini, E.; Peluso, I.; et al. Lifestyle, oxidative stress, and antioxidants: Back and forth in the pathophysiology of chronic diseases. Front. Physiol. 2020, 11, 694. [Google Scholar] [CrossRef] [PubMed]
  52. Padayatty, S.J.; Katz, A.; Wang, Y.; Eck, P.; Kwon, O.; Lee, J.H.; Chen, S.; Corpe, C.; Dutta, A.; Dutta, S.K.; et al. Vitamin C as an antioxidant: Evaluation of its role in disease prevention. J. Am. Coll. Nutr. 2003, 22, 18–35. [Google Scholar] [CrossRef] [PubMed]
  53. Conti Filho, C.E.; Loss, L.B.; Marcolongo-Pereira, C.; Rossoni Junior, J.V.; Barcelos, R.M.; Chiarelli-Neto, O.; da Silva, B.S.; Passamani Ambrosio, R.; Castro, F.C.A.Q.; Teixeira, S.F.; et al. Advances in Alzheimer’s disease’s pharmacological treatment. Front. Pharmacol. 2023, 14, 1101452. [Google Scholar] [CrossRef] [PubMed]
  54. Murray, A.P.; Faraoni, M.B.; Castro, M.J.; Alza, N.P.; Cavallaro, V. Natural AChE inhibitors from plants and their contribution to Alzheimer’s disease therapy. Curr. Neuropharmacol. 2013, 11, 388–413. [Google Scholar] [CrossRef] [PubMed]
  55. Esmaeili, S.; Ara, L.; Hajimehdipoor, H.; Kolivand, H.; Mohammadi Motamed, S. Acetylcholinesterase inhibitory effects of some plants from Rosaceae. Res. J. Pharmacogn. 2015, 2, 33–37. [Google Scholar]
  56. Jazayeri, S.B.; Amanlou, A.; Ghanadian, N.; Pasalar, P.; Amanlou, M. A preliminary investigation of anticholinesterase activity of some Iranian medicinal plants commonly used in traditional medicine. DARU J. Pharm. Sci. 2014, 22, 17. [Google Scholar] [CrossRef]
  57. Tarbiat, S.; Türütoğlu, A.S.; Ekingen, M. Acetylcholinesterase inhibitory potential and antioxidant activities of five cultivars of Rosa damascena Mill. from Isparta, Turkey. Curr. Top. Nutraceutical Res. 2020, 18, 354–359. [Google Scholar] [CrossRef]
Figure 1. Rose genotypes used in experiments. 1—‘Theo Clevers’; 2—‘Evelin Wild’; 3—‘Pear’; 4—‘Olivera Frayla’; 5—‘Lavander Vaza’; 6—‘Marija Frayla’.
Horticulturae 09 01082 g001
Figure 2. Scatter plot (for PC1 and PC3) obtained by PCA analysis of 30 dominant volatiles in essential oils of rose petals.
Horticulturae 09 01082 g002
Figure 3. Dendrogram obtained by hierarchical clustering analysis of 30 dominant volatiles content in essential oils of rose petals.
Horticulturae 09 01082 g003
Figure 4. Chemical characterization of methanol extracts of rose petals. (A) Total phenolic content (TPC); (B) total flavonoid content (TFC); (C) total anthocyanin content (TAC); (D) vitamin C content. LV—‘Lavander Vaza’; P—‘Pear’; MF—‘Marija Frayla’; OF—‘Olivera Frayla’; TC—‘Theo Clevers’; EV—‘Evelin Wild’. GAE—galic acid equivalents; QE—quercetin equivqlents; CE—cyanidin-3-O-glucoside equivalents. Mean values designated with the same letter were not significantly different according to Tukey’s Honest Significant Difference test (p ≤ 0.05).
Horticulturae 09 01082 g004
Figure 5. PCA analysis on 14 phenolic compounds in rose petal methanol extracts—biplot. LV—‘Lavander Vaza’; P—‘Pear’; MF—‘Marija Frayla’; OF—‘Olivera Frayla’; TC—‘Theo Clevers’; EV—‘Evelin Wild’.
Horticulturae 09 01082 g005
Figure 6. Antioxidant activity of methanol extracts of rose petals. (A) DPPH scavenging activity expressed as IC50 value; (B) ferric reducing antioxidant potential (FRAP). LV—‘Lavander Vaza’; P—‘Pear’; MF—‘Marija Frayla’; OF—‘Olivera Frayla’; TC—‘Theo Clevers’; EV—‘Evelin Wild’. AAE—ascorbic acid equivalents. Mean values designated with the same letter were not significantly different according to Tukey’s Honest Significant Difference test (p ≤ 0.05).
Horticulturae 09 01082 g006
Figure 7. Neuroprotective activity—potential of methanol extracts of rose petals to inhibit acethylcholine esterase (AChE). LV—‘Lavander Vaza’; P—‘Pear’; MF—‘Marija Frayla’; OF—‘Olivera Frayla’; TC—‘Theo Clevers’; EV—‘Evelin Wild’. Mean values designated with the same letter were not significantly different according to Tukey’s Honest Significant Difference test (p ≤ 0.05).
Horticulturae 09 01082 g007
Table 1. Qualitative vegetative and generative traits investigated in six rose cultivars following the UPOV protocol [21] for roses (Rosa L.).
CharacterAbbr.Scores
Plant and leaf
Growth typeGT1—miniature, 2—dwarf, 3—bed, 4—shrub, 5—climber and 6—ground cover
Growth habitGH1—upright, 3—semi-upright, 5—intermediate, 7—moderately spreading and 9—strongly spreading
Intensity of green color (upper side)IGC3—light, 5—medium and 7—dark
Leaf anthocyanin colorationLAC1—absent and 9—present
Glossiness of upper sideGUS1—absent or very weak, 3—weak, 5—medium, 7—strong and 9—very strong
Flower
Flowering lateralsFL1—absent and 9—present
Flower typeTP1—single, 2—semi-double and 3—double
Color groupCG1—white or near white, 2—white blend, 3—green, 4—yellow, 5—yellow blend, 6—orange, 7—orange blend, 8—pink, 9—pink blend, 10—red, 11—red blend, 12—purple red, 13—purple, 14—violet blend, 15—brown blend and 16—multi colored
Color of center (only varieties with flower type double)CC1—green, 2—yellow, 3—orange, 4—pink, 5—red and 6—purple
Shape SH1—round, 2—irregularly rounded and 3—star-shaped
Profile of upper partPUP1—flat, 2—flattened convex and 3—convex
Profile of lower partPLP1—concave, 2—flat, 3—flattened convex and 4—convex
Fragrance (observed by smelling)FG1—absent or weak, 2—medium weak, 3—medium, 4—medium strong and 5—strong
Table 2. Qualitative and quantitative vegetative characteristics of the investigated rose genotypes.
Cultivar/Trait‘Eveline
Wild’
‘Olivera
Frayla’
‘Lavender
Vaza’
‘Pear’‘Theo
Clevers’
‘Marija
Frayla’
Plant
GTShrub ShrubShrubShrubShrubShrub
GHUpright Semi-uprightSemi-uprightSemi-uprightUprightUpright
Height (cm)89.9 ± 3.96 d86.8 ± 3.42 cd80.0 ± 4.12 c59.8 ± 3.96 b108 ± 5.71 e38.8 ± 7.59 a
Leaf
IGCLight Medium MediumMediumDark Medium
LACPresent PresentAbsent Absent PresentAbsent
GUSVery weak Very weakWeak Very weakWeak Weak
Length (cm)3.32 ± 0.58 a4.96 ± 0.11 b4.24 ± 0.15 ab4.12 ± 0.56 ab6.32 ± 1.06 c5.18 ± 0.58 bc
Width (cm)2.14 ± 0.32 a3.10 ± 0.24 a2.52 ± 0.17 a3.02 ± 0.33 a4.82 ± 0.68 b4.30 ± 0.84 b
Growth type—GT; growth habit (excluding climbers)—GH; intensity of green color (upper side)—IGC; leaf anthocyanin coloration—LAC; glossiness of upper side—GUS. Mean values designated with the same letter were not significantly different according to Tukey’s HSD test (p ≤ 0.05). Mean values designated with the same letter were not significantly different according to Tukey’s Honest Significant Difference test (p ≤ 0.05).
Table 3. Qualitative and quantitative generative characteristics of the investigated rose genotypes.
Cultivar/Trait‘Eveline
Wild’
‘Olivera
Frayla’
‘Lavender
Vaza’
‘Pear’ ‘Theo
Clevers’
‘Marija
Frayla’
Flowering shoot
NFS *5.20 ± 1.30 bc0 a4.60 ± 0.89 b5.20 ± 0.84 bc0 a6.20 ± 0.84 c
FL Absent PresentAbsent PresentPresentAbsent
NFL0 a3.00 ± 0.70 c0 a1.80 ± 0.83 b2.80 ± 0.44 c0 a
NF/L0 a7.61 ± 2.5 b0 a1.00 ± 0.33 a6.00 ± 2.65 b0 a
Flower
TPDouble DoubleDoubleDouble DoubleDouble
CGOrange blendYellow White Pale pink Pink Red purple
CCOrange Yellow Pink /Pink /
SHRounded Rounded Irregularly roundedRounded Rounded Rounded
PUPFlat Flat convex Flat convex Flat Flat convexFlat
PLPFlat Concave Concave Flattened convex Concave Flat
FG553354
NOP56.4 ± 2.96 b54.4 ± 7.16 b84.0 ± 12.2 c26.2 ± 2.58 a169 ± 15.9 e138 ± 3.84 d
DM (cm)6.22 ± 0.19 ab5.68 ± 0.52 a6.60 ± 0.53 ab6.80 ± 0.71 b6.67 ± 0.51 b9.54 ± 0.27 c
PL (cm)3.42 ± 0.13 a4.18 ± 0.39 b2.86 ± 0.47 a3.42 ± 0.24 a2.92 ± 0.19 a4.32 ± 0.23 b
PW (cm)3.34 ± 0.61 ab3.14 ± 0.32 a2.58 ± 0.41 a2.96 ± 0.59 a2.68 ± 0.22 a4.14 ± 0.51 b
* Flowering laterals—FL; type—TP; color group—CG; color of center (only varieties with flower type double)—CC; shape—SH; profile of upper part—PUP; profile of lower part—PLP; fragrance—FG on the 1–5 scale; number of petals—NP. Number of flowering shoots (only varieties with no flowering laterals)—NFS; number of flowering laterals—NFL; number of flowers per lateral (only varieties with flowering laterals)—NF/L; number of petals—NOP; flower diameter—DM; petal length—PL; petal width—PW; mean values designated with the same letter were not significantly different according to Tukey’s Honest Significant Difference test (p ≤ 0.05).
Table 4. Human perception of floral scent in the investigated rose cultivars.
Fragrance Panel‘Eveline Wild’‘Olivera Frayla’‘Lavender Vaza’‘Pear’‘Theo
Clevers’
‘Marija Frayla’
A/WMSA/WMSA/WMSA/WMSA/WMSA/WMS
Top NotesCitrusorange 1 *1 3
lemon 3 4 32 6 6
apple 322 21 4
Aromaticmint 2
anise
eucalyptus
Heart NotesFloralflowery2 55 7 23 2 8 5
rose-like 10 2 8 347 6 10
jasmine
Greenforest 3 2 3
herbaceous 2
grass 3 3 1 4
Fruityfruity364 6 5 7 5
sweet, honey 64 8 46 3 6 7
peach2 5 12 4
Spicyspicy 3
peppery 3
cinnamon
Base NotesWoody, earthymoss
woody1 2
coniferous
Balsamicbalsamic 1
musky
vanilla3 2 4 2
*—Number of smellings when panelists scored the fragrance presence in the form of A/W—absent or weak; M—medium; S—strong fragrance.
Table 5. Results for GC-MS analysis of rose essential oils.
% of Total Peak Area
AICompoundEWLVMFOFPTC
800Hexanal1.950.441.620.580.613.98
8482-Hexenal1.141.170.931.930.691.75
1228Nerol11.191.763.579.39n.d.12.96
1240Neral3.15n.d.n.d.2.76n.d.2.31
1254Geraniol4.46n.d.n.d.6.52n.d.4.24
1255Phenethyl acetaten.d.6.40n.d.n.d.n.d.n.d.
1265Orcinol dimethyl ethern.d.n.d.0.87n.d.n.d.0.98
1270Geranial3.33n.d.n.d.4.29n.d.2.90
1297Theaspirane A/B n.d.n.d.n.d.1.920.120.11
1314Theaspirane A/B n.d.n.d.n.d.0.920.110.09
1323n.i.0.83n.d.n.d.n.d.n.d.0.16
1353n.i.0.66n.d.n.d.n.d.n.d.0.35
1361n.i.n.d.n.d.0.84n.d.n.d.n.d.
1365Neryl acetate0.29n.d.n.d.n.d.n.d.0.15
1384Geranyl acetate4.46n.d.n.d.n.d.n.d.2.34
1418E-Caryophyllenen.d.0.691.49n.d.0.530.22
1438Dihydro-β-iononen.d.n.d.0.231.500.090.14
1444Dihydro-α-ionoln.d.n.d.7.683.151.600.34
1480Germacrene D2.943.2311.08n.d.1.850.59
1486E-β-Iononen.d.n.d.0.70n.d.n.d.0.08
1490n.i.n.d.n.d.0.48n.d.n.d.0.08
1495n.i.n.d.n.d.0.69n.d.0.100.08
1499α-Muurolene + Pentadecanen.d.n.d.0.88n.d.0.200.08
1513n.i.n.d.n.d.0.45n.d.n.d.0.08
1522δ-Cadinene + ?0.41n.d.1.99n.d.0.260.11
1631γ-Eudesmoln.d.n.d.0.74n.d.n.d.0.08
1641τ-Cadinoln.d.n.d.1.57n.d.0.080.08
1645n.i.0.27n.d.n.d.n.d.n.d.0.08
1653α-Eudesmoln.d.n.d.3.14n.d.0.050.10
1676Heptadecenen.d.n.d.n.d.n.d.0.990.07
1698Heptadecane0.34n.d.7.07n.d.0.810.91
17242Z,6E-Farnesol ?n.d.n.d.6.51n.d.0.404.96
18739-Nonadecene14.525.475.015.8326.389.61
1900Nonadecane9.095.093.787.3222.045.23
1918n.i.n.d.n.d.n.d.n.d.0.421.36
19719-Icosene0.29n.d.n.d.n.d.0.520.36
1998Icosane0.890.650.400.651.720.98
2070Heneicosene0.640.250.170.271.010.86
2087Heneicosene0.450.330.870.451.380.83
209210(?)-Heneicosene0.350.36n.d.0.410.900.54
2100Heneicosane12.8217.779.7114.2021.6118.09
2198Docosane0.270.290.290.370.310.59
22889-Tricosene1.232.742.752.831.962.28
2299Tricosane6.9814.6111.7113.336.0511.20
2397Tetracosane0.420.870.450.780.200.50
2489Pentacosene0.56n.d.n.d.n.d.n.d.n.d.
2492n.i.n.d.1.740.501.130.380.22
2499Pentacosane6.6419.036.349.702.483.89
2597Hexacosane0.310.75n.d.0.300.080.13
2700Heptacosane8.7916.222.266.612.361.87
Total monoterpens (%)26.91.763.8625.80.2425.1
Total sesquiterpens (%)3.353.9236.04.665.066.78
Total linear hydrocarbons (%)64.684.450.863.090.858.0
Total identified (%)97.998.193.896.097.296.3
AI —arithmetic retention index; n.d.—not detected; LV—‘Lavander Vaza’; P—‘Pear’; MF—‘Marija Frayla’; OF—‘Olivera Frayla’; TC—‘Theo Clevers’; EV—‘Evelin Wild’
Table 6. Contents of total phenolics (TPC), total flavonoids (TFC), total anthocyanins (TAC) and vitamin C in rose petal methanol extracts.
TPCTFCTACVitamin C
Genotypemg GAE/g demg GAE/g fwmg QE/g demg QE/g fwmg CE/g deµg CE/g fwmg/g deµg/g fw
LV170 ± 16.413.2 ± 1.2752.3 ± 3.004.00 ± 0.2336.660 ± 0.216517 ± 16.75.45 ± 0.354424 ± 27.5
P91.4 ± 7.308.19 ± 0.6526.8 ± 1.702.40 ± 0.1520.260 ± 0.02223.3 ±1.971.24 ± 0.226111 ±20.3
MF217 ± 17.621.5 ± 1.7556.3 ± 3.005.58 ± 0.2973.435 ± 0.087340 ± 8.624.83 ± 0.053479 ± 5.28
OF163 ± 15.213.5 ± 1.2639.0 ± 0.333.24 ± 0.0280.230 ± 0.00118.8 ± 0.3983.61 ± 0.307299 ± 25.5
TC151 ± 6.7814.0 ± 0.6317.3 ± 1.191.61 ± 0.1113.234 ± 0.043301 ±3.924.71 ± 0.183438 ± 17.1
EW112 ± 9.639.94 ± 0.8536.7 ± 0.523.25 ± 0.0460.355 ± 0.03131.4 ±2.772.68 ± 0.028238 ± 2.52
LV—‘Lavander Vaza’; P—‘Pear’; MF—‘Marija Frayla’; OF—‘Olivera Frayla’; TC—‘Theo Clevers’; EV—‘Evelin Wild’. GAE—gallic acid equivalents; QE—quercetin equivalents; CE—cyanidin-3-O-glucoside equivalents; de—dry extract; fw—fresh weight.
Table 7. Determined content of selected phenolics in methanol extracts of investigated rose genotypes petals.
Content [μg/g de] a
GenotypeLVPMFOFTCEW
Quinic acid19,037 b ± 2.021,722 ± 2.226,963 ± 2.736,142 ± 3.636,833 ± 3.717,513 ± 1.7
p-Hydroxybenzoic acid<1.2<1.2<1.2<1.25.33 ± 0.32<1.2
Protocatechuic acid44.8 ± 3.593.26 ± 0.2633.0 ± 2.642.17 ± 0.1711.1 ± 0.898.69 ± 0.69
p-Coumaric acid1.15 ± 0.102.98 ± 0.270.17 ± 0.021.04 ± 0.090.33 ± 0.030.87 ± 0.08
Gallic acid27.3 ± 2.4624.3 ± 2.1922.5 ± 2.0323.1 ± 2.0818.9 ± 1.7030.6 ± 2.76
Naringenin1.04 ± 0.070.49 ± 0.030.59 ± 0.042.64 ± 0.180.41 ± 0.031.87 ± 0.13
Kaempferol9.88 ± 0.6915.3 ± 1.079.60 ± 0.6723.9 ± 1.6718.1 ± 1.2718.1 ± 1.27
Catechin255 ± 0.03155 ± 0.02113 ± 0.0175.7 ± 0.01100 ± 0.0155.5 ± 0.01
Epicatechin8.07 ± 0.0012.13 ± 0.0011.3 ± 0.0011.27 ± 0.00<1.2 <1.2
Quercetin58.8 ± 0.1813.1 ± 0.0423.8 ± 0.0737.8 ± 0.116.89 ± 0.0218.4 ± 0.06
Chlorogenic acid7.34 ± 0.372.19 ± 0.111.11 ± 0.060.65 ± 0.032.18 ± 0.111.60 ± 0.08
Kaempferol-3-O-Glc60.9 ± 2.44147 ± 5.8876.2 ± 3.0596.2 ± 3.8574.1 ± 2.96193.6 ±7.74
Quercitrin6537 ± 3921843 ± 1117584 ± 4553974 ± 238467 ± 28.01952 ± 117
Quercetin-3-O-Glc + Gal25,326 ± 15207481 ± 44911,403 ± 68413,231 ± 794 758 ± 45.58545 ± 513
Rutin749 ± 22.5390 ± 11.76241 ± 187723 ± 21.7 179 ± 5.37665 ± 20.0
Total phenolics (mg/g de) c33.0910.0825.5218.191.64211.49
a Results are given as content (μg/g of extract dry extract) ± standard error of repeatability (as determined by method validation); b the values higher than 10 are marked with bold letters; c sum of the contents of all detected phenolic compounds; LV—‘Lavander Vaza’; P—‘Pear’; MF—‘Marija Frayla’; OF—‘Olivera Frayla’; TC—‘Theo Clevers’; EV—‘Evelin Wild’.
Table 8. Antioxidant and neuroprotective activity of rose petal methanol extracts.
IC50 (DPPH)FRAPAChE-IP
Genotypeμg/mLmg AAE/g deng EE/g de
LV11.45 ± 1.15227 ± 16.830.8 ± 6.24
P37.82 ± 2.9991.9 ± 2.9418.2 ± 1.86
MF9.24 ± 0.61220 ± 18.125.3 ± 2.91
OF27.07 ± 3.21148 ± 1.4716.3 ± 0.64
TC15.78 ± 0.18189 ± 18.022.2 ± 2.80
EW42.51 ± 4.0574.6 ± 7.2568.5 ± 5.81
IC50 (DPPH)—the concentration of the extract that neutralizes 50% of DPPH radicals; FRAP—ferric reducing antioxidant potential; AAE—ascorbic acid equivalents; AChE-IP—the potential to inhibit acetyl cholinesterase; EE—eserine equivalents.
Disclaimer/Publisher’s Note: The statements, opinions and data contained in all publications are solely those of the individual author(s) and contributor(s) and not of MDPI and/or the editor(s). MDPI and/or the editor(s) disclaim responsibility for any injury to people or property resulting from any ideas, methods, instructions or products referred to in the content.