Article

Identification and Analysis of Reference and Tissue-Specific Genes in Bitter Gourd Based on Transcriptome Data

1
Guangdong Key Laboratory for New Technology Research of Vegetables, Vegetable Research Institute, Guangdong Academy of Agricultural Sciences, Guangzhou 510640, China
2
School of Life Sciences, South China Normal University, Guangzhou 510640, China
3
Guangdong Laboratory for Linnan Modern Agricultural, Guangzhou 510640, China
*
Authors to whom correspondence should be addressed.
Horticulturae 2023, 9(12), 1262; https://doi.org/10.3390/horticulturae9121262
Submission received: 16 October 2023 / Revised: 21 November 2023 / Accepted: 22 November 2023 / Published: 24 November 2023
(This article belongs to the Special Issue Postharvest Biology and Molecular Research of Horticulture Crops)

Abstract

:
Accurate and standardized quantification of reverse transcription PCR (qRT-PCR) results relies on the use of a dependable reference gene. The precise control of transgene expression in terms of both spatial and temporal aspects necessitates the utilization of tissue-specific gene promoters. However, the identification of stable reference genes across various tissues, particularly in fruits at different ripening stages, as well as tissue-specific genes in bitter gourds, remains largely unexplored. In this study, we employed RNA-Seq-based transcriptome datasets obtained from nine tissues to comprehensively screen for new reference genes (NRGs) and tissue-specific genes. Through the utilization of five algorithms in conjunction with qRT-PCR analysis, we successfully identified two highly stable reference genes, namely HMG1/2 and PHOS32, from a pool of 11 NRGs and five traditional reference genes (TRGs). To validate their reliability, we performed expression pattern analysis of two genes associated with fruit ripening (McACO1 and McACO2) using HMG1/2 and PHOS32, as well as an unstable reference gene, HSCP2. Furthermore, we conducted qRT-PCR validation of 12 tissue-specific genes using HMG1/2 as the reference gene. This study not only contributes to the precise normalization of target genes in bitter gourd but also provides a solid foundation for regulating transgenes through the utilization of suitable tissue-specific promoters.

1. Introduction

To ensure accurate gene expression results, it is crucial to normalize the quantitative reverse transcription PCR (qRT-PCR)-generated data using appropriate reference genes [1]. Ideally, the expression levels of reference genes should remain consistent across different tissues and environmental conditions [2]. In contrast to the constitutive expression of reference genes, tissue-specific genes are expressed exclusively in specific tissues. The promoters of these genes have several potential applications, such as preventing excessive accumulation of heterologous proteins in non-target tissues and precisely controlling the expression of target genes based on predictable timing, localization, and expression levels [3]. Tissue-specific promoters are also utilized in molecular farming to enhance agronomic traits and drive the production of proteins and secondary metabolites in target tissues [4,5]. Therefore, given the importance of reference genes and tissue-specific genes, a detailed study or a suitable method is needed to quickly identify suitable reference genes and tissue-specific genes.
The selection of reference and tissue-specific genes relies on comprehensive and accurate gene expression data. With the advancement of RNA sequencing (RNA-Seq) technology and the reduction in sequencing costs, numerous studies have utilized RNA-Seq-based transcriptome datasets to globally identify new reference and tissue-specific genes, particularly in non-model organisms. For instance, reference gene selection and validation have been conducted in Nitraria sibirica and Momordica charantia [6,7], while tissue-specific gene selection has been performed in tomato, soybean, and maize [8,9,10]. Previous studies have compared nine tissue-specific correlation parameters, with the τ-value proving to be the most effective [11]. The τ-value ranges from 0 to 1, where 0 indicates broad expression and 1 indicates specificity, making it an efficient tool for screening reference and tissue-specific genes from transcriptome datasets [12]. However, candidate reference and tissue-specific genes still need to be quantified using qRT-PCR to verify their expression stability and tissue specificity.
Bitter gourd (Momordica charantia L.) is an annual climbing herb belonging to the Cucurbitaceae family and is extensively cultivated in tropical and subtropical regions worldwide [13,14]. Recent studies have demonstrated the significant pharmacological effects of bitter gourd extracts from various organs, particularly stems, leaves, and fruits, including antidiabetic, anthelmintic, antitumor, and anti-inflammatory properties [15,16,17,18]. The unripe fruit of bitter gourd is often used as an economically important vegetable, especially in China, due to its unique flavor and health benefits [19]. However, bitter gourd is a climacteric fruit that rapidly ripens and softens after harvest, resulting in a sharp decline in its edible and commercial value [20]. To genetically improve bitter gourd, it is essential to understand the precise expression patterns of post-ripening response genes and ripening regulation genes. Therefore, identifying stable reference genes in different tissues, especially in fruits at different ripening stages, and tissue-specific genes serve as the foundation for these studies.
The majority of genetic studies on bitter gourd have relied on traditional reference genes (TRGs), such as ACT7 (Actin-7) [21,22], GAPDH (Glyceraldehyde-3-phosphate dehydrogenase) [23], 18S rRNA (18S ribosomal RNA) [24], CYP (Peptidyl-prolyl cis-trans isomerase) [25], and EF1α (Elongation factor 1-alpha) [26]. However, accumulating evidence suggests that many of these traditional reference genes exhibit unstable expression across different plant species, tissues, experimental conditions, and developmental stages [27,28,29,30]. Furthermore, it remains unknown whether these traditional reference genes can accurately quantify the expression of fruit ripening-related genes in bitter gourd. A recent study on new reference genes in bitter gourds only focused on leaf tissue from seedlings and lacked comprehensiveness [7]. To date, there is no consensus on the use of systematically validated new reference genes in different tissues of bitter gourd, especially in fruits at different ripening stages. Additionally, the screening of tissue-specific genes in bitter gourd has not been reported.
In this study, we utilized an RNA-Seq-based transcriptome dataset to identify 11 candidate new reference genes (NRGs) in bitter gourd based on their stable expression profiles in five organs (root, stem, leaf, male flower, and female flower) and fruit pulps at four ripening stages. To comprehensively analyze the data, we examined the raw qRT-PCR data of the 11 NRGs and five TRGs using five algorithms (geNorm, BestKeeper, ΔCt method, NormFinder, and RefFinder). Among them, we identified the two most stable reference genes, HMG1/2 and PHOS32. To validate their reliability, we examined the expression patterns of two fruit ripening-related genes, 1-aminocyclopropane-1-carboxylate oxidase1 (McACO1) and McACO2, using qRT-PCR with HMG1/2, PHOS32, and HSCP2 as reference genes. Meanwhile, we screened and validated 12 tissue-specific genes using qRT-PCR with HMG1/2 as the reference gene.

2. Materials and Methods

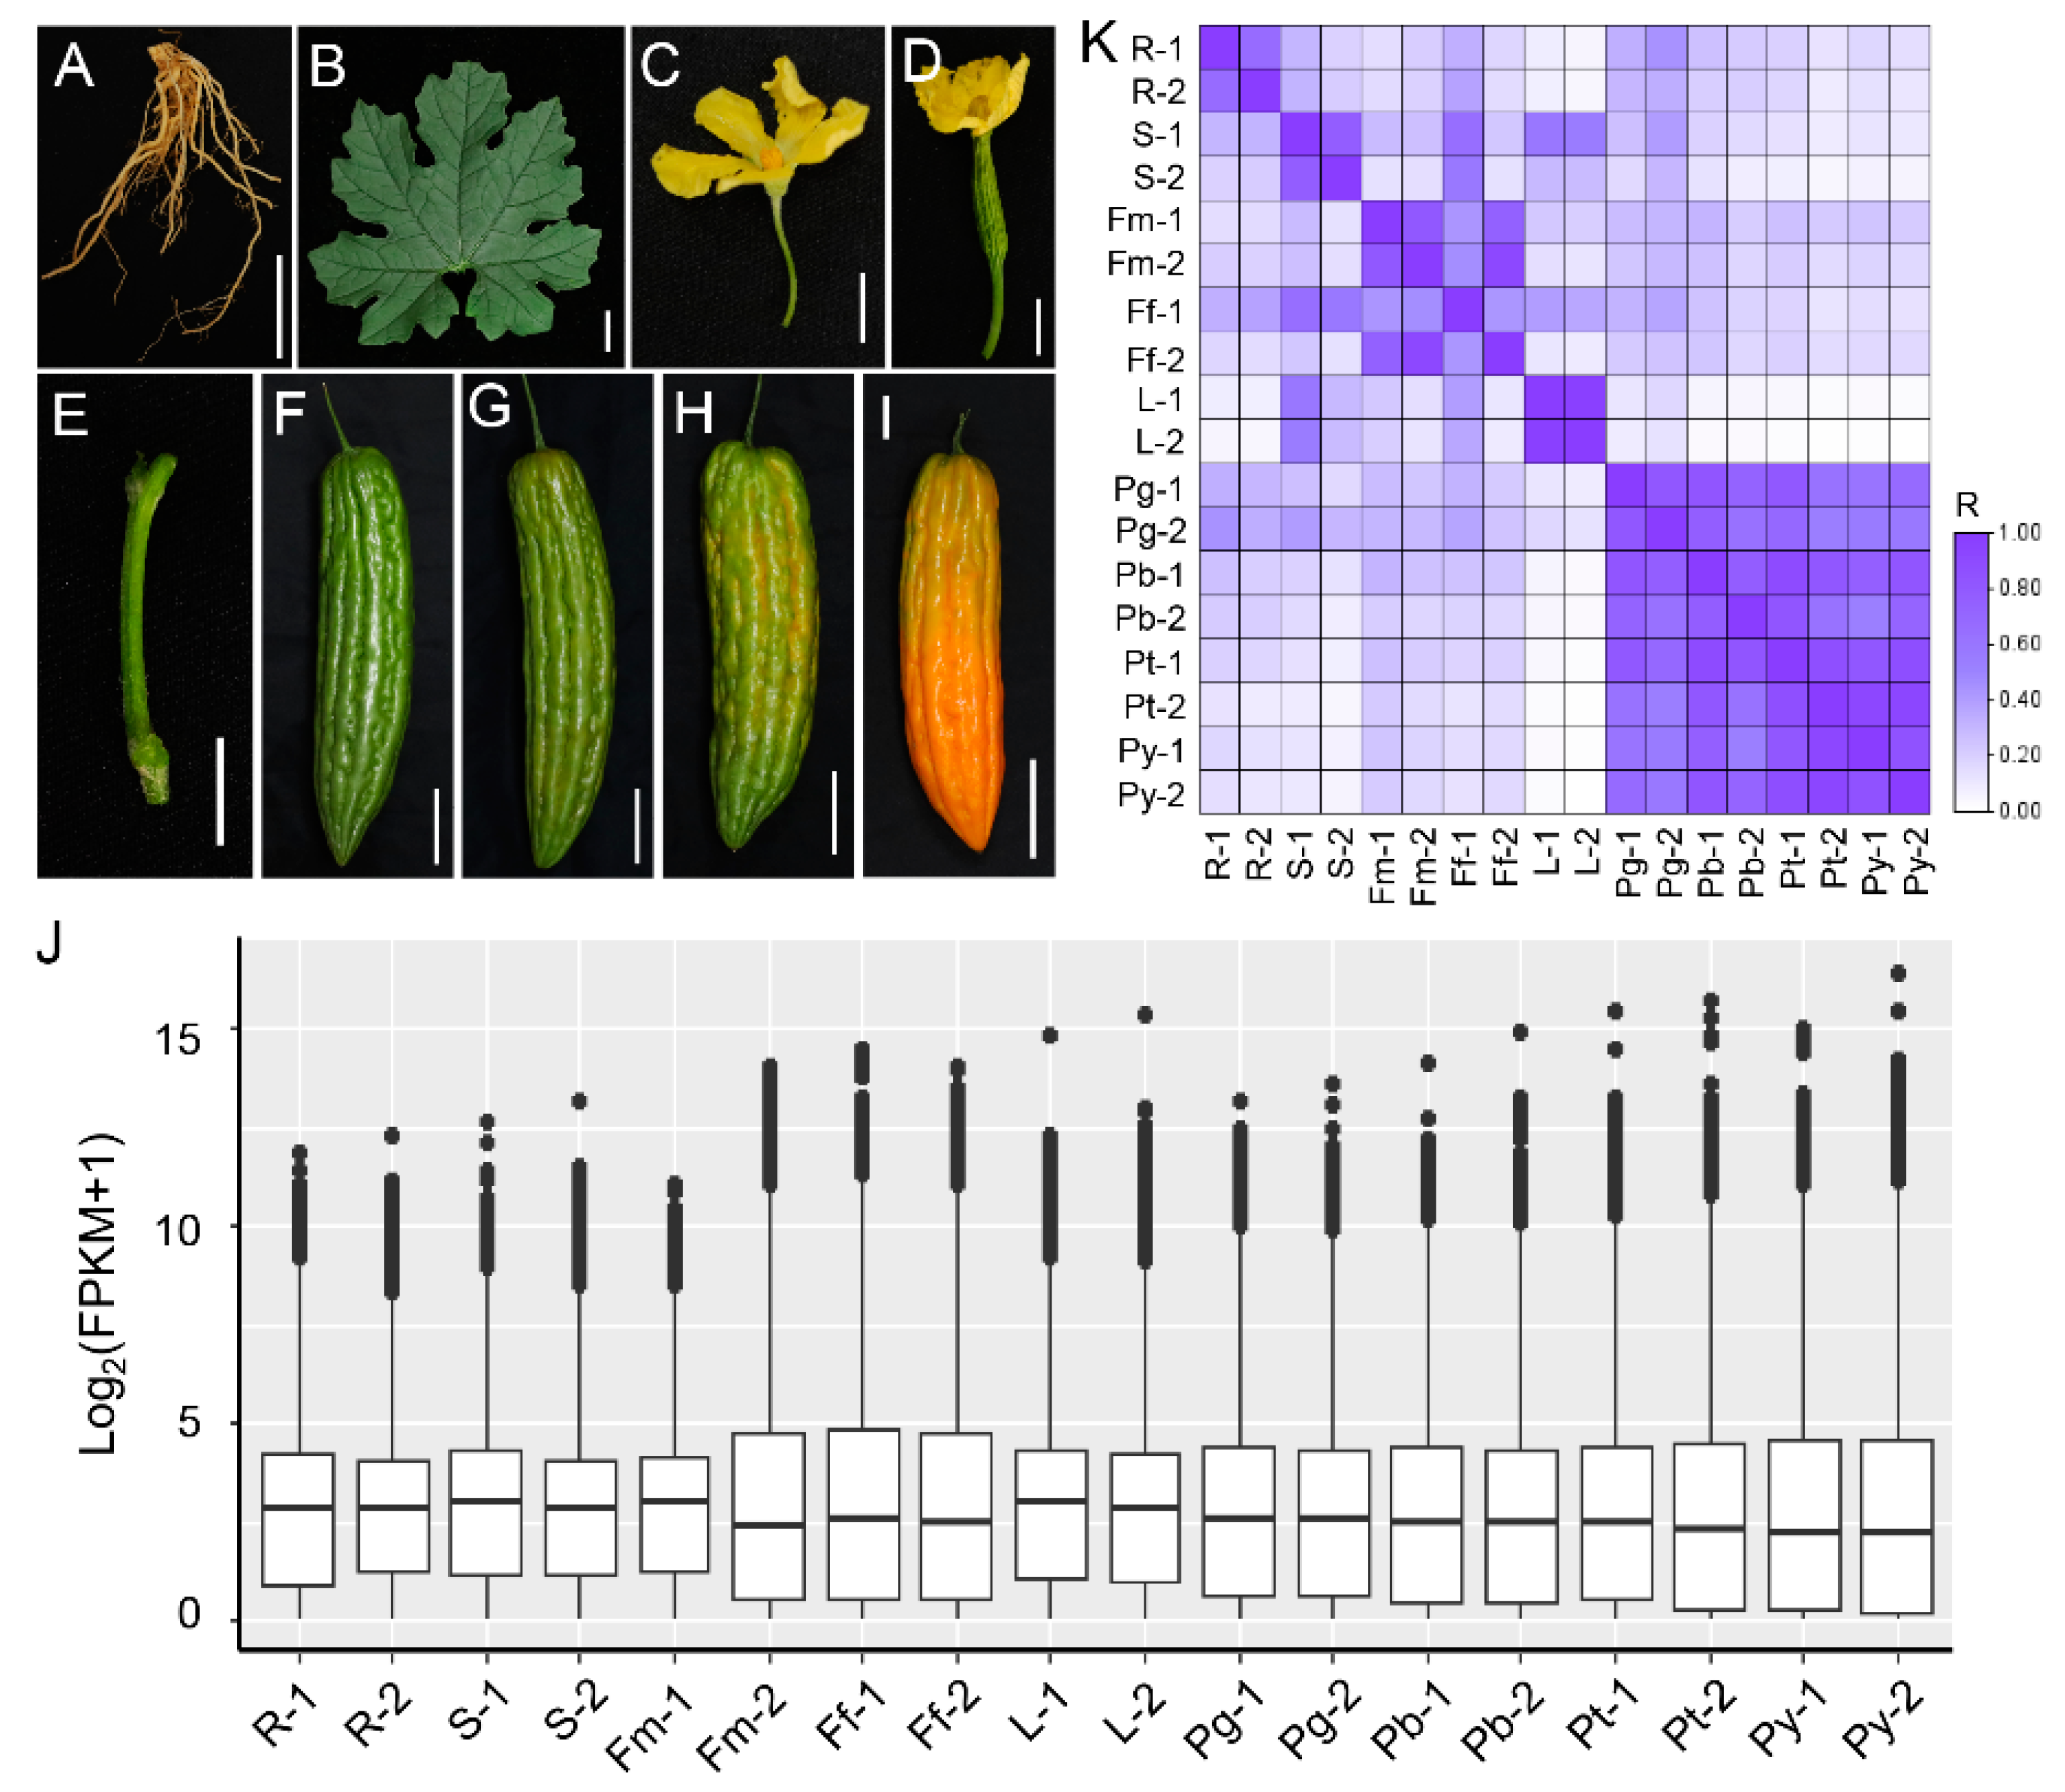
2.1. Plant Materials and Tissue Collection

The bitter gourd inbred line K13, which was developed through multiple generations of self-pollination and selection, was cultivated in the plant bases of the Guangdong Academy of Agricultural Sciences in Guangzhou.
Various plant tissues, including the root during the flowering and fruiting period, young stem during the flowering and fruiting period, young leaf during the flowering and fruiting period, male flower, female flower, and fruit pulp at different stages of ripening (green mature stage, breaker stage, turning stage, and yellow stage), were promptly snap-frozen in liquid nitrogen immediately after collection. Three biological replicates were randomly sampled for each material, and these samples were subsequently stored in a −80 °C refrigerator for further analysis.

2.2. RNA-Seq and Data Analysis

Total RNA was isolated from the collected materials using the Trizol method. The integrity of the RNA was assessed using the RNA Nano 6000 Assay Kit of the Bioanalyzer 2100 system (Agilent Technologies, Santa Clara, CA, USA). The mRNA was then purified from the total RNA using poly-T oligo-attached magnetic beads. First-strand cDNA was synthesized using a random hexamer primer and M-MuLV Reverse Transcriptase (RNase H-). Subsequently, second-strand cDNA synthesis was performed using DNA Polymerase I and RNase H. PCR was then carried out with Phusion High-Fidelity DNA polymerase, Universal PCR primers, and Index (X) Primer. The resulting PCR products were purified, and the quality of the cDNA library was assessed on the Agilent Bioanalyzer 2100 system. The cDNA library was sequenced on an Illumina Novaseq platform, generating 150 bp paired-end reads.
Clean reads were obtained by removing reads containing adapters, ploy-N sequences, and low-quality reads using the fastp v0.23.2 software (HaploX, Shenzhen, China). Subsequently, the clean reads were assembled and aligned to the bitter gourd reference genome (available online: https://ftp.ncbi.nlm.nih.gov/genomes/all/GCF/001/995/035/GCF_001995035.1_ASM199503v1/) (accessed on 22 December 2022) using default parameters with the HISAT2 v2.0.5 software (UT Southwestern Medical Center, TX, USA). Read count values were calculated using the featureCounts v1.5.0 software (Olivia Newton-John Cancer Research Institute, Melbourne, Australia). The fragments per kilobase of transcript per million mapped reads (FPKM) values were then calculated from the count values to represent gene expression levels, considering reads per kilobase of exons per million mapped. The data that support the findings of this study have been deposited into the CNGB Sequence Archive (CNSA) of the China National GeneBank DataBase (CNGBdb) with accession number CNP0005001 [31,32].

2.3. Selection of Reference Genes and Primer Design

Five previously validated reference genes (CYP, EF1α, TIP41, ACT7, and GAPDH) were chosen as TRGs based on existing research articles.
The coefficient of variation (CV) was calculated using the following formula:
C V = σ μ 100 %
where σ represents the standard deviation of gene expression (FPKM) across all tissues, and μ represents the mean of gene expression (FPKM) across all tissues.
The tissue specificity index (τ-value) was calculated as follows [11,12]:
τ = i = 1 n ( 1 x ^ i ) n 1 ;   x ^ i = x i max 1 i n ( x i )
where xi represents the expression (FPKM) of the gene in tissue i, and n is the total number of tissues.
Transcripts per million (TPM) were calculated using the following formula:
T P M i = F P K M i j F P K M j 10 6
where TPMi and FPKMi represent the TPM and FPKM values of the gene in tissue i, and j F P K M j represents the sum of FPKM values for all genes in tissue i.
The 11 NRGs were selected based on the following criteria from the RNA-Seq datasets (Table S1): CV < 0.5, τ-value < 0.5, and 10 > average log2(TPM) > 5.
Specific primers for the 16 reference genes were designed according to the following specifications: GC content of 50–60%, melting temperature (Tm) of 58–60 °C, primer length of 20–22 bp, and amplicon length of 90–150 bp. The specificity of the primer pairs was verified by performing melting curve analysis, ensuring that each gene produced a single peak upon amplification. The amplification efficiency (%) and correlation coefficient (R2) of the primer pairs were calculated using standard curves generated from a set of 5× serial dilutions of cDNA as templates. Only primer pairs with an amplification efficiency of 90–110% and R2 > 0.98 were considered eligible for subsequent analysis.

2.4. RNA Isolation and Reverse Transcription

For gene expression analysis, total RNA was isolated from each sample using the TransZol Up Plus RNA Kit (TransGen Biotech, Beijing, China), following the manufacturer’s instructions. The quality and concentration of the total RNA were measured using a NanoDrop 2000 spectrophotometer (Termo Fisher Scientific, Waltham, MA, USA). Approximately 2 μg of total RNA was reverse transcribed into 20 μL of cDNA using the TransScript One-Step gDNA Removal and cDNA Synthesis Super Mix Kit (TransGen Biotech, Beijing, China), following the manufacturer’s instructions. All templates were stored at −20 °C until further use.

2.5. qRT-PCR Analysis

qRT-PCR was performed using the CFX96 Real-Time PCR System (Bio-Rad, Hercules, CA, USA) in a 20 μL reaction volume containing 1 μL of cDNA (0.1 μg/μL), 0.4 μL of forward and reverse primer (10 μM), 10 μL of PerfectStart Green qPCR SuperMix (TransGen Biotech, Beijing, China), and 8.2 μL of ddH2O. The PCR conditions were as follows: 94 °C for 30 s, followed by 40 cycles of 94 °C for 5 s and 60 °C for 45 s. The gene relative expression levels were measured using the 2−ΔΔCt method and determined based on triplicates.

2.6. Stability Analysis

The stability values of the candidate reference genes were calculated using four algorithms: geNorm, BestKeeper, ΔCt, and NormFinder [1,33,34,35,36]. The qRT-PCR data (Cq values) were exported into a Microsoft Excel 2019MSO datasheet to meet the algorithm requirements. The web-based tool RefFinder (http://blooge.cn/RefFinder/) (accessed on 15 April 2023) was used to synthesize the results from the four algorithms and provide a comprehensive evaluation ranking to determine the most stable reference gene [36,37]. Additionally, the smallest number of normalized reference genes was determined using the Coefficient of Variation (V) analysis by geNorm. When the pairwise variation Vn/n + 1 < 0.15, n reference genes were considered sufficient to correct the data.

2.7. Identification of Tissue-Specific Genes

The τ-value ranges from 0 to 1.0, with 1.0 indicating the highest tissue specificity. A total of 327 candidate tissue-specific genes were selected based on the following criteria: τ-value > 0.9 in one tissue (root, stem, leaf, male flower, female flower, or fruit pulp at the green mature stage), and expression levels in other tissues less than 50 FPKM. The three most abundantly expressed tissue-specific genes from each of the six tissues, resulting in a total of 18 genes, were further analyzed by qRT-PCR analysis.

2.8. Statistical Analysis

The qRT-PCR data presented represents the mean ± standard error (SE) of three replicates per sample. The data were analyzed using IBM SPSS Statistics v26.0 (IBM Corp., Armonk, NY, USA). A one-way analysis of variance (ANOVA) was used to determine the difference between means. Multiple comparisons were performed using Duncan’s test (p ≤ 0.05).

3. Results

3.1. Identification of Candidate Reference Genes in Bitter Gourd Based on an RNA-Seq Dataset

In our previous research, we conducted gene expression pattern analysis using transcriptome datasets of bitter gourd-inbred K13. These datasets were obtained from Illumina RNA-Seq libraries prepared from nine different tissues, including root, stem, leaf, male flower, female flower, and fruit pulp at four ripening stages (green mature stage, breaker stage, turning stage, and yellow stage) (Figure 1A–I). Upon quantifying the expression values (FPKM) of all genes in each sample, we illustrate the distribution of gene expression levels across distinct samples utilizing box plots (Figure 1J). Subsequently, we compute the correlation coefficients among and between samples by utilizing the FPKM values of all genes in each sample, followed by the construction of a sample correlation heat map (Figure 1K).
To identify suitable candidate NRGs, we screened the expression patterns of candidate genes in the transcriptome datasets using the following criteria: CV < 0.5, τ-value < 0.5, and moderate expression (5 < average log2(TPM) < 10) in the nine different tissues (Table S1). Out of the total 799 candidate NRGs, we selected 11 genes: DNAJ (DnaJ protein; LOC111018672), HSCP2 (Heat shock cognate protein 2; LOC111013580), ARF1 (ADP-ribosylation factor 1; LOC111006269), UP (Uncharacterized protein; LOC111009092), HMG1/2 (HMG1/2-like protein; LOC111012664), TRXH-1 (Thioredoxin H-type 1-like protein; LOC111013893), PHOS32 (Universal stress protein PHOS32; LOC111009491), GAPDH2 (Glyceraldehyde-3-phosphate dehydrogenase 2; LOC111008959), RPL35-2 (60S ribosomal protein L35-2; LOC111010277), UBC36 (Ubiquitin-conjugating enzyme E2 36; LOC111012841), RPS8 (40S ribosomal protein S8; LOC111011823) (Table 1). Additionally, we selected five commonly used TRGs for further comparison with the NRGs. The five TRGs included are CYP (LOC111007901) [25], EF1α (LOC111011110) [26], TIP41 (TIP41-like protein; LOC111017412) [7], ACT7 (LOC111005604) [22], and GAPDH (LOC111016929) [23] (Table 1).

3.2. Verification of Primer Specificity and PCR Amplification Efficiency

We designed 16 primer pairs specific to the 11 NRGs and five TRGs for qRT-PCR. To confirm the specificity of these primer pairs, we analyzed the melting curves. The results showed that all 16 reference genes exhibited a single amplification peak (Figure S1). We then examined the primer specificity based on the standard curves of the 16 reference genes, which were obtained by diluting cDNA in a 5-fold gradient. The amplification efficiency ranged from 94.4% for GAPDH to 109.7% for UP, and all the correlation coefficients (R2) were greater than 0.98 (Table 1). These results indicated that the newly developed primer pairs were specific and efficient for qRT-PCR.

3.3. Expression Profiles and Cycle Quantification Values of the Reference Genes

We first analyzed the transcriptome datasets from the nine different tissues and constructed a heatmap based on the expression profiles of the 16 genes (Figure 2A, Table S2). The heatmap revealed that the transcript levels of NRGs exhibited less fluctuation than those of TRGs in different tissues (Figure 2A, Table S2).
To further examine the transcript levels of the 16 genes, we used qRT-PCR to generate cycle quantification (Cq) values for each candidate reference gene. The Cq value is used as a measure of transcript abundance, and a suitable reference gene should have a moderate transcript level (a Cq value of 15 to 30) to provide the most accurate normalization [38]. With the exception of GAPDH (Cq value of 20.46 to 32.63), all TRGs and NRGs met this basic requirement for use in standardization (Figure 2B, Table S3). The Cq values for the five TRGs ranged from 19.28 ± 1.45 (CYP) to 25.42 ± 4.26 (GAPDH), with GAPDH showing the largest variation between the maximum and minimum Cq values (12.17), while CYP showed the smallest (4.98). In contrast, the Cq values for the 11 NRGs ranged from 20.41 ± 1.39 (PHOS32) to 23.14 ± 2.68 (HSCP2), with HSCP2 having the largest range of variation (9.66) and TRXH-1 having the smallest (4.00) (Figure 2B, Table S3). These results indicated that most NRGs exhibited a more stable expression range than TRGs and were therefore more suitable as reference genes.

3.4. Expression Stability Analysis of TRGs and NRGs

The expression stabilities of the 11 NRGs and five TRGs in nine tissues were evaluated using the geNorm, BestKeeper, ΔCt method, NormFinder, and RefFinder algorithms. geNorm assessed the stability of the reference genes using the M value (reference expression stability measure). A lower M value indicates more stable gene expression, and the default threshold for M is 1.5 [33]. In our study, all TRGs and NRGs were below the default limit of 1.5. Specifically, HMG1/2 and ARF1 had the same minimum M value, both at 0.42, and were therefore considered the most stable reference genes (Figure 3A, Table S4). HSCP2 and GAPDH were determined to be the least stable reference genes, with M values of 1.11 and 1.40, respectively (Figure 3A, Table S4).
BestKeeper calculates the coefficient of variation (CV) and standard deviation (SD) of the Cq value to evaluate the stability of the reference genes, and the gene with a smaller CV ± SD value is considered to be a more stable reference gene [34]. TRXH-1 had the lowest CV ± SD value (1.08), indicating that it was the most stable gene. This was followed by PHOS32 (1.10), while GAPDH was the most unstable gene with the highest CV ± SD value (3.56) (Figure 3B, Table S4).
The ΔCt method assesses the stability of gene expression by calculating the mean standard deviation (SD) value for each gene. Genes with a lower SD of mean Cq values had higher expression stability [35]. According to this method, HMG1/2 was the most stable gene, with the lowest stability value (1.01). This was followed by TIP41 (1.03), while GAPDH had the highest stability value (3.40) (Figure 3C, Table S4).
The NormFinder algorithm directly assesses the stability of reference genes based on within- and between-group variances, with lower values indicating higher stability [1]. According to this algorithm, TIP41 (0.17) and HMG1/2 (0.25) were the most stable genes, while HSCP2 (1.93) and GAPDH (3.31) were the most unstable genes (Figure 3D, Table S4).
To mitigate the limitations of individual algorithms, we employed the RefFinder algorithm to synthesize the results obtained from geNorm, NormFinder, ΔCt, and BestKeeper [36]. The comprehensive ranking indicated that the two most stable genes were HMG1/2 and PHOS32, while HSCP2 and GAPDH were identified as the least stable genes (Figure 3E, Table S4).
Additionally, we utilized the geNorm algorithm to calculate the pairwise variation (Vn/Vn + 1) in order to determine the optimal number of reference genes required for qRT-PCR normalization. If Vn/Vn + 1 is less than 0.15, the optimal number of reference genes is n [33]. Our analysis revealed that all groups exhibited V2/3 values below the cutoff of 0.15, indicating that the use of two stable reference genes was sufficient for qRT-PCR normalization (Figure 3F, Table S5). Based on the results obtained from all algorithms, we selected HMG1/2 and PHOS32 for further validation of their reliability.

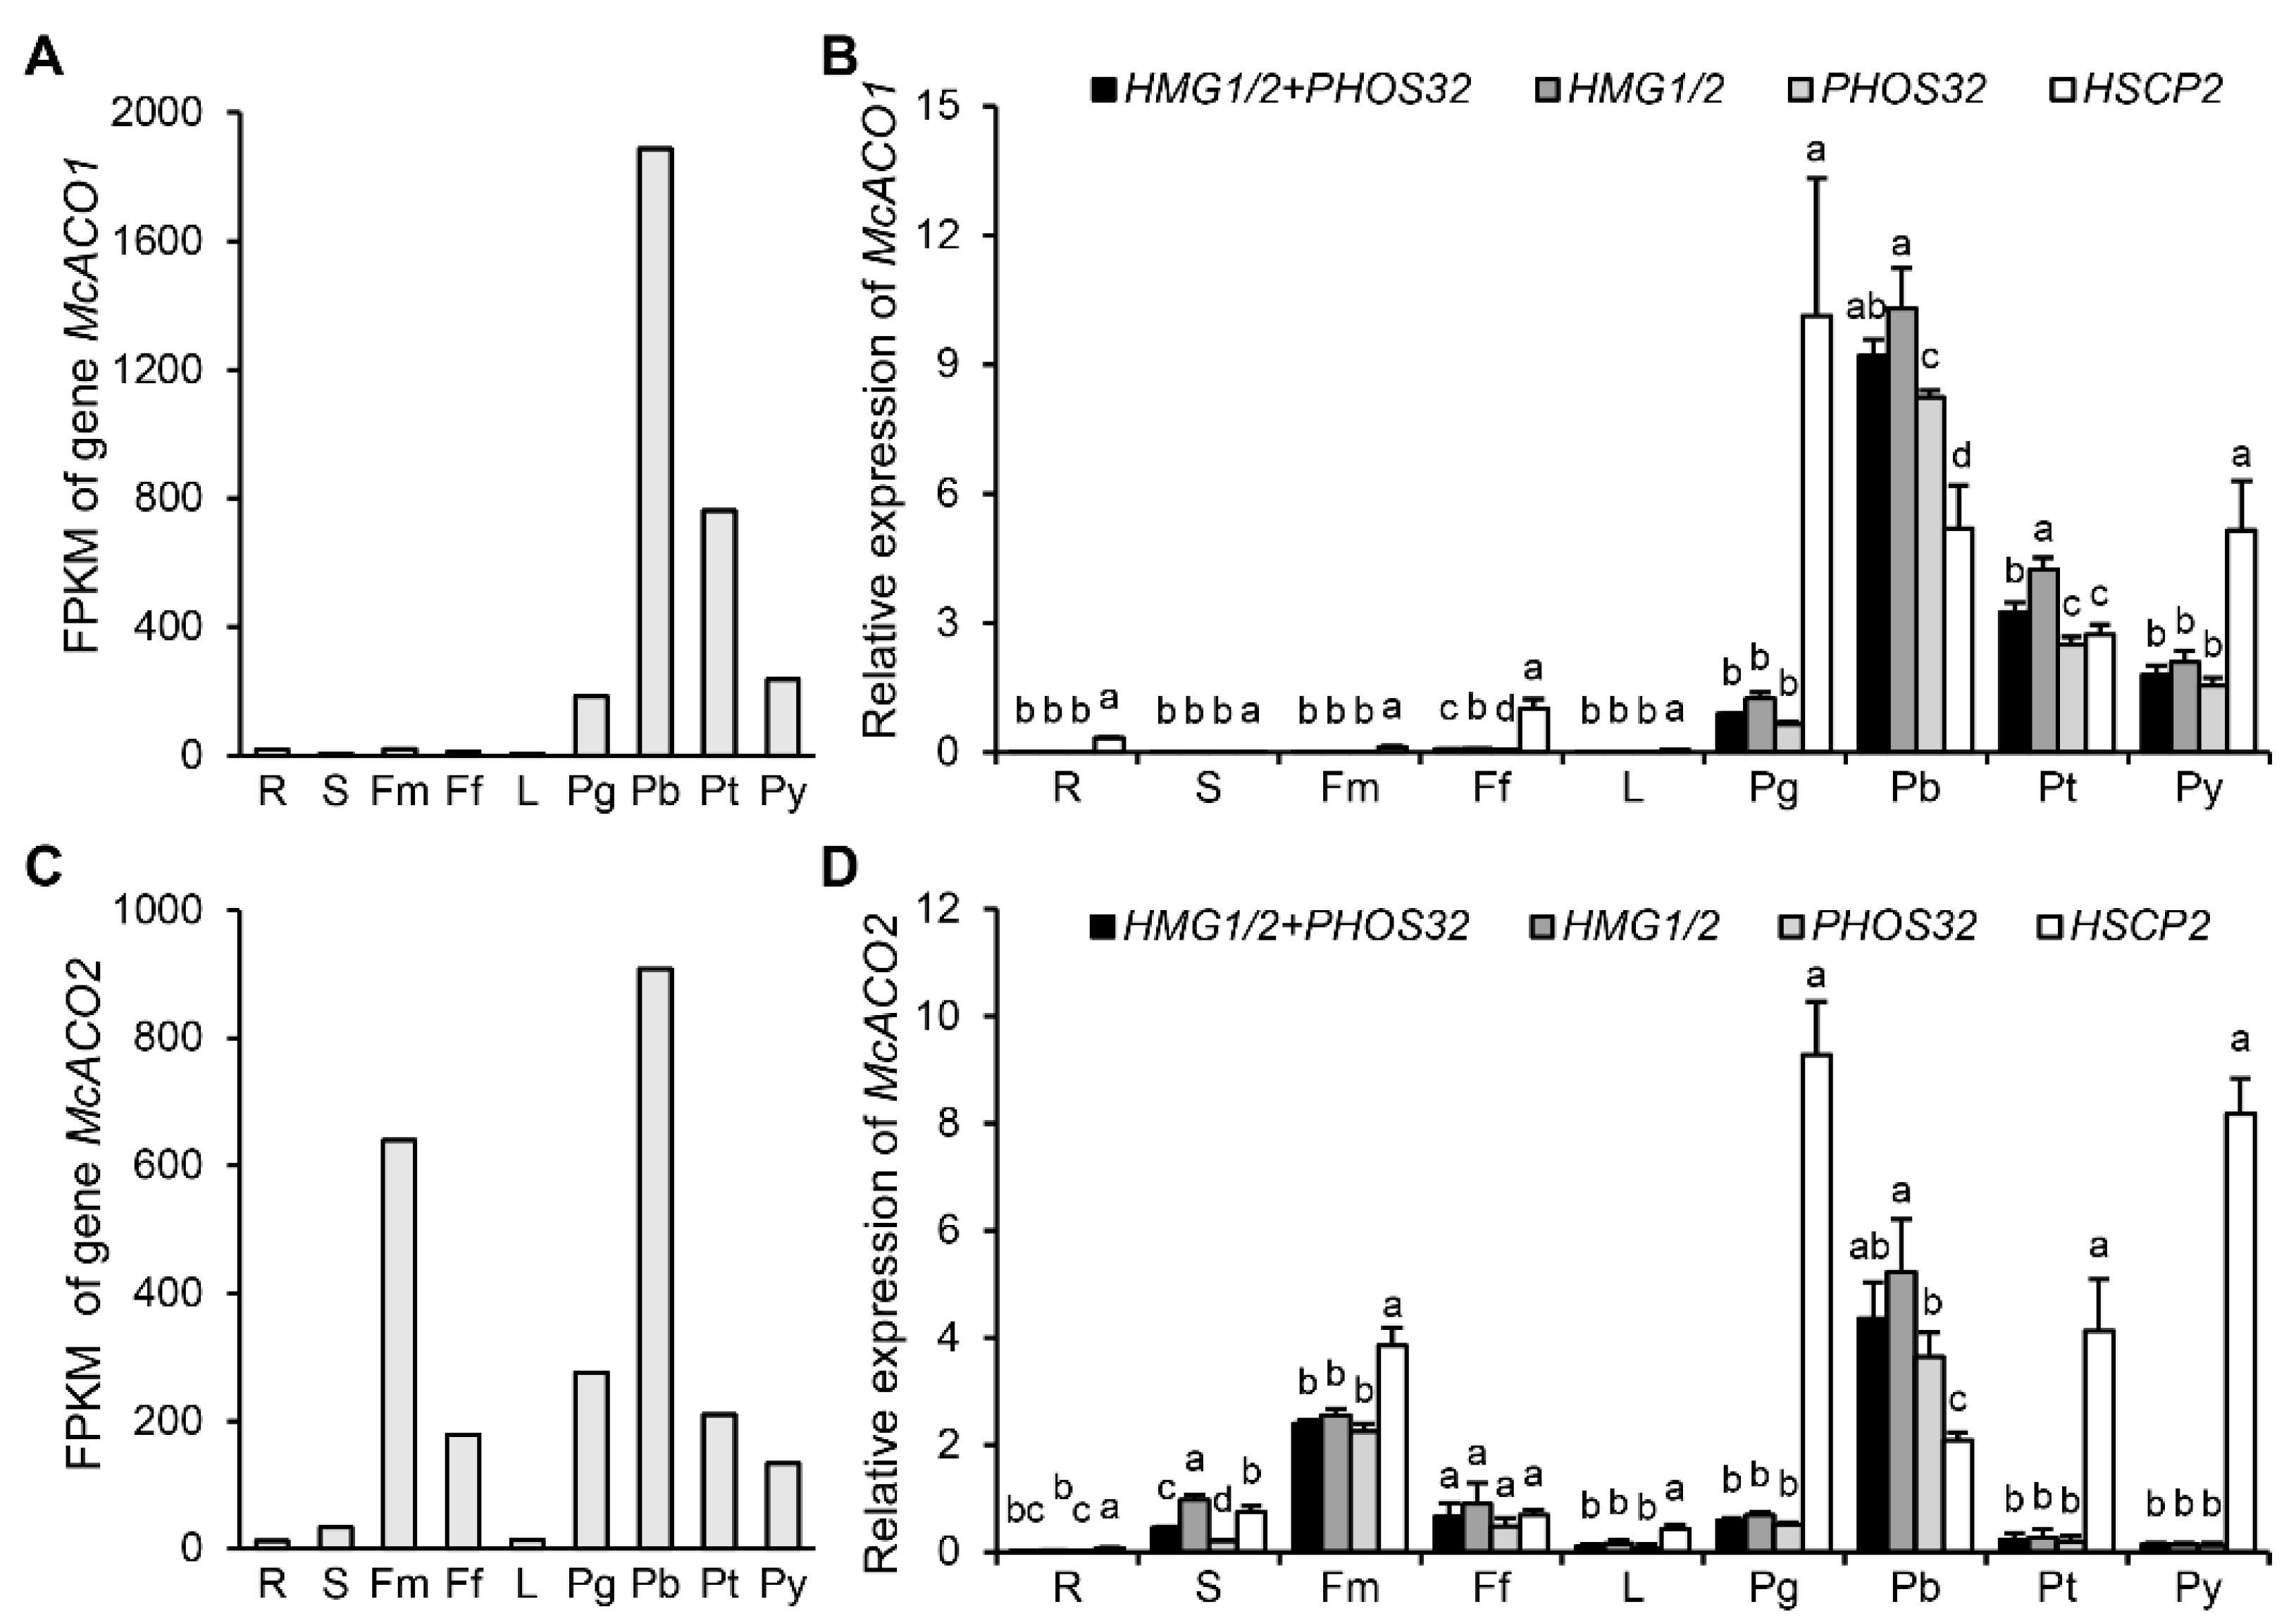
3.5. Validation of HMG1/2 and PHOS32 as Optimal NRGs

According to the results obtained from RefFinder and geNorm, we selected two reference genes with the highest stability, namely HMG1/2 and PHOS32, as well as one reference gene with low stability, HSCP2, to investigate the expression patterns of McACO1 (LOC111022870) and McACO2 (LOC111016812). In addition, we obtained the raw expression data (FPKM values) for McACO1 and McACO2 in nine different tissues from the transcriptome datasets. These values were used to represent the expression patterns of McACO1 and McACO2 and served as controls for the qRT-PCR results (Figure 4A,C).
Subsequently, we compared the normalization of qRT-PCR data for McACO1 and McACO2 using either HMG1/2 or PHOS32 alone, or in combination, with the normalization using HSCP2 (Figure 4B,D). The results revealed that the expression profiles generated using HMG1/2 and PHOS32, either alone or in combination, were similar and significantly different from the profiles obtained using HSCP2 as the reference gene. Furthermore, the expression patterns of McACO1 and McACO2, normalized using HMG1/2 and PHOS32, closely resembled those represented by the raw signal intensity values. However, when HSCP2 was used as the reference gene, the expression patterns deviated significantly, particularly in the green mature and yellow stage fruit pulp (Figure 4A–D). These findings indicated that HMG1/2 and PHOS32 were suitable as new reference genes for bitter gourd.

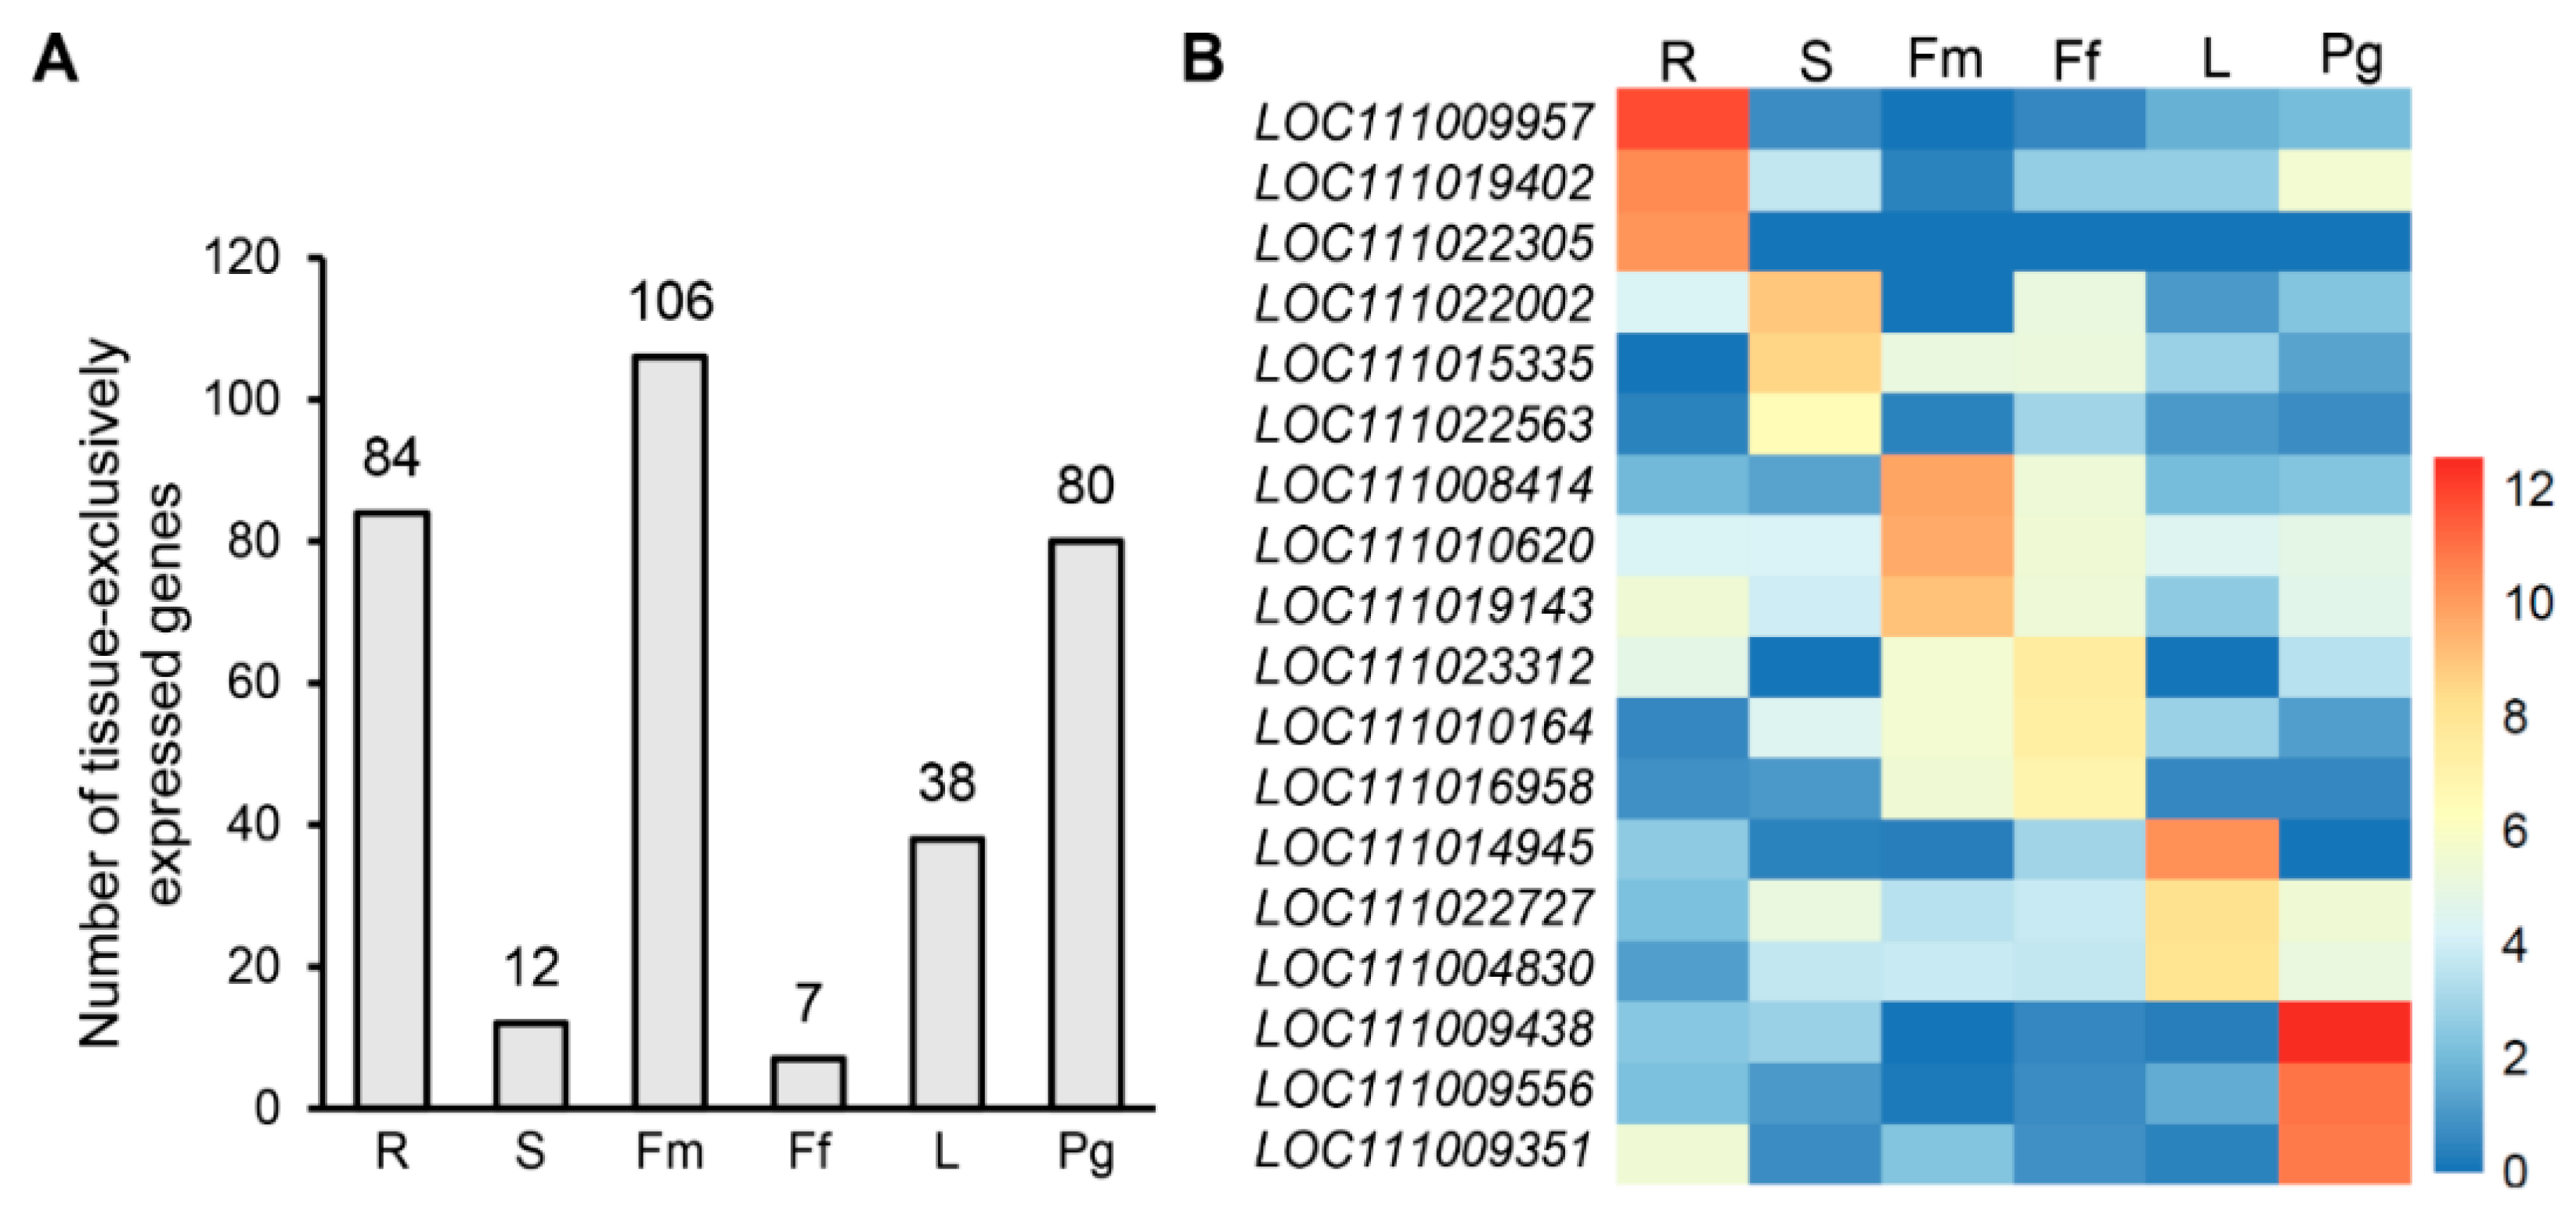
3.6. Identification of Candidate Tissue-Specific Genes Based on an RNA-Seq Dataset

To identify tissue-specific genes, we analyzed the expression patterns of candidate genes in the transcriptome datasets using the following criteria: τ value > 0.9, specific expression in one tissue/organ, and expression levels below 50 FPKM in other tissues. Our screening results revealed that 84, 12, 106, 7, 38, and 80 genes exhibited tissue-specific expression in the root, stem, male flower, female flower, leaf, and pulp (green mature stage), respectively (Figure 5A, Table S6). From each of these six tissues, we selected the three most highly expressed tissue-specific genes, resulting in a total of 18 genes. We then created a heatmap to visualize their expression patterns (Figure 5B).

3.7. Validation of 18 Tissue-Specific Genes Using HMG1/2

To verify the reliability of the 18 tissue-specific genes, we examined their expression profiles using qRT-PCR and normalized the data using the most stable reference gene, HMG1/2. The expression patterns of the tissue-specific genes that passed validation were as follows: three genes in the root (LOC111009957, LOC111019402, and LOC111022305), two genes in the stem (LOC111022002 and LOC111022563), three genes in the leaf (LOC111014945, LOC111022727, and LOC111004830), two genes in the male flower (LOC111008414 and LOC111010620), and two genes in the pulp (LOC111009438 and LOC111009556). However, none of the three female-flower-specific genes passed validation, potentially due to their low expression levels (Figure 6A–F).

4. Discussion

Previous studies have demonstrated that accurate reference genes can be efficiently selected using gene expression data from public databases [29]. However, for non-model organisms without a public gene expression database, such as bitter gourd, it is often necessary to use homologous genes of housekeeping genes like GAPDH, ACT1, and EF1α as internal reference genes for qRT-PCR normalization. However, this approach often yields unreliable results [27,28]. To overcome this limitation, we utilized RNA-seq transcriptome datasets to rapidly identify 11 NRGs and compared their stability with five TRGs using five different algorithms. Although the ranking results varied among the algorithms, RPS8, DNAJ, EF1α, HSCP2, and GAPDH were consistently identified as the least reliable genes (Figure 3A–E, Table S4). The most stable TRG, TIP41, was also found to be highly stable in another bitter gourd reference gene study, further supporting its reliability (Figure 3A–E, Table S4) [7]. Combining multiple analytical algorithms can enhance the evaluation of internal reference genes [39,40]. Therefore, based on the comprehensive evaluation using RefFinder, we selected HMG1/2 and PHOS32 as the most reliable reference genes in bitter gourd organs (Figure 3E).
HMG1/2 is a gene that encodes a chromosomal protein containing an HMG-box domain, which exhibits high conservation across eukaryotes. Its primary function is believed to be the promotion of structural assembly in nucleoprotein complexes [41]. It can be speculated that HMG1/2 is selected as a stable reference gene due to its crucial role in this biological process, ensuring consistent expression across various tissues. On the other hand, PHOS32 encodes a universal stress protein that is widely present in diverse organisms. In plants, these proteins are known to serve as protein chaperones or RNA chaperones, assisting plants in coping with molecular stress and enabling them to withstand multiple environmental pressures [42,43]. Additionally, they can interact with other proteins, regulating essential plant functions. Considering the potential impact of PHOS32 on gene expression under plant stress conditions, caution should be exercised when selecting it as an internal reference gene in stress-related experiments. It is advisable to avoid using PHOS32 as an internal reference gene to ensure accurate and reliable results in such experiments.
Numerous studies have reported significant differences in the expression levels of target genes when stable and unstable reference genes are used as internal controls [44,45]. To validate the accuracy of our results, we examined the expression patterns of McACO1 and McACO2 in nine samples. McACO1 and McACO2 encode 1-aminocyclopropane-1-carboxylic acid oxidases, which catalyze the final step in plant ethylene biosynthesis. The expression of these genes varies significantly during different ripening stages of climacteric fruit [46,47]. McACO1 and McACO2 expression increases rapidly, especially during the phase of sudden ethylene release. These expression characteristics make them suitable target genes for assessing the stability of reference genes. Our results demonstrated that qRT-PCR data normalized using HMG1/2 and PHOS32 (alone or in combination) accurately reflected the sharp increase in McACO1 and McACO2 expression at the breaker stage. However, significant bias was observed when HSCP2 was used for normalization, particularly in the green mature and yellow stage pulps (Figure 4). These findings indicate that HMG1/2 and PHOS32 are suitable for normalizing the qRT-PCR results of fruit ripening-related genes.
Transgenes are typically driven by promoters that determine the temporal and spatial expression patterns of the transgenes. Constitutive promoters, such as the cauliflower virus (CaMV) 35S, ubiquitin, and actin promoters, are commonly used [48,49,50]. However, these promoters lead to pervasive overexpression of target genes in various tissues and may compete for energy required for normal plant growth and development [51,52]. Therefore, tissue-specific promoters are necessary for accurately regulating the expression of target genes in time and space and for minimizing any adverse effects on plant growth and development. In this study, we used transcriptome datasets from multiple tissues to rapidly identify tissue-specific genes and validated 15 of them using qRT-PCR (Figure 5 and Figure 6). Cloning the promoters of these genes will facilitate the improvement of specific tissue traits in bitter gourds through transgenic genetics.
As demonstrated in this study, the traditionally used TRGs may not exhibit stable expression in certain species, leading to significant interference with qRT-PCR results. Additionally, tissue-specific promoters also have species-specific limitations and cannot generally be used across different species. Our strategy of screening NRGs and tissue-specific genes from RNA-Seq databases effectively overcomes these problems. Importantly, this strategy is simple and versatile, making it easily applicable to other species.

5. Conclusions

This study presents a robust strategy for the rapid identification of reference and tissue-specific genes using transcriptome datasets. By applying this strategy, we successfully identified two optimal reference genes, HMG1/2 and PHOS32, in bitter gourd. Through the use of five different algorithms, we unequivocally demonstrated that these two genes exhibited higher stability compared to TRGs. Furthermore, we identified and validated three root-specific genes, two stem-specific genes, three leaf-specific genes, two male flower-specific genes, and two pulp-specific genes in bitter gourd. These findings have significant implications for improving the accuracy of target gene expression quantification in bitter gourd and serve as a foundation for the subsequent utilization of tissue-specific promoters in the design and production of transgenic bitter gourd.

Supplementary Materials

The following supporting information can be downloaded at: https://www.mdpi.com/article/10.3390/horticulturae9121262/s1. Figure S1: Primer pair specificity for qRT-PCR amplification. Table S1: List of candidate reference genes after screening. Table S2: log2(FPKM) values of the 16 reference genes for the construction of the heatmap. Table S3: Cq values of the 16 reference genes. Table S4: Expression stability of the 16 reference genes. Table S5: Pairwise variation (V) of the 16 reference genes. Table S6: List of 327 candidate tissue-specific genes after screening.

Author Contributions

Formal analysis, G.Z.; funding acquisition, J.L. (Jianning Luo), J.L. (Junxing Li), X.L. and H.W.; investigation, Y.Z. and X.Z.; methodology, Y.Z. and Y.M.; project administration, J.L. (Jianning Luo), J.L. (Junxing Li), X.Z., H.G., L.D., X.L. and H.W.; resources, J.L. (Jianning Luo), J.L. (Junxing Li), X.Z., H.G. and C.L.; software, Y.M. and G.Z.; supervision, L.D. and C.L.; validation, Y.Z.; writing—original draft, Y.Z.; writing—review and editing, X.L. and H.W. All authors have read and agreed to the published version of the manuscript.

Funding

This research was funded by the Key Realm R&D Program of Guangdong Province (2020B0202090002), the National Natural Science Foundation of China (32202479), the Science and Technology Program of Guangdong Province (2019A050520002), the Laboratory of Lingnan Modern Agriculture Project (NZ2021008), the Guangdong Basic and Applied Basic Research Foundation (2020A1515110748), and the Young Talent Support Project of the Guangzhou Association for Science and Technology.

Data Availability Statement

Data are contained within the article and Supplementary Materials.

Conflicts of Interest

The authors declare that they have no conflict of interest.

References

  1. Andersen, C.L.; Jensen, J.L.; Orntoft, T.F. Normalization of real-time quantitative reverse transcription-PCR data: A model-based variance estimation approach to identify genes suited for normalization, applied to bladder and colon cancer data sets. Cancer Res. 2004, 64, 5245–5250. [Google Scholar] [CrossRef] [PubMed]
  2. Sgamma, T.; Pape, J.; Massiah, A.; Jackson, S. Selection of reference genes for diurnal and developmental time-course real-time PCR expression analyses in lettuce. Plant Methods 2016, 12, 21. [Google Scholar] [CrossRef] [PubMed]
  3. Yi, N.; Kim, Y.S.; Jeong, M.H.; Oh, S.J.; Jeong, J.S.; Park, S.H.; Jung, H.; Choi, Y.D.; Kim, J.K. Functional analysis of six drought-inducible promoters in transgenic rice plants throughout all stages of plant growth. Planta 2010, 232, 743–754. [Google Scholar] [CrossRef] [PubMed]
  4. Zhao, L.; Lu, L.; Zhang, L.; Wang, A.; Wang, N.; Liang, Z.; Lu, X.; Tang, K. Molecular evolution of the E8 promoter in tomato and some of its relative wild species. J. Biosci. 2009, 34, 71–83. [Google Scholar] [CrossRef] [PubMed]
  5. Ma, J.K.; Drossard, J.; Lewis, D.; Altmann, F.; Boyle, J.; Christou, P.; Cole, T.; Dale, P.; van Dolleweerd, C.J.; Isitt, V.; et al. Regulatory approval and a first-in-human phase I clinical trial of a monoclonal antibody produced in transgenic tobacco plants. Plant Biotechnol. J. 2015, 13, 1106–1120. [Google Scholar] [CrossRef] [PubMed]
  6. Hu, A.; Yang, X.; Zhu, J.; Wang, X.; Liu, J.; Wang, J.; Wu, H.; Zhang, H.; Zhang, H. Selection and validation of appropriate reference genes for RT-qPCR analysis of Nitraria sibirica under various abiotic stresses. BMC Plant Biol. 2022, 22, 592. [Google Scholar] [CrossRef]
  7. Wang, Z.; Xu, J.; Liu, Y.; Chen, J.; Lin, H.; Huang, Y.; Bian, X.; Zhao, Y. Selection and validation of appropriate reference genes for real-time quantitative PCR analysis in Momordica charantia. Phytochemistry 2019, 164, 1–11. [Google Scholar] [CrossRef]
  8. Lin, F.; Bao, H.; Yang, J.; Liu, Y.; Dai, H.; Zhao, H. Genome-Wide Discovery of Tissue-Specific Genes in Maize. Plant Mol. Biol. Rep. 2016, 34, 1204–1214. [Google Scholar] [CrossRef]
  9. Chen, L.; Li, Y.; Wang, Y.; Li, W.; Feng, X.; Zhao, L. Use of High Resolution Spatiotemporal Gene Expression Data to Uncover Novel Tissue-Specific Promoters in Tomato. Agriculture 2021, 11, 1195. [Google Scholar] [CrossRef]
  10. Xun, H.; Zhang, X.; Yu, J.; Pang, J.; Wang, S.; Liu, B.; Dong, Y.; Jiang, L.; Guo, D. Analysis of expression characteristics of soybean leaf and root tissue-specific promoters in Arabidopsis and soybean. Transgenic Res. 2021, 30, 799–810. [Google Scholar] [CrossRef] [PubMed]
  11. Kryuchkova-Mostacci, N.; Robinson-Rechavi, M. A benchmark of gene expression tissue-specificity metrics. Brief. Bioinform. 2017, 18, 205–214. [Google Scholar] [CrossRef] [PubMed]
  12. Yanai, I.; Benjamin, H.; Shmoish, M.; Chalifa-Caspi, V.; Shklar, M.; Ophir, R.; Bar-Even, A.; Horn-Saban, S.; Safran, M.; Domany, E.; et al. Genome-wide midrange transcription profiles reveal expression level relationships in human tissue specification. Bioinformatics 2005, 21, 650–659. [Google Scholar] [CrossRef] [PubMed]
  13. Jia, S.; Shen, M.; Zhang, F.; Xie, J. Recent Advances in Momordica charantia: Functional Components and Biological Activities. Int. J. Mol. Sci. 2017, 18, 2555. [Google Scholar] [CrossRef]
  14. Guo, J.; Xu, W.; Hu, Y.; Huang, J.; Zhao, Y.; Zhang, L.; Huang, C.H.; Ma, H. Phylotranscriptomics in Cucurbitaceae Reveal Multiple Whole-Genome Duplications and Key Morphological and Molecular Innovations. Mol. Plant 2020, 13, 1117–1133. [Google Scholar] [CrossRef] [PubMed]
  15. Jiang, B.; Ji, M.; Liu, W.; Chen, L.; Cai, Z.; Zhao, Y.; Bi, X. Antidiabetic activities of a cucurbitane–type triterpenoid compound from Momordica charantia in alloxan–induced diabetic mice. Mol. Med. Rep. 2016, 14, 4865–4872. [Google Scholar] [CrossRef]
  16. Sun, Y.; Sun, F.; Li, J.; Wu, M.; Fan, X.; Meng, Y.; Meng, Y. Mono-PEGylation of Alpha-MMC and MAP30 from Momordica charantia L.: Production, Identification and Anti-Tumor Activity. Molecules 2016, 21, 1457. [Google Scholar] [CrossRef]
  17. Zhang, C.; Chen, H.; Bai, W. Characterization of Momordica charantia L. polysaccharide and its protective effect on pancreatic cells injury in STZ-induced diabetic mice. Int. J. Biol. Macromol. 2018, 115, 45–52. [Google Scholar] [CrossRef]
  18. Deshaware, S.; Gupta, S.; Singhal, R.S.; Joshi, M.; Variyar, P.S. Debittering of bitter gourd juice using beta-cyclodextrin: Mechanism and effect on antidiabetic potential. Food Chem. 2018, 262, 78–85. [Google Scholar] [CrossRef]
  19. Yan, J.K.; Wu, L.X.; Qiao, Z.R.; Cai, W.D.; Ma, H. Effect of different drying methods on the product quality and bioactive polysaccharides of bitter gourd (Momordica charantia L.) slices. Food Chem. 2019, 271, 588–596. [Google Scholar] [CrossRef]
  20. Prajapati, U.; Asrey, R.; Varghese, E.; Singh, A.K.; Pal Singh, M. Effects of postharvest ultraviolet-C treatment on shelf-life and quality of bitter gourd fruit during storage. Food Packag. Shelf Life 2021, 28, 100665. [Google Scholar] [CrossRef]
  21. Takase, S.; Kera, K.; Hirao, Y.; Hosouchi, T.; Kotake, Y.; Nagashima, Y.; Mannen, K.; Suzuki, H.; Kushiro, T. Identification of triterpene biosynthetic genes from Momordica charantia using RNA-seq analysis. Biosci. Biotechnol. Biochem. 2019, 83, 251–261. [Google Scholar] [CrossRef] [PubMed]
  22. Zhong, J.; Cheng, J.; Cui, J.; Hu, F.; Dong, J.; Liu, J.; Zou, Y.; Hu, K. MC03g0810, an Important Candidate Gene Controlling Black Seed Coat Color in Bitter Gourd (Momordica spp.). Front. Plant Sci. 2022, 13, 875631. [Google Scholar] [CrossRef]
  23. Zhong, J.; Cui, J.; Liu, J.; Zhong, C.; Hu, F.; Dong, J.; Cheng, J.; Hu, K. Fine-mapping and candidate gene analysis of the Mcgy1 locus responsible for gynoecy in bitter gourd (Momordica spp.). Theor. Appl. Genet 2023, 136, 81. [Google Scholar] [CrossRef] [PubMed]
  24. Chen, L.; Liu, J.; Liu, Z.; Xia, P.; Yuan, X.; Ning, Y. Genome-wide identification and expression analysis of the MLO gene family reveal a candidate gene associated with powdery mildew susceptibility in bitter gourd (Momordica charantia). Eur. J. Plant Pathol. 2020, 159, 163–178. [Google Scholar] [CrossRef]
  25. Tuan, P.A.; Kim, J.K.; Park, N.I.; Lee, S.Y.; Park, S.U. Carotenoid content and expression of phytoene synthase and phytoene desaturase genes in bitter melon (Momordica charantia). Food Chem. 2011, 126, 1686–1692. [Google Scholar] [CrossRef] [PubMed]
  26. Rajaee Behbahani, S.; Iranbakhsh, A.; Ebadi, M.; Majd, A.; Ardebili, Z.O. Red elemental selenium nanoparticles mediated substantial variations in growth, tissue differentiation, metabolism, gene transcription, epigenetic cytosine DNA methylation, and callogenesis in bittermelon (Momordica charantia); an in vitro experiment. PLoS ONE 2020, 15, e0235556. [Google Scholar] [CrossRef] [PubMed]
  27. Ji, Y.; Tu, P.; Wang, K.; Gao, F.; Yang, W.; Zhu, Y.; Li, S. Defining reference genes for quantitative real-time PCR analysis of anther development in rice. Acta Biochim. Biophys. Sin. 2014, 46, 305–312. [Google Scholar] [CrossRef]
  28. Tang, X.; Zhang, N.; Si, H.; Calderon-Urrea, A. Selection and validation of reference genes for RT-qPCR analysis in potato under abiotic stress. Plant Methods 2017, 13, 85. [Google Scholar] [CrossRef]
  29. Zhao, Z.; Zhang, Z.; Ding, Z.; Meng, H.; Shen, R.; Tang, H.; Liu, Y.G.; Chen, L. Public-transcriptome-database-assisted selection and validation of reliable reference genes for qRT-PCR in rice. Sci. China Life Sci. 2020, 63, 92–101. [Google Scholar] [CrossRef]
  30. Zhao, G.; Wang, M.; Gan, Y.; Gong, H.; Li, J.; Zheng, X.; Liu, X.; Zhao, S.; Luo, J.; Wu, H. Identification of suitable reference genes for quantitative reverse transcription PCR in Luffa (Luffa cylindrica). Physiol. Mol. Biol. Plants 2022, 28, 737–747. [Google Scholar] [CrossRef]
  31. Chen, F.Z.; You, L.J.; Yang, F.; Wang, L.N.; Guo, X.Q.; Gao, F.; Hua, C.; Tan, C.; Fang, L.; Shan, R.Q.; et al. CNGBdb: China National GeneBank DataBase. Yi Chuan 2020, 42, 799–809. [Google Scholar] [CrossRef] [PubMed]
  32. Guo, X.; Chen, F.; Gao, F.; Li, L.; Liu, K.; You, L.; Hua, C.; Yang, F.; Liu, W.; Peng, C.; et al. CNSA: A data repository for archiving omics data. Database 2020, 2020, baaa055. [Google Scholar] [CrossRef] [PubMed]
  33. Vandesompele, J.; De Preter, K.; Pattyn, F.; Poppe, B.; Van Roy, N.; De Paepe, A.; Speleman, F. Accurate normalization of real-time quantitative RT-PCR data by geometric averaging of multiple internal control genes. Genome Biol. 2002, 3, research0034.1. [Google Scholar] [CrossRef]
  34. Pfaffl, M.W.; Tichopad, A.; Prgomet, C.; Neuvians, T.P. Determination of stable housekeeping genes, differentially regulated target genes and sample integrity: BestKeeper-Excel-based tool using pair-wise correlations. Biotechnol. Lett. 2004, 26, 509–515. [Google Scholar] [CrossRef] [PubMed]
  35. Silver, N.; Best, S.; Jiang, J.; Thein, S.L. Selection of housekeeping genes for gene expression studies in human reticulocytes using real-time PCR. BMC Mol. Biol. 2006, 7, 33. [Google Scholar] [CrossRef]
  36. Xie, F.; Xiao, P.; Chen, D.; Xu, L.; Zhang, B. miRDeepFinder: A miRNA analysis tool for deep sequencing of plant small RNAs. Plant Mol. Biol. 2012, 80, 75–84. [Google Scholar] [CrossRef] [PubMed]
  37. Xie, F.; Wang, J.; Zhang, B. RefFinder: A web-based tool for comprehensively analyzing and identifying reference genes. Funct Integr Genomics 2023, 23, 125. [Google Scholar] [CrossRef]
  38. Wan, H.; Zhao, Z.; Qian, C.; Sui, Y.; Malik, A.A.; Chen, J. Selection of appropriate reference genes for gene expression studies by quantitative real-time polymerase chain reaction in cucumber. Anal. Biochem. 2010, 399, 257–261. [Google Scholar] [CrossRef] [PubMed]
  39. Die, J.V.; Roman, B.; Nadal, S.; Gonzalez-Verdejo, C.I. Evaluation of candidate reference genes for expression studies in Pisum sativum under different experimental conditions. Planta 2010, 232, 145–153. [Google Scholar] [CrossRef]
  40. Wang, H.L.; Li, L.; Tang, S.; Yuan, C.; Tian, Q.; Su, Y.; Li, H.G.; Zhao, L.; Yin, W.; Zhao, R.; et al. Evaluation of Appropriate Reference Genes for Reverse Transcription-Quantitative PCR Studies in Different Tissues of a Desert Poplar via Comparision of Different Algorithms. Int. J. Mol. Sci. 2015, 16, 20468–20491. [Google Scholar] [CrossRef]
  41. Thomas, J.O.; Travers, A.A. HMG1 and 2, and related ‘architectural’ DNA-binding proteins. Trends Biochem. Sci. 2001, 26, 167–174. [Google Scholar] [CrossRef]
  42. Luo, D.; Wu, Z.; Bai, Q.; Zhang, Y.; Huang, M.; Huang, Y.; Li, X. Universal Stress Proteins: From Gene to Function. Int. J. Mol. Sci. 2023, 24, 4725. [Google Scholar] [CrossRef]
  43. Chi, Y.H.; Koo, S.S.; Oh, H.T.; Lee, E.S.; Park, J.H.; Phan, K.A.T.; Wi, S.D.; Bae, S.B.; Paeng, S.K.; Chae, H.B.; et al. The Physiological Functions of Universal Stress Proteins and Their Molecular Mechanism to Protect Plants From Environmental Stresses. Front. Plant Sci. 2019, 10, 750. [Google Scholar] [CrossRef] [PubMed]
  44. Feng, K.; Liu, J.X.; Xing, G.M.; Sun, S.; Li, S.; Duan, A.Q.; Wang, F.; Li, M.Y.; Xu, Z.S.; Xiong, A.S. Selection of appropriate reference genes for RT-qPCR analysis under abiotic stress and hormone treatment in celery. PeerJ 2019, 7, e7925. [Google Scholar] [CrossRef] [PubMed]
  45. Yang, Z.; Zhang, R.; Zhou, Z. Identification and Validation of Reference Genes for Gene Expression Analysis in Schima superba. Genes 2021, 12, 732. [Google Scholar] [CrossRef]
  46. Atkinson, R.G.; Gunaseelan, K.; Wang, M.Y.; Luo, L.; Wang, T.; Norling, C.L.; Johnston, S.L.; Maddumage, R.; Schroder, R.; Schaffer, R.J. Dissecting the role of climacteric ethylene in kiwifruit (Actinidia chinensis) ripening using a 1-aminocyclopropane-1-carboxylic acid oxidase knockdown line. J. Exp. Bot. 2011, 62, 3821–3835. [Google Scholar] [CrossRef]
  47. Houben, M.; Van de Poel, B. 1-Aminocyclopropane-1-Carboxylic Acid Oxidase (ACO): The Enzyme That Makes the Plant Hormone Ethylene. Front. Plant Sci. 2019, 10, 695. [Google Scholar] [CrossRef]
  48. Odell, J.T.; Nagy, F.; Chua, N.H. Identification of DNA sequences required for activity of the cauliflower mosaic virus 35S promoter. Nature 1985, 313, 810–812. [Google Scholar] [CrossRef]
  49. Christensen, A.H.; Quail, P.H. Ubiquitin promoter-based vectors for high-level expression of selectable and/or screenable marker genes in monocotyledonous plants. Transgenic Res. 1996, 5, 213–218. [Google Scholar] [CrossRef]
  50. Chen, H.; Tang, W.; Xu, C.; Li, X.; Lin, Y.; Zhang, Q. Transgenic indica rice plants harboring a synthetic cry2A* gene of Bacillus thuringiensis exhibit enhanced resistance against lepidopteran rice pests. Theor. Appl. Genet 2005, 111, 1330–1337. [Google Scholar] [CrossRef]
  51. Werner, T.; Nehnevajova, E.; Kollmer, I.; Novak, O.; Strnad, M.; Kramer, U.; Schmulling, T. Root-specific reduction of cytokinin causes enhanced root growth, drought tolerance, and leaf mineral enrichment in Arabidopsis and tobacco. Plant Cell. 2010, 22, 3905–3920. [Google Scholar] [CrossRef] [PubMed]
  52. Hirai, T.; Kim, Y.W.; Kato, K.; Hiwasa-Tanase, K.; Ezura, H. Uniform accumulation of recombinant miraculin protein in transgenic tomato fruit using a fruit-ripening-specific E8 promoter. Transgenic Res. 2011, 20, 1285–1292. [Google Scholar] [CrossRef] [PubMed]
Figure 1. Collection of nine different tissues of bitter gourd for RNA-Seq. (AE) Bitter gourd root (A), leaf (B), male flower (C), female flower (D), and stem (E) used for RNA-Seq. (FI) Bitter gourd fruit at the green mature stage (F), breaker stage (G), turning stage (H), and yellow stage (I) is used for RNA-Seq. Scale bars in (BE) 1 cm. Scale bars in (A,FI): 5 cm. (J) Box plot of gene expression distribution for nine samples. The abscissa is the sample name, and the ordinate is log2(FPKM + 1). (K) Correlation heatmap of nine samples. The abscissa and aspect coordinates in the figure are squared by the correlation coefficient for each sample.
Horticulturae 09 01262 g001
Figure 2. Expression heatmap and expression level range of TRGs and NRGs. (A) Heatmap depicting the expression levels of the five TRGs and 11 NRGs across nine different tissues, including fruit pulp at different ripening stages, as determined by RNA-Seq datasets. The heatmap is based on log2(FPKM) values, with red indicating high transcript levels and blue indicating low transcript levels. TRGs, traditional reference genes; NRGs, new reference genes; R, root; S, stem; Fm, male flower; Ff, female flower; L, leaf; Pg, pulp at the green mature stage; Pb, pulp at the breaker stage; Pt, pulp at the turning stage; Py, pulp at the yellow stage. (B) Expression data presented as threshold cycle quantification (Cq), with 75% of Cq values falling within the “box” range and 25% within the “vertical line” range. Whiskers represent the 95% confidence intervals. The lines across the box represent the medians of the Cq values, while the dots represent outliers. TRGs, traditional reference genes; NRGs, new reference genes.
Horticulturae 09 01262 g002
Figure 3. Expression stability of TRGs and NRGs. (AE) Stability values of the 16 candidate reference genes determined by geNorm (A), BestKeeper (B), ΔCt method (C), NormFinder (D), and RefFinder (E). (F) Pairwise variation (V) analysis performed by geNorm to determine the minimum number of reference genes required for normalization in different tissues and fruit ripening stages. A cut-off value of 0.15 (V) is commonly used to determine the need for additional reference genes.
Horticulturae 09 01262 g003
Figure 4. Analysis of the identified reference genes. (A,C) The transcript levels of McACO1 and McACO2 in various tissues and fruit ripening stages, as determined by the transcriptome data in the RNA-Seq datasets. (B,D) qRT-PCR analysis of McACO1 and McACO2 in different tissues and fruit ripening stages. The most stably expressed reference genes (HMG1/2 and PHOS32) and the least stably expressed reference gene (HSCP2) were used for normalization alone or in combination. R, root; S, stem; Fm, male flower; Ff, female flower; L, leaf; Pg, pulp at the green mature stage; Pb, pulp at the breaker stage; Pt, pulp at the turning stage; Py, pulp at the yellow stage. The data presented are the means ± SE (n = 3) of three independent biological replicates. Statistical significance (p < 0.05) was determined using the Duncan’s multiple range test, and different letters denote significant differences.
Horticulturae 09 01262 g004
Figure 5. Analysis of predicted tissue-specific genes. (A) Number of unigenes exclusively expressed in each of the six different tissues of the bitter gourd. Data from Table S6. R, root; S, stem; Fm, male flower; Ff, female flower; L, leaf; Pg, pulp at the green mature stage. (B) The heatmap of 18 predicted tissue-specific genes was drawn using transcriptome data from six different tissues in RNA-Seq datasets. The heatmap was generated using log2(FPKM + 1) values, with red indicating high transcript levels and blue indicating low transcript levels. R, root; S, stem; Fm, male flower; Ff, female flower; L, leaf; Pg, pulp at the green mature stage.
Horticulturae 09 01262 g005
Figure 6. Validation of 18 predicted tissue-specific genes. qRT-PCR validation of the predicted tissue-specific genes in root (A), stem (B), leaf (C), male flower (D), female flower (E), and fruit pulp at the green mature stage (F). HMG1/2 was used as the reference gene. R, root; S, stem; L, leaf; Fm, male flower; Ff, female flower; Pg, pulp at the green mature stage; ND, not detected. The data presented are the means ± SE (n = 3) of three independent biological replicates. Statistical significance (p < 0.05) in different tissues for the same gene was determined using the Duncan’s multiple range test, and different letters indicate significant differences.
Horticulturae 09 01262 g006
Table 1. Information on the TRGs and NRGs.
cGene Symbol
(Gene ID)
Gene DescriptionPrimer Sequence (5′–3′)
Forward/Reverse
Amplicon
Length (bp)
Amplification
Efficiency (%)
R2
CYP(LOC111007901)Peptidyl-prolyl cis-trans isomeraseCCAAATTGTTGACGGCATGG/
GTAGAGCCAAGGCATCAATC
12899.30.999
EF1α(LOC111011110)Elongation factor 1-alphaCTGTCGCAGTTGGTGTTATC/
CTTGTAAACCTCAGACGGAG
131103.00.989
TIP41(LOC111017412)TIP41-like proteinGGACACTCGTATGCATTGCG/
AGATGACGCTGGGATCGTTG
146103.80.998
ACT7(LOC111005604)Actin-7CAAGGTTGTTGCTCCACCAG/
GCACTTCCTGTGGACAATGG
142105.60.997
GAPDH(LOC111016929)Glyceraldehyde-3-phosphate dehydrogenaseAGTCCTCGACCAGAAGTTCG/
GTTGAGTGCAGCAGCTCTTG
12794.40.995
DNAJ(LOC111018672)DnaJ proteinGACTCATTTGGATAGCCGTC/
GAATGGCCTCTGGTACATTG
115107.80.998
HSCP2(LOC111013580)Heat shock cognate protein 2CTTATGGTGCTGCAGTTCAG/
CAACACTGTCATGACACCAC
131108.40.996
ARF1(LOC111006269)ADP-ribosylation factor 1CCTAATGCGATGAATGCTGC/
CTAAACCCTCGTATAGACCC
122108.30.998
UP(LOC111009092)Uncharacterized proteinCCGCAACATCTGCATCAATC/
CTTGTTGCGGACGAATTTCC
127109.70.998
HMG1/2(LOC111012664)HMG1/2-like proteinGCACCTTACATTGCTAAGGC/
CTCAGACATGGACTTCTCAG
129105.60.999
TRXH-1(LOC111013893)Thioredoxin H-type 1-like proteinGAAAGTGGACGTGGATGAAG/
TCCACCTTATCTGCACCAAC
129108.80.998
PHOS32(LOC111009491)Universal stress protein PHOS32CGTGAGAAGTTATGTGAGGC/
CACCACATAGTTGCTGACAC
117107.10.996
GAPDH2(LOC111008959)Glyceraldehyde-3-phosphate dehydrogenase 2GAAGACGATGTTGTGTCCTC/
TCATTGTCGTACCACGAGAC
119103.90.998
RPL35-2(LOC111010277)60S ribosomal protein L35-2CGCTTAGGGAAGCTTACAAG/
TCGCTCGGTCTTTAGAGATG
116100.90.993
UBC36(LOC111012841)Ubiquitin-conjugating
enzyme E2 36
CAAATGGAGTCCTGCTCTAC/
GCAATGTTCTCAGAAAGCGG
99106.50.997
RPS8(LOC111011823)40S ribosomal protein S8CTGCAGCATCTGCTAAGAAG/
TGTGGGTCAAGCTTACGATC
11895.90.998
Disclaimer/Publisher’s Note: The statements, opinions and data contained in all publications are solely those of the individual author(s) and contributor(s) and not of MDPI and/or the editor(s). MDPI and/or the editor(s) disclaim responsibility for any injury to people or property resulting from any ideas, methods, instructions or products referred to in the content.

