Article

Net Photosynthesis and Biomass Production in Stevia, Eggplant, and Cowpea Can Be Improved by Fertilization with Cyanobacteria (Limnospira maxima)

by
Anthony Ricardo Ariza-González
1,
Alfredo Jarma-Orozco
1,*,
Juan de Dios Jaraba-Navas
1,
Ana Isabel Pico-González
1,
Diana Sofia Herazo-Cárdenas
2,
Daniela Vegliante Arrieta
1,
Adriana Vallejo-Isaza
2,
Yirlis Yadeth Pineda-Rodriguez
1,
Luis Alfonso Rodriguez-Paez
1 and
Marcelo F. Pompelli
1,*
1
Facultad de Ciencias Agrícolas, Universidad de Córdoba, Montería 230002, Colombia
2
Facultad de Medicina Veterinaria y Zootecnia, Universidad de Córdoba, Montería 230002, Colombia
*
Authors to whom correspondence should be addressed.
Horticulturae 2023, 9(12), 1309; https://doi.org/10.3390/horticulturae9121309
Submission received: 25 October 2023 / Revised: 27 November 2023 / Accepted: 1 December 2023 / Published: 6 December 2023
(This article belongs to the Section Plant Nutrition)

Abstract

:
Conventional fertilizers often result in the accumulation of chemical residues in the environment with a significant threat to ecosystems, with leaching to the groundwater disrupting the delicate balance of ecosystems. To mitigate the adverse effects of chemical residues, we need new methods and the use of eco-friendly alternatives. Cyanobacteria could play a crucial role in sustainable agriculture by reducing the partial/complete use of synthetic fertilizers. This study assessed the impacts of different concentrations of Limnospira maxima extract on the physiological aspects of Vigna unguiculata, Stevia rebaudiana, and Solanum melongena. The gas exchange parameters, chlorophyll a fluorescence, and phenotypic characteristics were measured. The net photosynthesis (AN) of V. unguiculata, S. rebaudiana, and S. melongena increased by 23%, 40%, and 44%, respectively, upon the application of cyanobacteria extracts. Furthermore, the quantum yield of photosystem II showed that the extract application enhanced this response in the three species by 8.7%, 4.8%, and 11.3%, respectively. Similar results were found in the total plant biomass production with significant increases of 17%, 130%, and 80% with respect to the control. Moreover, a positive correlation was observed between AN and the majority of the evaluated parameters, which could illuminate the plant’s responses to the studied treatments. The promising potential of this cyanobacteria as a biofertilizer was accentuated.

Graphical Abstract

1. Introduction

The global population is increasing. Several studies suggest that it is expected to reach 9 billion people in 2050 [1]. This escalating trend has led to an increased demand for food to ensure food security and food distribution [1]. Food security is a critical priority in developing regions worldwide, where small landholders play a pivotal role in their national food production [2]. These small producers are indispensable in agriculture, as approximately 500 million of them globally contribute between 70% and 80% of the primary food sources for food security [3]. Within this context, some foods, like cowpea and eggplant, have emerged as potential models for enhancing food production, where yield improvements are essential to meet the growing global demand [1,4]. Stevia rebaudiana is commercially cultivated in several parts of the world due to the increasing base of health-conscious consumers and a preference for natural non-caloric sweeteners [5]. The global Stevia market size is estimated to be valued at USD 647.7 million in 2022 and is projected to grow at a rate of 8.0% to USD 1.14 billion in 2028 [6]. However, information regarding production limitations, grower perceptions, and preferences remains limited in scope [7]. Among these deficiencies, the low transfer of sustainable technologies such as organic fertilization and its applicability in production systems is noteworthy [8,9].
Inappropriate farming practices encompass the frequent application of chemically synthesized fertilizers [3]. This excessive application poses a limitation in food production, leading to economic problems, irreversible damage to biodiversity, and a depletion of energy reserves in surface and groundwater, with direct consequences for ecosystems and alterations in a soil’s physical, chemical, and biological properties [10]. Given the potential adverse impacts of these fertilizers, one viable alternative is the implementation of cyanobacteria [11].
Limnospira maxima, commonly known as “Spirulina”, thrives in tropical and subtropical freshwater environments with alkaline pH levels and high temperatures ranging from 25 °C to 35 °C [12]. These microorganisms have garnered considerable attention as beneficial bioagents due to their ability to produce biomass that spans from the preparation of extracts to their application in agriculture. They are beneficial for soil fertility and crops due to their capacity for atmospheric nitrogen fixation, phosphate solubilization, and production of bioactive substances such as phytohormones, polypeptides, amino acids, polysaccharides, and siderophores, stimulating plant growth and development [13,14]. Recently, cyanobacteria biomass has been extensively used in agriculture, and the products derived from cyanobacterial extracts have piqued the interest of farmers worldwide [15].
Multiple studies have provided evidence that cyanobacteria applications through extracts has enhanced the nutritional content, water absorption, and plant growth in various species, including lettuce [16], tomato [17], red beet [18], cucumber [19], red spinach [20], legumes [12], and onion [21]. However, studies regarding cyanobacteria’s impact on plant growth and development are lacking [22,23]. Given their potential benefits for biofertilizers and sustainable agriculture, both cyanobacterial biomass and extracts, such as those from L. maxima, hold promising potentials for use in food production [24].
Our main hypothesis is that S. rebaudiana, S. melongena, and V. unguiculata could ameliorate their crop production with the use of L. maxima extract. Given the potential impact of cyanobacteria on plant physiology, this study aims to evaluate the gas exchange responses, chlorophyll a fluorescence, and phenotypic characteristics of V. unguiculata, S. rebaudiana, and S. melongena treated with L. maxima extract under controlled growth conditions.

2. Materials and Methods

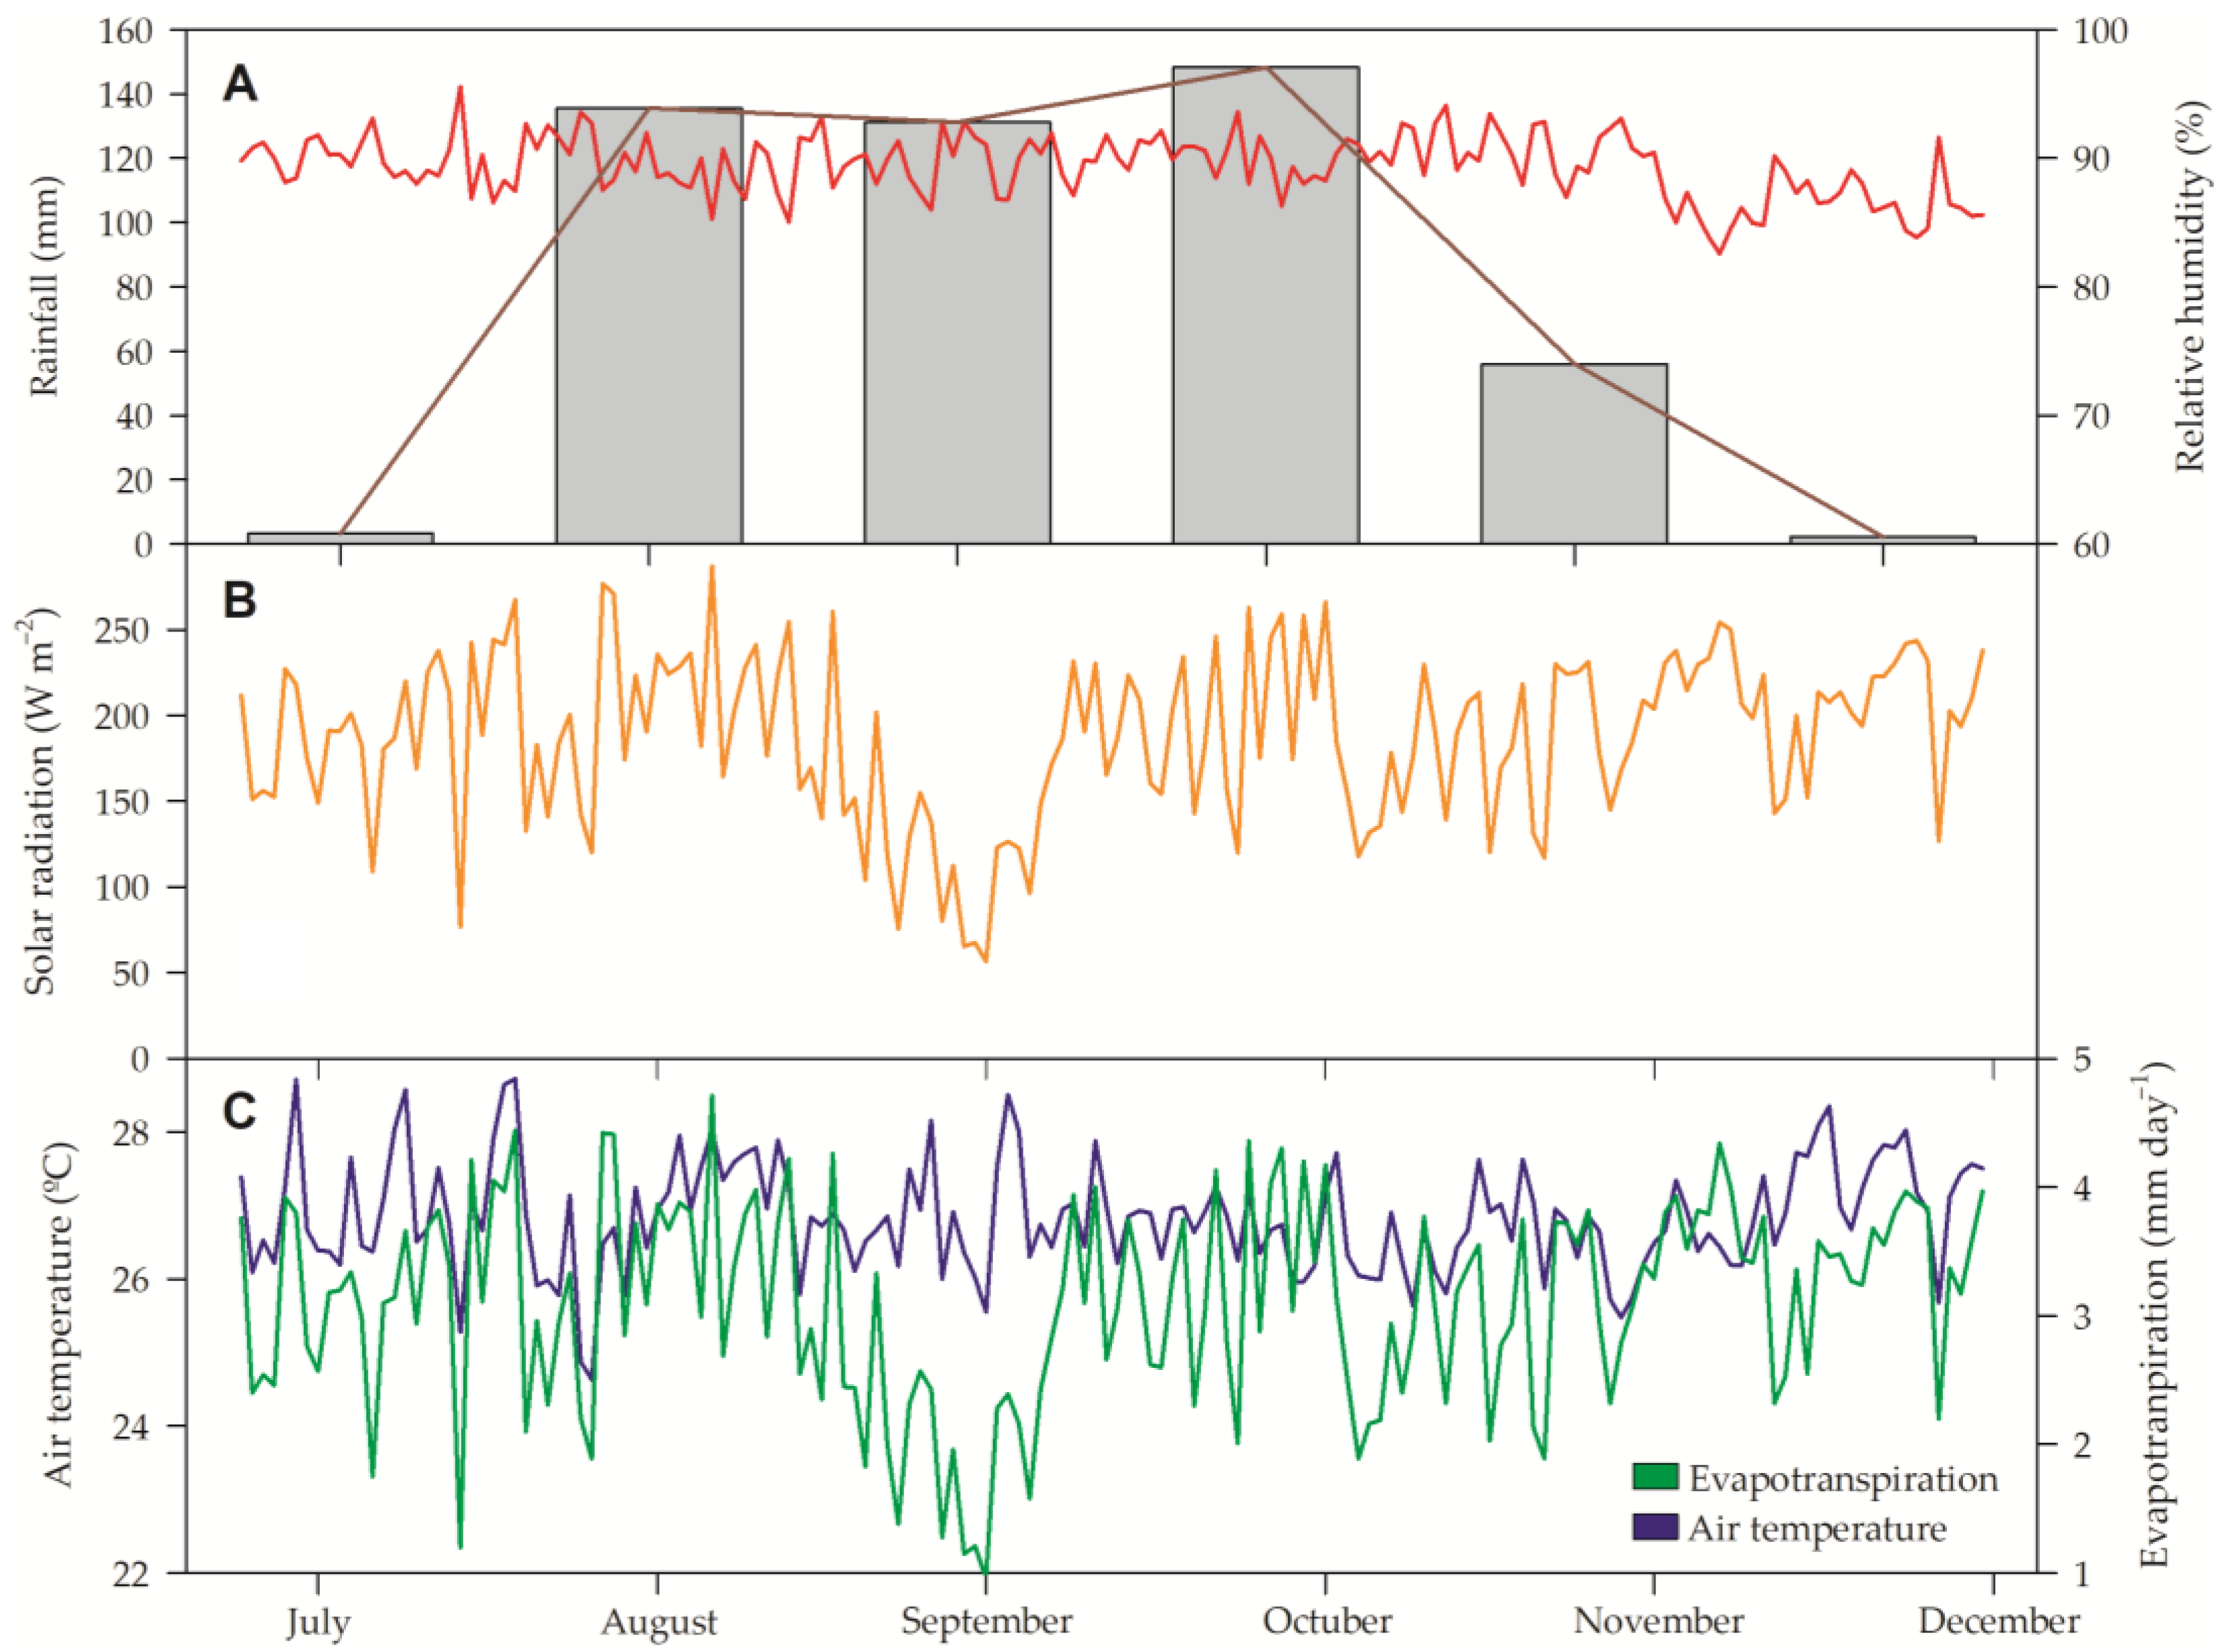
2.1. Experimental Site and Plant Material

The experiments were conducted in 2022 at the Faculty of Agricultural Sciences, University of Córdoba, Colombia (8°47′3″ N and 75°51′51″ W, 15 m a.s.l.), utilizing a greenhouse featuring an average relative humidity of 65% and a temperature of 30 °C. At 12 days after germination for V. unguiculata (genotype Caupicor 50) and S. melongena (genotype C-105), and at 15 days after the acclimatization of the cuttings taken from S. rebaudiana (genotype L-102), they were individually established in 5 kg polyethylene bags containing a substrate mixture of clay-loam soil and sand (4:1), with the chemical characteristics described in Table 1. All seeds were provided by the Genetic Improvement Laboratory within the Faculty of Agricultural Sciences at the University of Córdoba.

2.2. Cultivation and Preparation of Limnospira maxima Extract

L. maxima strain was obtained from cultures within the Aquaculture Program of the University of Córdoba. This strain was registered in GenBank under accession number OR195505.1 [26]. The cyanobacteria were cultivated in an open-air raceway-type tank using a standard Jourdan culture medium consisting of (per L) 0.05 g CO(NH2)2, 0.12 g (NH4)2HPO4, 2 g KNO3, 0.15 g MgSO4.7H2O, 0.02 g CaCl2, 0.02 g FeSO4.7H2O, 5 g NaCl, and 8 g NaHCO3. The culture medium was mixed with 2000 L of L. maxima in 8000 L of water, totaling 10,000 L, plus 10 ppm of marine salt under natural conditions (Figure 1). Biomass was harvested at the maximum growth and production point after 7 days, dried at room temperature (30 °C) for 3 days, pulverized using an electric mill LabScient CAN-679-nq 300G, Electronics Ave, Danvers, MA, USA), and stored at 4 °C. Subsequently, the dried powder was dissolved in purified water, and treatments were prepared in a weight/volume ratio according to the established extract concentrations. The extract solution was sonicated (Fisherbrand™ Sonicator 120, Hampton, New Hampshire, USA) for 0.5 cycles at an 80% amplitude for 10 s to homogenize the mixtures, particularly the cells or subcellular structures in suspension (cell lysis), making them suitable for applications. The mineral composition of the extract is presented in Table 2.

2.3. Experimental Design and Treatments

A completely randomized design with four treatments was employed, consisting of four concentrations of L. maxima extract (0, 4, 8, and 12 mg mL−1 of water). A volume of 100 mL for each treatment was applied at the base of the plant species during the vegetative phase. For V. unguiculata and S. melongena, plants at 12 days after germination (DAG) were transplanted to final polyethylene bags filled with 5 kg of soil described in Table 1. However, for S. rebaudiana (does not reproduce by seeds), seedlings of 3 pair-leaves were individually separated and transplanted to the same type of bag described previously after producing 8 to 10 pair-leaves. The L. maxima extract was applied to all plants following 12, 24, and 35 days after transplanting (DAT) for V. unguiculata and at 15, 30, and 45 DAT for S. rebaudiana and S. melongena. The different results from an L. maxima application are due to the growth speed of each species where V. unguiculata, S. rebaudiana, and S. melongena reach their vegetative phases after 35, 50, and 60 DAG, and then proceed to the reproductive phase. The experiments were conducted in a completely randomized block design with five different plant species, i.e., 5 replicates.

2.4. Gas Exchange and Chlorophyll a Fluorescence Parameters

Five days after the last L. maxima extract application, the gas exchange parameters were measured on the 3rd fully expanded leaves. The leaf gas exchange and chlorophyll a fluorescence utilized the 2nd attached and fully expanded leaf from the apex to determine stress, using a portable open-flow infrared gas analyzer (LI-6400XT; LI-COR Inc., Lincoln, NE, USA) with integrated fluorescence chamber heads, as described in detail by Pompelli et al. [27].

2.5. Phenotypic Characteristics

Five days after the last L. maxima extract application, the phenotypic features were measured. Then, plant sample materials were placed in a forced-air oven (BD-240, Binder—Kasai, Tuttlingen, Germany) at 80 °C for 72 h, and the dry root, stem, and leaf weight measurements were captured. The canopy-to-root ratio was determined as the proportion of dry mass of the canopy (stem and leaves) compared to root dry mass.

2.6. Plasticity Index

The plasticity index denotes the ability of a species to modulate its metabolism to adapt to new events. These values range from 0 (any plasticity) to 1 (full plasticity) and were calculated as the difference between the average minimum and average maximum for each sample divided by the maximum value [28] for gas exchange, chlorophyll a fluorescence, and morphologic features.

2.7. Statistical Analysis

A one-way analysis of variance (ANOVA) following the Student–Newman–Keuls (SNK) post hoc test (p < 0.05) was performed, and the relationships between the studied parameters were analyzed using Pearson’s correlation. The statistic software SAS version 9.4 (SAS Institute Inc., Cary, NC, USA) was used for data analysis, and SigmaPlot version 14.0 (Systat Software, Inc., San Jose, CA, USA) was used for the construction of graphs. The principal component analysis was based following a multivariate analysis for all analyzed features in Minitab 18.1 (Minitab, Inc., Chicago, IL, USA). Heat maps were used to compare the mean of each treatment, using the control plants as references (collected in June, the rainiest month). After log2 transformation, the false color method was used, including a color scale. The heat maps and a putative metabolic pathway were constructed using Microsoft® Office 360 (Microsoft Corporation, Redmond, WA, USA) and Corel DRAW Graphics Suite X8 (Corel Corporation, Ottawa, ON, Canada).

3. Results

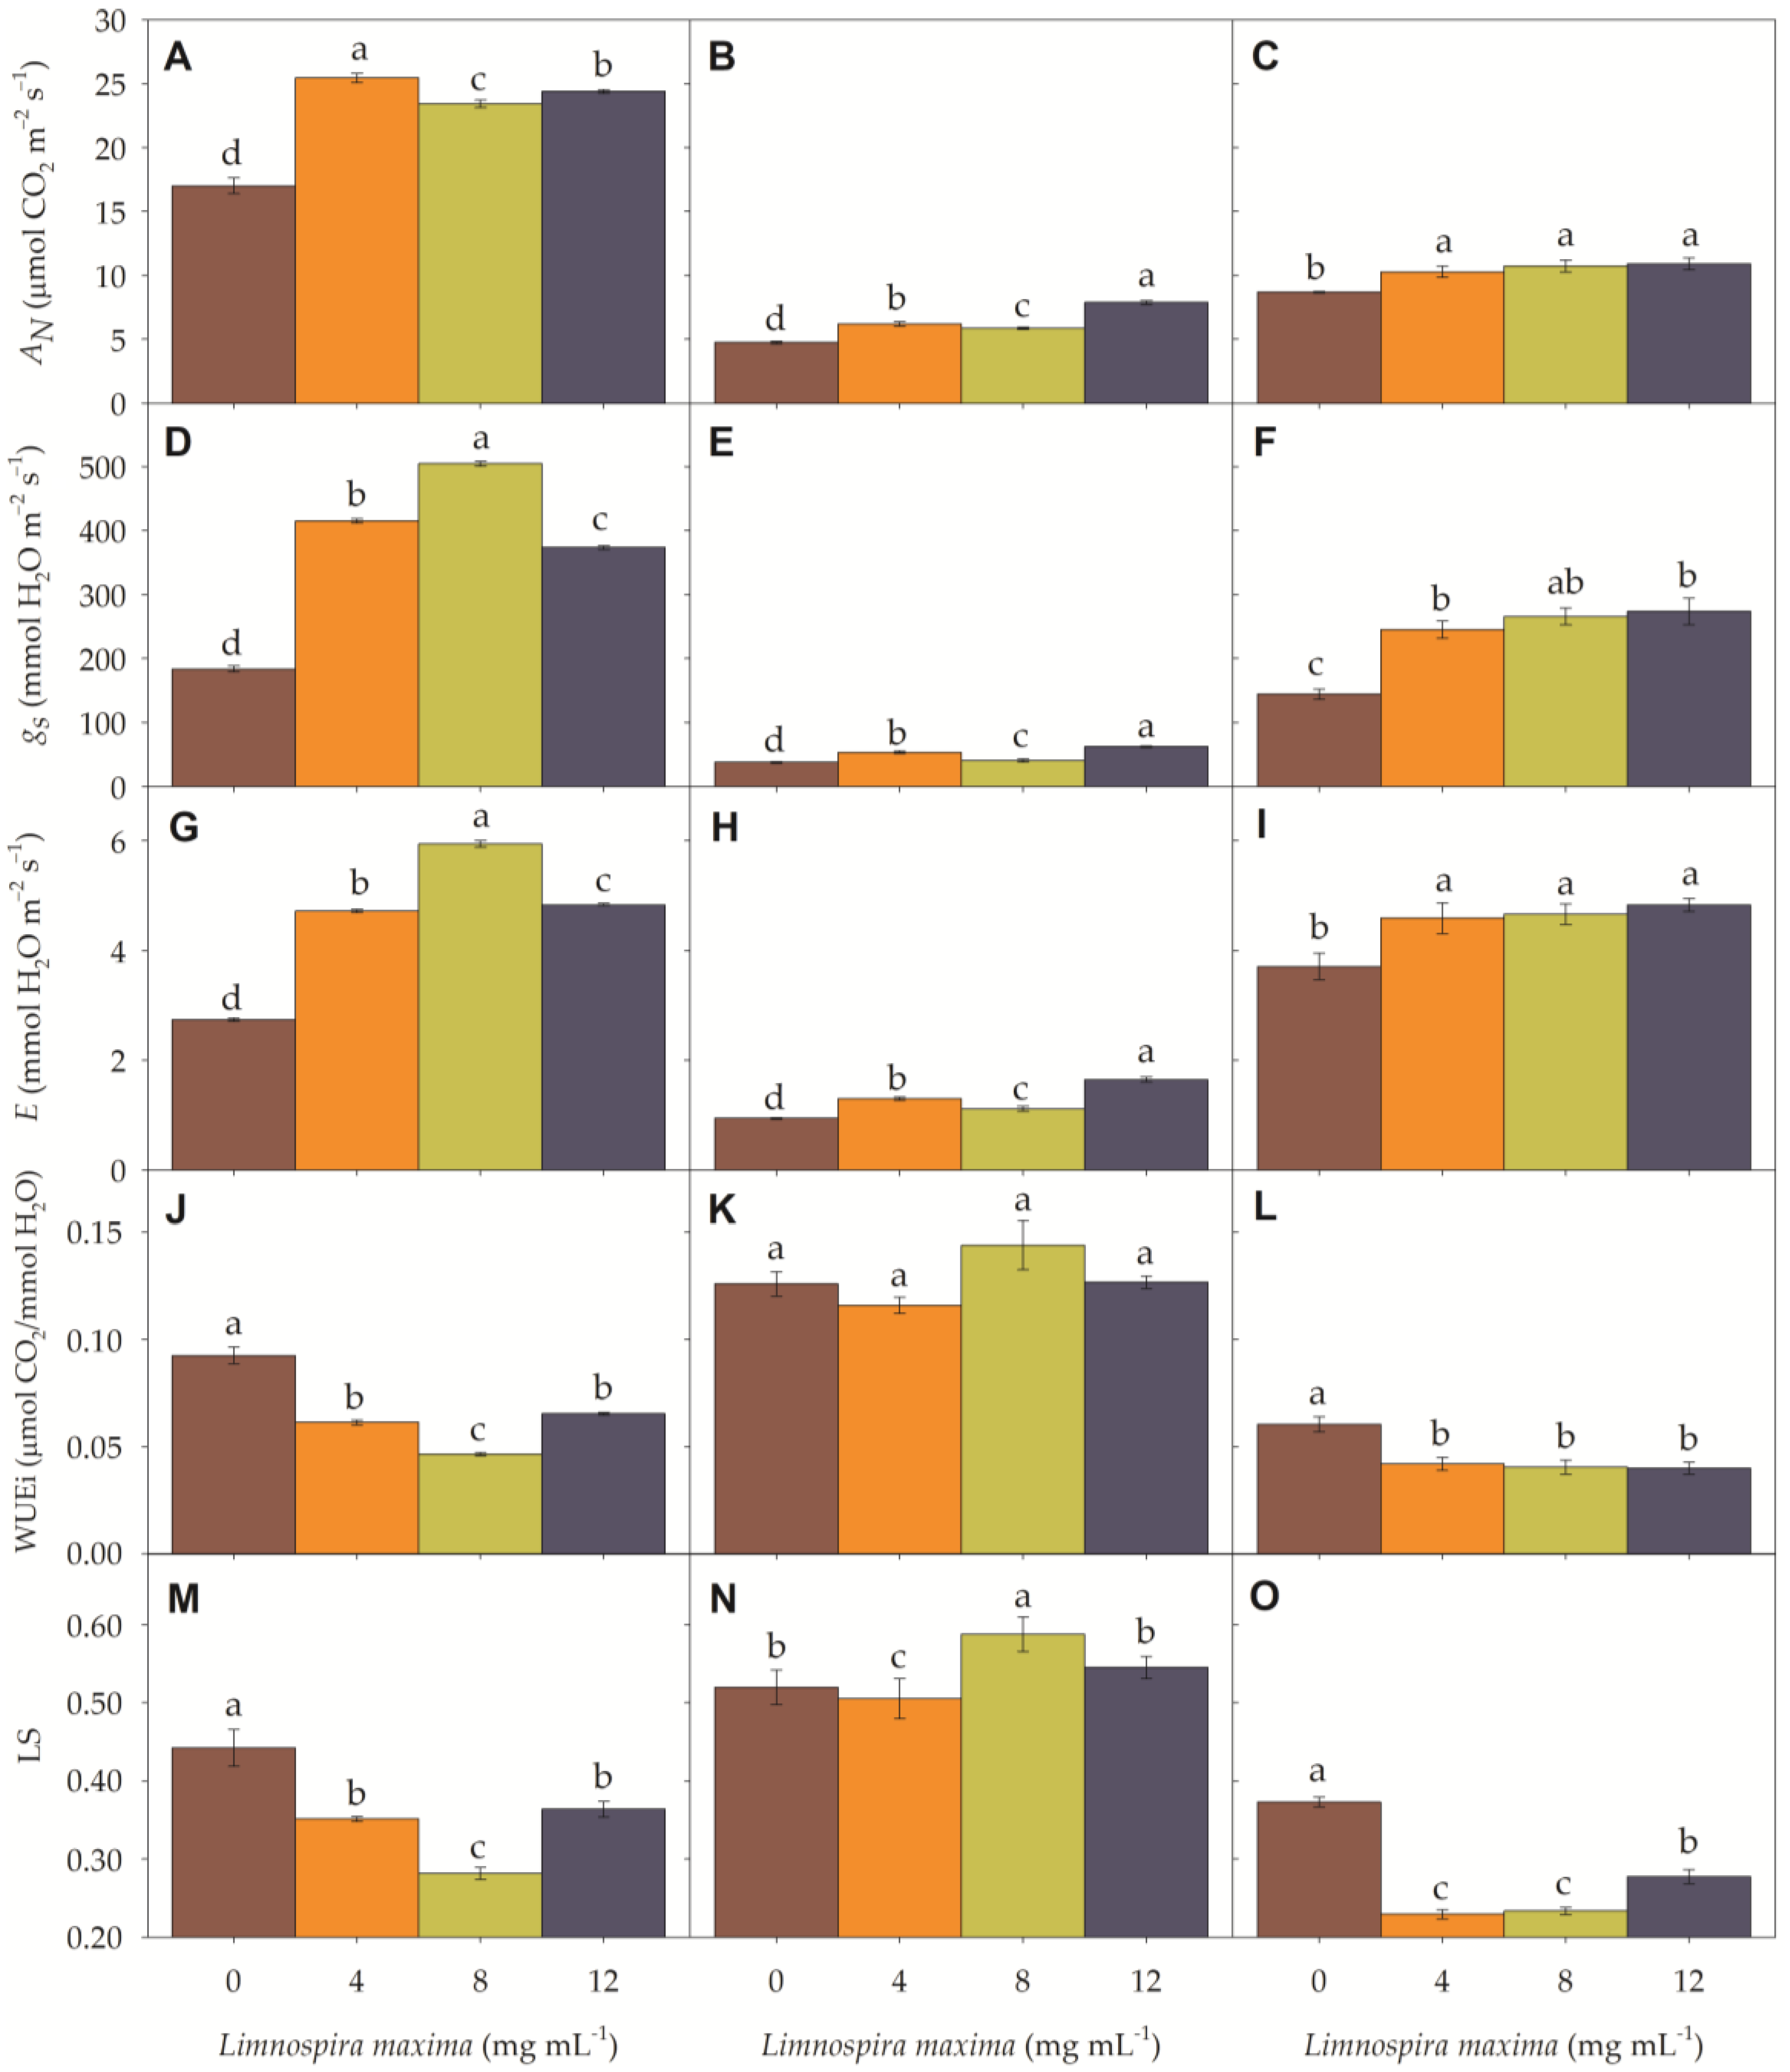
3.1. Gas Exchange Parameters

The impact of L. maxima extract concentrations on gas exchange parameters of V. unguiculata, S. rebaudiana, and S. melongena are illustrated in Figure 2. In V. unguiculata, low (4 mg L−1), medium (8 mg L−1), and high (12 mg L−1) concentrations of L. maxima extracts significantly increased the net photosynthesis (49.7%, 37.8%, and 43.5%), stomatal conductance (125.7%, 174.6%, and 103.3%) and transpiration (72.4%, 117.2%, and 76.6%) compared to the untreated plants (AN = 17.0 ± 0.6 μmol CO2 m−2 s−1, gs = 183.8 ± 4.6 mmol H2O m−2 s−1, and E = 2.7 ± 0.0 mmol H2O m−2 s−1). Significant differences were observed among the treatments (Figure 2A,D,G).
In S. rebaudiana, AN increased by 30.6%, 23.7%, and 65.8% with 4, 8, and 12 mg mL−1 of L. maxima, respectively. In the same manner, gs increased by 41.8%, 8.6%, and 64.7%, while transpiration increased by 37.6%, 18.3%, and 75.2% in 4, 8, and 12 mg mL−1 of L. maxima, respectively, when compared to the control plants. In S. melongena, the AN of the plants treated with low, medium, and high L. maxima extract concentrations increased by 18.3%, 23.7%, and 25.5% when compared to the control. The gs values increased by 70.2%, 84.4%, and 89.9%, while E increased by 23.8%, 25.8%, and 30.3%. In V. unguiculata, the increase in L. maxima resulted in increases in AN (43.5%), gs (103.3), and E (76.6).
In general, all species showed a decrease in intrinsic water use efficiency (WUEi) as the L. maxima concentrations increased. As WUEi is a ratio between AN and gs, in this study, we showed that in V. unguiculata, AN increased by 43.5%, while gs increased by 103.3% at a concentration of 12 mg L−1 in relation to the control. In S. melongena, AN increased by 25.5%, while gs increased by 89.9%. In S. rebaudiana, the increase in AN is similar than the increase in gs. As gs is the denominator of the equation, a higher gs value results in a smaller WUEi (Figure 2J–L).
The stomatal threshold (LS) indirectly measures the degree of stomatal opening. This is carried out by measuring the difference between the external and internal carbon concentrations in the leaf. A smaller LS is expected in plants with more open stomata, allowing for greater gas exchange, while a higher LS denotes stomatal limitations. In general, an intermediate value is given as 0.5, which would be the threshold between stomatal and non-stomatal limitation [29]. In this study, we showed that, with the exceptions of S. rebaudiana, V. unguiculata and S. melongena presented significantly lower LS values when compared to the control, indirectly meaning that L. maxima caused a significant stomatal opening.

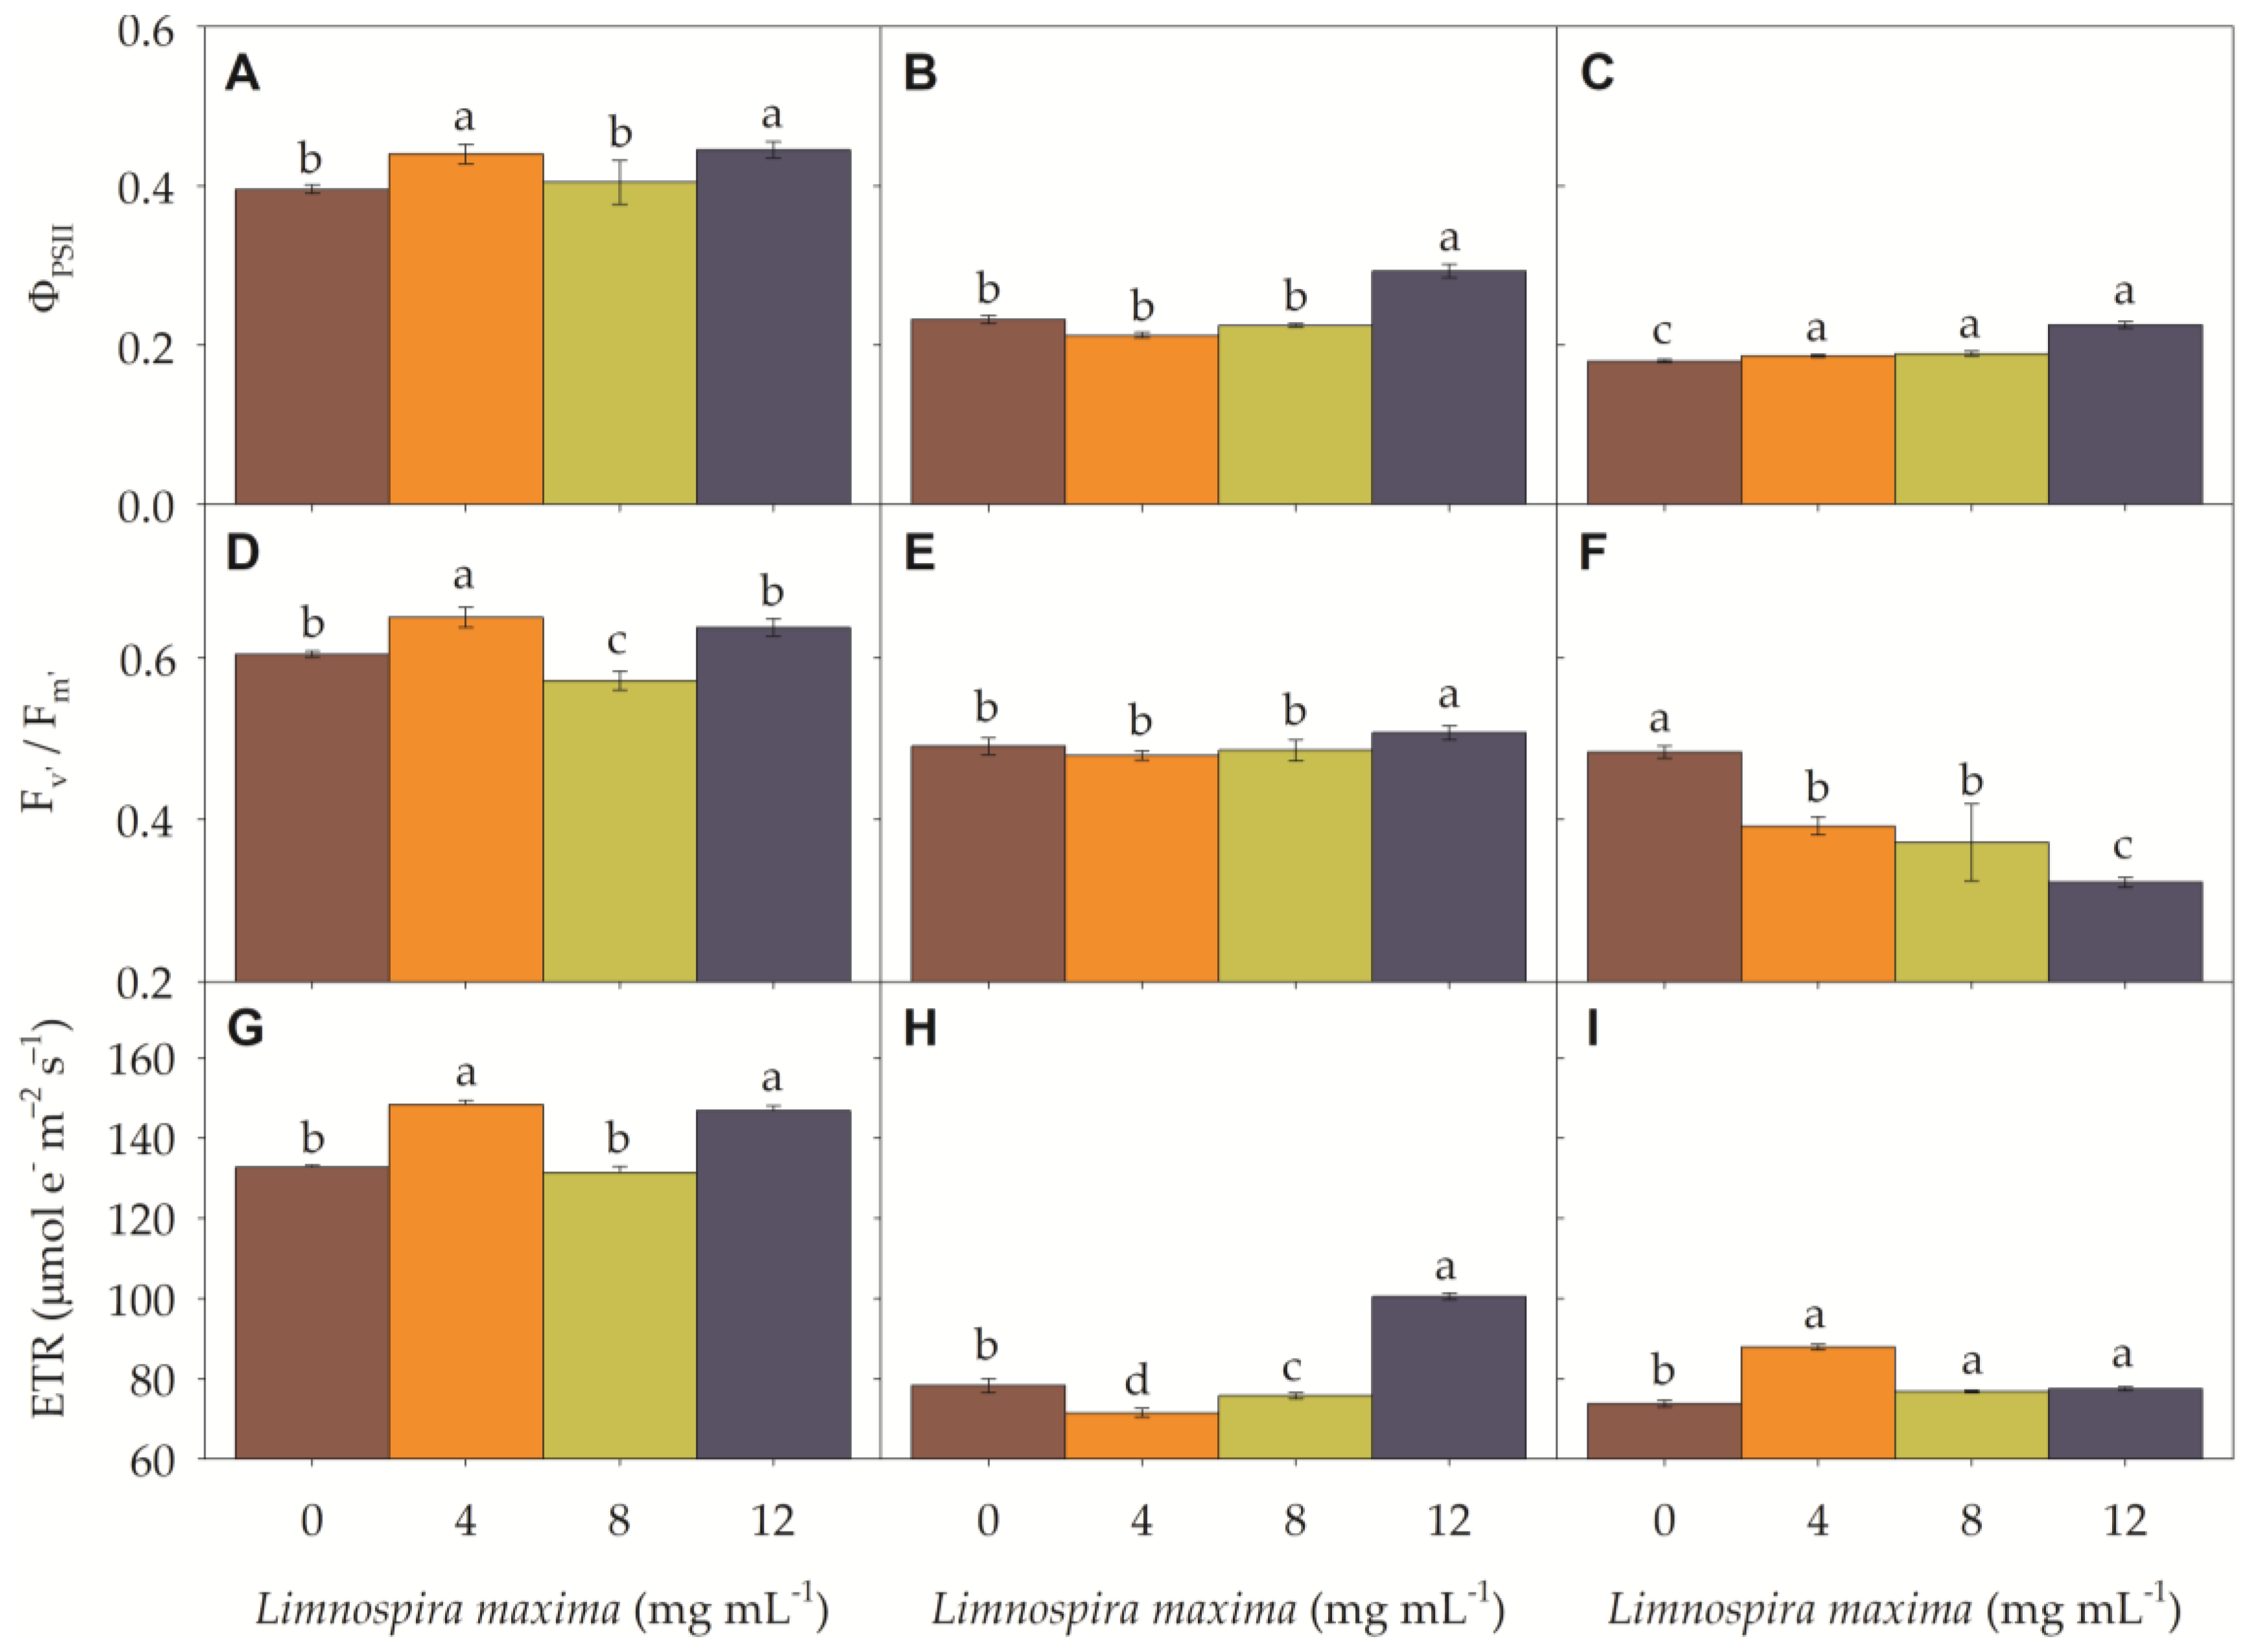
3.2. Chlorophyll a Fluorescence

The significant effects of L. maxima extract concentrations on the fluorescence indicators of V. unguiculata, S. rebaudiana, and S. melongena are shown in Figure 3.
In cowpea plants, both 4 mg mL−1 or 12 mg mL−1 of L. maxima extract exhibited the strongest increase in the quantum yield of photosystem II (ΦPSII) by 11.2% and 12.6%, respectively, compared to the control plants (Figure 3A), while the intermedia concentration (8 mg mL−1) did not present a significative increase in ΦPSII compared to the control plants. In S. rebaudiana, the increase was 26.2% in 12 mg mL−1 L. maxima extract, while the other concentrations did not show any significant effects (Figure 3B). In S. melongena, the values increased by 3.4%, 5.2%, and 25.2%, respectively, for low, medium, and high L. maxima concentrations (Figure 3C). For the maximum efficiency of open PSII (Fv/Fm), the cowpea plants that were treated with either 4 mg mL−1 or 12 mg mL−1 L. maxima extracts showed significant increases of 7.6% and 5.5% compared to the control plants (Figure 3D). In S. rebaudiana, the response in Fv’/Fm’ increased by 2.3% in 12 mg mL−1 L. maxima extract (Figure 3E), while in S. melongena, we observed reductions of 18.9%, 23.1%, and 33.33% in 4 mg mL−1, 8 mg mL−1, and 12 mg mL−1 L. maxima extract, respectively, compared to the control (Figure 3F).
In cowpea, either 4 mg mL−1 or 12 mg mL−1 L. maxima extracts significantly increased the electron transport rate (ETR) by 11.8% and 10.7%, respectively (Figure 3G). In the same L. maxima extract concentration, S. rebaudiana, the ETR increased by 8.6% and 3.2%, respectively, compared to the control plants (Figure 3H), while in the eggplants, the ETR was increased by 19.3%, 4.2%, and 5.1% in all L. maxima extract concentrations (Figure 3I).

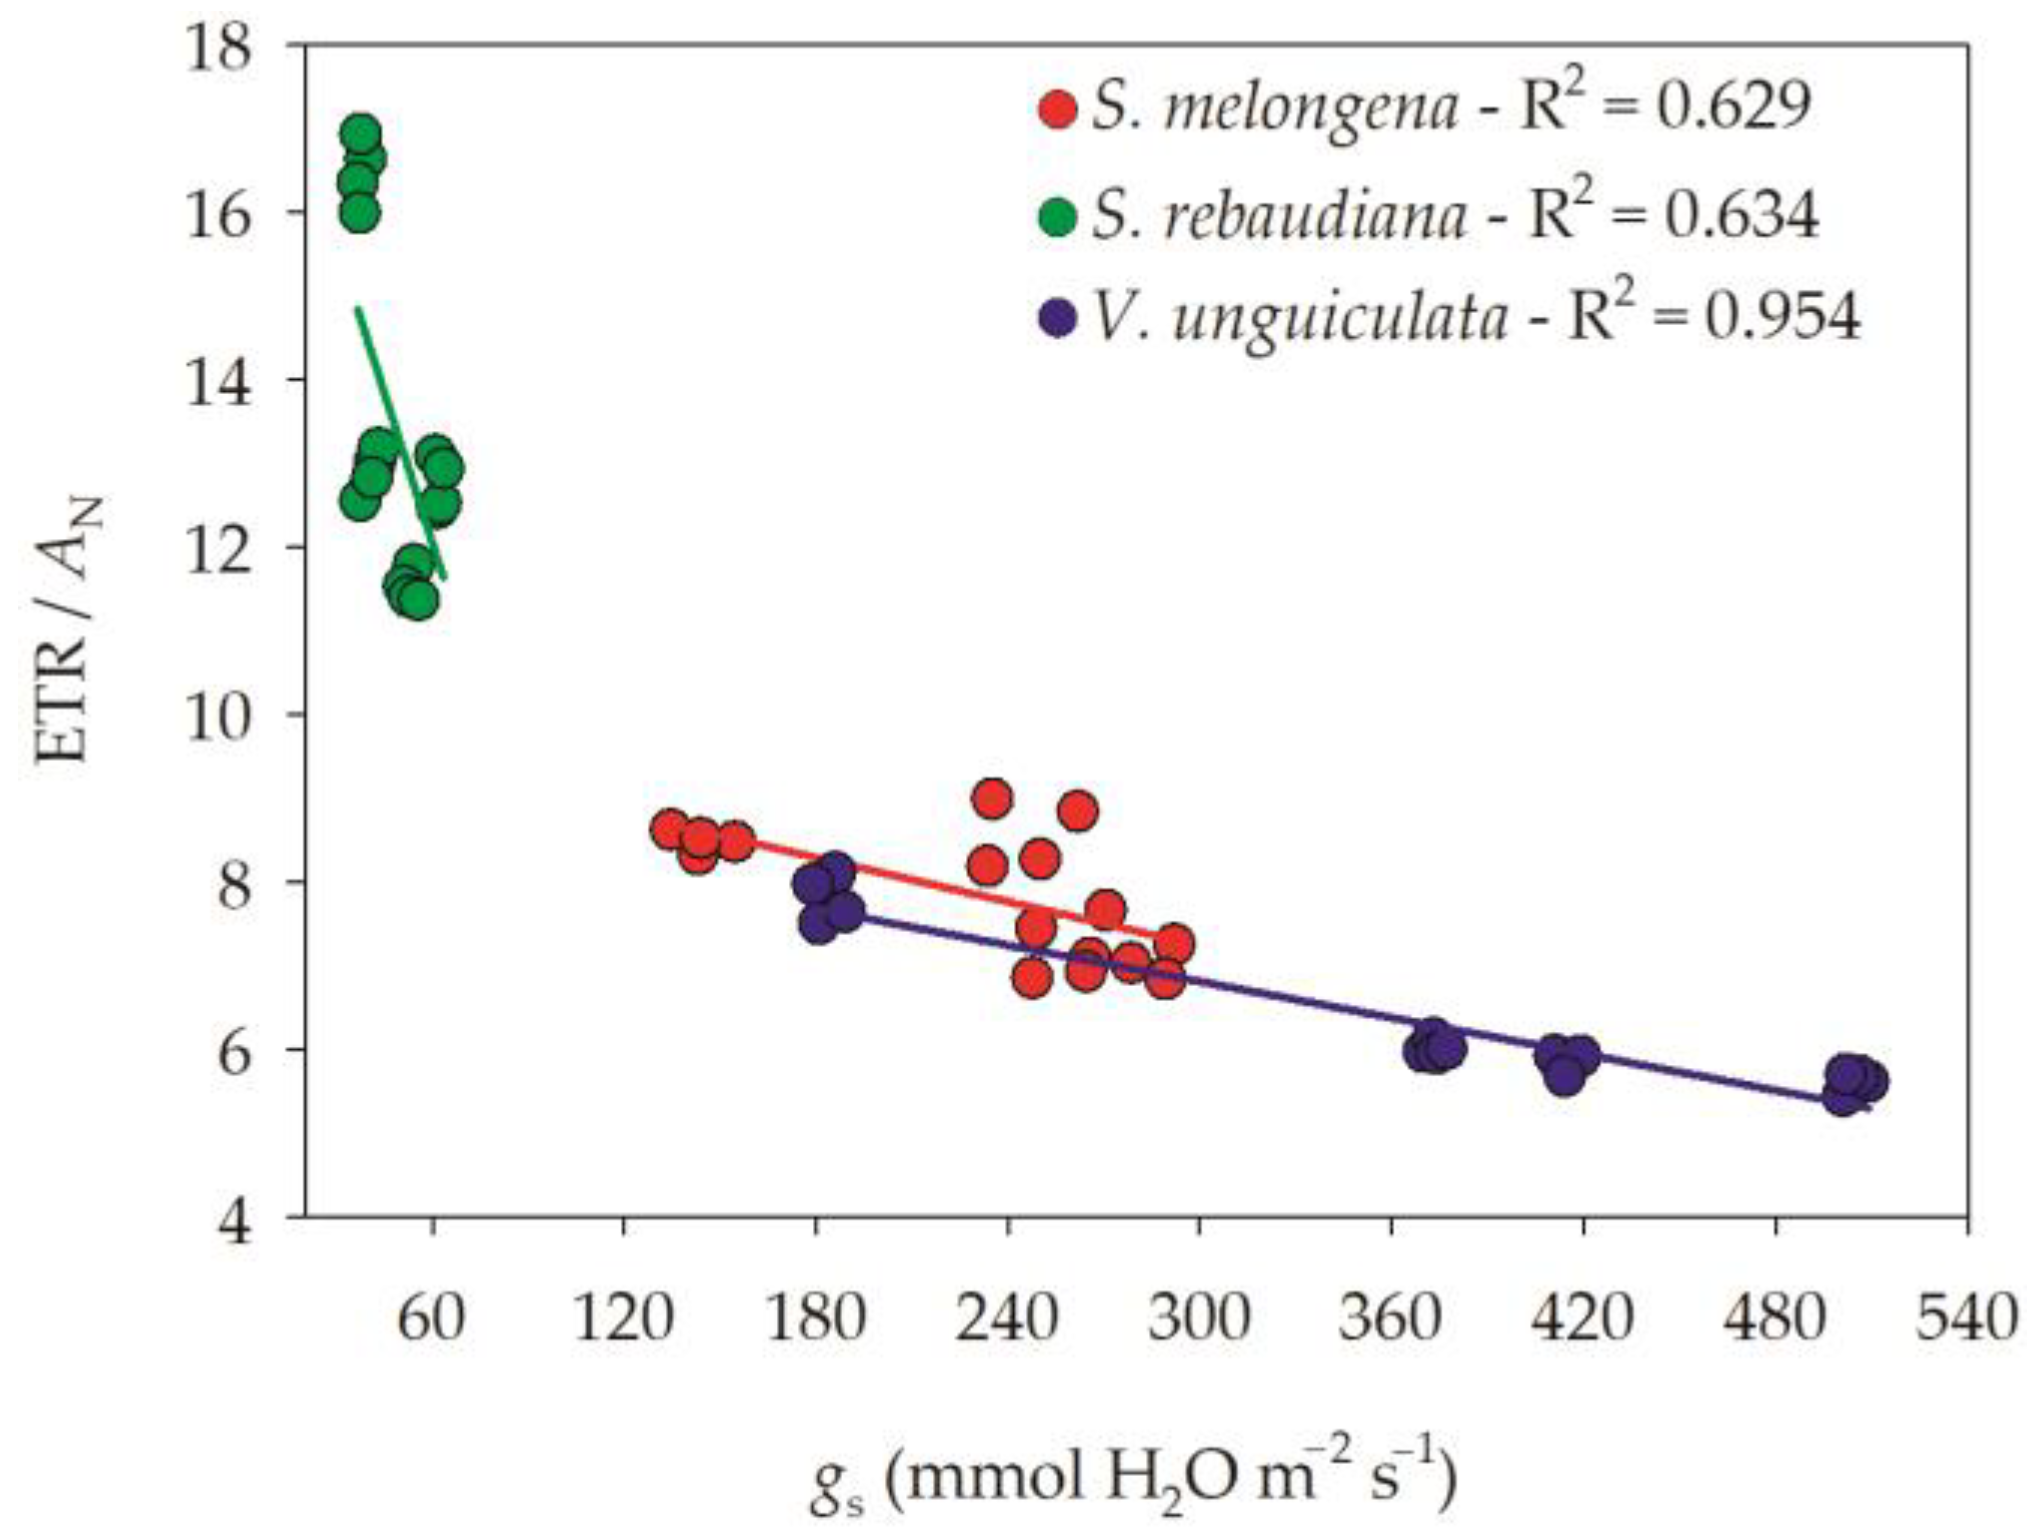
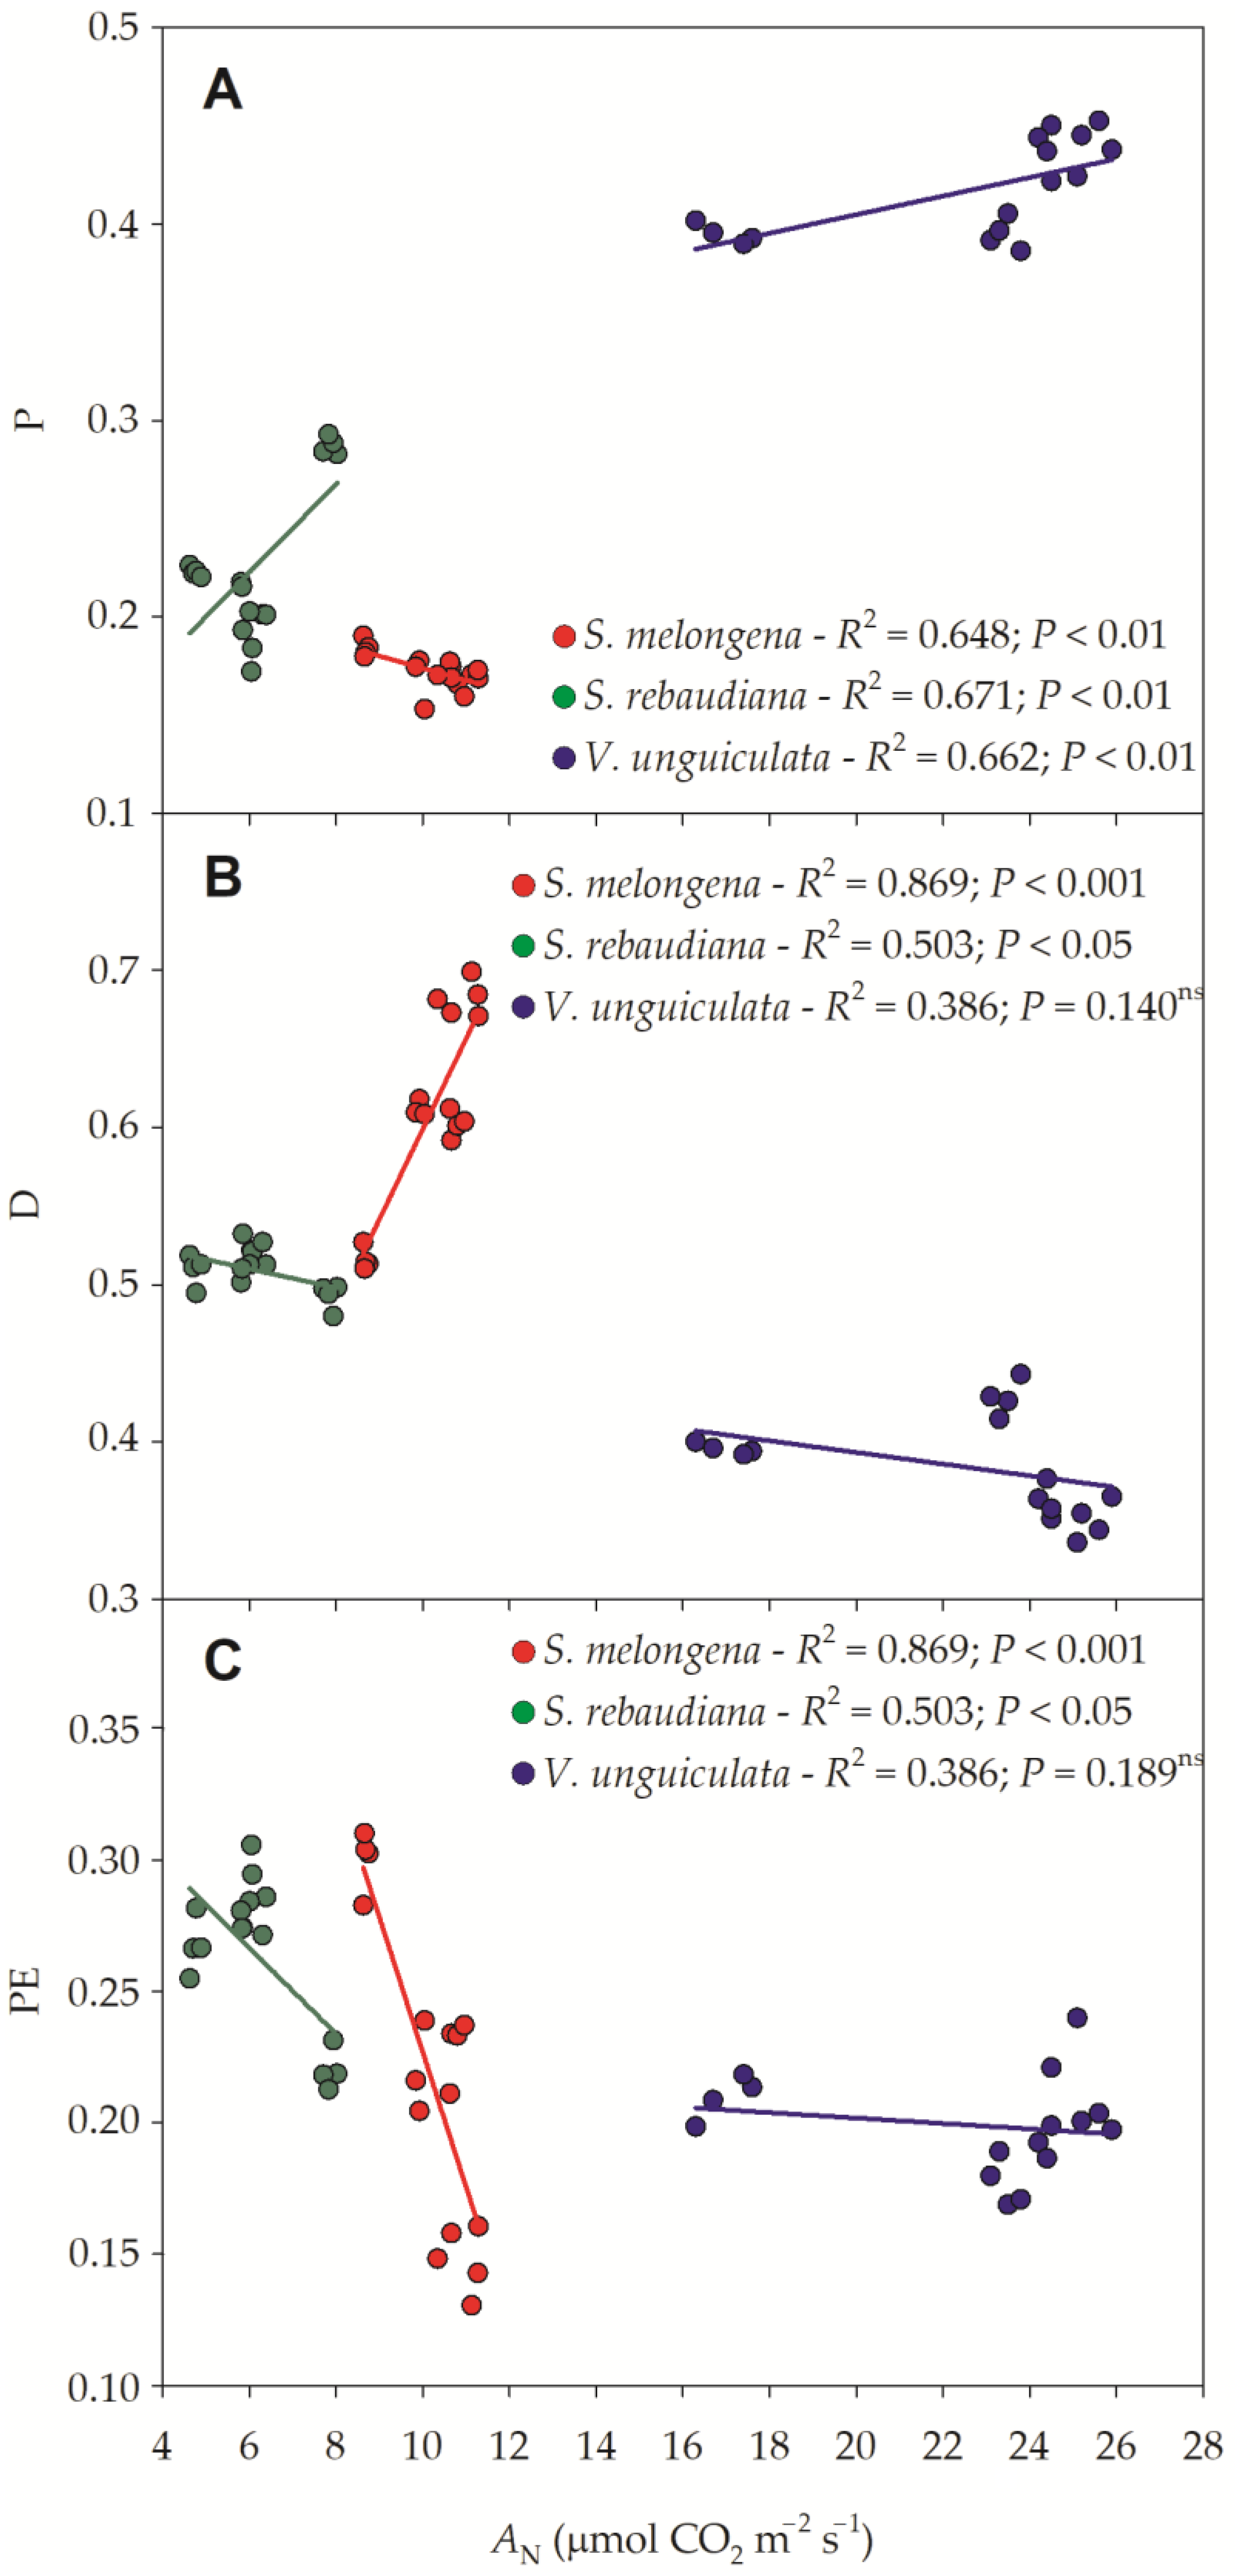
3.3. Photosynthetic Efficiency

The intrinsic water use efficiency (WUEi) is presented in Figure 4, where it can be seen that S. rebaudiana has the lowest AN at the expense of a low gs, culminating in a high WUEi (Figure 3). V. unguiculata, in turn, has high AN, but a low stomatal control and high gs. S. melongena, in turn, presents intermediate AN and gs values. In this sense, photosynthesis is correlated with gs by 99% in S. melongena, by 91.6% in S. rebaudiana, and by 83% in V. unguiculata. Another way to confirm the WUEi is through regression between AN and E. It is verified that transpiration is responsive to photosynthesis by 97.6% in S. rebaudiana, 80.3% in V. unguiculata, and 78.7% in S. melongena. These correlations show us that S. rebaudiana has a very robust system for controlling water loss per unit of photosynthesis, while V. unguiculata has greater AN, but with a low control of water loss. These values assume that, regardless of the concentration of L. maxima the values will be similar, as shown in the correlations between AN and gs (r = 0.890) and AN and E (r = 0.711) or gs and E (r = 0.925) (Supplementary data file).
The efficiency of the capture and use of photons in chemical energy is shown in Figure 5, where it is evident that S. rebaudiana has a high WUEi (as previously presented), as shown by the lowest gs. However, this species has a low efficiency in the use of photons in the form of a photochemical event, since on average, 14 moles of electrons are needed for each mole of photosynthesis. On the contrary, V. unguiculata has an exceptionally low water use efficiency due to it having the largest stomatal openings; however, this species presents a high efficiency in the use of electrons captured in the form in the photochemical events. S. melongena, in turn, is intermediate between the other two, as it has a moderate stomatal opening with a moderate use of electrons captured by the photosystems in the form of a photochemical event, since on average, eight moles of electrons are needed for each mole of fixed photosynthesis.
The efficiency of the quenching of photons via photochemistry (P), heat (D), or other non-photochemical events (PE) is shown in Figure 6. It can be seen that V. unguiculata promotes a greater photochemical extinction in the energy captured by the photosystems in the form of a photochemical event (>50%). S. rebaudiana and S. melongena promote photochemical extinction by 25 and 18%, respectively. This extinction is directly proportional to elimination in the form of heat and in the form of other non-photochemical events, since V. unguiculata, which presented the highest photochemical extinction, promotes extinction in the form of heat by 35%, with S. melongena and V. unguiculata promoting extinction in the form of heat by 63% and 50%, respectively. The extinction of the energy is captured by the photosystems in the form of other non-photochemical events such as heat in the orders of 25% (S. rebaudiana), 23% (S. melongena), and 20% (V. unguiculata). These data, analyzed together, show a photochemical efficiency of V. unguiculata that is 1.78-fold higher than S. melongena.

3.4. Phenotypic Characteristics

The phenotypic traits of cowpea, stevia, and eggplant were significantly influenced by the extract concentrations (p < 0.05) (Table 3).
In V. unguiculata, the intermediate concentration of L. maxima extract showed significantly higher values in the root, stem, and total dry weight values compared to the control plants (p < 0.05), with increases of 38.4%, 60.7%, and 27.9%, respectively. Meanwhile, the high concentration of the extract significantly increased the LDW value by 14.9% compared to the control plants. Furthermore, in the cowpea plants subjected to the intermediate concentration of the L. maxima extract, a notable reduction in the canopy root ratio was observed, explained by a significant increase in the RDW and a negligible effect on the leaf dry weight (Table 3).
In S. rebaudiana, the extract concentrations of 4, 8, or 12 mg mL−1 increase the SDW (44.9%, 218.1%, and 293.5%), LDW (122.7%, 169.1%, and 192.8%), and TDW (65.7%, 152.6%, and 171.1%), with the high extract concentration being the most effective treatment in DW gain across all plant organs. However, for the RDW in the treated plants, the low and intermediate extract concentrations showed significant increases of 22.8% and 52.3%, respectively, while the high concentration did not show significant differences in the control plants (p < 0.05). The canopy/root ratio increased significantly by 49.9%, 92.6%, and 278.7% with the low, medium, and high extract doses, respectively.
S. melongena treated with L. maxima extract concentrations of 4, 8, or 12 mg mL−1, respectively, increased the RDW by 90.8%, 104.2%, and 174.7%, increased the SDW by 14.5%, 33.4%, and 51.9%, increased the LDW by 60.3%, 113.9%, and 231.5%, and increased the TDW by 42.4%, 70.2%, and 127.2%, compared to the control plants (p < 0.05).

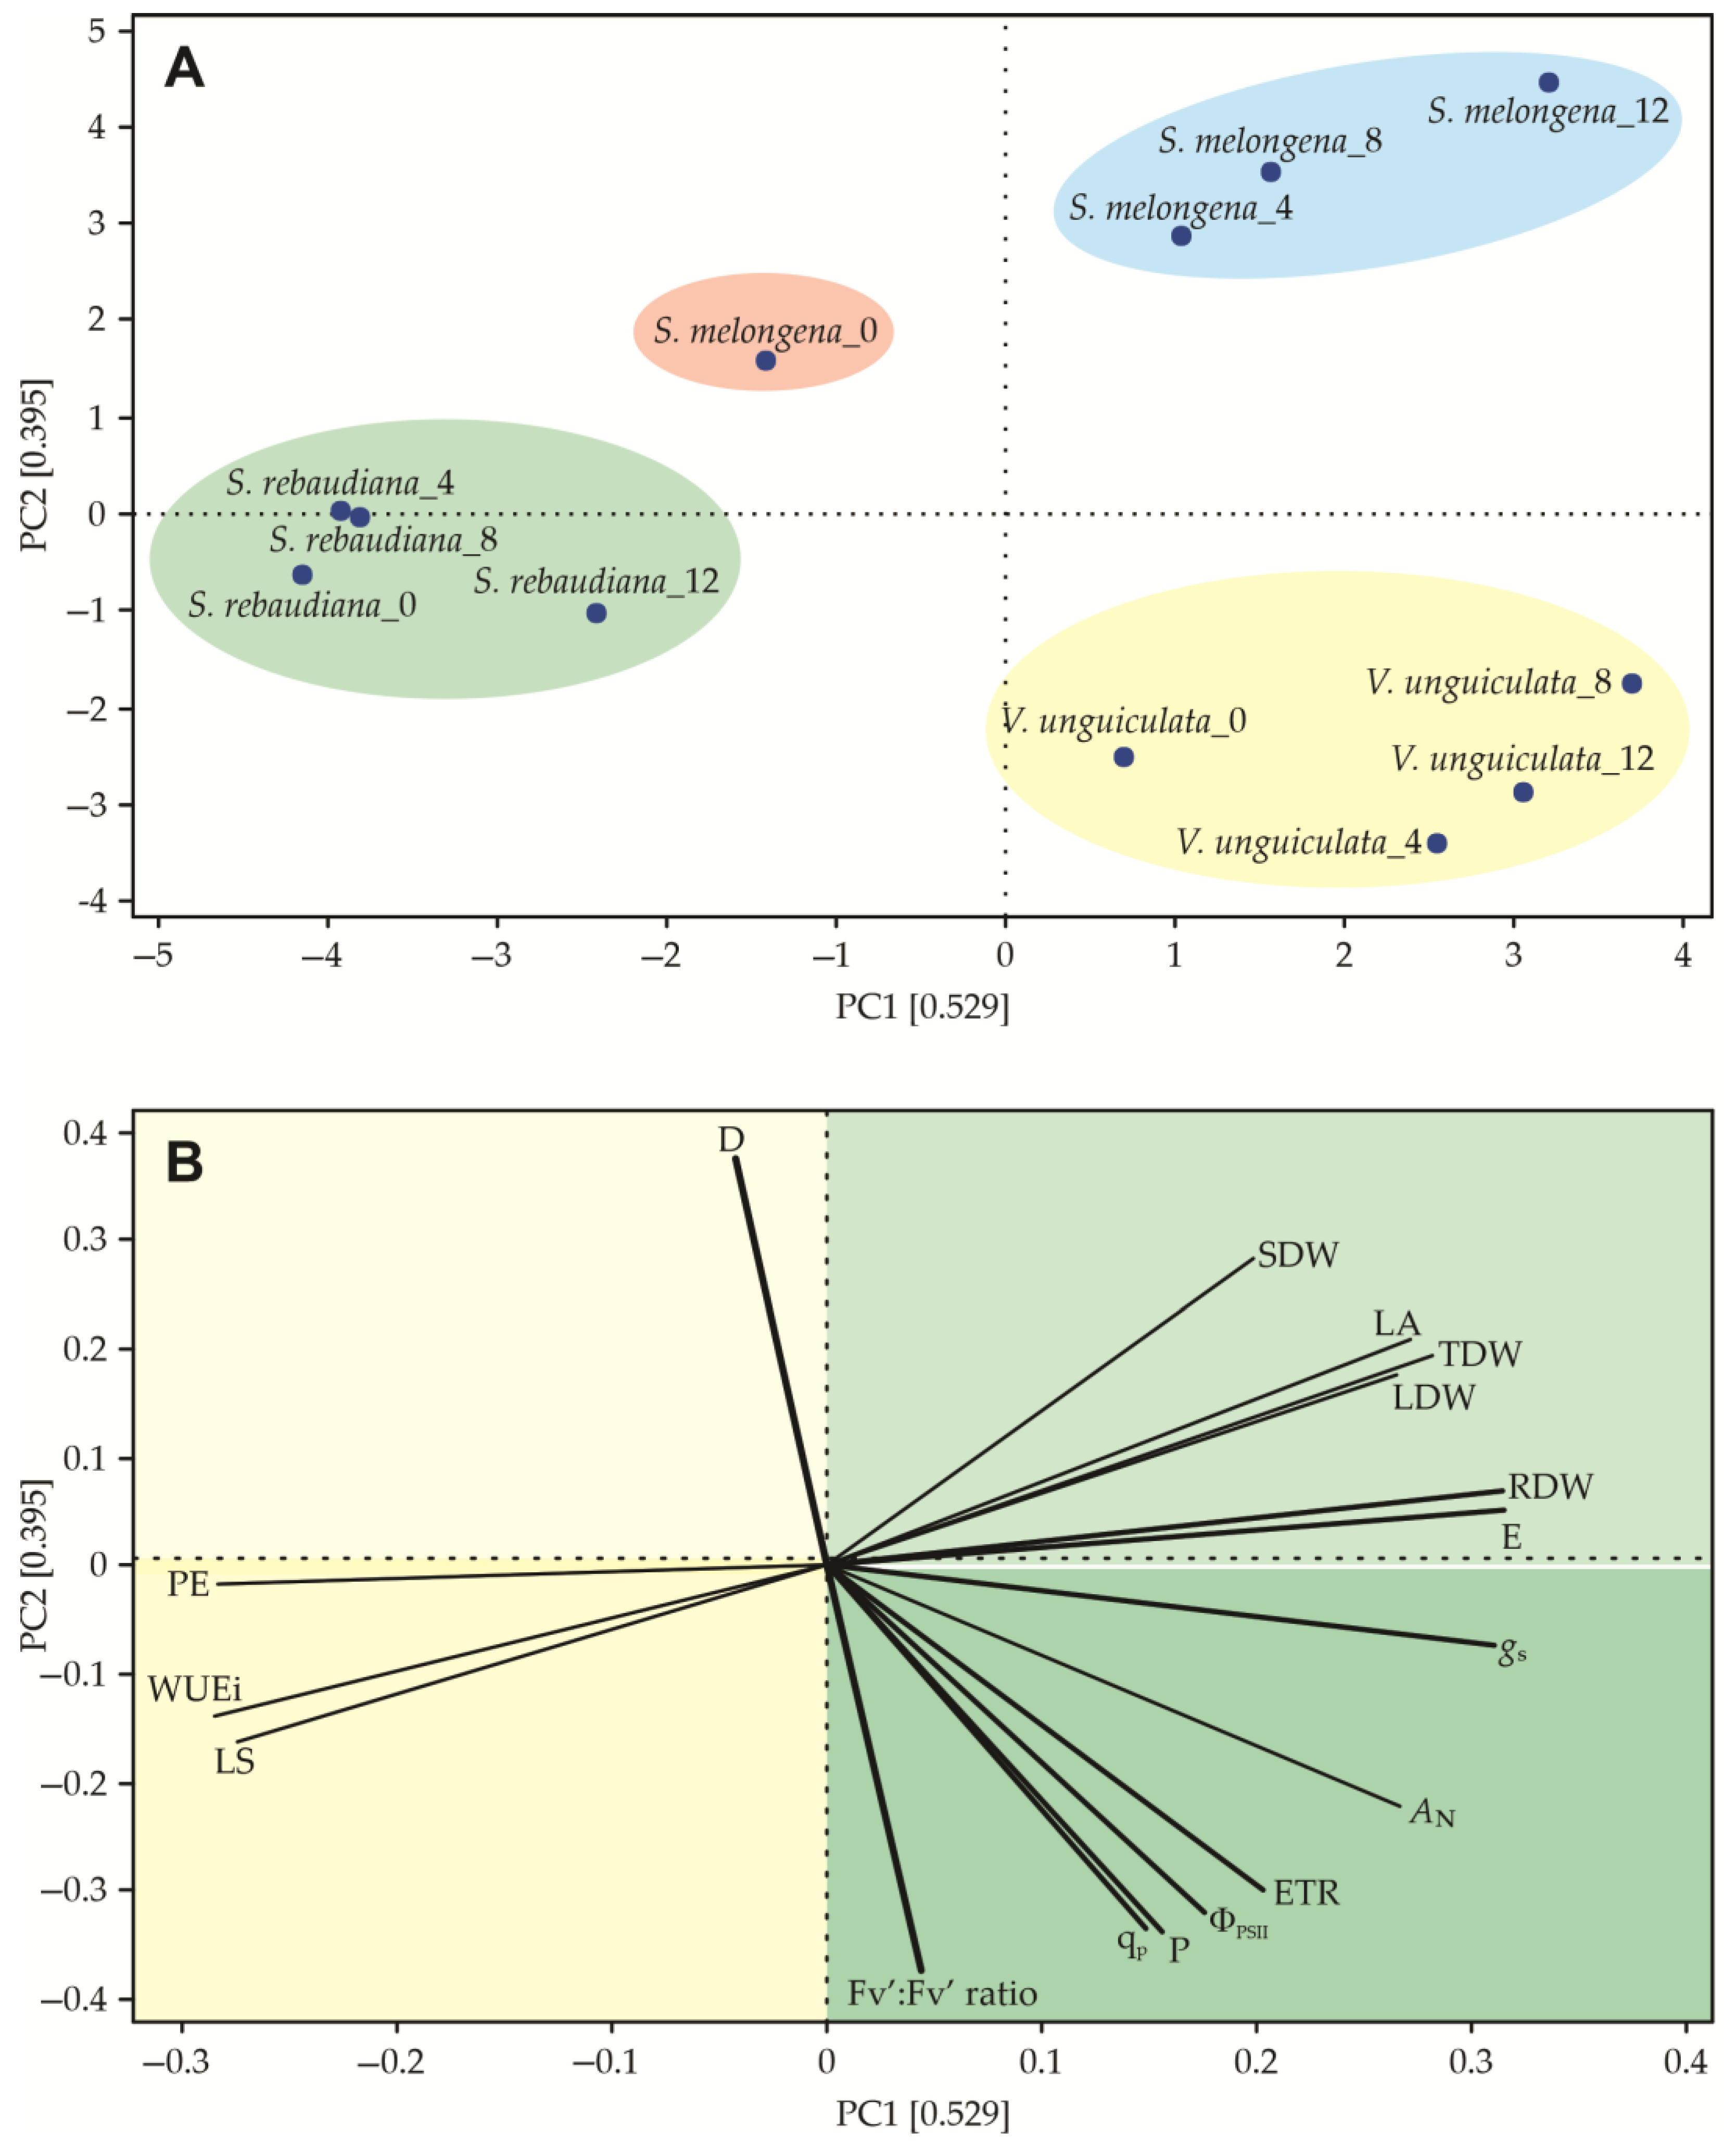
3.5. Principal Component Analysis (PCA)
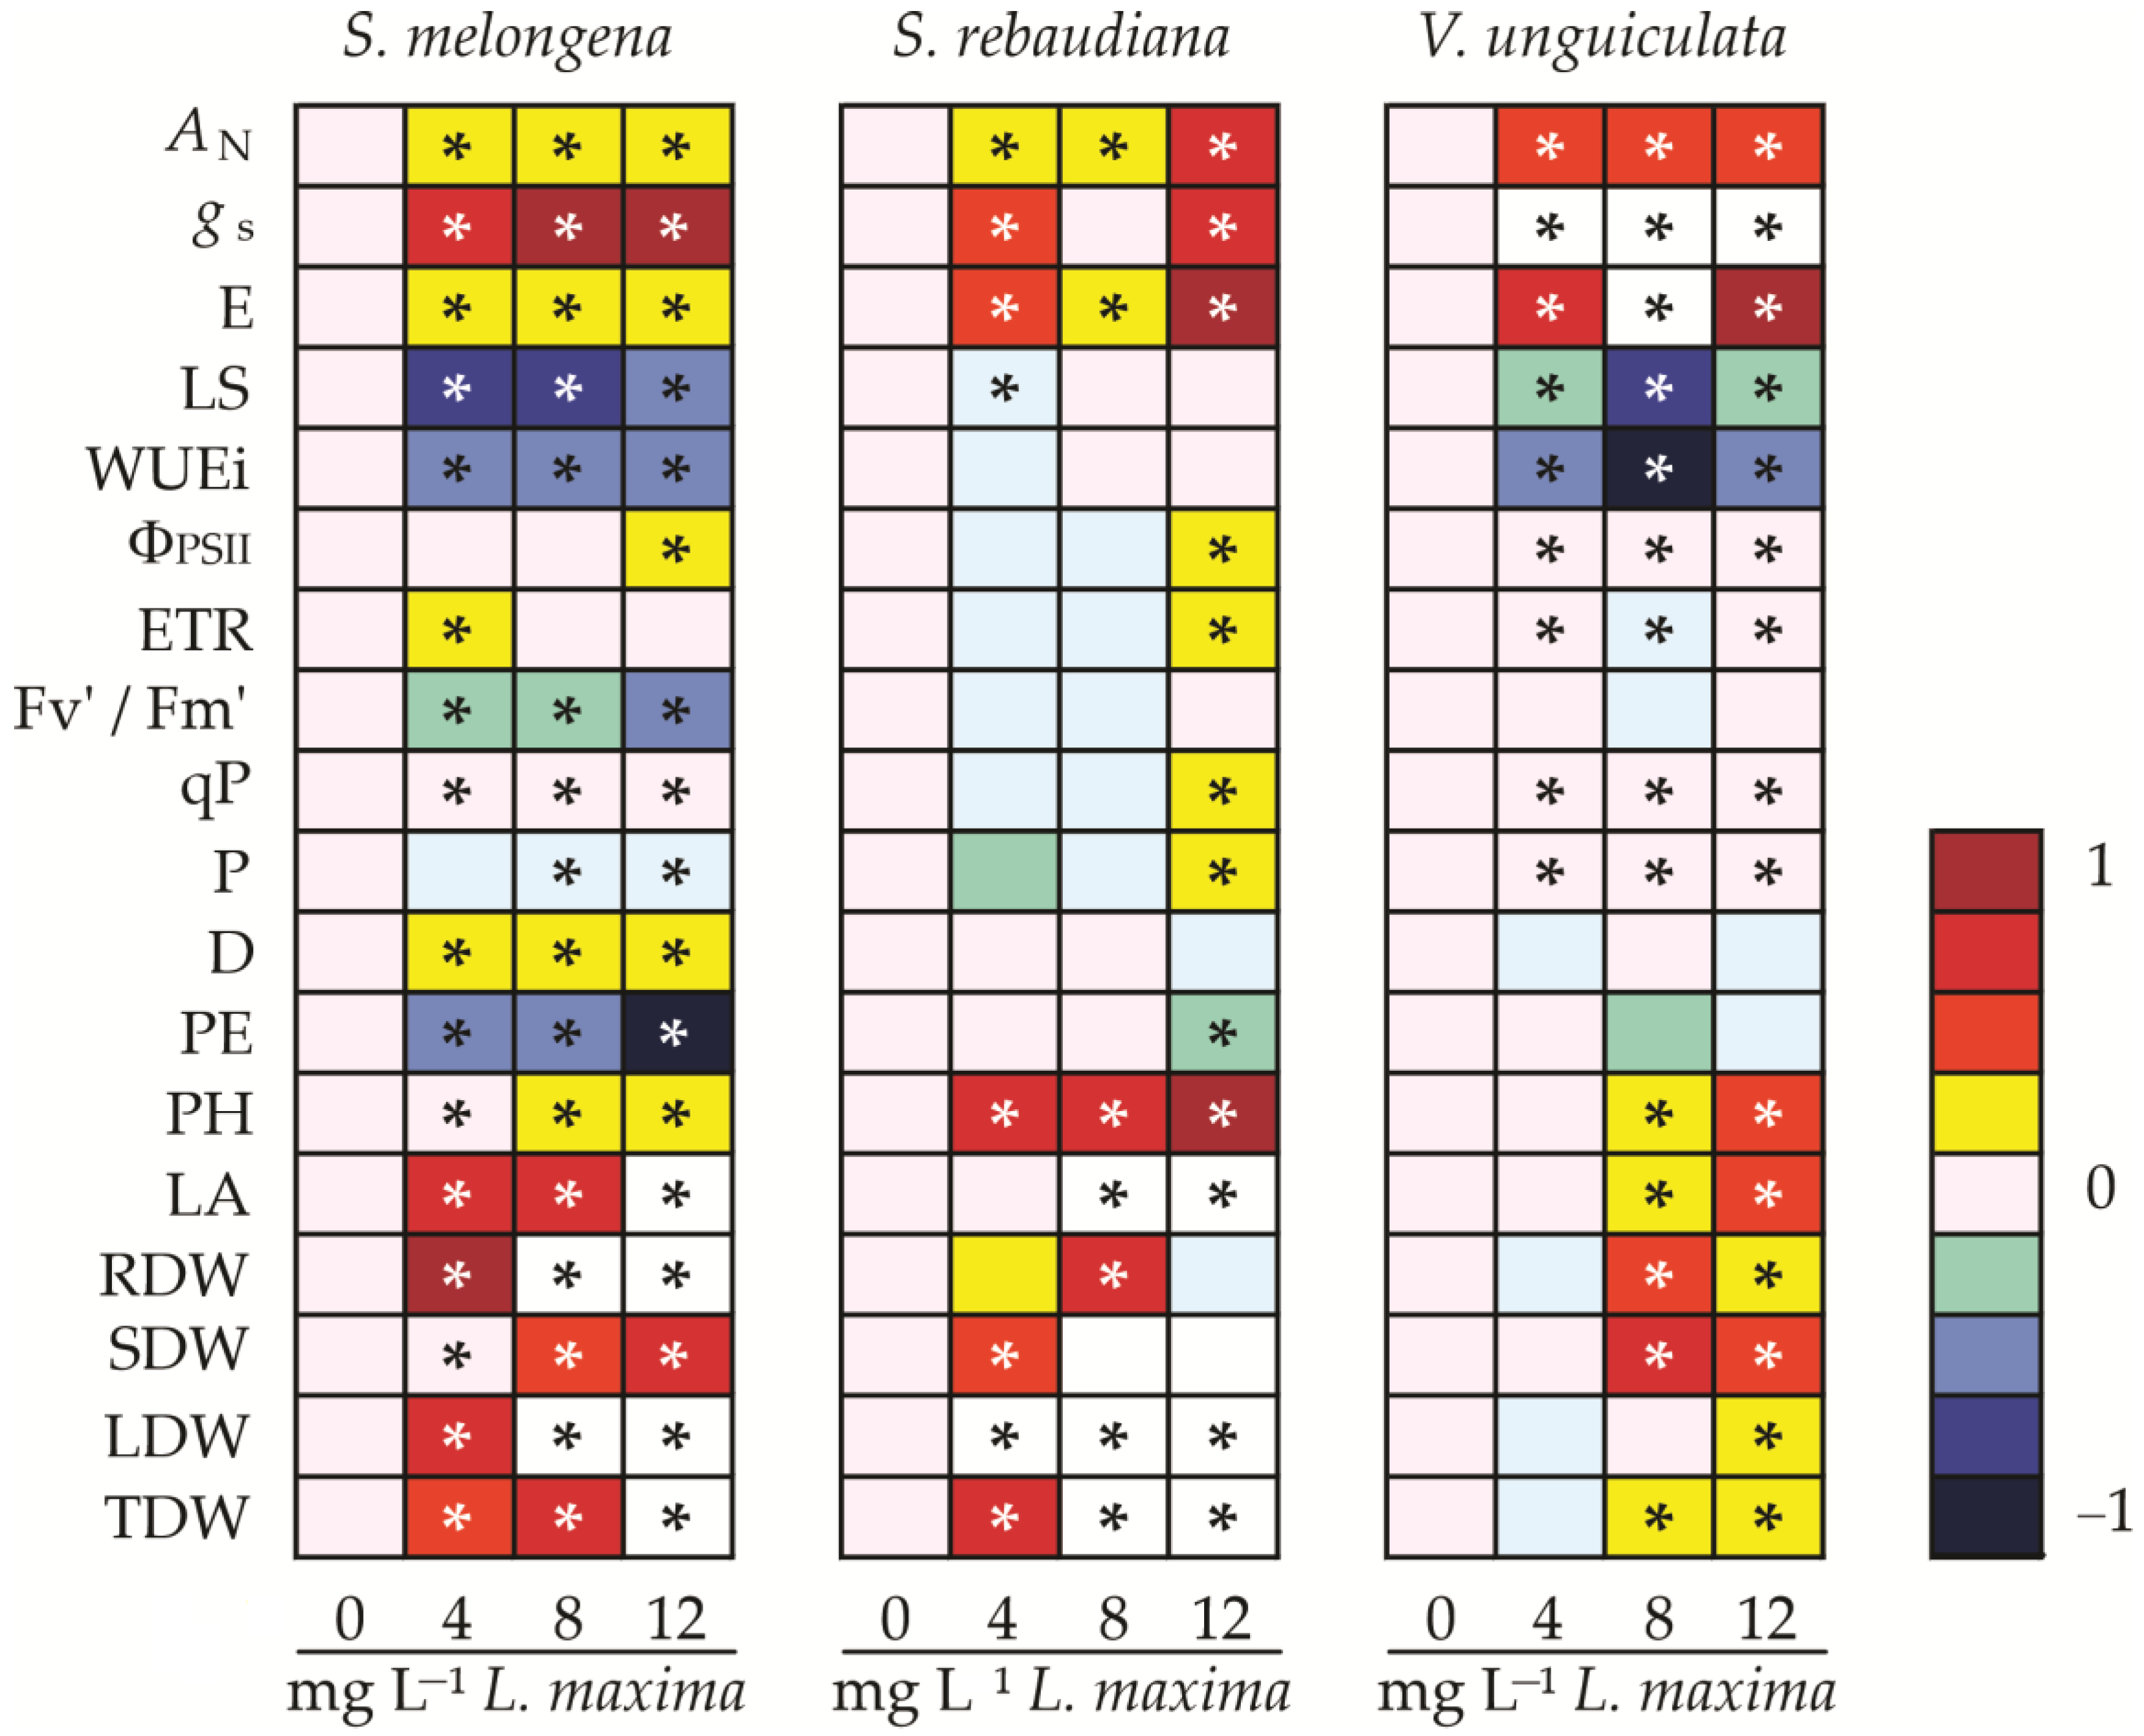
The PCA shows that the PC1 + PC2 axis makes up 92.40% of the possible variations (Figure 7). This analysis is divided into two points: those that promote photosynthesis and those that are responsible for it, causing an increase in the aerial biomass (leaf area, LA). Thus, it is shown that AN is promoted by the Fv′/Fm′ ratio (37.6%), qP (33.6%), P (33.9%), ΦPSII (32.3%), ETR (30.1%), and gs (31.1%), while the LA is influenced by the factors E (31.3%), RDW (32.2%), LDW (26.5%), TDW (27.9%), and SDW (28.3%; Supplementary Table S1). In this analysis, we can highlight opposite vectors between AN and D, as well as WUEi and gs. Also, the PCA allows for the clustering of four functional groups, basically each group formed by one species, with the exception of the S. melongena control, which was different from the other treatments and formed an individual cluster.

3.6. Heatmap

Heat maps supply a visual representation of the correlation between various biological variables, making it easier to identify trends and relationships within biological systems. From this, the results shown in our heat map analysis (Figure 8) obtained from gas exchange parameters demonstrate direct positive effects resulting from the application of extracts from L. maxima. In this sense, 12 mg L−1 of L. maxima promotes increases in AN (1.25-fold), gs (1.90-fold), and E (1.30-fold) with respect to S. melongena. For S. rebaudiana, these characteristics increase by 1.66-fold (AN), 1.65-fold (gs), and 1.75-fold €. In V. unguiculata, these increases were more significant at 1.44-fold (AN), 2.03-fold (gs), and 1.77-fold (E). The fluorescence characteristics of the heatmap do not provide satisfactory results because the modulation ranged from 0.51-fold to 1.31-fold (Figure 8).
The morphological characteristics show the results that are species-dependent. The higher increases were measured in S. rebaudiana to obtain increases that were 1.93-, 2.24-, 0.94-, 3.93-, 2.93-, and 2.71-fold higher with respect to the PH, LA, RDW, SDW, LDW, and TDW (Figure 8). S. melongena shows an intermediate modulation with 1.23-, 2.29-, 2.75-, 1.52-, 3.32-, and 2.27-fold higher increases in the same characteristics described above. The V. unguiculata values, in turn, are 1.43-, 1.44-, 1.16-, 1.49, 1.15-, and 1.24-fold higher with respect to the PH, LA, RDW, SDW, LDW, and TDW (Figure 8).

3.7. Plasticity Index

In this study, we analyzed the phenotypic plasticity, which we grouped into three classes: photosynthetic features, chlorophyll a features, and morphological features (Table 4). The photosynthetic features were more pronounced in V. unguiculata (0.501 ± 0.113), but due to the high standard deviation, it did not differ from the other species. Chlorophyll a fluorescence features demonstrated very low indices varying between 0.095 and 0.579, a range that did not allow for differential characterization between the species. On the other hand, the morphological features were higher, ranging from 0.200 to 0.799. Therefore, S. melongena (0.510 ± 0.192) and S. rebaudiana (0.646 ± 0.093) did not differ from each other, but they differed from V. unguiculata (0.301 ± 0.071). When analyzing the features, we found that, due to the large variation in the data, a significant difference between the features could not be characterized. However, the morphological features presented a plasticity index that was 16.3% higher than the photosynthetic features and 104.2% higher than the chlorophyll and fluorescence features.

4. Discussion

In this study, we show that the addition of L. maxima as a biofertilizer improves several gas exchange and biomass allocation parameters. Intermediate concentrations of L. maxima proved to be more efficient than both lower and very high concentrations. We also show that photosynthetic modulation is influenced by the efficiency of the electron transport rate and the function of photosystems in safely dissipating the energy that enters the system in the form of a photochemical event or in the form of heat.
The enhancement of net photosynthesis, stomatal conductance, and transpiration in the three species through the use of L. maxima extract, as depicted in Figure 2, could be attributed to the bioavailability of essential mineral elements, including nitrogen, phosphorus, potassium, iron, copper, magnesium, manganese, and calcium, among others [30]. These elements are indispensable for optimizing physiological efficiency in plants, as they are integral components of cell structures, enzymes, osmoregulation processes, energy production (ATP), and the reducing power (NADPH) from the Calvin–Benson cycle [31]. Higher AN values are pivotal indicators of the physiological activities impacting biomass production [32] (Table 3). Additionally, elevated gs and E values facilitate gas exchange with the external environment, thereby promoting the involvement of CO2 in photosynthesis [33]. This explains the significant increases observed in AN, gs, and E in V. unguiculata, S. rebaudiana, and S. melongena, as demonstrated in Figure 2. For clarity, it is worth noting that the applications of biofertilizer based on L. maxima were made in order to reach three distinct phases of the species’ growth, namely initial growth, intermediate or establishment, and the final phase, which is characterized by the intersection between the vegetative and reproductive phases. Even though the reproductive phase demands more photoassimilates due to the strong sink and the need to start flowering [34,35,36], the rate of carbon utilization may have been higher than the anabolism phase, thereby indicating a lower rate of net photosynthesis, which is the difference between the carbon consumed minus the carbon produced. Therefore, it would not be strange to think of a lower photosynthesis rate in the phase preceding the flowering of the species. This pattern was previously reported in mango [37,38], maize [39], and other species.
The observed results find support in a study conducted by Romanowska-Duda et al. [40], where the application of cyanobacteria like Microcystis aeruginosa and Anabaena sp. resulted in an increased chlorophyll content index and intensified the AN, gs, and E. Similar findings were reported in Salix viminalis L., where the presence of cyanobacteria correlated with increased chlorophyll a and b contents, which are linked to elevated nitrogen and carbon contents in leaves [41]. Since the photosynthetic pigments were not evaluated in this study, other studies have highlighted the potential of cyanobacterial extracts in enhancing photosynthetic activity due to a range of beneficial compounds like vitamins, amino acids, and exopolysaccharides, which promote internal chlorophyll biosynthesis and thus optimize AN [42].
The relationship between AN and PSII activation potential is shown in the quantum yield of PSII performance, maximal PSII efficiency, and ETR. These data highlight that extract application resulted in improved chlorophyll fluorescence indicators compared to the control plants across the evaluated species. These findings further infer a direct positive correlation between AN and key chlorophyll fluorescence parameters. Consequently, it can be inferred that AN directly correlates with observed quantum mechanisms within the PSII [43]. In this study, we presented the highest positive correlation between AN and ΦPSII (r = 0.886), ETR (r = 0.928), the Fv′/Fm′ ratio (r = 0.674), qP (r = 0.827), and P (r = 0.871). Also, negative correlations were shown between AN and D (r = −0.674) and PE (r = −0.525). Considering that Fv′/Fm′ as a vital indicator of maximum photosynthetic potential and a photochemical conversion rate [44], it is noteworthy that this phenomenon is reflected in the highest extract concentration in S. rebaudiana. The ETR, reflecting the rate of photosynthetic electron transfer efficiency [43], indicates that the application of L. maxima extract enhances electron transfer, accelerating and improving photosynthetic activity. Based on this, the observed results might be attributed to extract concentrations that facilitate a greater PSII reaction center opening, leading to an accelerated ETR, efficient light energy capture, and notable AN [45], as opposed to the control plants.
Significant increases in the root, stem, leaf, and total plant dry weights under L. maxima extract applications were evident in V. unguiculata, S. rebaudiana, and S. melongena. These enhancements likely result from the contribution of nutrients present in the L. maxima chemical composition, which is essential for optimizing vital metabolic processes such as gas exchanges, consequently facilitating efficient carbon conversion [46]. Accordingly, AN, a primary physiological indicator, also accounts for the response to treatments, displaying a significant and positive correlation with the dry weights of organs across all three species.
The studies conducted on tomatoes by Gashash et al. [47] and on Capsicum annuum by Abdelaziz et al. [48] reported a significant increase in the plant dry weight gain with the application of cyanobacteria compared to the control. Here, we showed that the PH (r = 0.543), LA (r = 0.312), RDW (r = 0.315), SDW (r = 0.451), LDW (r = 0.517), and TDW (r = 0.474) were significantly correlated with an increase in L. maxima extracts (Supplementary data file). Similar results were reported in lettuce [49]; bell pepper [50]; cucumber, squash, and tomato [51]; wheat [52]; tomatoes; corn [53]; citrus; and cotton [54]. These studies affirm the versatility of cyanobacteria in promoting the growth, photosynthetic capacity, fluorescence indicators, and the dry weights of plants through the contribution of macronutrients, micronutrients, and other compounds, which is in line with the findings of this study [55]. As mentioned, the treated plants generally demonstrated a greater capacity to allocate more biomass towards the canopy in relation to the root, implying an enhanced utilization of light energy and efficient tissue conversion through carbohydrate synthesis [56].
In the present study, intermediate doses of L. maxina extract were more effective than lower or higher doses, which was possibly due to a biphasic dose–response relationship or the hormetic effect of biofertilizers [57]. This response is due to response limits, being effective only within a specific range of concentrations [58]. At low doses, they may not be concentrated enough to trigger a response, while at high doses, they may exceed the optimal range, resulting in a lack of the desired effect [59]. In contrast, in S. rebaudiana and S. melongena, elevated concentrations showed increases in the RDW, STW, LDW, and TDW. This is attributed to the fact that these species have different growth rates and phenologies, which implies greater requirements for mineral elements. This divergent pattern reflects the importance of considering species-specific characteristics when evaluating the effects of biofertilizers on plant development [60].
Studies comparing plant performance under constant conditions may overestimate the plant response because they do not directly measure the biochemically achieved effects or the biomass distribution, which may interfere with acclimatization. When comparing physiological features such as the AN and Fv’/Fm’ rate of P. echinata, Baroni [61] described high physiological plasticity in this species. Intermediate morphological (0.486) and photosynthetic (0.418) plasticity were also described in this study. However, the species showed in this study presented the lowest plasticity index when the chlorophyll a fluorescence features were considered in accordance with a previous report [62]. A plasticity index of 0.844 to 0.99 was described to Physalis angulate in response to the habitat conditions [63]. In accordance with these authors, the higher plasticity referred to the substantial adaptability to variable environmental conditions and to invade a new community. Pájaro-Esquivia et al. [64] describes that water availability induced the highest level of plasticity response. Conversely, the plasticity of combined factors was low, pointing to a possible prioritizing strategy of the traits to enhance the water capture rather than light harvesting. Mhlanga and Shaik [65] describe that the phenotypic plasticity is indicated to screen for drought stress tolerance in Cucurbita maxima and C. moschata. However, as shown in this study, the plasticity index is dependent on the genotype and measured traits, as well described for Manihot esculenta [66]. Vigna radiata seeds treated with the Paenibacillus mucilaginosus strain N3 showed an increase in the overall dry biomass by 17% and an increase in the sapling length by 28% (as compared to non-treated controls) after 10 days of sowing in pots (Goswami et al. [67]). A study with Plectranthus amboinicus showed a lower plasticity index for the leaf number (0.23 and 0.28) and oil percent (0.24 and 0.25). The branch number, essential oil yield, and herb and RDW traits showed great enhancements that were affected by yeast applications, and they gave the highest results [68].
The outcomes derived from the application of extracts notably increased the gas exchange parameters, chlorophyll a fluorescence, and dry weights in V. unguiculata, S. rebaudiana, and S. melongena. This is likely a consequence of intensified physiological processes, as demonstrated in Figure 1 and Figure 2, coupled with the potential contribution of bioactive compounds like auxins, cytokinins, gibberellins, amino acids, and other significant metabolites present in L. maxima, albeit not quantified in this study [69]. A detailed study of these applications will yield valuable and practical information for implementation in sustainable agriculture, focused on producing quality, nutrition, and food security. Despite the multitude of articles published on various cyanobacterial species with agricultural potential, assessing concentrations, compositions, application methods, and crops [70], the effect of cyanobacteria L. maxima on V. unguiculata, S. rebaudiana, and S. melongena during the initial growth stage had not been studied in Colombia.

5. Conclusions

This study shows the significant positive impact of L. maxima extract on gas exchange parameters, biomass allocation, and chlorophyll a fluorescence in V. unguiculata, S. rebaudiana, and S. melongena. The intermediate concentrations of L. maxima proved to be more effective than lower or higher concentrations. The enhancement of the net photosynthesis, stomatal conductance, and transpiration can be attributed to the bioavailability of essential mineral elements in the extract. These findings confirm the potential of cyanobacteria, such as L. maxima, as a biofertilizer for sustainable agriculture, promoting plant growth, photosynthetic efficiency, and biomass gain. Additionally, this study highlights the importance of chlorophyll fluorescence parameters in understanding photosynthetic mechanisms. Overall, this research provides valuable information on the ecological benefits of cyanobacteria in agricultural practices, and on the response of the plant plasticity index to the application of L. maxima extract.

Supplementary Materials

The following supporting information can be downloaded at: https://www.mdpi.com/article/10.3390/horticulturae9121309/s1, Supplementary Table S1. Principal componente analysis autovectors.

Author Contributions

Conceptualization, A.R.A.-G., A.J.-O., J.d.D.J.-N., M.F.P., D.S.H.-C. and A.V.-I.; methodology, A.R.A.-G., A.I.P.-G., M.F.P., Y.Y.P.-R., D.V.A., L.A.R.-P. and A.J.-O.; formal analysis, L.A.R.-P., M.F.P. and A.J.-O.; investigation, A.R.A.-G., A.I.P.-G., Y.Y.P.-R., D.V.A., L.A.R.-P., A.J.-O., J.d.D.J.-N., D.S.H.-C. and A.V.-I.; writing—original draft preparation, A.R.A.-G., M.F.P., J.d.D.J.-N. and A.J.-O.; writing—review and editing, A.R.A.-G., J.d.D.J.-N., M.F.P., A.J.-O. and L.A.R.-P., supervision, A.J.-O., J.d.D.J.-N., D.S.H.-C. and A.V.-I.; funding acquisition, A.J.-O., J.d.D.J.-N., D.S.H.-C. and A.V.-I. All authors have read and agreed to the published version of the manuscript.

Funding

This study was funded by the Ministry of Science and Technology under the program “Conectando conocimientos: Estrategias integrales para valorizar la biomasa microalgal en beneficio del sector agrícola colombiano” with the agreement no. 80740-440-2020. This initiative is part of the research agenda of the Universidad de Córdoba, CO, Colombia, encompassing the Agronomic Engineering and Aquaculture programs.

Data Availability Statement

The data presented in this study are available in supplementary material.

Acknowledgments

The authors express their gratitude to the Ministry of Science and Technology, as well as to the Faculty of Agricultural Sciences and the Faculty of Veterinary Medicine and Zootechnics at the University of Córdoba in Montería, Colombia.

Conflicts of Interest

The authors declare no conflict of interest.

References

  1. Gialeli, M.; Troumbis, A.Y.; Giaginis, C.; Papadopoulou, S.K.; Antoniadis, I.; Vasios, G.K. The Global Growth of ‘Sustainable Diet’ during Recent Decades, a Bibliometric Analysis. Sustainability 2023, 15, 11957. [Google Scholar] [CrossRef]
  2. Gumbi, N.; Gumbi, L.; Twinomurinzi, H. Towards Sustainable Digital Agriculture for Smallholder Farmers: A Systematic Literature Review. Sustainability 2023, 15, 12530. [Google Scholar] [CrossRef]
  3. Wu, L.; Du, R.; Liu, Q. A Study on Smallholder Farmers’ Willingness to Sustain Cooperation with New Farmers—Analysis Based on the Perspective of Smallholder Farmers’ Satisfaction. Sustainability 2023, 15, 11363. [Google Scholar] [CrossRef]
  4. Bibi, F.; Rahman, A. An Overview of Climate Change Impacts on Agriculture and Their Mitigation Strategies. Agriculture 2023, 13, 1508. [Google Scholar] [CrossRef]
  5. Mahajan, M.; Anuradha; Pal, P.K. Attaining Higher Biomass and Steviol Glycosides Yields of Stevia rebaudiana through Adjustment of Plant Population and Nitrogen Rate. Ind. Crops Prod. 2021, 165, 113426. [Google Scholar] [CrossRef]
  6. Nandi, P. VMR Stevia Market Size, Share, Trends, Scope, Opportunities and Forecast. Verified Market Research 2022. Available online: https://www.marketresearchfuture.com/reports/stevia-market-1747?utm_term=&utm_campaign=&utm_ source =adwords&utm_medium=ppc&hsa_acc=2893753364&hsa_cam=19912237177&hsa_grp=148712481999&hsa_ad=659589502539&has _src=g&hsa_tgt=dsa-2080758265640&hsa_kw=&hsa_mt=&hsa_net=adwords&hsa_ver=3&gad_source=1&gclid=Cj0KCQiA67 CrBhC1ARIsACKAa8RAJH-QbB9wkM8ddKKPfkcOf655469cNxDeV6CptoSfwr6JK4CK0ocaAiaFEALw_wcB (accessed on 3 December 2023).
  7. Santo, É.D.E.; Ishii, M.; Pinto, U.M.; Matsudo, M.C.; Carvalho, J.C.M.D. Obtaining Bioproducts from the Studies of Signals and Interactions between Microalgae and Bacteria. Microorganisms 2022, 10, 2029. [Google Scholar] [CrossRef]
  8. Olorunwa, O.J.; Adhikari, B.; Shi, A.; Barickman, T.C. Screening of Cowpea (Vigna unguiculata (L.) Walp.) Genotypes for Waterlogging Tolerance Using Morpho-Physiological Traits at Early Growth Stage. Plant Sci. 2022, 315, 111136. [Google Scholar] [CrossRef]
  9. Chen, W.; Modi, D.; Picot, A. Soil and Phytomicrobiome for Plant Disease Suppression and Management under Climate Change: A Review. Plants 2023, 12, 2736. [Google Scholar] [CrossRef]
  10. Hernández-Herrera, R.M.; Santacruz-Ruvalcaba, F.; Ruiz-López, M.A.; Norrie, J.; Hernández-Carmona, G. Effect of Liquid Seaweed Extracts on Growth of Tomato Seedlings (Solanum lycopersicum L.). J. Appl. Phycol. 2014, 26, 619–628. [Google Scholar] [CrossRef]
  11. Orona-Navar, A.; Aguilar-Hernández, I.; Nigam, K.D.P.; Cerdán-Pasarán, A.; Ornelas-Soto, N. Alternative Sources of Natural Pigments for Dye-Sensitized Solar Cells: Algae, Cyanobacteria, Bacteria, Archaea and Fungi. J. Biotechnol. 2021, 332, 29–53. [Google Scholar] [CrossRef]
  12. Bhowmik, D.; Dubey, J.; Mehra, S. Evaluating Potential of Spirulina as Innoculant for Pulses. Acad. J. Plant Sci. 2010, 3, 161–164. [Google Scholar]
  13. Ekeuku, S.O.; Chong, P.N.; Chan, H.K.; Mohamed, N.; Froemming, G.R.A.; Okechukwu, P.N. Spirulina Supplementation Improves Bone Structural Strength and Stiffness in Streptozocin-Induced Diabetic Rats. J. Tradit. Complement. Med. 2022, 12, 225–234. [Google Scholar] [CrossRef]
  14. Markou, G.; Chentir, I.; Tzovenis, I. Microalgae and Cyanobacteria as Food: Legislative and Safety Aspects. In Cultured Microalgae for the Food Industry; Elsevier: Amsterdam, The Netherlands, 2021; pp. 249–264. ISBN 978-0-12-821080-2. [Google Scholar]
  15. Liang, Y.; Yang, C.; Sainju, U.M.; Zhang, N.; Zhao, F.; Wang, W.; Wang, J. Differential Responses of Soil Microbial N-Cycling Functional Genes to 35 Yr Applications of Chemical Fertilizer and Organic Manure in Wheat Field Soil on Loess Plateau. Agronomy 2023, 13, 1516. [Google Scholar] [CrossRef]
  16. Mógor, Á.F.; De Oliveira Amatussi, J.; Mógor, G.; Bocchetti De Lara, G. Bioactivity of Cyanobacterial Biomass Related to Amino Acids Induces Growth and Metabolic Changes on Seedlings and Yield Gains of Organic Red Beet. Am. J. Plant Sci. 2018, 9, 966–978. [Google Scholar] [CrossRef]
  17. Supraja, K.V.; Behera, B.; Balasubramanian, P. Efficacy of Microalgal Extracts as Biostimulants through Seed Treatment and Foliar Spray for Tomato Cultivation. Ind. Crops Prod. 2020, 151, 112453. [Google Scholar] [CrossRef]
  18. Mógor, Á.F.; Ördög, V.; Lima, G.P.P.; Molnár, Z.; Mógor, G. Biostimulant Properties of Cyanobacterial Hydrolysate Related to Polyamines. J. Appl. Phycol. 2018, 30, 453–460. [Google Scholar] [CrossRef]
  19. Toribio, A.J.; Suárez-Estrella, F.; Jurado, M.M.; López, M.J.; López-González, J.A.; Moreno, J. Prospection of Cyanobacteria Producing Bioactive Substances and Their Application as Potential Phytostimulating Agents. Biotechnol. Rep. 2020, 26, e00449. [Google Scholar] [CrossRef]
  20. Mala, R.; Ruby Celsia, A.S.; Mahalakshmi, R.; Rajeswari, S. Agronomic Biofortification of Amaranthus dubius with Macro Nutrients and Vitamin A. IOP Conf. Ser. Mater. Sci. Eng. 2017, 225, 012214. [Google Scholar] [CrossRef]
  21. Geries, L.S.M.; Elsadany, A.Y. Maximizing Growth and Productivity of Onion (Allium cepa L.) by Spirulina Platensis Extract and Nitrogen-Fixing Endophyte Pseudomonas Stutzeri. Arch. Microbiol. 2021, 203, 169–181. [Google Scholar] [CrossRef]
  22. Righini, H.; Francioso, O.; Martel Quintana, A.; Roberti, R. Cyanobacteria: A Natural Source for Controlling Agricultural Plant Diseases Caused by Fungi and Oomycetes and Improving Plant Growth. Horticulturae 2022, 8, 58. [Google Scholar] [CrossRef]
  23. Żymańczyk-Duda, E.; Samson, S.O.; Brzezińska-Rodak, M.; Klimek-Ochab, M. Versatile Applications of Cyanobacteria in Biotechnology. Microorganisms 2022, 10, 2318. [Google Scholar] [CrossRef]
  24. Muratova, A.; Gorelova, S.; Golubev, S.; Kamaldinova, D.; Gins, M. Rhizosphere Microbiomes of Amaranthus spp. Grown in Soils with Anthropogenic Polyelemental Anomalies. Agronomy 2023, 13, 759. [Google Scholar] [CrossRef]
  25. Bloom, A.J. Mineral Nutrition; Plant Physiology and Development; Taiz, L., Zeiger, E., Møller, I.M., Murphy, A., Eds.; Oxford University Press: Oxford, UK, 2014; pp. 107–130. [Google Scholar]
  26. Pineda-Rodriguez, Y.Y.; Pompelli, M.F.; Jarma-Orozco, A.; Rodríguez, N.V.; Rodriguez-Paez, L.A. A New and Profitable Protocol to DNA Extraction in Limnospira maxima. Methods Protoc. 2023, 6, 62. [Google Scholar] [CrossRef]
  27. Pompelli, M.F.; Barata-Luís, R.; Vitorino, H.S.; Gonçalves, E.R.; Rolim, E.V.; Santos, M.G.; Almeida-Cortez, J.S.; Ferreira, V.M.; Lemos, E.E.; Endres, L. Photosynthesis, Photoprotection and Antioxidant Activity of Purging Nut under Drought Deficit and Recovery. Biomass Bioenergy 2010, 34, 1207–1215. [Google Scholar] [CrossRef]
  28. Valladares, F.; Balaguer, L.; Martinez-Ferri, E.; Perez-Corona, E.; Manrique, E. Plasticity, Instability and Canalization: Is the Phenotypic Variation in Seedlings of Sclerophyll Oaks Consistent with the Environmental Unpredictability of Mediterranean Ecosystems? New Phytol. 2002, 156, 457–467. [Google Scholar] [CrossRef]
  29. Pompelli, M.F.; Espitia-Romero, C.A.; De Diós Jaraba-Navas, J.; Rodriguez-Paez, L.A.; Jarma-Orozco, A. Stevia rebaudiana under a CO2 Enrichment Atmosphere: Can CO2 Enrichment Overcome Stomatic, Mesophilic and Biochemical Barriers That Limit Photosynthesis? Sustainability 2022, 14, 14269. [Google Scholar] [CrossRef]
  30. Sánchez-Bayo, A.; Morales, V.; Rodríguez, R.; Vicente, G.; Bautista, L.F. Cultivation of Microalgae and Cyanobacteria: Effect of Operating Conditions on Growth and Biomass Composition. Molecules 2020, 25, 2834. [Google Scholar] [CrossRef]
  31. Buchanan, B.B.; Wolosiuk, R.A. Photosynthesis: The Carbon Reactions, 5th ed.; Plant Physiology; Taiz, L., Zeiger, E., Eds.; Sinauer Associates, Inc.: Sunderland, MA, USA, 2010; pp. 247–280. [Google Scholar]
  32. Altaf, M.A.; Shu, H.; Hao, Y.; Zhou, Y.; Mumtaz, M.A.; Wang, Z. Vanadium Toxicity Induced Changes in Growth, Antioxidant Profiling, and Vanadium Uptake in Pepper (Capsicum annum L.) Seedlings. Horticulturae 2021, 8, 28. [Google Scholar] [CrossRef]
  33. Jing, F.; Shi, S.; Guan, J.; Lu, B.; Wu, B.; Wang, W.; Ma, R.; Nan, P. Analysis of Phenotypic and Physiological Characteristics of Plant Height Difference in Alfalfa. Agronomy 2023, 13, 1744. [Google Scholar] [CrossRef]
  34. Snider, J.L.; Chastain, D.R.; Meeks, C.D.; Collins, G.D.; Sorensen, R.B.; Byrd, S.A.; Perry, C.D. Predawn Respiration Rates during Flowering Are Highly Predictive of Yield Response in Gossypium hirsutum When Yield Variability Is Water-Induced. J. Plant Physiol. 2015, 183, 114–120. [Google Scholar] [CrossRef]
  35. Bustan, A.; Goldschmidt, E.E. Estimating the Cost of Flowering in a Grapefruit Tree. Plant Cell Environ. 1998, 21, 217–224. [Google Scholar] [CrossRef]
  36. Lee, A.K.; Suh, J.K.; Roh, M.S. Flowering and Changes in Respiration in Asiatic Hybrid Lilies as Influenced by Bulb Vernalization. Sci. Hortic. 2010, 123, 366–371. [Google Scholar] [CrossRef]
  37. Urban, L.; Lu, P.; Thibaud, R. Inhibitory Effect of Flowering and Early Fruit Growth on Leaf Photosynthesis in Mango. Tree Physiol. 2004, 24, 387–399. [Google Scholar] [CrossRef]
  38. Urban, L.; Jegouzo, L.; Damour, G.; Vandame, M.; Francois, C. Interpreting the Decrease in Leaf Photosynthesis during Flowering in Mango. Tree Physiol. 2008, 28, 1025–1036. [Google Scholar] [CrossRef]
  39. Edmeades, G.O.; Daynard, T.B. The Relationship between final Rield and Photosynthesis at Flowering in Individual Maize Plants. Can. J. Plant Sci. 1979, 59, 585–601. [Google Scholar] [CrossRef]
  40. Romanowska-Duda, Z.; Szufa, S.; Grzesik, M.; Piotrowski, K.; Janas, R. The Promotive Effect of Cyanobacteria and Chlorella Sp. Foliar Biofertilization on Growth and Metabolic Activities of Willow (Salix viminalis L.) Plants as Feedstock Production, Solid Biofuel and Biochar as C Carrier for Fertilizers via Torrefaction Process. Energies 2021, 14, 5262. [Google Scholar] [CrossRef]
  41. Bais, J.; Kandel, H.; DeSutter, T.; Deckard, E.; Keene, C. Soybean Response to N Fertilization Compared with Co-Inoculation of Bradyrhizobium japonicum and Azospirillum brasilense. Agronomy 2023, 13, 2022. [Google Scholar] [CrossRef]
  42. Kollmen, J.; Strieth, D. The Beneficial Effects of Cyanobacterial Co-Culture on Plant Growth. Life 2022, 12, 223. [Google Scholar] [CrossRef]
  43. Falcioni, R.; Antunes, W.C.; Demattê, J.A.M.; Nanni, M.R. Biophysical, Biochemical, and Photochemical Analyses Using Reflectance Hyperspectroscopy and Chlorophyll a Fluorescence Kinetics in Variegated Leaves. Biology 2023, 12, 704. [Google Scholar] [CrossRef]
  44. Jiang, N.; Yang, Z.; Zhang, H.; Xu, J.; Li, C. Effect of Low Temperature on Photosynthetic Physiological Activity of Different Photoperiod Types of Strawberry Seedlings and Stress Diagnosis. Agronomy 2023, 13, 1321. [Google Scholar] [CrossRef]
  45. Wang, T.; Li, L.; Qin, Y.; Lu, B.; Xu, D.; Zhuang, W.; Shu, X.; Zhang, F.; Wang, N.; Wang, Z. Effects of Seasonal Changes on Chlorophyll Fluorescence and Physiological Characteristics in the Two Taxus Species. Plants 2023, 12, 2636. [Google Scholar] [CrossRef]
  46. Liu, Z.; Guo, C.; Bai, Y.; Zhang, N.; Yu, Q.; Zhao, F.; Lu, X. Far-Red Chlorophyll Fluorescence Radiance Tracks Photosynthetic Carbon Assimilation Efficiency of Dark Reactions. Appl. Sci. 2021, 11, 10821. [Google Scholar] [CrossRef]
  47. Gashash, E.A.; Osman, N.A.; Alsahli, A.A.; Hewait, H.M.; Ashmawi, A.E.; Alshallash, K.S.; El-Taher, A.M.; Azab, E.S.; Abd El-Raouf, H.S.; Ibrahim, M.F.M. Effects of Plant-Growth-Promoting Rhizobacteria (PGPR) and Cyanobacteria on Botanical Characteristics of Tomato (Solanum lycopersicon L.) Plants. Plants 2022, 11, 2732. [Google Scholar] [CrossRef]
  48. Abdelaziz, A.M.; Attia, M.S.; Salem, M.S.; Refaay, D.A.; Alhoqail, W.A.; Senousy, H.H. Cyanobacteria-Mediated Immune Responses in Pepper Plants against Fusarium Wilt. Plants 2022, 11, 2049. [Google Scholar] [CrossRef]
  49. Santos, É.; Massa, A.; Azevedo, J.; Martins, D.; Reimão, M.; Vasconcelos, V.; Campos, A.; Freitas, M. Cyanobacterial Biomass Used as Biofertilizer in Lettuce Plants: Effects on Growth and Cyanotoxin Accumulation. Biol. Life Sci. Forum 2022, 14, 35. [Google Scholar] [CrossRef]
  50. Bello, A.S.; Saadaoui, I.; Ahmed, T.; Hamdi, H.; Cherif, M.; Dalgamouni, T.; Al Ghazal, G.; Ben-Hamadou, R. Enhancement in Bell Pepper (Capsicum annuum L.) Plants with Application of Roholtiella sp. (Nostocales) under Soilless Cultivation. Agronomy 2021, 11, 1624. [Google Scholar] [CrossRef]
  51. Shariatmadari, Z.; Riahi, H.; Seyed Hashtroudi, M.; Ghassempour, A.; Aghashariatmadary, Z. Plant Growth Promoting Cyanobacteria and Their Distribution in Terrestrial Habitats of Iran. Soil Sci. Plant Nutr. 2013, 59, 535–547. [Google Scholar] [CrossRef]
  52. Kholssi, R.; Marks, E.A.N.; Miñón, J.; Maté, A.P.; Sacristán, G.; Montero, O.; Debdoubi, A.; Rad, C. A Consortium of Cyanobacteria and Plant Growth Promoting Rhizobacteria for Wheat Growth Improvement in a Hydroponic System. S. Afr. J. Bot. 2021, 142, 247–258. [Google Scholar] [CrossRef]
  53. Prasanna, R.; Kanchan, A.; Ramakrishnan, B.; Ranjan, K.; Venkatachalam, S.; Hossain, F.; Shivay, Y.S.; Krishnan, P.; Nain, L. Cyanobacteria-Based Bioinoculants Influence Growth and Yields by Modulating the Microbial Communities Favourably in the Rhizospheres of Maize Hybrids. Eur. J. Soil Biol. 2016, 75, 15–23. [Google Scholar] [CrossRef]
  54. Prasanna, R.; Ramakrishnan, B.; Simranjit, K.; Ranjan, K.; Kanchan, A.; Hossain, F.; Nain, L. Cyanobacterial and Rhizobial Inoculation Modulates the Plant Physiological Attributes and Nodule Microbial Communities of Chickpea. Arch. Microbiol. 2017, 199, 1311–1323. [Google Scholar] [CrossRef]
  55. Mutale-joan, C.; Redouane, B.; Najib, E.; Yassine, K.; Lyamlouli, K.; Laila, S.; Zeroual, Y.; Hicham, E.A. Screening of Microalgae Liquid Extracts for Their Bio Stimulant Properties on Plant Growth, Nutrient Uptake and Metabolite Profile of Solanum lycopersicum L. Sci. Rep. 2020, 10, 2820. [Google Scholar] [CrossRef]
  56. Le Moigne, T.; Crozet, P.; Lemaire, S.D.; Henri, J. High-Resolution Crystal Structure of Chloroplastic Ribose-5-Phosphate Isomerase from Chlamydomonas reinhardtii—An Enzyme Involved in the Photosynthetic Calvin-Benson Cycle. Int. J. Mol. Sci. 2020, 21, 7787. [Google Scholar] [CrossRef]
  57. Kim, H.-J.; Ku, K.-M.; Choi, S.; Cardarelli, M. Vegetal-Derived Biostimulant Enhances Adventitious Rooting in Cuttings of Basil, Tomato, and Chrysanthemum via Brassinosteroid-Mediated Processes. Agronomy 2019, 9, 74. [Google Scholar] [CrossRef]
  58. Espinosa-Antón, A.A.; Hernández-Herrera, R.M.; González, M.G. Extractos bioactivos de algas marinas como bioestimulantes del crecimiento y la protección de las plantas. Biotecnol. Veg. 2020, 20, 257–282. [Google Scholar]
  59. Schiattone, M.I.; Boari, F.; Cantore, V.; Castronuovo, D.; Denora, M.; Di Venere, D.; Perniola, M.; Renna, M.; Sergio, L.; Candido, V. Effects of Nitrogen, Azoxystrobin and a Biostimulant Based on Brown Algae and Yeast on Wild Rocket Features at Harvest and During Storage. Agronomy 2021, 11, 2326. [Google Scholar] [CrossRef]
  60. Ertani, A.; Pizzeghello, D.; Francioso, O.; Sambo, P.; Sanchez-Cortes, S.; Nardi, S. Capsicum chinensis L. Growth and Nutraceutical Properties Are Enhanced by Biostimulants in a Long-Term Period: Chemical and Metabolomic Approaches. Front. Plant Sci. 2014, 5, 375. [Google Scholar] [CrossRef]
  61. Baroni, A.M. Caracterização do Sistema Fotossintético em Folhas de Plantas Jovens de Caesalpinia echinata Lam. (pau-brasil). Ph.D. Thesis, Instituto de Botânica, São Paulo, Brazil, 2005. [Google Scholar]
  62. Mengarda, L.H.G.; Milanez, C.R.D.; Silva, D.M.; Aguilar, M.A.G.; Cuzzuol, G.R.F. Morphological and Physiological Adjustments of Brazilwood (Caesalpinia echinata Lam.) to Direct Solar Radiation. Braz. J. Plant Physiol. 2012, 24, 161–172. [Google Scholar] [CrossRef]
  63. Balah, M.A.; Balah, A.M. Growth and Ecological Characteristics of Physalis angulata Invasive Weed Species in Several Invaded Communities. Biologia 2022, 77, 325–338. [Google Scholar] [CrossRef]
  64. Pájaro-Esquivia, Y.S.; Domínguez-Haydar, Y.; Tinoco-Ojanguren, C. Intraspecific Variation in Morpho-Functional Traits and Plastic Response to Water and Light in Seedlings of Aspidosperma polyneuron (Apocynaceae). Flora 2021, 282, 151903. [Google Scholar] [CrossRef]
  65. Mhlanga, P.F.; Shaik, S. Phenotypic Plasticity in Cucurbita maxima and C. moschata Seedlings as a Measure of Drought Stress Tolerance under Pot Screening. S. Afr. J. Bot. 2023, 159, 290–301. [Google Scholar] [CrossRef]
  66. Adu, M.O. Causal Shoot and Root System Traits to Variability and Plasticity in Juvenile Cassava (Manihot esculenta Crantz) Plants in Response to Reduced Soil Moisture. Physiol. Mol. Biol. Plants 2020, 26, 1799–1814. [Google Scholar] [CrossRef]
  67. Goswami, D.; Parmar, S.; Vaghela, H.; Dhandhukia, P.; Thakker, J.N. Describing Paenibacillus Mucilaginosus Strain N3 as an Efficient Plant Growth Promoting Rhizobacteria (PGPR). Cogent Food Agric. 2015, 1, 1000714. [Google Scholar] [CrossRef]
  68. Alshallash, K.S.; Mohamed, M.F.; Dahab, A.A.; Abd El-Salam, H.S.; El-Serafy, R.S. Biostimulation of Plectranthus amboinicus (Lour.) Spreng. with Different Yeast Strains: Morphological Performance, Productivity, Phenotypic Plasticity, and Antioxidant Activity. Horticulturae 2022, 8, 887. [Google Scholar] [CrossRef]
  69. Alvarez, A.L.; Weyers, S.L.; Goemann, H.M.; Peyton, B.M.; Gardner, R.D. Microalgae, Soil and Plants: A Critical Review of Microalgae as Renewable Resources for Agriculture. Algal Res. 2021, 54, 102200. [Google Scholar] [CrossRef]
  70. Gonçalves, A.L. The Use of Microalgae and Cyanobacteria in the Improvement of Agricultural Practices: A Review on Their Biofertilising, Biostimulating and Biopesticide Roles. Appl. Sci. 2021, 11, 871. [Google Scholar] [CrossRef]
Figure 1. Precipitation (bars, A), relative humidity (red line, A), solar radiation (orange line, B), air temperature (blue line, C), and evapotranspiration (green line, C) registered between July and December 2022 in the open-air raceway.
Horticulturae 09 01309 g001
Figure 2. Net photosynthesis (AN; (AC)), stomatal conductance (gs; (DF)), and transpiration (E; (GI)), intrinsic water use efficiency (WUEi; (JL)), and stomatal threshold (ST) in V. unguiculata (A,D,G,J,M), S. rebaudiana (B,E,H,K,N), and S. melongena (C,F,I,L,O) in response to L. maxima extract concentrations (0, 4, 8, 12 mg mL−1). Bars followed by different letters indicate significant differences between treatments (SNK; p < 0.05). Each bar denotes mean ± standard deviation.
Horticulturae 09 01309 g002
Figure 3. Quantum yield of photosystem II, ΦPSII (AC), maximum efficiency of photosystem II, Fv′/Fm′ (DF), and electron transport rate, ETR (μmol e m−2 s−1) (GI) in V. unguiculata (A,D,G), S. rebaudiana (B,E,H), and S. melongena (C,F,I) in response to L. maxima extract concentrations. Different letters above bars indicate significant differences between treatments according to Student–Newman–Keuls (SNK) multiple comparison test (p < 0.05). Values denote mean ± standard deviation.
Horticulturae 09 01309 g003
Figure 4. Relationship between net photosynthesis (AN) and stomatal conductance (gs) or between AN and transpiration (E). Coefficients’ regressions and p values are shown.
Horticulturae 09 01309 g004
Figure 5. Regression between the ratio of electron transport rate (ETR) and net photosynthesis (AN) versus stomatal conductance (gs) evaluated in S. melongena (red symbols), S. rebaudiana (green symbols), and V. unguiculata (purple symbols). The regression R2 values are shown.
Horticulturae 09 01309 g005
Figure 6. Regression between the net photosynthesis (AN) diurnal changes in the estimated fluxes of photons utilized through photochemistry (P; (A)), dissipated thermally (D; (B)), and the fraction neither used in photochemistry nor dissipated thermally (PE; (C)) evaluated in S. melongena (red symbols), S. rebaudiana (green symbols), and V. unguiculata (purple symbols). All points denote a plant irrespective to L. maxima concentration. The regression R2 and p value are shown.
Horticulturae 09 01309 g006
Figure 7. Principal component analysis showing the interaction between net photosynthesis and other variables and between leaf area and biomass production. (A) Clustering formation. (B) Autovectors of PCA. SDW, stem dry weight; LA, leaf area; TDW, total dry weight; LDW, leaf dry weight; RDW, root dry weight; E, transpiration; gs, stomatal conductance; AN, net photosynthesis; ETR, electron transport rate; ΦPSII, quantum yield of photosystem II; P, estimated fluxes of photons utilized through photochemistry; D, dissipated thermally or PE, fraction neither used in photochemistry nor dissipated thermally; Fv’/Fm’ ratio, maximum efficiency of photosystem II; LS, stomatal threshold; WUEi, intrinsic water use efficiency.
Horticulturae 09 01309 g007
Figure 8. Heat map summarizing all evaluated characteristics in each treatment and species. To construct the ratio between treatment and control, logarithm with base 2 was applied, and the colors follow the scale. All squares with asterisks (*) denote significance at p ≤ 0.05. For acronyms, please see Figure 7.
Horticulturae 09 01309 g008
Table 1. Substrate chemical characteristics.
pHO.CSPCaMgKNaCuFeMnB
1:1%mg kg−1cmol (+) kg−1mg kg−1
6.340.7516.436.02.911.360.460.200.6912.914.80.32
O.C = Organic Carbon; S = Sulfur; P = Phosphorus; Ca2+ = Calcium; Mg2+ = Magnesium; K+ = Potassium; Na+ = Sodium; Cu = Copper; Fe = Iron; Mn = Manganese; B = Boron. The element abbreviations are in accordance with Bloom [25].
Table 2. The mineral composition of L. maxima extract.
NPKMgCaNaProteinCarbohydratesAsh
mg g−1 DWg g−1 DW
0.110.410.350.120.110.400.020.0170.002
Table 3. Phenotypic characteristics of V. unguiculata, S. rebaudiana, and S. melongena in response to L. maxima extract concentrations.
SpeciesLimnospira maxima
(mg mL−1)
Root Dry Weight
(g)
Stem Dry Weight
(g)
Leaf Dry Weight
(g)
Total Dry Weight
(g)
Canopy/Root Ratio
V. unguiculata02.27 ± 0.02 c 1.64 ± 0.02 d2.82 ± 0.02 b6.72 ± 0.03 c1.97 ± 0.03 b
42.22 ± 0.02 d1.84 ± 0.02 c2.61 ± 0.02 c6.68 ± 0.04 c2.00 ± 0.04 b
83.13 ± 0.03 a2.64 ± 0.02 a2.82 ± 0.03 b8.60 ± 0.06 a1.74 ± 0.02 c
122.63 ± 0.01 b2.44 ± 0.02 b3.24 ± 0.03 a8.31 ± 0.03 b2.15 ± 0.02 a
S. rebaudiana00.49 ± 0.05 c0.60 ± 0.08 d0.59 ± 0.03 d1.67 ± 0.10 d2.45 ± 0.21 d
40.60 ± 0.07 b0.87 ± 0.05 c1.30 ± 0.06 c2.77 ± 0.13 c3.67 ± 0.47 c
80.74 ± 0.04 a1.91 ± 0.07 b1.58 ± 0.03 b4.23 ± 0.04 b4.71 ± 0.39 b
120.46 ± 0.10 c2.36 ± 0.10 a1.71 ± 0.07 a4.54 ± 0.02 a9.26 ± 2.43 a
S. melongena01.20 ± 0.006 d3.23 ± 0.06 d1.78 ± 0.05 d6.21 ± 0.11 d4.17 ± 0.10 a
42.29 ± 0.003 c3.70 ± 0.08 c2.86 ± 0.11 c8.85 ± 0.13 c2.86 ± 0.05 c
82.45 ± 0.004 b4.30 ± 0.08 b3.81 ± 0.09 b10.57 ± 0.15 b3.31 ± 0.06 b
123.30 ± 0.006 a4.90 ± 0.05 a5.91 ± 0.09 a14.11 ± 0.13 a3.28 ± 0.04 b
Note: Lowercase letters different within the same column indicate significant differences between treatments for each species according to the Student–Newman–Keuls (SNK) multiple comparison test (p < 0.05). Values represent the mean ± standard deviation; n = 4.
Table 4. Plasticity index of photosynthetic, chlorophyll fluorescence, and morphologic features in the leaves of Solanum melongena, Stevia rebaudiana, and Vigna unguiculata plants growing under Limnospira maxima extract. Means followed by lower case letters denote statistical differences between species in the same feature (Newman–Keuls test p ≤ 0.001), and uppercase letters denote statistical differences between features (Bonferroni’s test at p ≤ 0.001).
Photosynthetic FeaturesS. melongenaS. rebaudianaV. unguiculataMean Value
AN0.2350.4230.3710.343
gs0.5390.4230.6480.537
E0.3180.4590.5500.442
LS0.4040.2280.4080.347
WUEi0.4340.3060.5310.424
Mean value0.386 ± 0.116 a0.368 ± 0.097 a0.501 ± 0.113 a0.418 ± 0.080 A
Chlorophyll a fluorescence features
ΦPSII0.2250.3060.1540.228
ETR0.1760.3090.1330.206
Fv′/Fm′0.3850.1010.1610.216
qP0.0950.3370.0710.168
P0.1970.4120.1460.252
D0.2700.0980.2420.203
PE0.5790.3050.2960.393
Mean value0.275 ± 0.161 a0.267 ± 0.120 a0.172 ± 0.074 a0.238 ± 0.073 A
Morphological features
PH0.2000.5480.3550.368
LA0.5740.5960.3170.495
RDW0.6390.5810.3020.507
SDW0.3620.7990.3950.519
LDW0.7130.7010.2070.540
TDW0.5720.6500.2340.485
Mean value0.510 ± 0.192 a0.646 ± 0.093 a0.301 ± 0.071 b0.486 ± 0.061 A
Disclaimer/Publisher’s Note: The statements, opinions and data contained in all publications are solely those of the individual author(s) and contributor(s) and not of MDPI and/or the editor(s). MDPI and/or the editor(s) disclaim responsibility for any injury to people or property resulting from any ideas, methods, instructions or products referred to in the content.

