Article

An Application of System Dynamics to Characterize Crop Production for Autonomous Indoor Farming Platforms (AIFP)

1
Department of Soil and Water Systems, College of Agriculture and Life Sciences, University of Idaho, Boise, ID 83702, USA
2
National Institute of Agricultural Sciences, Rural Development Administration, Jeonju 54875, Republic of Korea
*
Author to whom correspondence should be addressed.
Horticulturae 2023, 9(12), 1318; https://doi.org/10.3390/horticulturae9121318
Submission received: 7 September 2023 / Revised: 29 November 2023 / Accepted: 2 December 2023 / Published: 7 December 2023
(This article belongs to the Section Vegetable Production Systems)

Abstract

:
Smart farming using technology-monitored controlled environment agriculture (CEA) has recently evolved to optimize crop growth while minimizing land use and environmental impacts, especially for climate-threatened regions. This study focuses on characterizing crop production using system dynamics (SD) modeling, which is a relatively new approach in CEA settings. Using tomatoes in a hydroponic growing system, we explore an alternative food resource potentially accessible to underserved areas in rural and/or urban settings under abrupt climate variability. The designed autonomous indoor farming platforms (AIFP) are equipped with the Internet of Things (IoT) to monitor the physiological parameters, including electrical conductivity (EC), pH, and water temperature (WT) associated with plant growth. Two varieties of tomato (Solanum lycopersicum) plants were used in this study with two different nutrient inputs (N-P-K ratios of 2-1-6 and 5-5-5) to assess the nutrient application impact on yield, especially focusing on the early stages of tomato to conceptualize and parametrize SD modes. Repeated measure analysis was conducted to investigate the effects of the environmental factors (EC, pH, and WT) in response to changing plant nutrients. The results show that different nutrient compositions (N-P-K ratios) have a noticeable effect on both pH and WT (p < 0.001) as opposed to EC. The study indicates that the proposed AIFP would be a promising solution to produce other crops for indoor farming in a changing climate. We anticipate that the proposed AIFP along with SD tools will be widely adopted to promote indoor farming in changing climates, ultimately contributing to community resilience against food insecurity in disadvantaged areas for years to come.

1. Introduction

Urban agriculture has grown rapidly in recent years as an aspect of ensuring sustainability in the food production system [1,2,3,4,5]. With the continuous expansion of urban populations [6], it is expected that almost two-thirds of the world’s population will live in cities by the year 2050. Traditional farming techniques alone cannot keep up sustainable food production to feed the burgeoning population [7,8,9]. In addition to population growth, the impact of industrialization, environmental degradation, a decline in arable land, and climate change on conventional farming practices has increased the concern for ensuring food security in urban settings [10,11,12]. As the decline in agricultural lands, freshwater, and soil nutrients threaten the global food supply [13], new developments and approaches in food production are emerging to address food security concerns, emphasizing the reduction of non-renewable energy usage and the increase in production yield [14].
At present, urban agriculture is defined as soil based and community led, with the goal being to cultivate, process, and distribute food in cities [15]. However, over the decade, soilless and controlled environment agriculture (CEA) techniques are growing in popularity by minimizing urban land use and energy consumption, consequently achieving a higher yield of production than soil-based farming [16]. The CEA has more advantages in its ability to better predict crop responses, enhance crop productivity, maintain food product quality, and optimize crop yield without compromising the outdoor climate [17]. In addition, the interest in CEA includes water conservation, less or nearly no application of pesticides and herbicides, reduction of CO2 emissions, and prevention of crop diseases by ensuring a clean environment for agricultural practices [18,19,20]. The CEA in urban settings, therefore, can be an effective alternative for food production in climate-threatened regions and cities with insufficient land area for producing crops, and it can also help ensure affordable food for people who live in ‘food desert’ areas [21,22,23]. Several CEA facilities have been developed over the last decade and have contributed significantly to urban agriculture disciplines. The CEA process includes small-scale (e.g., window or home farming), medium-scale (e.g., community gardens), and large-scale farming (e.g., indoor plant factories, commercial vertical farming, and aquaponics) [24,25]. The economic value of global vertical farming is another research avenue as its economic benefit is estimated to be about USD 5.9 billion in 2022 and is expected to grow 20% by 2030 [26].
Soilless farming techniques such as hydroponics, aeroponics, and aquaponics have been widely used to produce consistent and high-quality crops in CEA. These farming techniques can grow a variety of leafy greens, tomatoes, herbs, strawberries, and cannabis [27]. Among several crop productions, tomato production has increased rapidly in recent years. Fresh tomato production increased in the United States (US) with the per capita availability of tomatoes in the US jumping from 5.5 kg in the 1980s to 9.4 kg from 2010 to 2017 [28] as greenhouse technology improved significantly [29]. Tomato production using hydroponics can achieve higher yields by controlling growth factors such as electrical conductivity (EC), light intensity, pH, water temperature (WT), and dissolved oxygen (DO). Note that managing irrigation strategy and frequency with a high concentration of nutrient solution can contribute to increasing electrical conductivity (EC) and accomplish improved quality of full-grown tomato production [30,31].
Additionally, fast-moving technologies such as machine learning, the Internet of Things (IoT), wireless sensor networks (WSNs), and high-speed internet further accelerate technical advances in CEA by monitoring and controlling growth factors and production remotely. Recent studies [32,33,34,35,36,37] also feature automated greenhouse environments equipped with such technologies. Thus, the remote monitoring of the system using IoT is practicable, and the physiological data acquired remotely can be shared with other greenhouse farmers online [38].
In this paper, we feature a system dynamic model that can be a useful tool to better design, manage and optimize a growing system in CEA environment. System dynamics (SD) is a computational modeling technique designed to assist in identifying problems, exploring potential solutions, and enhancing our capacity to project and estimate within a larger context [39]. Since SD modeling approaches have been widely used in different fields, including the insurance industry, urban planning, global resource dynamics, the K-12 education, and water resources planning and management [40,41,42,43], we predict that the proposed approach will assist growers in increasing agricultural profitability while also helping the food industry in the near future. This study focuses on two objectives: (1) developing an autonomous and small-scale indoor farming system to provide alternative food resources in a changing climate; and (2) incorporating an SD model to explore the optimal values of the environmental factors.
Although modern greenhouses are equipped with automated control systems and technologies enabling remote access [44,45,46,47,48,49,50,51], the proposed SD approach can be also applied to other modern greenhouses settings [44,45,46,47,48,49,50,51], along with automated control systems and technologies via remote access to achieve better outcomes [52,53,54].

2. Materials and Methods
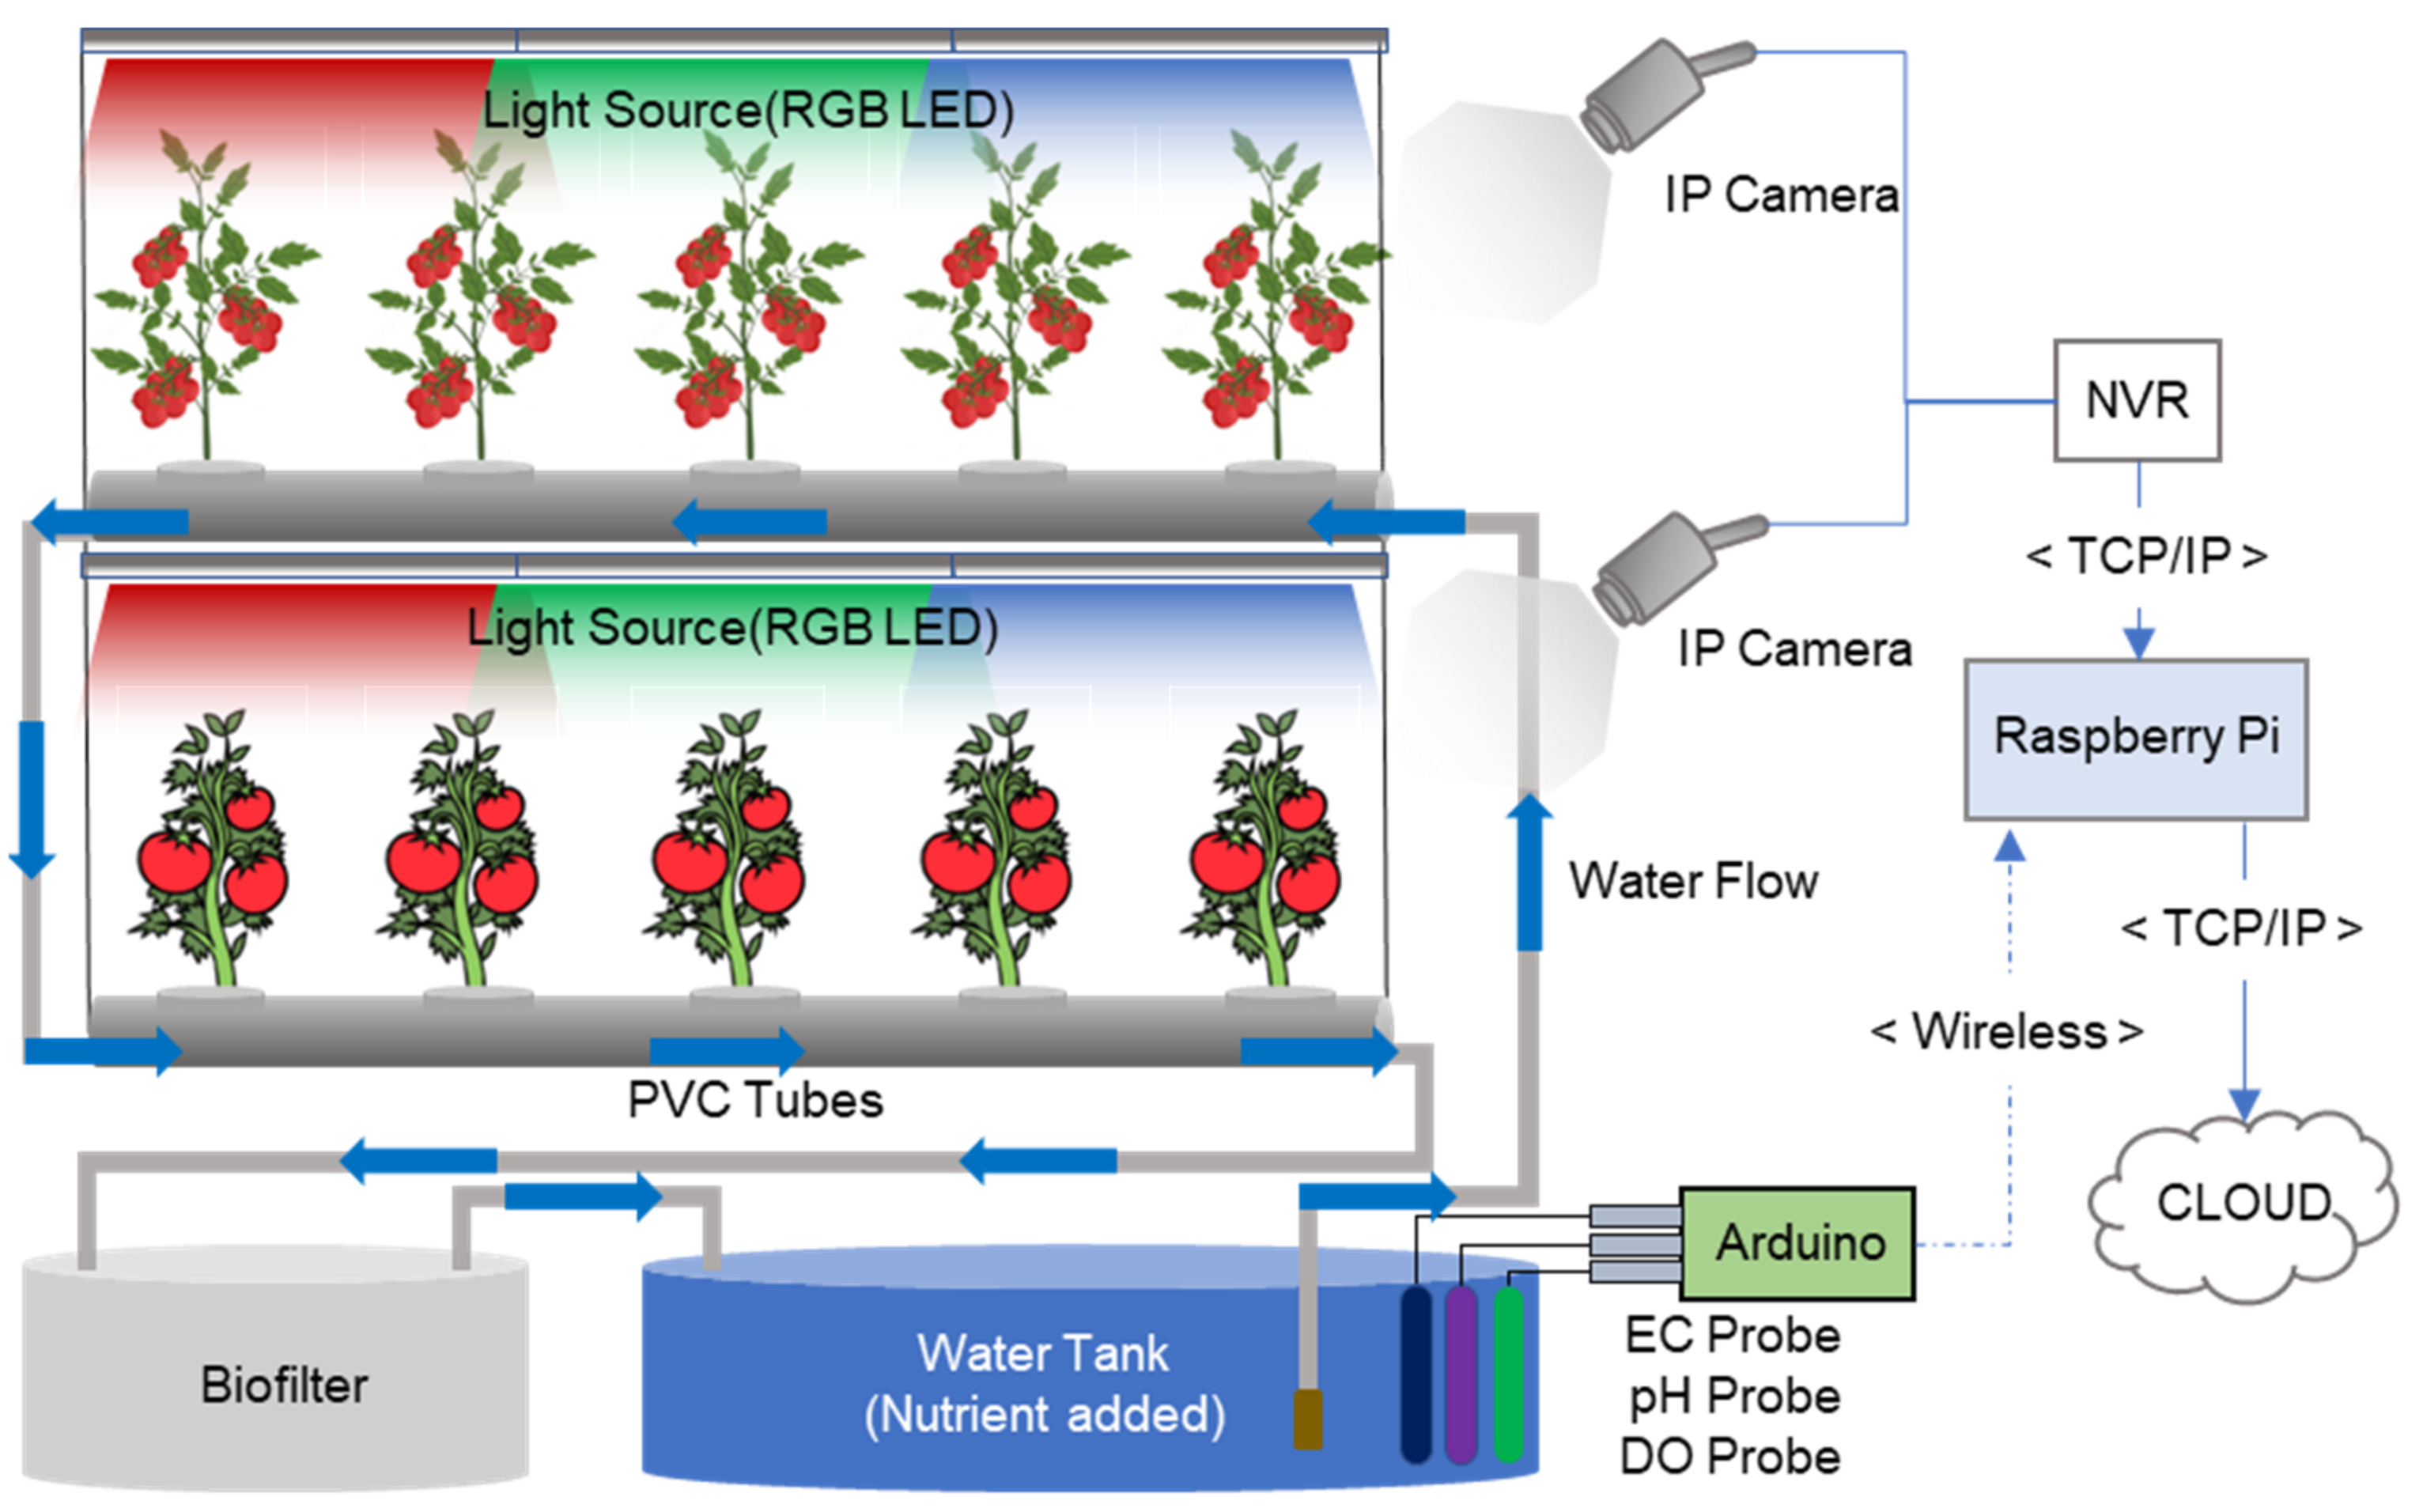
2.1. System Setup

The experiment was conducted in a controlled environment hydroponic set-up at the facility of the University of Idaho, Boise, United States (US). An autonomous, low-cost, indoor farming platform using a hydroponic system (AIFP) was designed for sustainable tomato production. The bill for materials is estimated at less than USD 2000 (not shown in this paper). Two types of tomato (Solanum lycopersicum) plants were used in this experiment: heirloom indeterminate regular-size cherry tomato (Solanum lycopersicum var. cerasiforme) and heirloom determinate dwarf-size traditional tomato (Solanum lycopersicum L.) to assess the system performance across different plant heights and growth patterns. Aiming to determine their suitability, non-genetically modified organism (non-GMO) and certified seeds of the two tomato plants were sown in rock wool grow plugs for germination and transplanted to the AIFP. Basically, seeds were sown in a grow plug where each plug contained 3 seeds, and were placed in a plastic dome. The dome was placed on a heat mat and a T5 fluorescent grow light was provided to facilitate germination processes. The amount of water provided for seed germination was about 2 L with no nutrients added to the system. Drinking water was provided after dichlorination and filtration processes. The water analysis conducted on this site had been found to comply with federal health-based drinking water standards. Thus, the monitoring report includes the status of the following substances: fluoride—0.31 mg/L (standard: 4 mg/L); arsenic—<2.00 μg/L (standard: 10 μg/L); nitrate—0.08 mg/L (standard: 10 mg/L); chloride—1.69 mg/L (standard: 250 mg/L); iron—<0.01 mg/L (standard: 0.3 mg/L); manganese—<0.001 mg/L (standard: 0.05 mg/L); selenium—<0.002 mg/L (standard: 0.05 mg/L); and sulfate—8.9 mg/L (standard: 250 mg/L). No significant mineral addition was found in the drinking water.

2.2. System with Environmental Factors

The autonomous, scalable, and soilless indoor farming platform (AIFP) is constructed in CEA settings to grow two different tomato plants, CT and DT, as shown in Figure 1. The AIFP system consists of a recirculating growth chamber, biofilter, IoT sensors, and other hardware. The growth chamber dimensions were 123 cm in width, 46 cm in length, and 183 cm in height. It was made of a steel wireframe certified by the National Sanitation Foundation (NSF) and contained 3 shelves. Among these shelves, 4 polyvinyl chloride (PVC) tubes with 36 holes for plantation were placed in one shelf and connected with the water reservoir and biofilter. The biofilter is made of PVC pipes, hoses, pea gravels, and fabric materials such as a filter pad, scrub exfoliator, and bioball. The materials were set up in a utility bucket (22.7 L, equivalently 5 gallons) to enable nitrification cycles [55] and to treat the wastewater for recirculating treated water to the plants. IoT devices were used for real-time monitoring and sensing of the water parameters in the reservoir, including electrical conductivity (EC), water temperature (WT), and dissolved oxygen (DO). In addition, a Power over Ethernet (POE) Internet Protocol (IP) camera was included in the system to monitor plant growth remotely.
Other accessories used in this setting were a water reservoir with 64 L capacity, a water pump, a light source, timers, a light meter (measuring light intensity), a hygrometer (measuring temperature and humidity), a power consumption meter, and water supply hose lines. The design of this AIFP set-up is shown in Figure 1.

2.3. Data Analysis

Two AIFP systems were built to investigate the nutrient impact on environmental factors for plant growth. It assessed the changes in EC, pH, and WT associated with different nutrient applications (N-P-K ratios). The grown CT after 7-day seedlings were transplanted in both AIFP systems, but two different nutrient solutions (N-P-K ratios) applied. Data analysis was carried out using Rstudio to analyze the impact of different nutrient concentrations on crop yields associated with controlled factors [56,57,58,59].
Repeated measures were carried out to examine the system’s performance by focusing on the relationship between nutrient application (N-P-K ratios) and the controlled variables, such as EC, pH, and WT. A multivariate analysis of variance (MANOVA) approach [60,61,62,63,64,65,66] was used to parameterize SD models during the designated growth periods between transplanting (about 7 days from seedling) and the vegetative stage (about 22 days from seeding) for SD model parameterization and calibration purposes.

2.4. System with Nutrient Inputs

Two different ratios of nutrient solutions including nitrogen (N), phosphorous (P), and potassium (K) were applied to the system as shown in Table 1. Nutrients with N-P-K ratios of 2-1-6 and 5-5-5 were mixed and applied directly into the water reservoirs of the two growth chambers, and data collection was carried out afterward.

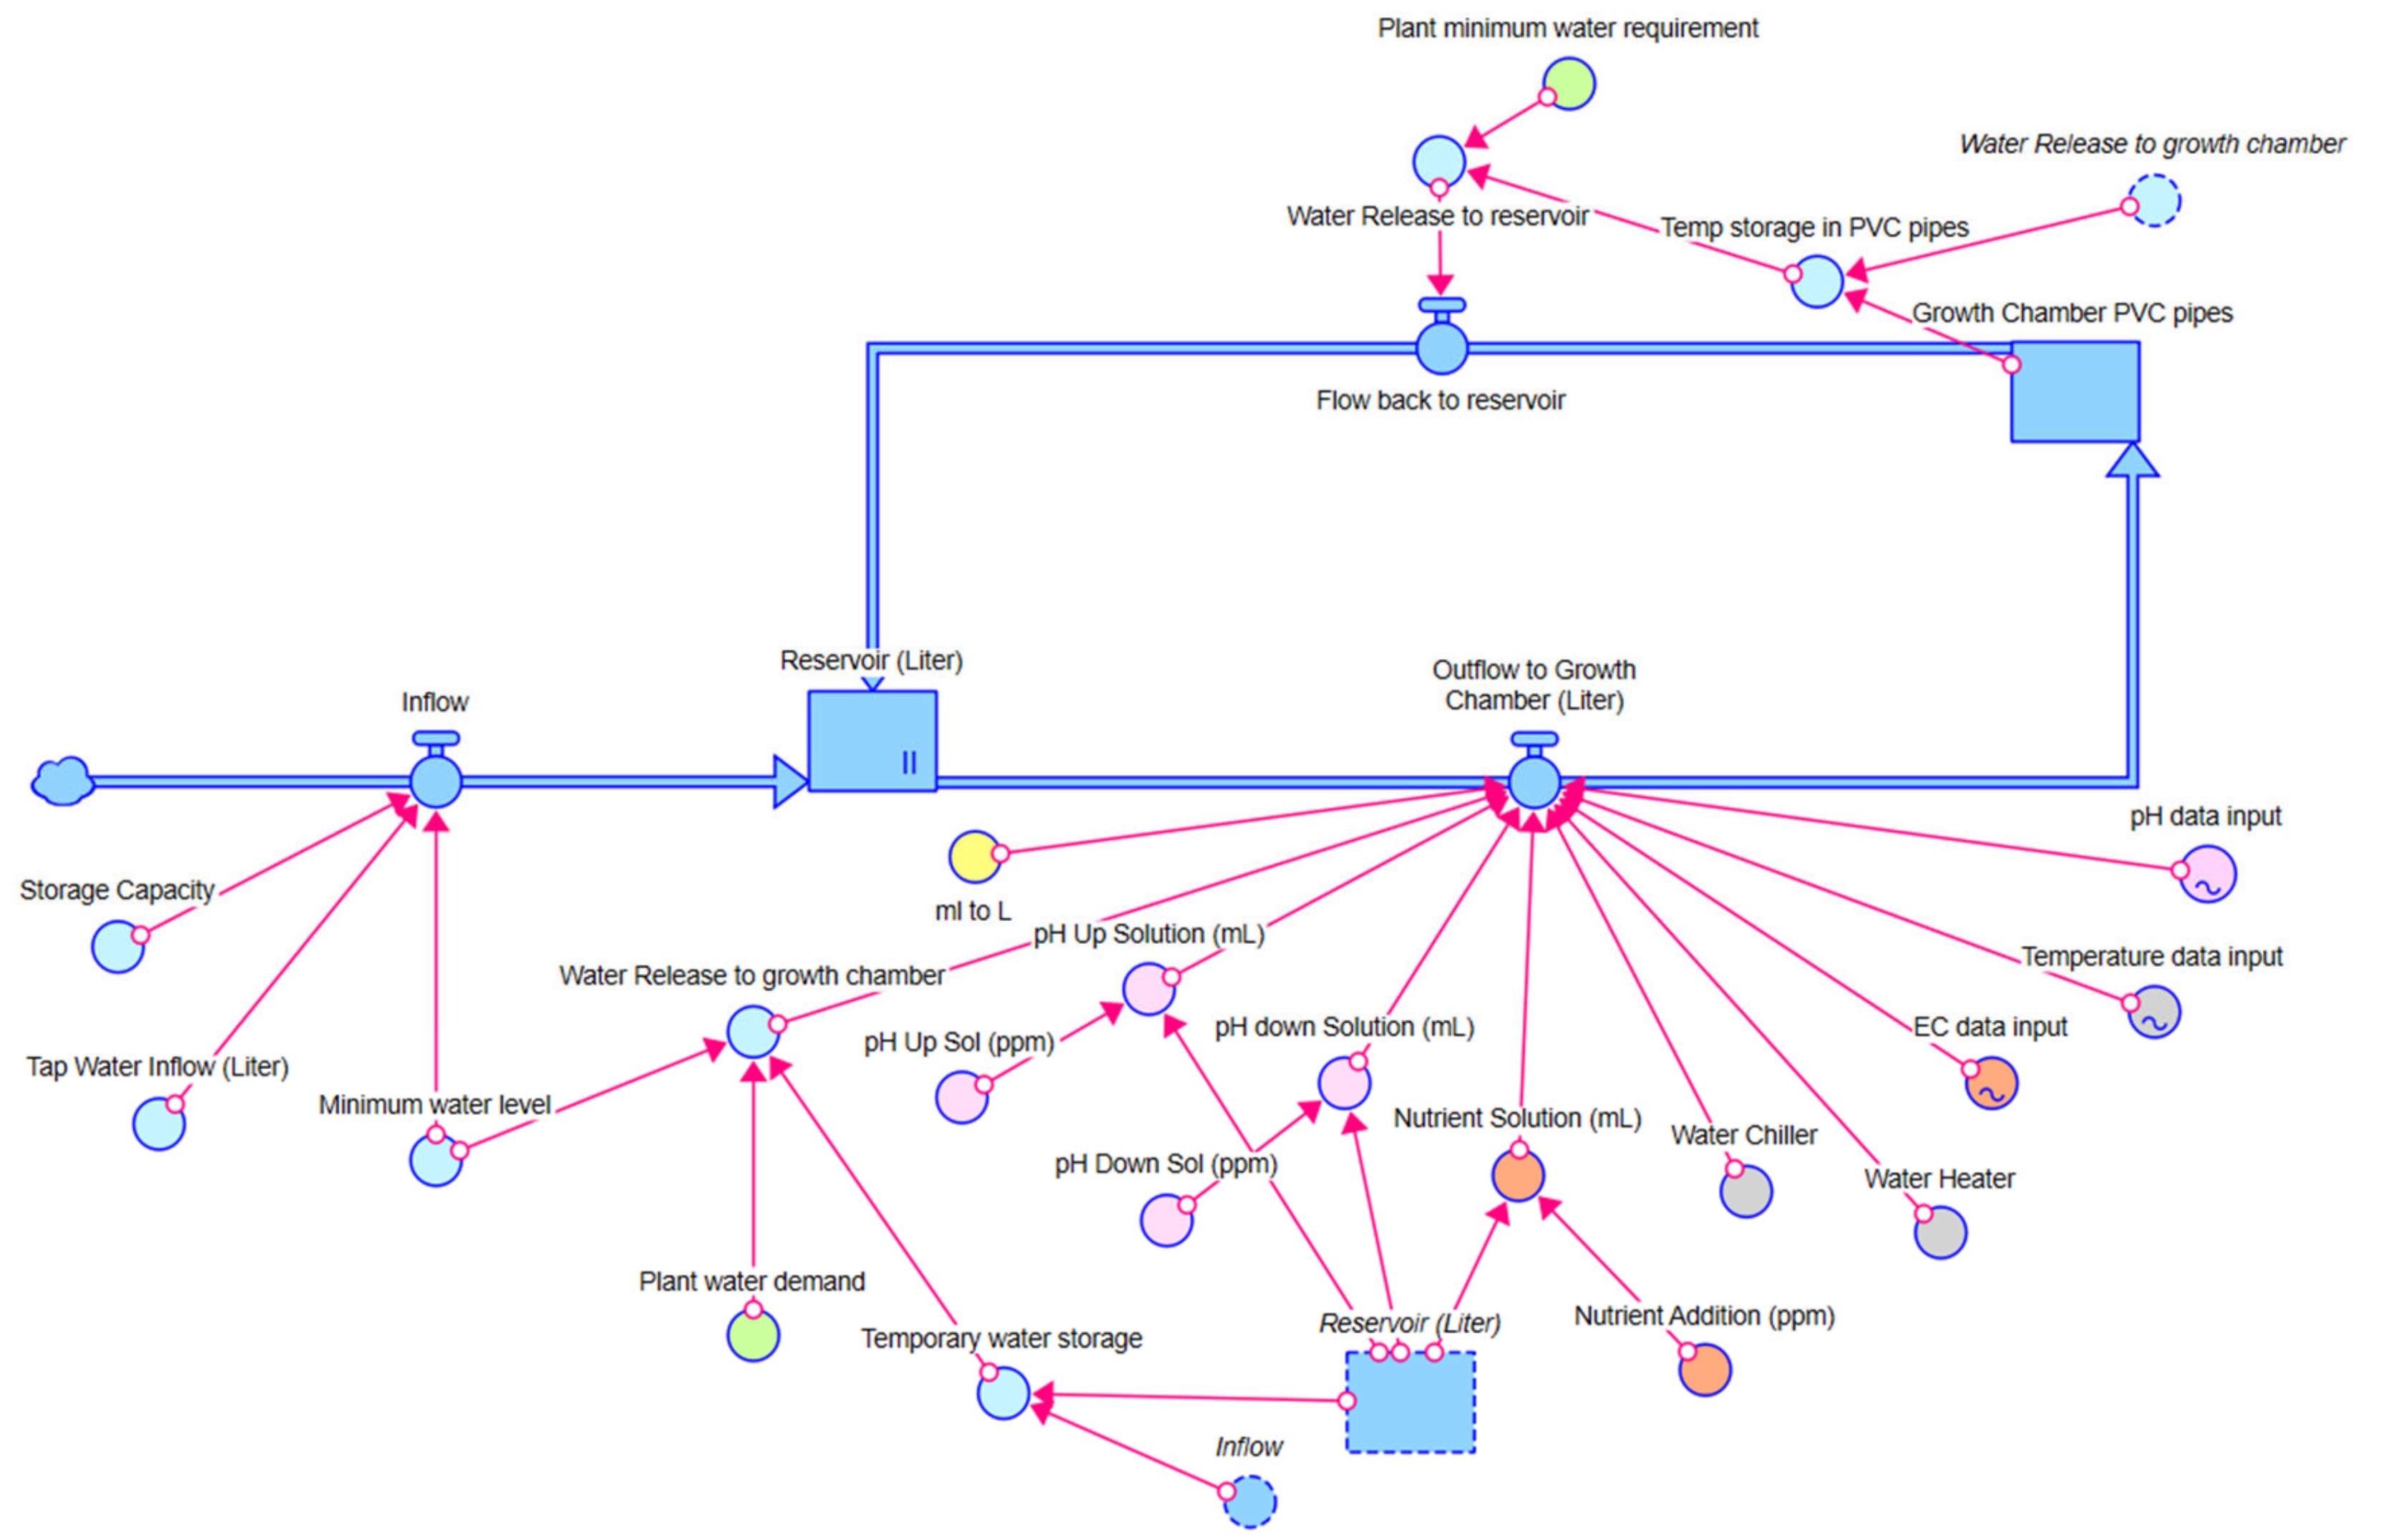
2.5. System Dynamics Approach

A system dynamic (SD) model was employed to explore the optimal environmental factors for crop growth in indoor settings. The two key components of SD models are stocks and flows. Stock, a building block, provides inertia and memory, and its value depends on the system’s past behavior at a given time. Flow impacts the stock by increasing or decreasing its value, which is determined over a period of time. Although there are many different softwares available to emulate SD concepts, we used Stella Architect (SA) due to previous applications [40]. To know more about SD applications, the readers can find the author’s previous work [40] and a schematic of SD model for this study is shown in Figure 2. Thus, the proposed SD model here presents the functional relationships of each component and the management of the AIFP for tomato plant growth over time (see Figure 2).
The water reservoir/storage was initially stored with 64 L of water. In this case, the inflow to the reservoir only functions when water level drops below the minimum water level threshold (e.g., variable name is minimum_water_level shown in Figure 2); otherwise, no inflow will be provided to the reservoir. The outflow of the reservoir is directed to the PVC pipes of the growth chamber where the tomato plants are transplanted. The outflow is designed to release water every 30 min for a 5 min duration of flow cycles according to the plant water demand. The optimal ranges for environmental factors to grow tomatoes in the AIFP system are found, as follows: pH between 6 and 6.4, EC greater than 1500 μS/cm, and water temperature from 17 to 24 °C. For example, when the pH data from the IoT sensor records higher than 6.5, then the pH down solution was applied, whereas the pH up solution was applied when pH was less than 5.
Similarly, when the sensor data show EC being less than 1500 μS/cm, additional nutrient solution was added until EC values met the target. Also, temperature control can be made using water chillers and/or water heaters (when necessary) to maintain the range of 17 °C to 24 °C. Figure 3 illustrates the diagram of EC, pH, and WT dynamics in the AIFP system.
Note that the designed AIFP here recirculates water autonomously.

3. Results

3.1. Impact of Nutrient Solution on the pH Values of the Plants

While CT plants were found to have pH levels between 5 and 7, the DT plants had a wide variety in pH levels for both nutrient solutions. The 5-5-5 (N-P-K) solution for the DT plants ranged between 4 to 7, while 2-1-6 was found to have a high pH range of 7.5 to 8.7 (see Figure 4).
Table 2 shows MANOVA analysis of the effect of nutrient composition, water temperature, EC, and two different plant species on pH. The p-values of nutrients and EC with pH are found to be statistically significant (<0.001).

3.2. Impact of Nutrient Solution on the EC Values of the Plants

A higher EC value was targeted to achieve optimum plant growth and vegetation. While a nutrient ratio of N-P-K (2-1-6) provides a wide range of EC values from 600 to 2400 μS/cm for the CT plant, the other nutrient ratio of N-P-K (5-5-5) indicates EC values of 1000 to 1800 μS/cm for the CT plant and 1100 to 2950 μS/cm for the DT plant. Figure 5 shows the effect of nutrients on the EC values for the two plants.
Table 3 shows a MANOVA analysis of the effect of nutrient composition, water temperature, pH, and two different plant species on EC. The p-values of EC were only significant with pH (p < 0.001).

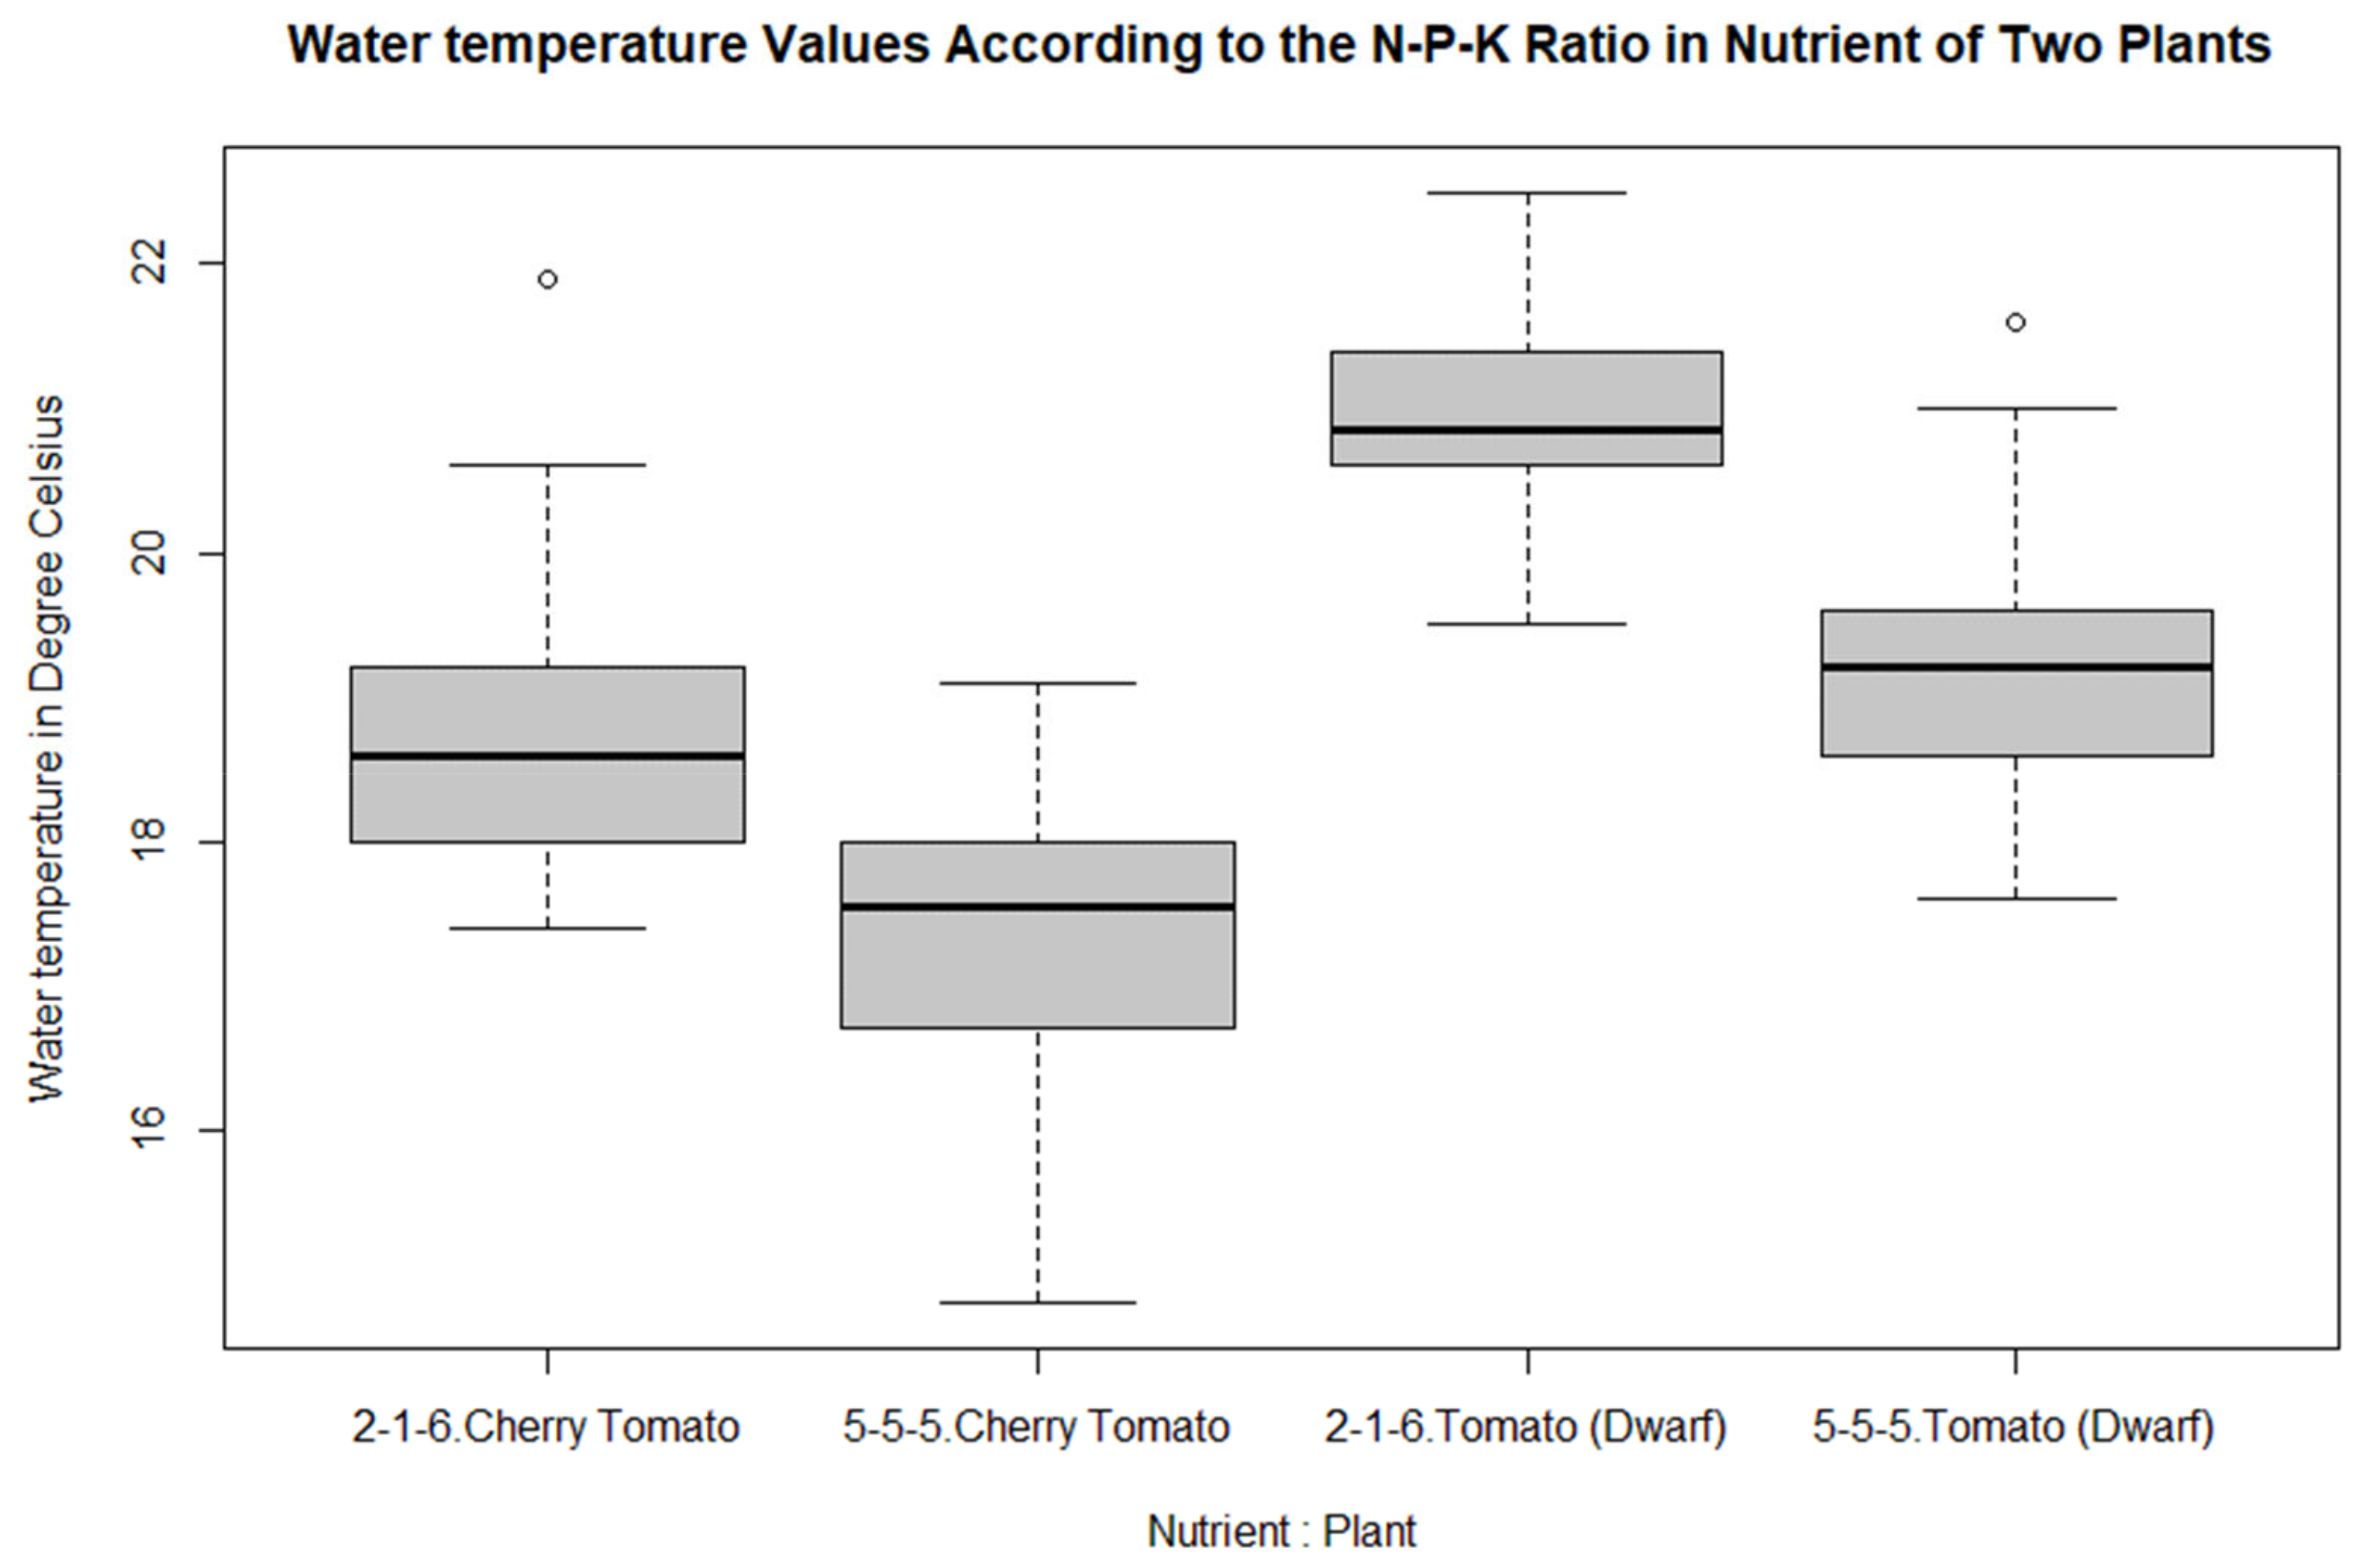
3.3. Impact of Nutrient Solution on the Water Temperature Values of the Plants

Water temperature (WT) in the AIFP system ranged between 15 to 22.5 °C (See Figure 6). Different N-P-K nutrients did not show significant differences in changing water temperature. While 2-1-6 nutrients contributed to keeping the CT temperature in the range of 17 to 21 °C, it increased the temperature for the DT plant, higher than 19 °C. In contrast, 5-5-5 nutrient application decreased the water temperature in the CT plant (15 to 19 °C) but worked well for the DT plant (17.5 to 21 °C).
Table 4 shows MANOVA analysis on the impact of nutrients, pH, EC, and plant species in response to water temperature. Nutrients and different plant species were found to have significant effects on water temperature (p < 0.001).

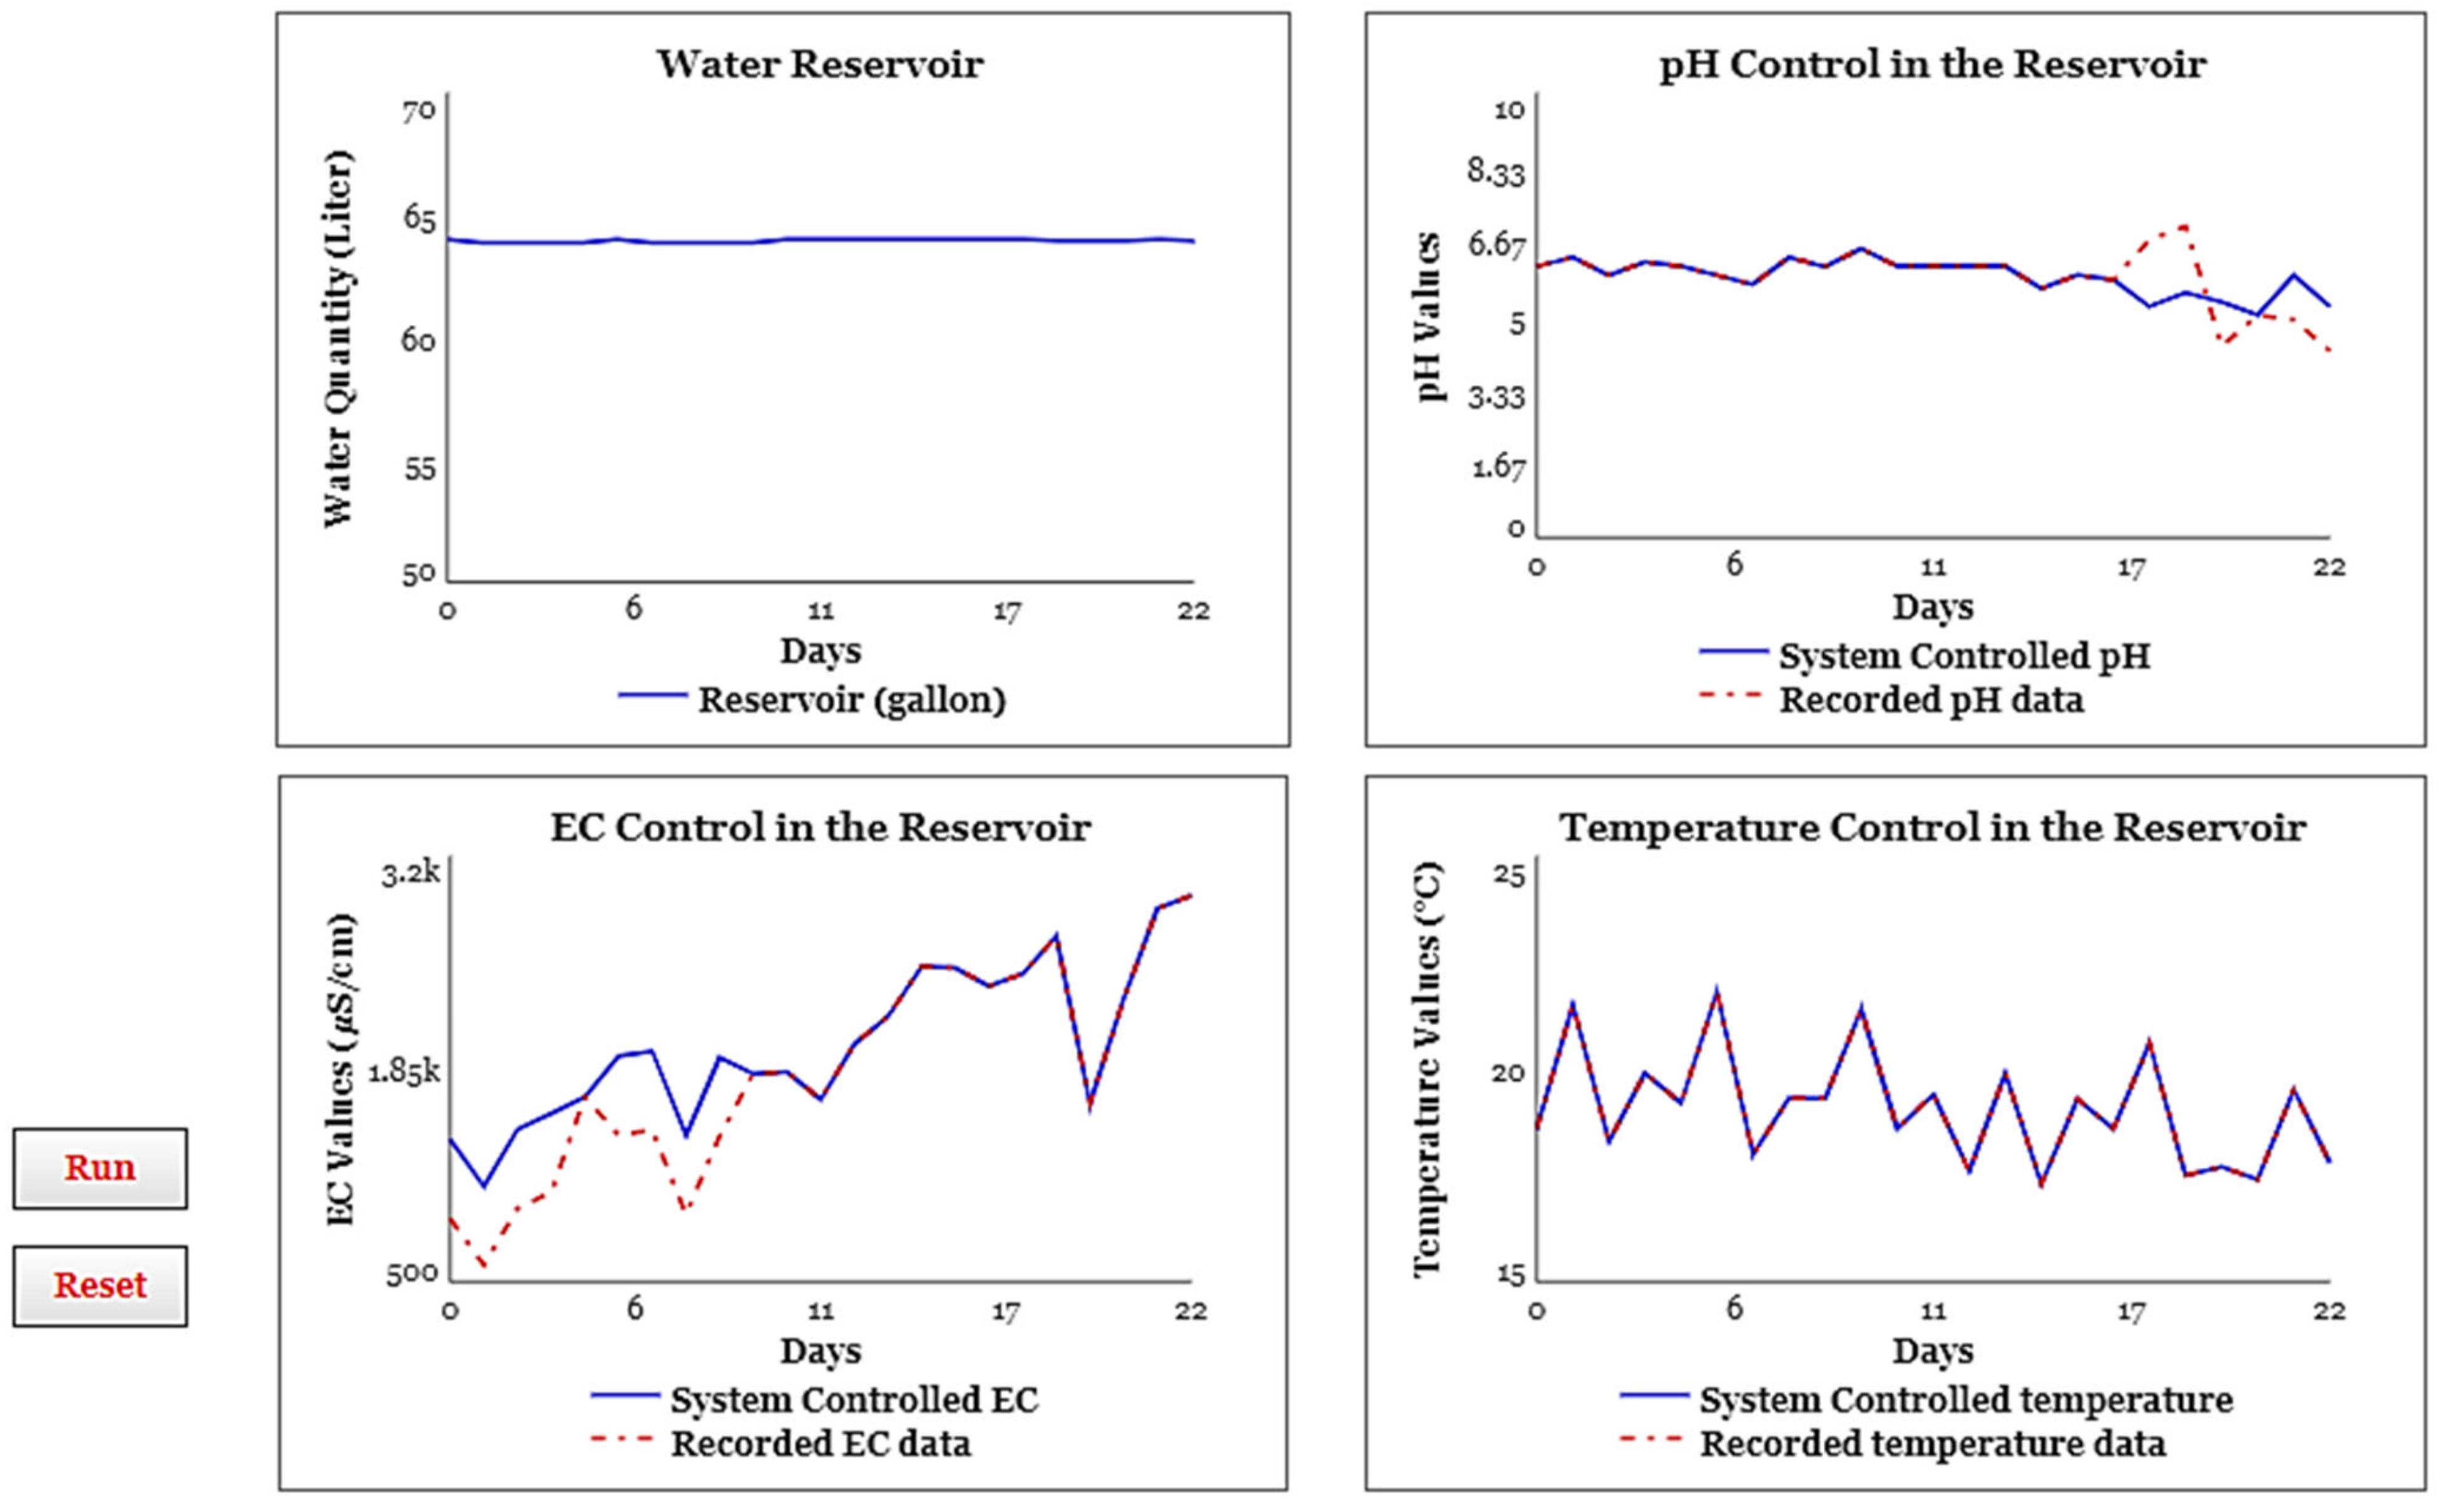
3.4. System Dynamics and Data Visualization

Figure 7 displays the system performance associated with different environmental factors (EC, pH, and WT) by comparing the observed data versus simulated data using SD models. It is noteworthy that the two graphs are well matched to represent tomato growth in the AIFP system.

4. Discussion

The proposed AIFP can be an effective approach to establish a small-scale autonomous hydroponic system [67]. The designed system worked well to produce tomatoes by monitoring environmental factors (EC, pH, WT) associated with different nutrient inputs. As the results indicate, nutrient contribution to crop growth is critical in addition to environmental factors such as EC, pH, and WT. Previous studies also showed that tomato quality and yield are influenced by nutrient solution and EC values, since EC varies with nutrient composition and concentration, and a higher EC contributes to a better flavor and taste of tomatoes [68,69].
The optimal EC values for the tomato flowering to harvest phase is within the range of 1400 μS/cm to 4000 μS/cm in the hydroponic system [70,71,72]. Some studies have found that EC value of 3000 μS/cm is the threshold for all growth stages of hydroponically grown tomatoes [23,73]. Therefore, in this study, the nutrient solutions were applied to achieve the EC level from 1400 to 3000 μS/cm. The MANOVA analysis shows the significant effect of pH in response to EC (p < 0.001). It does not show a significant effect on nutrient composition to EC since two plants have shown different impacts on EC due to changes in nutrients. While nutrients with N-P-K ratio 5-5-5 worked well for the dwarf traditional tomato species, the cherry tomato had shown a higher value with 2-1-6 application in the system over time. Application of the 2-1-6 nutrient solution led to a decline in EC in DT plants, attributed to the increased presence of potassium relative to nitrogen and phosphorus. Perhaps this heightened potassium availability facilitated effective absorption due to its plant mobility and rapid uptake traits [74,75], contributing to reduced collective ion concentration and consequently yielding lower electrical conductivity (EC) values [76].
In addition to EC, pH level in the water is a crucial growth factor for hydroponic plants. A significant change in pH may lead to nutrient imbalance, and as a result, a plant may exhibit signs of toxicity or deficiency. A low pH level in water denotes acidity, which can hinder nutrient uptake and plant growth. In contrast, the high pH level causes vital nutrient lockouts and is inaccessible to plants due to the high alkalinity in the water [77]. Statistical analysis also showed a significant effect of pH with EC and nutrients which indicates that the pH level in the system depends on EC and nutrient composition. This result also agrees with Rakocy [78] that stated that hydroponic plants’ preferred pH levels are 5.8 to 6.2. Among the two nutrients in two plants, the 5-5-5 nutrient showed better performance in keeping pH less than 7.5, although it decreased the pH level lower than 5 for DT plants.
The optimal nutrient solution temperature is below 22 °C for providing sufficient dissolved oxygen to tomato plants. A temperature higher than 22 °C increases the vegetative growth of tomato plants, therefore reducing fruitification [17,79]. The water temperature in the system varied from 15 °C to 22 °C. MANOVA analysis indicates that the effect of nutrient composition and plants is significant to water temperature. Among the nutrients, 5-5-5 nutrient showed decreasing temperature trend for both plants, although the water temperature in the solution was lower than 22 °C for all N-P-K ratio nutrients. The system shows better performance, i.e., temperature below 22 °C, pH less than 7.5, high EC above 1500 μS/cm (only for DT), with 5-5-5 ratio nutrient solution for tomato growth in this study.

5. Conclusions and Future Work

This study has successfully implemented the designed autonomous indoor farming platform (AIFP) using a hydroponics system and digitally monitored the physiological factors (EC, pH, WT) associated with different nutrient inputs (N-P-K ratios) for tomato growth to promote the controlled environment agriculture (CEA). The designed AIFP system shows deviation in EC, pH, and WT from the optimum range which affects plant growth. It has been found that SD models are useful tools to convince growers to optimize their system performance by evaluating environmental factors and physical parameters in indoor farming settings. Therefore, it is anticipated that employing SD for CEA will also contribute to diversified indoor crop production portfolios by exploring a wide range of opportunities including, but not limited to, economic analysis, market strategies, supply chain, life cycle analysis, and risk management in the future.
Further, the proposed AISF system could be an effective option to develop resilient, sustainable, and flexible small-scale food production under abrupt climate conditions. However, more research is required to further comprehend the practical implementation of the SD model in large scales for commercial operations. This study is also limited to the early stages of tomato production for model parameterization and calibration. Therefore, rigorous model calibration and validation processes are also recommended to solidify successful SD modeling in the context of indoor farming. The integration of robotics, the digital twin, artificial intelligence (AI), and machine learning (ML) techniques into the proposed AIFP will be another avenue to advance indoor farming literacy in the years to come. Lastly, employing renewable energy sources such as solar power, green hydrogen, and geothermal energy in the SD framework will lead to more environmentally friendly and sustainable indoor crop production in either urban, remote, rural, or even space farming.

Author Contributions

Brainstorming research idea, J.B., Z.S. and J.H.R.; data collection and analysis, Z.S.; system setup and operation, J.B.; manuscript review and supervising, J.H.R. All authors have read and agreed to the published version of the manuscript.

Funding

This work was carried out with the support of “Cooperative Research Program for Agriculture Science and Technology Development (Project No. PJ015553)”, Rural Development Administration (RDA), Republic of Korea. J.H.R. is also supported partially by the National of Food and Agriculture, United States Department of Agriculture (USDA), under ID01654. Any opinions, findings, conclusions, or recommendations expressed in this publication are those of the authors and do not necessarily reflect the views of RDA or USDA.

Data Availability Statement

Lab data is not digitized yet. But, it can be available upon request.

Conflicts of Interest

The authors declare no conflict of interest.

References

  1. Azunre, G.A.; Amponsah, O.; Peprah, C.; Takyi, S.A.; Braimah, I. A review of the role of urban agriculture in the sustainable city discourse. Cities 2019, 93, 104–119. [Google Scholar] [CrossRef]
  2. Hodgson, K.; Campbell, M.C.; Bailkey, M. Urban Agriculture: Growing Healthy, Sustainable Places; American Planning Association: Chicago, IL, USA, 2011. [Google Scholar]
  3. Lin, B.B.; Philpott, S.M.; Jha, S. The future of urban agriculture and biodiversity-ecosystem services: Challenges and next steps. Basic Appl. Ecol. 2015, 16, 189–201. [Google Scholar] [CrossRef]
  4. Langemeyer, J.; Madrid-Lopez, C.; Beltran, A.M.; Mendez, G.V. Urban agriculture—A necessary pathway towards urban resilience and global sustainability? Landsc. Urban Plan. 2021, 210, 104055. [Google Scholar] [CrossRef]
  5. McDougall, R.; Kristiansen, P.; Rader, R. Small-scale urban agriculture results in high yields but requires judicious management of inputs to achieve sustainability. Proc. Natl. Acad. Sci. USA 2019, 116, 129–134. [Google Scholar] [CrossRef]
  6. Subah, Z.; Bala, S.K.; Ryu, J.H. Assessing Urban Flooding Extent of the Baunia Khal Watershed in Dhaka, Bangladesh. Water 2023, 15, 1183. [Google Scholar] [CrossRef]
  7. Nations, U. World Urbanization Prospects: The 2014 Revision, Highlights. Department of Economic and Social Affairs; Population Division, United Nations: New York, NY, USA, 2014; Volume 32. [Google Scholar]
  8. Steel, C. Chapter 2 Sitopia–harnessing the power of food. In Sustainable Food Planning: Evolving Theory and Practice; Wageningen Academic Publishers: Cambridge, MA, USA, 2012; p. 188. [Google Scholar]
  9. Thomaier, S.; Specht, K.; Henckel, D.; Dierich, A.; Siebert, R.; Freisinger, U.B.; Sawicka, M. Farming in and on urban buildings: Present practice and specific novelties of Zero-Acreage Farming (ZFarming). Renew. Agric. Food Syst. 2015, 30, 43–54. [Google Scholar] [CrossRef]
  10. Kissinger, G.; Herold, M.; De Sy, V. Drivers of Deforestation and Forest Degradation: A Synthesis Report for REDD+ Policymakers; Lexeme Consulting: Vancouver, BC, Canada, 2012. [Google Scholar]
  11. Change, C. Intergovernmental Panel on Climate Change; World Meteorological Organization: Geneva, Switzerland, 2007; Volume 52. [Google Scholar]
  12. Subah, Z.; Rashid, M.; Rashid, H. Impacts of Salinity Intrusion on Nitrogen Fixing Microbial Community of Sesbania bispinosa from Three Different Regions of Bangladesh. In Proceedings of the 5th International Conference on Natural Sciences and Technology (ICNST’18), Chittagong, Bangladesh, 30–31 March 2018; pp. 30–31. [Google Scholar]
  13. Joyce, A.; Goddek, S.; Kotzen, B.; Wuertz, S. Aquaponics: Closing the cycle on limited water, land and nutrient resources. Aquaponics Food Prod. Syst. 2019, 19, 19–34. [Google Scholar]
  14. Peterson, H.H.; Taylor, M.R.; Baudouin, Q. Preferences of locavores favoring community supported agriculture in the United States and France. Ecol. Econ. 2015, 119, 64–73. [Google Scholar] [CrossRef]
  15. Opitz, I.; Berges, R.; Piorr, A.; Krikser, T. Contributing to food security in urban areas: Differences between urban agriculture and peri-urban agriculture in the Global North. Agric. Hum. Values 2016, 33, 341–358. [Google Scholar] [CrossRef]
  16. Benke, K.; Tomkins, B. Future food-production systems: Vertical farming and controlled-environment agriculture. Sustain. Sci. Pract. Policy 2017, 13, 13–26. [Google Scholar] [CrossRef]
  17. Gómez, C.; Currey, C.J.; Dickson, R.W.; Kim, H.-J.; Hernández, R.; Sabeh, N.C.; Raudales, R.E.; Brumfield, R.G.; Laury-Shaw, A.; Wilke, A.K. Controlled environment food production for urban agriculture. HortScience 2019, 54, 1448–1458. [Google Scholar] [CrossRef]
  18. Astee, L.Y.; Kishnani, N.T. Building integrated agriculture: Utilising rooftops for sustainable food crop cultivation in Singapore. J. Green Build. 2010, 5, 105–113. [Google Scholar] [CrossRef]
  19. Weber, C.L.; Matthews, H.S. Food-Miles and the Relative Climate Impacts of Food Choices in the United States; ACS Publications: Washington, DC, USA, 2008. [Google Scholar]
  20. Orozco, L.; Rico-Romero, L.; Escartin, E.F. Microbiological profile of greenhouses in a farm producing hydroponic tomatoes. J. Food Prot. 2008, 71, 60–65. [Google Scholar] [CrossRef]
  21. Rogers, M.A. Organic vegetable crop production in controlled environments using soilless media. HortTechnology 2017, 27, 166–170. [Google Scholar] [CrossRef]
  22. Schnitzler, W. Urban hydroponics for green and clean cities and for food security. In Proceedings of the International Symposium on Soilless Cultivation 1004, Shanghai, China, 22–25 May 2012; pp. 13–26. [Google Scholar]
  23. Asao, T. Hydroponics: A Standard Methodology for Plant Biological Researches; BoD–Books on Demand: Norderstedt, Germany, 2012. [Google Scholar]
  24. Jansen, G.; Cila, N.; Kanis, M.; Slaats, Y. Attitudes towards vertical farming at home: A user study. In Proceedings of the 2016 CHI Conference Extended Abstracts on Human Factors in Computing Systems, San Jose, CA, USA, 7–12 May 2016; pp. 3091–3098. [Google Scholar]
  25. Eaves, J.; Eaves, S. Comparing the Profitability of a Greenhouse to a Vertical Farm in Quebec. Can. J. Agric. Econ. Rev. Can. D’agroeconomie 2018, 66, 43–54. [Google Scholar] [CrossRef]
  26. Research, G.V. Vertical Farming Market Analysis By Structure, By Component (Hardware, Software, Services), By Growing Mechanism (Aeroponics, Hydroponics), By Crop Category (Fruits Vegetables, & Herbs, Flowers & Ornamentals) And Segment Forecasts, 2023–2030; GVR-1-68038-797-1; Grand View Research: San Francisco, CA, USA, 2022; p. 120. [Google Scholar]
  27. Resh, H.M. Hydroponic Food Production: A Definitive Guidebook for the Advanced Home Gardener and the Commercial Hydroponic Grower; CRC Press: Boca Raton, FL, USA, 2022. [Google Scholar]
  28. Baskins, S.; Bond, J.; Minor, T. Unpacking the Growth in Per Capita Availability of Fresh Market Tomatoes; USDA: Washington, DC, USA, 2019. [Google Scholar]
  29. Maureira, F.; Rajagopalan, K.; Stöckle, C.O. Evaluating tomato production in open-field and high-tech greenhouse systems. J. Clean. Prod. 2022, 337, 130459. [Google Scholar] [CrossRef]
  30. Watabe, T.; Nakano, Y.; Ahn, D.-H. The Effect of Electrical Conductivity on Fruit Growth Pattern in Hydroponically Grown Tomatoes. Crops 2022, 2, 323–335. [Google Scholar] [CrossRef]
  31. Lu, T.; Yu, H.; Wang, T.; Zhang, T.; Shi, C.; Jiang, W. Influence of the electrical conductivity of the nutrient solution in different phenological stages on the growth and yield of cherry tomato. Horticulturae 2022, 8, 378. [Google Scholar] [CrossRef]
  32. Elijah, O.; Rahman, T.A.; Orikumhi, I.; Leow, C.Y.; Hindia, M.N. An overview of Internet of Things (IoT) and data analytics in agriculture: Benefits and challenges. IEEE Internet Things J. 2018, 5, 3758–3773. [Google Scholar] [CrossRef]
  33. Mehra, M.; Saxena, S.; Sankaranarayanan, S.; Tom, R.J.; Veeramanikandan, M. IoT based hydroponics system using Deep Neural Networks. Comput. Electron. Agric. 2018, 155, 473–486. [Google Scholar] [CrossRef]
  34. Halgamuge, M.N.; Bojovschi, A.; Fisher, P.M.; Le, T.C.; Adeloju, S.; Murphy, S. Internet of Things and autonomous control for vertical cultivation walls towards smart food growing: A review. Urban For. Urban Green. 2021, 61, 127094. [Google Scholar] [CrossRef]
  35. Fenitha, J.R.; Mirudhula, S.; Subhashini, K.; Sriharidha, R. Hydroponic Nutrient Solution for Optimized Greenhouse with IOT. In Proceedings of the 2022 International Conference on Advanced Computing Technologies and Applications (ICACTA), Coimbatore, India, 4–5 March 2022; pp. 1–5. [Google Scholar]
  36. Bhargava, Y.V.; Chittoor, P.K.; Bharatiraja, C. IoT Powered Smart Hydroponic System for Autonomous Irrigation and Crop Monitoring. ECS Trans. 2022, 107, 11937. [Google Scholar] [CrossRef]
  37. Moreno, M.C.; Suarez, O.J.; Garcia, A.P. IoT-based Automated Greenhouse for Deep Water Culture Hydroponic System. In Proceedings of the 2021 2nd Sustainable Cities Latin America Conference (SCLA), Virtual, 25–27 August 2021; pp. 1–6. [Google Scholar]
  38. Shamshiri, R.; Kalantari, F.; Ting, K.; Thorp, K.R.; Hameed, I.A.; Weltzien, C.; Ahmad, D.; Shad, Z.M. Advances In Greenhouse Automation and Controlled Environment Agriculture: A Transition to Plant Factories and Urban Agriculture; UTNU Open: Trondheim, Norway, 2018. [Google Scholar]
  39. Winz, I.; Brierley, G.; Trowsdale, S. The use of system dynamics simulation in water resources management. Water Resour. Manag. 2009, 23, 1301–1323. [Google Scholar] [CrossRef]
  40. Ryu, J.H.; Contor, B.; Johnson, G.; Allen, R.; Tracy, J. System Dynamics to Sustainable Water Resources Management in the Eastern Snake Plain Aquifer Under Water Supply Uncertainty 1. JAWRA J. Am. Water Resour. Assoc. 2012, 48, 1204–1220. [Google Scholar] [CrossRef]
  41. Peck, S. Group model building: Facilitating team learning using system dynamics. J. Oper. Res. Soc. 1998, 49, 766–767. [Google Scholar] [CrossRef]
  42. Simonovic, S.P.; Fahmy, H. A new modeling approach for water resources policy analysis. Water Resour. Res. 1999, 35, 295–304. [Google Scholar] [CrossRef]
  43. Mandinach, E.B.; Cline, H.F. Classroom Dynamics: Implementing a Technology-Based Learning Environment; Routledge: London, UK, 2013. [Google Scholar]
  44. An, W.; Wu, D.; Ci, S.; Luo, H.; Adamchuk, V.; Xu, Z. Agriculture cyber-physical systems. In Cyber-Physical Systems; Elsevier: Amsterdam, The Netherlands, 2017; pp. 399–417. [Google Scholar]
  45. Shamshiri, R.R.; Hameed, I.A.; Thorp, K.R.; Balasundram, S.K.; Shafian, S.; Fatemieh, M.; Sultan, M.; Mahns, B.; Samiei, S. Greenhouse automation using wireless sensors and IoT instruments integrated with artificial intelligence. In Next-Generation Greenhouses for Food Security; IntechOpen: London, UK, 2021. [Google Scholar]
  46. Subahi, A.F.; Bouazza, K.E. An intelligent IoT-based system design for controlling and monitoring greenhouse temperature. IEEE Access 2020, 8, 125488–125500. [Google Scholar] [CrossRef]
  47. Soheli, S.J.; Jahan, N.; Hossain, M.B.; Adhikary, A.; Khan, A.R.; Wahiduzzaman, M. Smart greenhouse monitoring system using internet of things and artificial intelligence. Wirel. Pers. Commun. 2022, 124, 3603–3634. [Google Scholar] [CrossRef]
  48. Enokela, J.A.; Othoigbe, T.O. An automated greenhouse control system using Arduino prototyping platform. Aust. J. Eng. Res. 2015, 1, 64–73. [Google Scholar]
  49. Subeesh, A.; Mehta, C. Automation and digitization of agriculture using artificial intelligence and internet of things. Artif. Intell. Agric. 2021, 5, 278–291. [Google Scholar] [CrossRef]
  50. Gorjian, S.; Ebadi, H.; Trommsdorff, M.; Sharon, H.; Demant, M.; Schindele, S. The advent of modern solar-powered electric agricultural machinery: A solution for sustainable farm operations. J. Clean. Prod. 2021, 292, 126030. [Google Scholar] [CrossRef]
  51. Zamora-Izquierdo, M.A.; Santa, J.; Martínez, J.A.; Martínez, V.; Skarmeta, A.F. Smart farming IoT platform based on edge and cloud computing. Biosyst. Eng. 2019, 177, 4–17. [Google Scholar] [CrossRef]
  52. Hirsch, G.B.; Levine, R.; Miller, R.L. Using system dynamics modeling to understand the impact of social change initiatives. Am. J. Community Psychol. 2007, 39, 239–253. [Google Scholar] [CrossRef]
  53. Balali, H.; Viaggi, D. Applying a system dynamics approach for modeling groundwater dynamics to depletion under different economical and climate change scenarios. Water 2015, 7, 5258–5271. [Google Scholar] [CrossRef]
  54. Bowles, D.E.; Gardiner, L.R. Supporting process improvements with process mapping and system dynamics. Int. J. Product. Perform. Manag. 2018, 67, 1255–1270. [Google Scholar] [CrossRef]
  55. Verstraete, W.; Philips, S. Nitrification–denitrification processes and technologies in new contexts. In Nitrogen, the Confer-Ns; Elsevier: Amsterdam, The Netherlands, 1998; pp. 717–726. [Google Scholar]
  56. Allaire, J. RStudio: Integrated development environment for R; RStudio: Boston, MA, USA, 2012. [Google Scholar]
  57. Kronthaler, F.; Zöllner, S. Data Analysis with RStudio; Springer: Berlin/Heidelberg, Germany, 2021. [Google Scholar]
  58. Van der Loo, M.P. Learning RStudio for R Statistical Computing; Packt Publishing Ltd.: Birmingham, UK, 2012. [Google Scholar]
  59. Verzani, J. Getting Started with RStudio; O’Reilly Media, Inc.: Sebastopol, CA, USA, 2011. [Google Scholar]
  60. Armstrong, R.A. Recommendations for analysis of repeated-measures designs: Testing and correcting for sphericity and use of manova and mixed model analysis. Ophthalmic Physiol. Opt. 2017, 37, 585–593. [Google Scholar] [CrossRef]
  61. Friedrich, S.; Konietschke, F.; Pauly, M. Analysis of multivariate data and repeated measures designs with the R package MANOVA. RM. arXiv 2018, arXiv:1801.08002. [Google Scholar]
  62. Mood, D.P.; Morrow, J.R.; McQueen, M.B. Multivariate ANOVA (MANOVA). In Introduction to Statistics in Human Performance; Routledge: London, UK, 2019; pp. 293–310. [Google Scholar]
  63. O’Brien, R.G.; Kaiser, M.K. MANOVA method for analyzing repeated measures designs: An extensive primer. Psychol. Bull. 1985, 97, 316. [Google Scholar] [CrossRef] [PubMed]
  64. Tavares, L.R.; Costa, T.S.; de Melo, K.B.; Silva, J.L.d.S.; Villalva, M.G. Statistical analysis ANOVA and MANOVA of irradiation and temperature database for photovoltaic systems. In Proceedings of the 2020 IEEE International Conference on Industrial Technology (ICIT), Buenos Aires, Argentina, 26–28 August 2020; pp. 554–559. [Google Scholar]
  65. Weerahandi, S. Generalized Inference in Repeated Measures: Exact Methods in Manova and Mixed Models; John Wiley & Sons: Hoboken, NJ, USA, 2004; Volume 500. [Google Scholar]
  66. Krzysko, M.; Smiałowski, T.; Wołynski, W. Analysis of multivariate repeated measures data using a manova model and principal components. Biom. Lett. 2014, 51, 103–114. [Google Scholar] [CrossRef]
  67. Ling, T.-Y.; Chiang, Y.-C. Well-being, health and urban coherence-advancing vertical greening approach toward resilience: A design practice consideration. J. Clean. Prod. 2018, 182, 187–197. [Google Scholar] [CrossRef]
  68. Cliff, M.A.; Li, J.B.; Toivonen, P.M.; Ehret, D.L. Effects of nutrient solution electrical conductivity on the compositional and sensory characteristics of greenhouse tomato fruit. Postharvest Biol. Technol. 2012, 74, 132–140. [Google Scholar] [CrossRef]
  69. Martínez-Damian, M.; Rodríguez-Pérez, J.; Cruz-Alvarez, O.; Colinas-León, M. Yield and physicochemical quality in experimental lines of Solanum lycopersicum var. cerasiforme cultivated with different levels of electrical conductivity. Chil. J. Agric. Anim. Sci. Ex Agro-Cienc. 2018, 34, 152–164. [Google Scholar]
  70. Patil, S.; Kadam, U.; Mane, M.; Mahale, D.; Dhekale, J. Hydroponic growth media (substrate): A review. Int. Res. J. Pure Appl. Chem. 2020, 21, 106–113. [Google Scholar] [CrossRef]
  71. Suhardiyanto, H.; Arif, C.; Setiawan, B.I. Optimization of EC values of nutrient solution for tomato fruits quality in hydroponics system using artificial neural network and genetic algorithms. ITB J. Sci. 2009, 41, 38–49. [Google Scholar] [CrossRef]
  72. Sharma, N.; Acharya, S.; Kumar, K.; Singh, N.; Chaurasia, O.P. Hydroponics as an advanced technique for vegetable production: An overview. J. Soil Water Conserv. 2018, 17, 364–371. [Google Scholar] [CrossRef]
  73. Suhandy, D. The effect of EC levels of nutrient solution on the growth, yield, and quality of tomatoes (Solanum lycopersicum) under the hydroponic system. J. Agric. Eng. Biotechnol. (JAEB) 2014, 2, 7–12. [Google Scholar]
  74. White, P.J.; Karley, A.J. Potassium. In Cell Biology of Metals and Nutrients; Springer: Berlin/Heidelberg, Germany, 2010; pp. 199–224. [Google Scholar]
  75. Rengel, Z.; Damon, P.M. Crops and genotypes differ in efficiency of potassium uptake and use. Physiol. Plant. 2008, 133, 624–636. [Google Scholar] [CrossRef] [PubMed]
  76. Almeida, D.P.; Huber, D.J. Apoplastic pH and inorganic ion levels in tomato fruit: A potential means for regulation of cell wall metabolism during ripening. Physiol. Plant. 1999, 105, 506–512. [Google Scholar] [CrossRef]
  77. Borgognone, D.; Colla, G.; Rouphael, Y.; Cardarelli, M.; Rea, E.; Schwarz, D. Effect of nitrogen form and nutrient solution pH on growth and mineral composition of self-grafted and grafted tomatoes. Sci. Hortic. 2013, 149, 61–69. [Google Scholar] [CrossRef]
  78. Rakocy, J.E. Aquaponics—Integrating fish and plant culture. In Aquaculture Production Systems; Wiley-Blackwell: Ames, IA, USA, 2012; pp. 344–386. [Google Scholar]
  79. Trejo-Téllez, L.I.; Gómez-Merino, F.C. Nutrient solutions for hydroponic systems. In Hydroponics-a Standard Methodology for Plant Biological Researches; InTech: Rijeka, Croatia, 2012; pp. 1–22. [Google Scholar]
Figure 1. Overview of the AIFP in CEA settings.
Horticulturae 09 01318 g001
Figure 2. A schematic of SD model used in AIFP.
Horticulturae 09 01318 g002
Figure 3. A diagram of (a) EC, (b) pH, and (c) WT dynamics in the autonomous indoor farming platform (AIFP).
Horticulturae 09 01318 g003
Figure 4. Boxplot of pH between two different plants (CT and DT) and nutrient solutions (N-P-K ratios; 2-1-6 and 5-5-5).
Horticulturae 09 01318 g004
Figure 5. Plants’ response to nutrients on EC values.
Horticulturae 09 01318 g005
Figure 6. Boxplot of water temperature according to plant and nutrient.
Horticulturae 09 01318 g006
Figure 7. Control panel for managing the physiological parameters of plant growth.
Horticulturae 09 01318 g007
Table 1. Nutrient composition in the system.
Nutrient Sl No.N-P-K RatioOther Nutrients and ConcentrationsNutrient Amount (mL) in 100 LNutrients in 1 LFrequency of Nutrient ApplicationWater Addition in System (L)
12-1-6Mg (0.5%)3963.96Weekly72
25-5-5Mg (1.5%), S (1%), Ca (5%), B (0.01%), Co (0.0005%), Fe (0.1%), Cu (0.01%), Mn (0.05%), Mo (0.0008%), Zn (0.015%)3963.96Weekly68
Table 2. MANOVA table (Type 3 tests, S-method) in response to pH.
Model: pH ~ (1 | Day) + Nutrient + ‘Water Temp’ + EC + Plant
EffectdfFp.Value
Nutrient1, 72.8817.85 ***<0.001
‘Water Temp’1, 81.241.520.222
EC1, 76.330.95 ***<0.001
Plant1, 74.195.9 *0.018
Signif. codes: 0’ *** 0.001 ** 0.01 *.
Table 3. MANOVA table (Type 3 tests, S-method) in response to EC.
Model: EC ~ (1 | Day) + Nutrient + ‘Water Temp’ + pH + Plant
EffectdfFp.Value
Nutrient1, 72.720.870.355
‘Water Temp’1, 81.830.170.680
pH1, 77.2930.45 ***<0.001
Plant1, 74.071.870.176
Signif. codes: 0’ *** 0.001 ** 0.01 *.
Table 4. MANOVA table (Type 3 tests, S-method) in response to water temperature.
Model: ‘Water Temp’ ~ (1 | Day) + Nutrient + pH + EC + Plant
EffectdfFp.Value
Nutrient1, 70.9218.63 ***<0.001
pH1, 81.521.430.234
EC1, 81.570.250.616
Plant1, 69.566.6 ***<0.001
Signif. codes: 0 *** 0.001 ** 0.01 *.
Disclaimer/Publisher’s Note: The statements, opinions and data contained in all publications are solely those of the individual author(s) and contributor(s) and not of MDPI and/or the editor(s). MDPI and/or the editor(s) disclaim responsibility for any injury to people or property resulting from any ideas, methods, instructions or products referred to in the content.

