Article

Pulsed Electric Field as a Novel Technology for Fresh Barhi Date Shelf-Life Extension: Process Optimization Using Response Surface Methodology

by
Mahmoud Younis
1,2,*,
Isam A. Mohamed Ahmed
3,
Khaled A. Ahmed
1,2,
Hany M. Yehia
2,4,
Diaeldin O. Abdelkarim
1,
Adil Fickak
5,
Assem I. Zein El-Abedein
1,
Abdulla Alhamdan
1,5 and
Ahmed Elfeky
5
1
Chair of Dates Industry & Technology, King Saud University, Riyadh 11451, Saudi Arabia
2
Agricultural Research Centre, Agricultural Engineering Research Institute (AEnRI), Giza 12619, Egypt
3
Department of Food Science and Nutrition, College of Food and Agricultural Sciences, King Saud University, Riyadh 11451, Saudi Arabia
4
Department of Food Science and Nutrition, College of Home Economics, Helwan University, Cairo 11611, Egypt
5
Department of Agricultural Engineering, College of Food and Agricultural Sciences, King Saud University, Riyadh 11451, Saudi Arabia
*
Author to whom correspondence should be addressed.
Horticulturae 2023, 9(2), 155; https://doi.org/10.3390/horticulturae9020155
Submission received: 30 December 2022 / Revised: 23 January 2023 / Accepted: 24 January 2023 / Published: 26 January 2023

Abstract

:
Fresh dates of the Barhi cultivar at the Khalal maturity stage are well known for their pleasant taste, crispy texture, and bright yellow color. One of the primary technical challenges is preserving the initial high-quality fresh Khalal Barhi dates and extending their shelf life for the longest possible period after harvesting and during the marketing process. Resolving this problem would permit the export of high-quality fresh Saudi dates to international markets. Therefore, the main aim of this study is to evaluate the feasibility of utilizing a pulsed electric field as a novel non-thermal postharvest processing technology for preserving the nutritional, microbiological, and physical quality of Barhi dates during storage at different temperatures and durations. To accomplish this goal, a five-factor mixed-level central composite rotating design (CCRD) with a response surface methodology (RSM) model was used to define the best PEF processing conditions and subsequent storage environments. The influence of independent factors, PEF intensity (10, 20, 30, and 40 kV/cm), PEF exposure time (40, 80, 120, and 160 ms), PEF numbers (50, 100, 150, and 200 pulses), storage temperature (1 °C, 5 °C, 15 °C, and 25 °C), and storage time (1 day, 6 days, 11 days, 16 days, and 21 days), on the total soluble solids, firmness, total color changes, total viable count, total phenolic content, DPPH antiradical activity, fructose, and glucose were assessed. The results indicated the optimal conditions of PEF treatment and subsequently storage conditions for conserving the quality and elongating the storability of fresh Barhi dates were: 10.3 kV/cm PEF intensity; 46.73 ms PEF duration; number of PEF, is 169.9 pulses; 18.7 °C storage temperature; and 21 days’ storage time. At the aforementioned optimal conditions, the values of total soluble solids (TSS), firmness, ΔE, total viable count (TVC), total phenolic content (TPC), DPPH antiradical activity, glucose, and fructose were 41.44%, 62.47 newton, 0.1, 0.098 log CFU/g, 1.29 mg GAE/g, 65.95%, 3.45, and 3.44, respectively. These values were comparable to the predicted values (Desirability value = 1), indicating that the applied RSM models were ideal for optimizing the PEF and storage conditions for preserving the quality and prolonging the fresh Barhi dates’ shelf life. Overall, the ideal PEF treatment and storage conditions for sustaining the quality characteristics of Barhi dates during an extended storage time were identified in this study.

1. Introduction

Barhi date (Phoenix dactylifera L. cv. Barhi) fruits are popular in various Middle Eastern and North African countries. Barhi date fruits are preferably consumed and sold at the Khalal maturing stage [1,2]. This stage is one of the date fruits’ five ripening stages (Hababouk, Kimri, Khalal, Rutab, and Tamar) (Figure 1) [3]. At this stage, the Barhi date fruits contain high moisture content, high water activity, and enough sugars; accordingly, the fruits are perishable to decay [1,4]. In addition, the Khalal ripeness phase is short, and the fruits convert rapidly to Rutab. At this point, the fruits become softer with brown color and contain higher levels of total soluble solids and reducing sugars [5]. The marketing value and consumer preference for Barhi dates are significantly reduced by the rapid conversion of the fruits to the Rutab stage [6]. Conserving the quality of Barhi dates during postharvest processing is highly important from both producers’ and consumers’ outlooks [1]. Consequently, the research focuses on applying novel postharvest processing techniques to elongate the Barhi dates’ shelf life. In this regard, several chemical and physical postharvest processing methods, including chemical preservatives [7,8], low-temperature storage [6,9], passive and active packaging [10,11,12], edible coating [13,14], and emerging methods namely infrared [1], ultrasound [15], and ultraviolet [4], were found to elongate the shelf life of Barhi dates.
Response surface methodology (RSM) is a powerful multivariate statistical and mathematical approach frequently used to model and optimize various food systems’ processes. It is rapid and provides adequate information on various independent factors and their effects on response [16,17]. The RSM technique was developed to overcome the limitation of the classical one-factor optimization process, which is time-consuming and needs more information [17]. Therefore, this technique was considered the best choice for optimizing the processing conditions in the food system [16]. In this regard, RSM has been applied to optimize the conditions for the extraction of the bioactive compound from plant sources [17,18] and for preserving the quality of various types of fruits and vegetables during postharvest treatments [19].
Pulsed electric field (PEF) is a powerful non-thermal technology with great potential to maintain quality attributes and extend the shelf life of fresh foods [20]. In this technique, high voltage electric pulses are applied for a short time (microseconds), resulting in electro-permeabilization of the content of the cellular membrane, leading to the transfer of intracellular components and thus inactive microorganisms, without significant effects on the other food constituents [21]. However, this innovative technology has some limitations, such as unavoidable chemical reactions leading to electrodes’ fouling and corrosion, migration of electrode elements, and chemical modifications of food constituents. Consequently, it may influence the consumer acceptability, regulatory aspects, commercialization, and wide applications of this technology in food processing [22]. Despite such limitations, PEF has been applied as a postharvest processing method for various fruits and vegetables and has been found to improve storage stability without significant influence on the products’ physicochemical, nutritional, and sensorial quality attributes [20,21]. However, the application of this valuable technology in date palm fruit processing is scarce [23,24,25,26], and in these studies, semi-solid and solid fully mature date fruits were used. Utilization of PEF treatment for the preservation of Barhi dates still needed to be performed; therefore, this study attempted to optimize the PEF and storage conditions for conserving the physicochemical and nutritional quality characteristics of Barhi dates at that harvested at the Khalal ripeness stage.

2. Materials and Methods

2.1. Materials

Barhi dates at the Khalal maturity phase were harvested from farms in Ha’il and Al-Qasim districts in northern Saudi Arabia Kingdom (KSA) during the 2021 harvest season. Soon after harvesting, the dates were transferred in temperature (4 °C)-controlled trucks to the Laboratory of Date Processing Technologies, College of Food and Agriculture Sciences, King Saud University, Riyadh, KSA. Upon arrival at the laboratory, the dates with similar shapes, sizes, colors, and maturity stages were sorted, subjected to dust removal with compressed air, and then used for pulsed electric (PEF) field treatment and the following storage conditions.

2.2. PEF Treatment

PEF treatment of Barhi dates was performed using a PEF generator with a PEF transformer and treatment chamber, model type—PEF 40 KV (SUREVIEW INSTRUMENTS, Milap Nager, MIDC Dombivali East, Dist-Thane, Maharashtra, 421203-INDIA). A total of 192 kg of Barhi dates were distributed into 3 kg lots, and each lot was then placed in the PEF treatment chamber. After firmly closing the chamber, the samples were PEF treated at intensities of 10, 20, 30, and 40 kV/cm for 40, 80, 120, and 160 μs PEF exposure time and pluses numbers of 50, 100, 150, and 200 pulses. The samples were then stored in perforated (6 holes, 8 mm diameter) high-density polystyrene plastic containers (16 × 11× 8 cm, 2 mm thickness) at 1, 5, 15, and 25 °C for 1, 6, 11, 16, and 21 days. The samples were taken and analyzed at each storage interval for physicochemical quality attributes.

2.3. Experimental Design

For the PEF treatment and storage conditions optimization, a response surface methodology (RSM) model using central composite design (CCD) in the Design Expert (version 11.0, Stat-Ease Inc., Minneapolis, MN, USA) software was applied. The CCD design was composed of five factors (PEF intensity (X1), PEF exposure time (X2), PEF number of pulses (X3), storage temperature (X4), and storage time (days, X5)) and varied levels (X1 (10, 20, 40, and 40 kV/cm), X2 (40, 80, 120, and 160 μs), X3 (50, 100, 150, and 200 pulses), X4 (1, 5, 15, and 25 °C), and X5 (1, 6, 11, 16, and 21 days)) (Table 1). The design applied thirty runs with six replicates at the central position. The physicochemical properties attributes (Moisture content “MC”, TSS, “∆E”, firmness, “TPC”, DPPH antiradical activity, TVC, yeast enumeration “Y.E.”, glucose, and fructose) were considered as dependent responses, and PEF treatment and storage conditions were considered as independent factors. The results were fitted to a second-order polynomial Equation (1):
Y = β 0 + β i X i + β i i X i 2 + β i j X i   X j
Xi and Xj are the coded independent factors, Y is the response, β0, βi, βjj, and βij are regression coefficients of the intercept, linear, quadratic, and interaction components, respectively. The optimum PEF treatment and storage conditions of Barhi dates were obtained using the F test and analysis of variance (ANOVA), regression, coefficient of determination, and surface plotting analyses.

2.4. Measurement of Mositure Content and Total Soluble Solids (TSS)

The approved technique [27] was applied to determine moisture content and TSS by oven drying, at 105 °C, and ABBA5 refractometer (B.S. instruments, Jena, Germany), respectively.

2.5. Determination of Physical Properties (Firmness and Color) of Barhi Dates

The firmness and color attributes of Barhi dates were assessed by using the method described by Al hamdan et al. [6] with minor alterations. TA-HDi textural analyzer model HD3128 (Stable Micro Systems, Surrey, England) and Hunter Lab-scan XE colorimeter (Hunter Lab, Reston, VA, USA) equipment were utilized in the analysis of firmness and color, respectively. The firmness was measured by compressing Barhi date samples in a cylindrical probe at a rate of 1.5 mm/s until reaching 5 mm depth. The extreme force power required to compress the date samples was used to construct the force–time deformation curves from which the firmness of Barhi dates was calculated. The CIE surface color attributes (L* (lightness), b* (yellowness), and a* (redness)) of Barhi dates were recorded in triplicate after calibrating the colorimeter with a white plate and were then used for calculation of total color change (ΔE) using Equation (2):
Δ E = Δ L 2 + Δ a 2 + Δ b 2        

2.6. Microbial Quality [Total Viable Count (TVC) and Yeast Enumeration (YE) of Barhi Dates]

The official method [27] was used to analyze TVC and Y.E. of Barhi dates. In short, 25 Barhi date fruits were subjected to the removal of pits, the resulting flesh samples (25 g) were added to 0.225 mL of sterilized saline solution (0.85%), and the mixture was homogenized. The homogenate was diluted (10-fold serial dilution) using a sterile saline solution until reaching optimum dilution. At this point, 1 mL of diluted homothety was pour-plated on CM0309 nutritional agar or potato dextrose agar to cultivate TVC and Y.E., respectively. The plates were incubated at 37 °C for 24–48 h for TVC and at 25 °C for 2–5 days for Y.E., and the counts were expressed as log CFU/g samples of triplicate samples.

2.7. Determination of Bioactive Properties of Barhi Dates

The bioactive properties of Barhi dates were assessed by measuring the TPC and DPPH antiradical activity, as described previously [1]. Prior to the analysis of these properties, 2 g Barhi date flesh in 200 mL distilled water was subjected to an ultrasound-assisted extraction method using a Branson 2800 CPX ultrasound (St. Louis, MO, USA) at a frequency of 40 kHz, a temperature of 40 °C, and continuous power of 110 W for 30 min. After that, the samples were filtered using a filter paper, and the resulting filtrates were used to analyze TPC and DPPH antiradical activity using Folin–Ciocalteu (F.C.) reagent and DPPH methanolic solution colorimetric approaches, respectively. After mixing 0.1 mL of the filtrate with 1.0 mL of F.C. solution, the absorbance was recorded at 571 nm for measuring the TPC of Barhi dates with the reference of different concentrations of gallic acids that were treated and analyzed in the same manner. The TPC was calculated from the standard curve equation of gallic acid, and the results specified as mg gallic acid equivalent per g sample. For DPPH antiradical activity, Barhi date extract (0.1 mL) was mixed with 0.2 mL DPPH methanolic solution (250 mM), and the mixture was allowed to react, at room temperature, for 10 min prior to measuring the absorbance at 517 nm, and the DPPH antiradical activity was calculated as follows:
D P P H   a n t i r a c i c a l   a c t i v i t y % = A c o n t r o l A s a m p l e A c o n t r o l

2.8. Determination of Glucose and Fructose

For the analysis of glucose and fructose in Barhi dates, a Shimadzu LC10 AD HPLC system (Shimadzu Corporation, Kyoto, Japan) containing a Supelcosil LC-NH2 column (25 cm 4.6 mm 5 m) and a RID-10A refractive index detector (Shimadzu Corporation, Kyoto, Japan) was used as stated previously [28]. Prior to analysis, the aqueous extract of the Barhi date was prepared by homogenizing 10 g date flesh in 200 mL distilled water, followed by incubation of the homogenate, at 50 °C, for 30 min and then consequent filtration using filter paper (Whatman No.1) and 0.45 μm Millipore membrane (Millipore, Burlington, MA, USA). For analysis, the temperature of the column was set at 30 °C, and then the sample (20 μL) was loaded onto the column. Elution of glucose and fructose was performed with a mixture of 25% water and 75% acetonitrile at a 1 mL/min flow rate. The peaks of glucose and fructose were identified using an external standard of these sugars and quantified by calculating the area under the peaks.

2.9. Statistical Analysis

The data of triplicate samples were statistically analyzed using SPSS software (version 18.0, SPSS Inc., Chicago, IL, USA) for physicochemical quality traits and version 11.0 Design Expert software (Stat-Ease Inc., Minneapolis, MN, USA) for RSM data. Analysis of variance (ANOVA) was used to evaluate the impact of independent factors (PEF intensity, PEF time, PEF pulse numbers, storage temperature and time) on the responses (firmness, TSS, MC, DPPH antiradical activity, TPC, ΔE, TVC, Y.E., glucose, and fructose). Validation of the RSM quadratic model used was achieved by obtaining indicators of adequacy correctness, coefficient variation, coefficient of determination (R2), and adjusted coefficient of determination (adjusted R2). Significance was accepted at probabilities of p < 0.05, p < 0.01, and p < 0.001.

3. Results and Discussion

3.1. Model Fitting

Pulsed electric field (PEF) is a non-thermal processing method with a high potential to inhibit microbe growth and enzyme activity, thereby extending food products’ shelf life and storage stability [20]. However, PEF pulse intensity, the number of pulses, exposure time, and subsequent storage temperature and time influence the efficacy of PEF treatments in preserving the quality attributes of vegetables and fruits. These factors should be optimized to maximize the benefits of using PEF as a postharvest method of fruit processing. This study optimized PEF treatment conditions using the response surface methodology RSM model. The fitting of the applied model was evaluated by measuring the accuracy, adequacy, and coefficient indicators, namely, R2 and adjusted R2, and the results are presented in Table 2. The p-value of the model for all assessed parameters was in the range of 0.049 to 0.0003, suggesting that the model was significant (p < 0.05) to highly significant (p < 0.001) for the measured attributes. Additionally, the p-value for the lack of fit is 0.079 to 1.075, suggesting no significance (p > 0.05) and showing that the used models sufficiently described the experimental data. The coefficient indicators (R2 and adjusted R2) are closely related for all assessed parameters, proving that the applied models are practical and can be applied to optimize the storage of Barhi dates. In addition, the R2 values evaluated attributes are between 0.956 and 0.989, and adjusted R2 values are between 0.924 and 0.969. According to this, >95% of the total variability of the trait data has been considered by the generated quadratic polynomial models using Equation (1). In addition, the values of R2 and adjusted R2 were close to one, indicating highly significant associations between predicted and experimental values of all assessed traits [29]. Models with adequacy precision value greater than 4.0 are considered preferable [30]. This study showed adequacy precision values of 5.704 to 11.747, showing that the model is appropriate and could sufficiently analyze the data. In addition to the coefficient of variation (CV), which measures the accuracy and reproducibility of the model, it is preferable if it is lower than 10% [31]. In this study, CV values of all assessed parameters were less than 10% (1.445–8.460%), showing high accuracy and replicability of experimental data. According to the findings of this study, the RSM models used were adequate and reproducible. They could be effectively applied to optimize the PEF treatment condition and the initial storage conditions of Barhi dates to maintain their quality characteristics during extended storage. Similarly, our previous reports using similar quadratic models indicated that the applied models were adequate, reproducible, and could accurately optimize the infrared, ultrasound, and ultraviolet treatment conditions of Barhi dates [1,4].

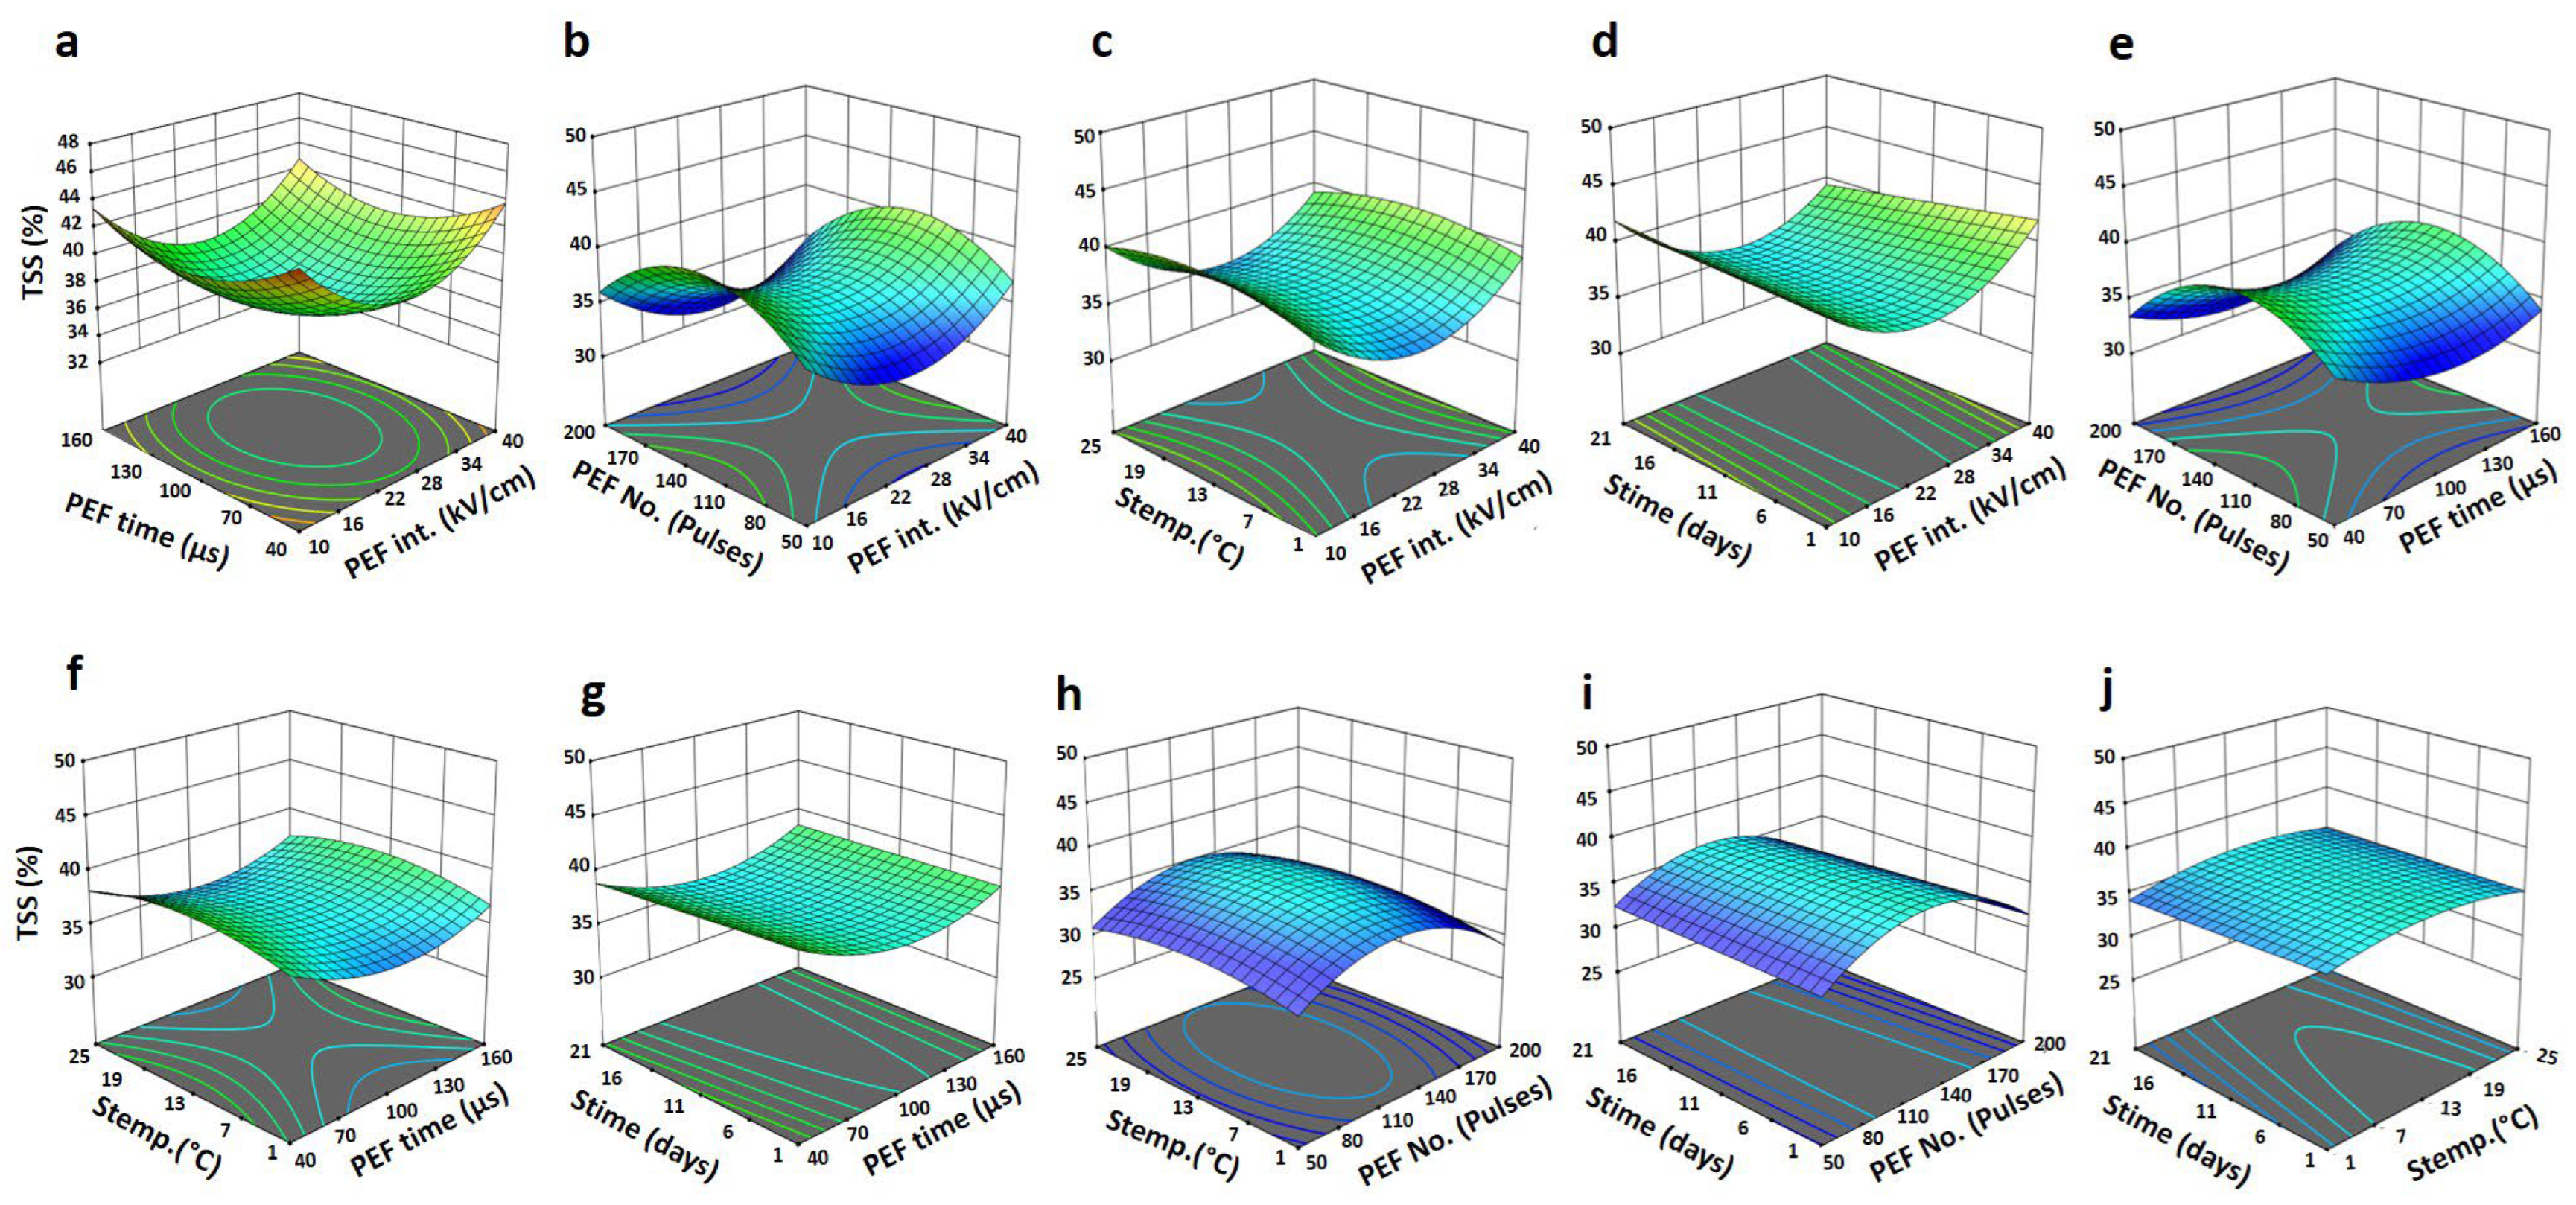
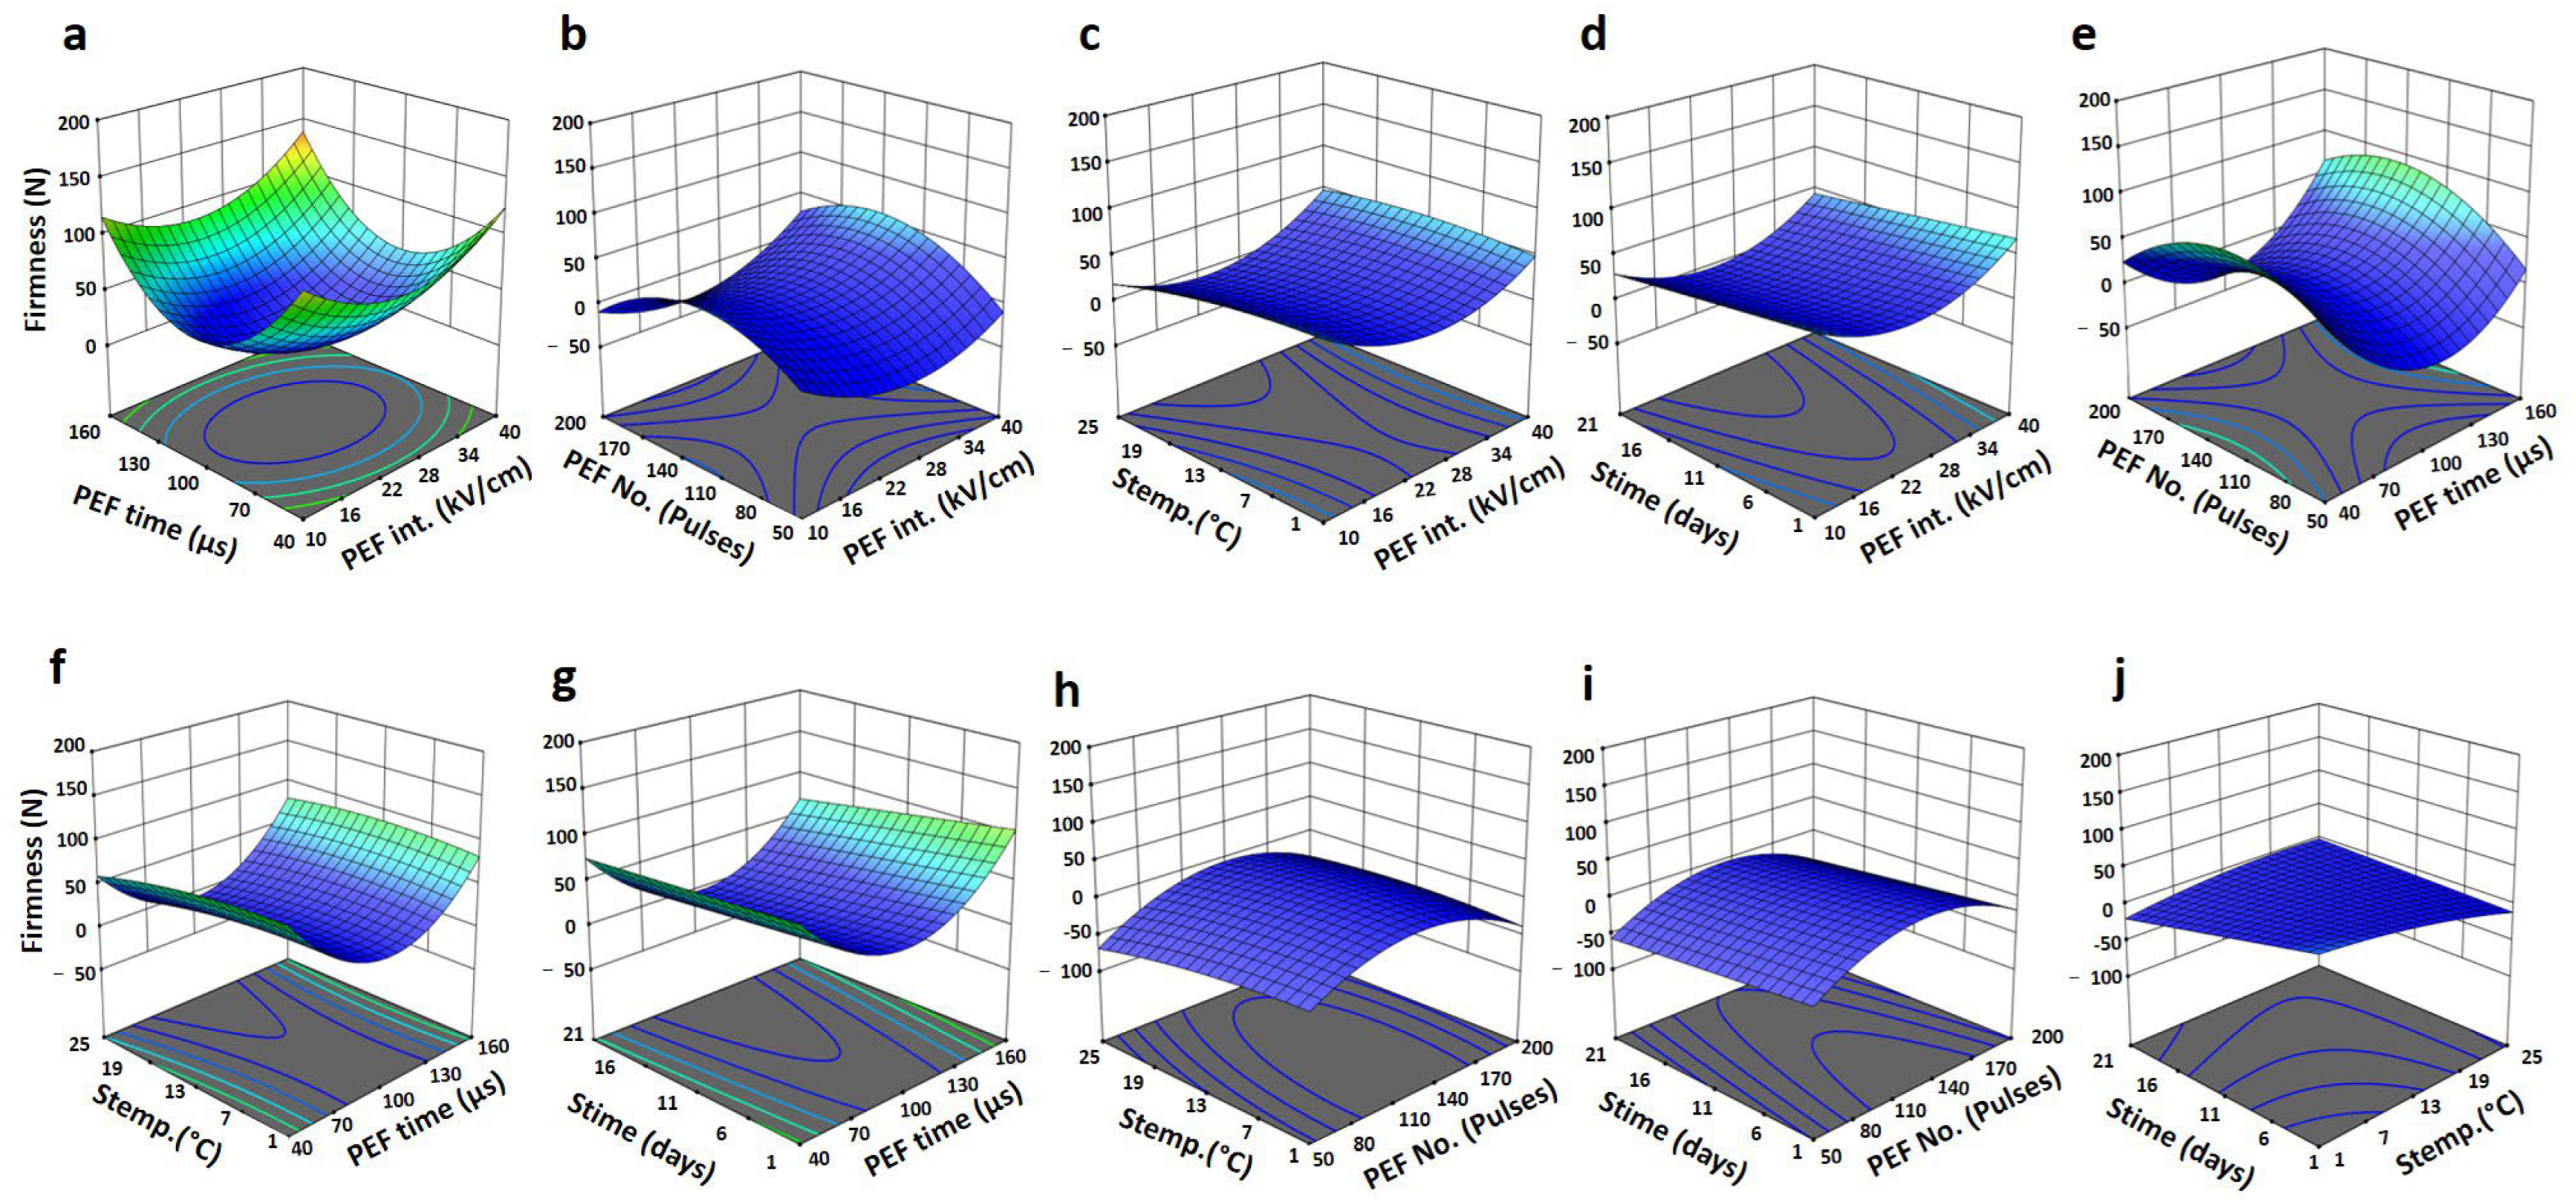
3.2. Physicochemical Properties (TSS, Firmness, and ΔE) as Influenced by PEF Treatment and Storage Conditions

The intercepts of the models were highly significant for TSS and ΔE (p < 0.01) and significant (p < 0.05) for firmness, suggesting appropriate fitting of the applied quadratic model for these parameters (Table 2). Accordingly, the TSS content of Barhi dates was negatively affected by PEF exposure time (p > 0.05), while it was positively affected by extending storage time (p > 0.01), which suggests that extending the PEF exposure time reduced the TSS, while extending the storage time increased it. As reported, PEF inactivates different enzymes in fruit products under prolonged treatment conditions [32]. However, the decline in TSS during prolonged PEF exposure may be due to the inactivation of native polysaccharide-degrading enzymes in Barhi dates. In addition, sugar caramelization due to prolonged exposure to PEF pulses could also reduce the TSS of Barhi dates [33]. The increase in TSS during the storage period of Barhi dates is possibly due to the enzymatic degradation of polysaccharides, releasing compounds from the cellular matrix, and the accumulation of reducing sugars in addition to moisture losses [34,35]. In the interaction term, the PEF intensity, number of pulses, PEF and storage time negatively (p < 0.05) affected the TSS of Bari dates, suggesting interactive effects of these variables on the TSS of Barhi dates. For firmness, ΔE and storage temperature negatively (p < 0.05) affected these attributes, whereas storage time showed a positive (p < 0.05) effect on firmness and a negative (p < 0.01) effect on ΔE in linear terms. These findings indicate that increasing the storage temperature could reduce the firmness and ΔE, whereas increasing storage duration could increase the firmness and reduce the ΔE of Barhi dates. The reduction in firmness at high temperatures is likely due to the increased enzymatic activity of cell wall-degrading enzymes, whereas at prolonged storage time, the enzyme activity could be inactivated [19]. The interactive effect of PEF intensity, storage temperature, storage temperature and storage time positively (p < 0.05) affected the firmness and ΔE of Bahi dates, demonstrating that increasing these attributes could increase the firmness and ΔE of Barhi dates. The interaction of PEF intensity with storage and PEF exposure times with storage temperature negatively affected the ΔE of Barhi dates. This suggests that increasing these factors could reduce the ΔE of Barhi dates. The increase in firmness following PEF treatment is possibly due to the elimination of cell wall-degrading enzymes by PEF treatment, thereby maintaining the integrity of cell wall architecture and preserving the firmness of Barhi dates [32]. The following equation was developed to predict the TSS, firmness, and ΔE.
Y TSS = 40.420 0.110 X 2 + 0.341 X 5 0.012 X 1 X 3 0.012 X 2 X 5
Y Firmness = 322.682 19.757 X 4 + 9.831 X 5 + 0.057 X 1 X 4 + 0.113 X 4 X 5
Y Δ E = 2.940 0.732 X 4 0.030 X 5 + 0.682 X 1 X 4 0.136 X 1 X 5 0.298 X 2 X 4 + 0.378 X 4 X 5
Three-dimensional surface plots were assembled to assess the interactive impacts of the independent variables on the TSS, firmness, and ΔE of Barhi dates (Figure 2, Figure 3 and Figure 4). Increasing the PEF intensity and exposure time significantly reduced the TSS (Figure 2a–g) and firmness (Figure 3a–g) of Barhi dates to minimum values at 25 kV/cm and 100 μs, respectively, which were elevated again at the highest levels of PEF intensity and PEF time. Increasing the number of pulses increased the TSS (Figure 2b,e,h,i) and firmness (Figure 3b,e,h,i) to maximum values at 140 pulses and then declined again as the pulse number continued to increase. Storage temperature and time also affected the TSS and firmness of Barhi dates. Increasing the storage temperature raised the TSS (Figure 2c,f,h,j) and firmness (Figure 3c,f,h,j) to the maximum values, at 13 °C, and dropped once more as the temperature progressed. Increasing storage time progressively elevated the TSS (Figure 2d,g,i,j) and firmness (Figure 3d,g,i,j) of Barhi dates, giving maximum values at 21 days. For ΔE, increasing PEF intensity and PEF number of pulses significantly increased the total color changes to maximum values at 22 kV/cm and 140 pulses, respectively, and the total color changes then reduced again as these factors elevated (Figure 4a–e,h,i). Increasing PEF time and storage time progressively increased the ΔE (Figure 4a,d–g,i,j). In contrast, increasing the storage temperature decreased the ΔE to a minimum value, at 15 °C, and then increased once more as the temperature was raised to 25 °C (Figure 4c,f,h,j). Overall, the treatment variables affected the physical characteristics of Barhi dates in increasing and decreasing manners. The reduction in TSS and increasing firmness following PEF treatment conditions is likely due to the inactivation of indigenous polysaccharides, cell wall-degrading enzymes, sugar caramelization, and surface water evaporation processes [32,33]. PEF treatment resulted in a reduction in firmness and an increase in TSS due to enzymatic degradation of cell walls and polysaccharides and a faster ripening process, resulting in softer, sweeter fruits [35,36]. The increased changes in ΔE are probably ascribed to the oxidative degradation of carotenoids, anthocyanins, and chlorophylls, sensitive pigments, in addition to the enzymatic oxidation of phenolic compounds could be enhanced by PEF treatment conditions [37].

3.3. Total Viable Count (TVC) of Barhi Dates as Influenced by PEF Treatment and Storage Conditions

The TVC’s intercept of the chosen RSM model was significant (p < 0.05), demonstrating the model’s suitability for describing the experimental data, optimizing the PEF, and extending the shelf life for Barhi dates. The PEF treatment time and storage duration had a negative impact (p < 0.05) on the TVC of Barhi dates, demonstrating that an increase in these variables could reduce TVC (Table 2). In contrast, storage temperature was found to have a positive effect (p > 0.05) on the TVC of Barhi dates, suggesting that increasing storage temperature could increase the TVC of Barhi dates. In interaction terms, increasing the PEF intensity and number of pulses positively (p < 0.05) affected the TVC of Barhi dates. The interactive effects of PEF intensity, storage time, PEF exposure time, storage temperature, and storage time on the TVC of Barhi dates were adverse (p < 0.05). The following equation was developed to predict the TVC:
Y TVC = 0.724 0.017 X 2 + 0.025 X 4 0.809 X 5 + 0.030 X 1 X 3 0.091 X 1 X 5 0.041 X 2 X 4 0.032 X 4 X 5
Three-dimensional surface plots were created (Figure 5) to define the relationship between the TVC, experimental data of the independent variables, and the interaction between the examined variables. Increasing the PEF intensity and number of pulses increased the TVC of Barhi dates to the highest counts at 25 kV/cm and 140 pulses, and a further increase in these treatment factors resulted in the reduction in TVC (Figure 5a–e,h,i). Increasing the PEF exposure time gradually increased the TVC of Barhi dates to the maximum level at 160 μs (Figure 5a,e,f,g), while increasing the storage time gradually reduced the TVC of Barhi dates (Figure 5d,g,i,j). Increasing the storage temperature greatly reduced the TVC of Barhi dates to minimum values, at 13–15 °C, which was increased again at higher storage temperatures (Figure 5c,f,h,j). Overall, PEF treatment of Barhi dates for a longer time significantly reduced the TVC due to the microbial inactivation potentials of PEF [23]. The increase in TVC with increased PEF intensity, PEF number of pulses, and storage temperature is possibly due to increased TSS and reduced sugars of Barhi dates, which promote microbial growth [1].

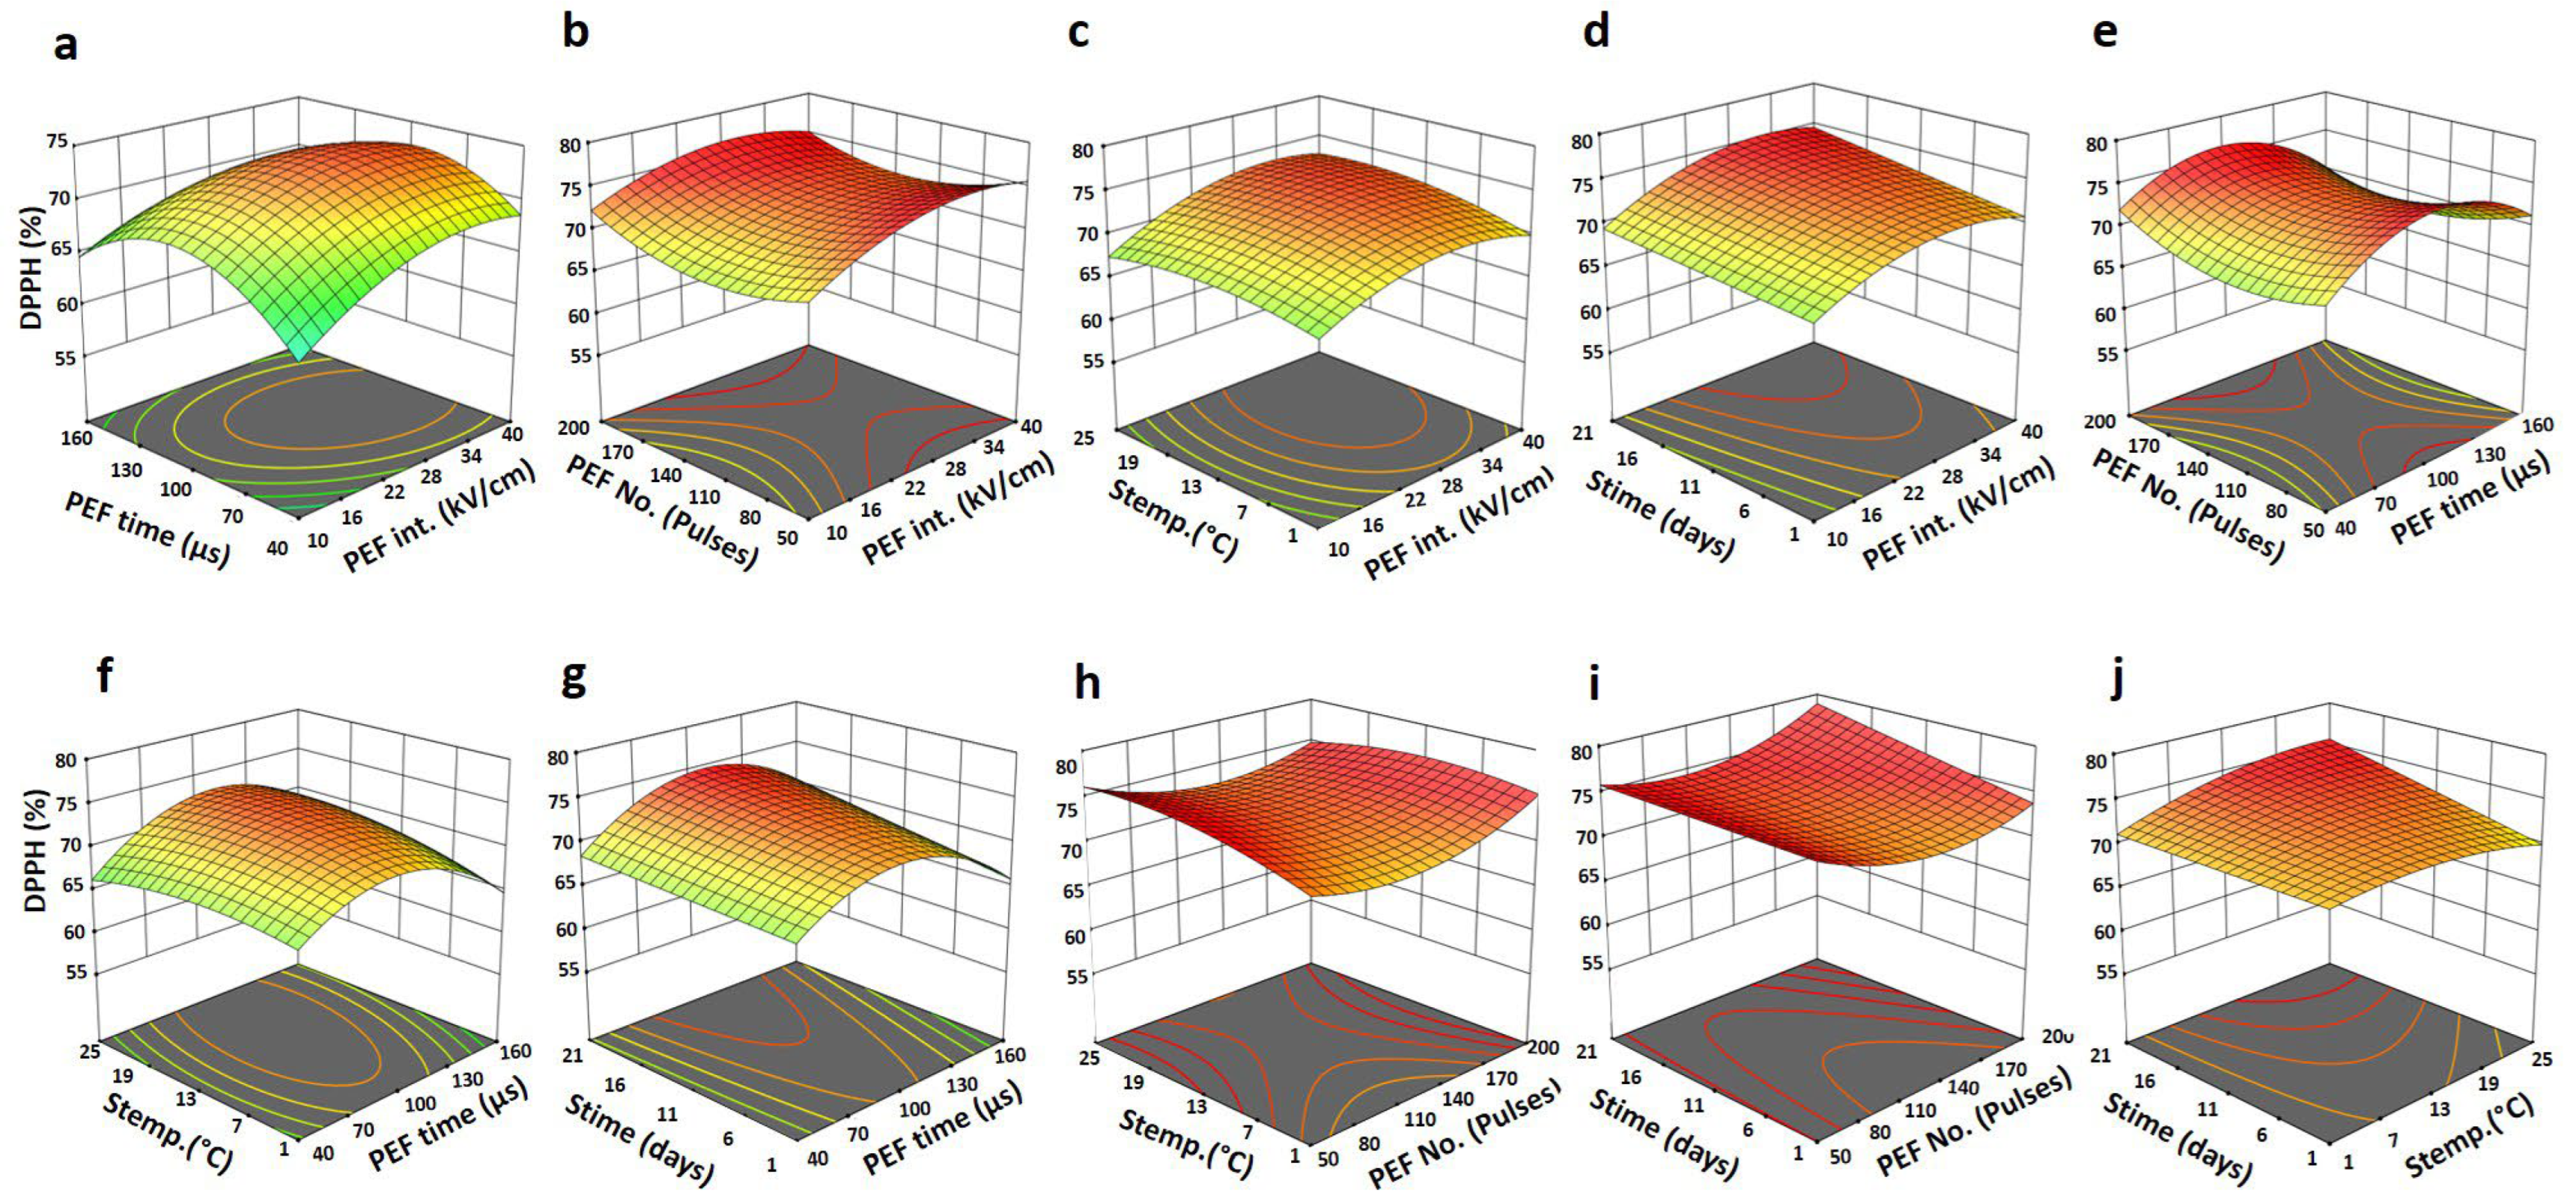
3.4. Bioactive Properties (TPC and DPPH) of Barhi Dates as Influenced by PEF Treatment and Storage Conditions

The bioactivity and health benefits of Barhi date fruits are attributed to high amounts of phenolic and flavonoid compounds, which possess high antioxidant, antimicrobial, and disease-curing properties [38]. In this study, the high significance of the chosen RSM was observed for TPC (p < 0.001) and DPPH radical scavenging activity (p < 0.01), suggesting the excellent fitting of the model to the experimental data of these bioactive attributes (Table 2). For TPC, PEF time negatively (p < 0.01) influenced the TPC, whereas storage time possessed a positive (p < 0.05) impact on the TPC of Barhi dates in linear terms. The interaction effect indicated that PEF intensity and storage temperature exhibited a negative effect. In contrast, PEF pulse numbers and storage time positively affected the TPC of Barhi dates (p < 0.01). The quadratic effect showed that PEF intensity has a negative (p < 0.01) impact, whereas the PEF pulse number has a positive (p < 0.05) influence on the TPC of Barhi dates. The decrease in TPC of Barhi dates following PEF treatments could be correlated to the enzymatic degradation of free phenolic compounds by oxidative enzymes (polyphenol oxidase and peroxidase), which contacted quickly with phenolic compounds due to structural decompartmentalization and lignification processes caused by PEF [39]. The increase in TPC following increased PEF pulses is likely due to the cleavage of covalent bonds between phenolic compounds, cell matrix, non-covalent bonds of proteins and enzymes, thereby forming pores and damaged protein channels that enhance the release and bioavailability of phenolic compounds [24,25,26,34,39]. For DPPH radical scavenging activity, PEF and storage times positively influenced the DPPH radical scavenging activity, whereas storage temperature has a negative effect on the DPPH radical scavenging activity of Barhi dates in linear terms (p < 0.05). In the interaction terms, the interactive effects of PEF intensity, PEF exposure time, storage temperature, PEF pulse numbers, and storage time on the DPPH radical scavenging activity were positive (p < 0.05), suggesting increasing these variables interactively can increase the DPPH scavenging activity of Barhi dates. The increase in the DPPH antiradical activity following PEF treatment and storage conditions could be ascribed to the release of more antioxidant compounds from cells, de novo synthesis of phenolic compounds, and formation of secondary metabolites that possess antioxidant activity such as melanoidins [1,4,24,25,26]. The following equations were developed for the TPC and DPPH prediction:
Y TPC = 0.537 0.068 X 2 + 0.102 X 5 0.016 X 1 X 4 + 0.024 X 3 X 5 0.029 X 1 2 + 0.069 X 3 2
Y DPPH = 59.121 + 0.507 X 2 0.693 X 3 1.807 X 4 + 2.188 X 5 + 0.030 X 1 X 4 + 0.022 X 2 X 4 + 0.053 X 3 X 5 + 0.016 X 4 X 5
Three-dimensional (3D) surface plots were constructed to profoundly determine the impacts of independent variables (PEF treatment and storage conditions variables) on bioactive properties (TPC and DPPH radical scavenging activity) of Barhi dates, and the results were depicted in Figure 6 and Figure 7. For TPC, increasing PEF intensity and PEF pulses showed a gradual increase in the TPC of Barhi dates to the maximum values at 35 kV/cm and 170 pulses, which remain constant at the highest PEF intensity and pulses, respectively (Figure 6a–e,h,i). Increasing PEF time and storage showed a slightly decreasing effect on the TPC of Barhi dates (Figure 6a,d,e,g,i,j). Increasing storage temperature reduced the TPC to minimum values, at 13 °C, and then increased to a maximum at the highest temperature (Figure 6c,f,h,j). The increase in TPC of Barhi dates with the increasing PEF intensity and pulses is likely due to the depolymerization of the complex phenolic compounds to smaller molecules (that are more diffusible through permeabilized cell membranes created by PEF action) [33,40]. For DPPH radical scavenging activity, the results show that: increasing the PEF intensity, PEF time, and storage temperature increased the DPPH antiradical activity of Barhi dates to the maximum at 35 kV/cm, 100 μs, and 15 °C, respectively, and reduced it at the highest values of these variables (Figure 7a–h,j). Increasing the PEF number of pulses reduced the DPPH antiradical activity to minimum values at 140 pulses. Then, it increased again to the maximum levels at the highest PEF number of pulses (Figure 7b,e,h,i). Elongation of the storage time gradually increased the DPPH antioxidant activity to the maximum values at 21 days of storage (Figure 7d,g,i,j). An increase in the antioxidant activity following PEF treatment and storage conditions is likely due to the release of various phenolic and flavonoid compounds at increased PEF voltages [33]. The reduction in TPC and DPPH at extreme PEF treatment conditions (PEF intensity of 40 kV/cm, PEF treatment time of 160 μs, and 200 pulses) could be attributed to the degradation of sensitive bioactive compounds [41]. In agreement with our findings, previous reports indicated that applying PEF treatment at moderate conditions improved some fruits’ TPC and antioxidant activity [39]. Overall, PEF treatment of Barhi dates at moderate conditions improved the treated samples’ bioactive properties and storage stability.

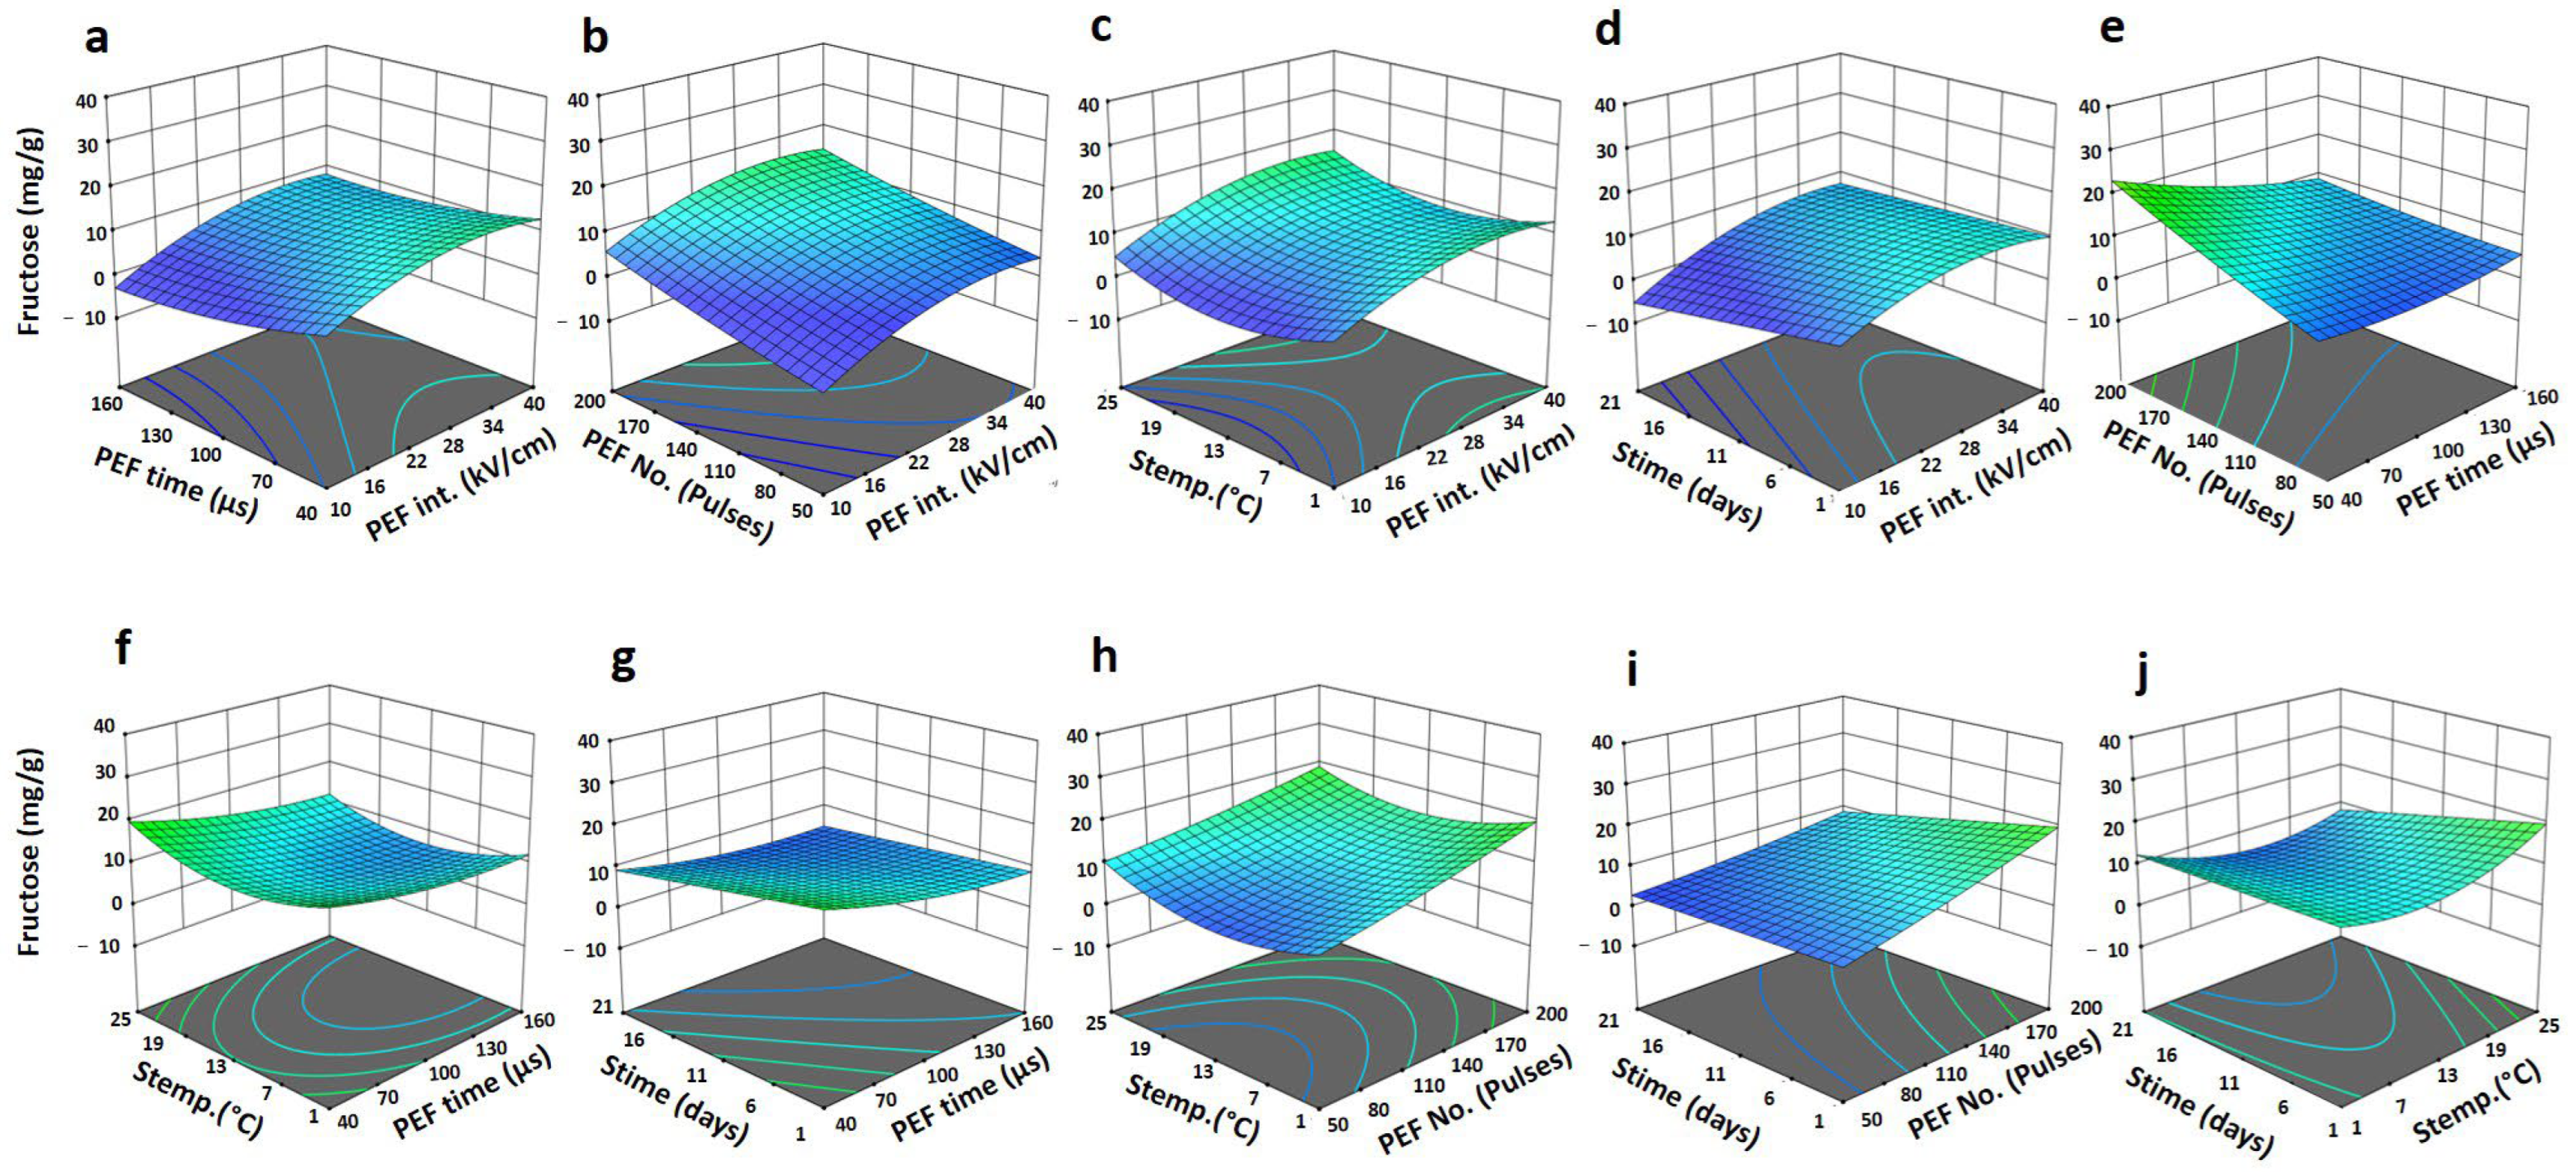
3.5. Glucose and Fructose Contents of Barhi Dates as Influenced by PEF Treatment and Storage Conditions

The intercepts of the used RSM models were significant (p < 0.05) for glucose and fructose contents, indicating the suitability of the models for analyzing these nutritional properties of Barhi dates (Table 2). In linear terms, PEF intensity and PEF number of pulses showed positive effects on the glucose (p < 0.05) and fructose (p < 0.01), showing that increasing these treatment variables will increase the glucose and fructose contents of Barhi dates. The storage temperature revealed adverse effects on the glucose (p < 0.01) and fructose (p < 0.001) contents of Barhi dates suggesting adverse impacts of storage temperature on these attributes. In the interaction term, PEF intensity and pulse number interactively positively affected the glucose and fructose, whereas PEF number of pulses and storage temperature negatively affected the glucose and fructose contents of Barhi dates (p < 0.05). In quadratic terms, PEF intensity possessed a positive impact on the glucose (p < 0.01) and fructose (p < 0.05) content, suggesting that increasing PEF intensity significantly increased the contents of these nutritional attributes of Barhi dates. The improvement of glucose and fructose content following PEF treatment could be attributed to promoting polysaccharide-degrading enzyme activity that converts complex polysaccharides into simple sugars [1,4,42]. For the glucose and fructose prediction, the following equations were developed:
Y Glucose = 10.177 + 0.607 X 1 + 0.259 X 3 0.450 X 4 + 0.032 X 1 X 3 0.091 X 3 X 4 + 0.011 X 1 2
Y Fructose = 7.949 + 0.949 X 1 + 0.304 X 3 1.647 X 4 + 0.019 X 1 X 3 0.057 X 3 X 4 + 0.013 X 1 2
Three-dimensional (3D) surface plots were constructed to intensely determine the influences of independent treatment variables on the glucose and fructose content of Barhi dates (Figure 8 and Figure 9). Increasing the PEF intensity and PEF number of pulses continually increased the glucose (Figure 8a–e,h,i) and fructose (Figure 9a–e,h,i) content to maximum values at 40 kV/cm and 200 pulses, respectively. Elongating the PEF treatment and storage times slightly reduced the glucose (Figure 8a,d–g,i,j) and fructose (Figure 9a,d–g,i,j) contents of Barhi dates to the minimum values at 160 μs and 21 days, respectively. Increasing the storage temperature reduced the glucose (Figure 8c,f,h,j) and fructose (Figure 9c,f,h,j) contents to the minimum values, at 13 °C. Then, it increased again as the temperature elevated to 25 °C. The increase in the glucose and fructose content of Barhi dates is probably due to electroporation diffusion and enhancement of polysaccharide-degrading enzymes by PEF, thereby increasing the release of reducing sugars from cellular matrixes of Barhi dates [1,4,42]. Similarly, previous reports demonstrated that PEF treatment improved fruit products’ glucose and fructose contents [42,43].

3.6. Optimal PEF Treatment and Storage Conditions

Application of PEF treatment as a postharvest preservation method of Barhi date fruits is scarce; therefore, this study was conducted to optimize the PEF treatment and subsequent storage conditions for maintaining the Barhi date quality characteristics during storage. The conditions for achieving maximum levels of TPC, DPPH, firmness, minimum levels of TSS, ΔE, TVC, and reducing sugars were optimized using response surface methodology quadratic models and equations. The optimal conditions of PEF treatment and subsequent storage conditions for conserving the quality and elongating the storability of fresh Barhi dates were: PEF intensity of 10.3 kV/cm; PEF duration of 46.73 μs; number of PEF, 169.9 pulses; and storage temperature of 18.7 °C. Under these conditions, Barhi dates could be stored for up to 21 days without significant effects on the quality traits of treated samples. High desirability (D = 1) value demonstrated a good association between the predicted and experimental data at the optimized conditions.

4. Conclusions

Barhi dates are usually consumed at Khalal ripening stage, at which the fruits are very prone to decay, and thus, a suitable preservation approach for this date fruit is essential. Thus, this study investigates the optimization of pulsed electric field (PEF) as a novel non-thermal postharvest processing method for the preservation of the quality attributes of Barhi dates using response surface methodology models. The results demonstrated that PEF treatment conditions (PEF intensity, PEF exposure time, and the number of PEF pulses) and the storage conditions (temperature and time) possessed varied impacts on the overall quality features of Barhi dates. Generally, PEF treatment improved the physical and nutritional quality attributes of Barhi dates and preserved these quality attributes during elongated storage at different temperatures. The optimum treatment conditions are: 10.3 kV/cm of PEF intensity; 46.73 μs of PEF duration; number of pulses, 169.9; and a storage temperature of 18.7 °C, at which the dates could be preserved for 21 days without significant influence on the physicochemical and nutritional quality attributes of Barhi dates. In conclusion, PEF can be applied as a novel non-thermal postharvest processing method for improving the storage stability, maintaining the quality, and elongating the shelf life of Barhi dates at the Khalal maturity stage.

Author Contributions

Conceptualization, D.O.A. and A.A.; methodology, D.O.A., H.M.Y., M.Y., A.I.Z.E.-A. and I.A.M.A.; software, K.A.A.; validation, D.O.A., K.A.A. and M.Y.; formal analysis, D.O.A. and A.E.; investigation, D.O.A. and I.A.M.A.; resources, D.O.A., K.A.A. and M.Y.; data curation, D.O.A., H.M.Y., M.Y. and A.I.Z.E.-A.; writing—original draft preparation, I.A.M.A. and A.F.; writing—review and editing, I.A.M.A. and A.F.; visualization, I.A.M.A.; supervision, A.A.; project administration, D.O.A.; funding acquisition, D.O.A. All authors have read and agreed to the published version of the manuscript.

Funding

This research was funded by the Deputyship for Research & Innovation, Ministry of Education in Saudi Arabia through the project no.: IFKSURG-2-821.

Institutional Review Board Statement

Not applicable.

Informed Consent Statement

Not applicable.

Data Availability Statement

Not applicable.

Acknowledgments

The authors extend their appreciation to the Deputyship for Research & Innovation, Ministry of Education in Saudi Arabia for funding this research work through the project no.: IFKSURG-2-821.

Conflicts of Interest

The authors declare no conflict of interest.

References

  1. Abdelkarim, D.O.; Ahmed, K.A.; Younis, M.; Yehia, H.M.; El-Abedein, A.I.Z.; Alhamdan, A.; Ahmed, I.A.M. Optimization of Infrared Postharvest Treatment of Barhi Dates Using Response Surface Methodology (RSM). Horticulturae 2022, 8, 342. [Google Scholar] [CrossRef]
  2. Ahmed, Z.F.R.; Al Shaibani, F.Y.Y.; Kaur, N.; Maqsood, S.; Schmeda-Hirschmann, G. Improving fruit quality, bioactive compounds, and storage life of date palm (Phoenix dactylifera L., cv. Barhi) using natural elicitors. Horticulturae 2021, 7, 293. [Google Scholar] [CrossRef]
  3. Fernández-López, J.; Viuda-Martos, M.; Sayas-Barberá, E.; Navarro-Rodríguez de Vera, C.; Pérez-Álvarez, J.Á. Biological, Nutritive, Functional and Healthy Potential of Date Palm Fruit (Phoenix dactylifera L.): Current Research and Future Prospects. Agronomy 2022, 12, 876. [Google Scholar] [CrossRef]
  4. Younis, M.; Mohamed Ahmed, I.A.; Ahmed, K.A.; Yehia, H.M.; Abdelkarim, D.O.; El-Abedein, A.I.Z.; Alhamdan, A. Response Surface Methodology (RSM) Optimization of the Physicochemical Quality Attributes of Ultraviolet (UV-C)-Treated Barhi Dates. Plants 2022, 11, 2322. [Google Scholar] [CrossRef]
  5. Alhamdan, A.M.; Fickak, A.; Atia, A.R. Evaluation of sensory and texture profile analysis properties of stored Khalal Barhi dates nondestructively using Vis/NIR spectroscopy. J. Food Process Eng. 2019, 42, e13215. [Google Scholar] [CrossRef]
  6. Alhamdan, A.; Hassan, B.; Alkahtani, H.; Abdelkarim, D.; Younis, M. Cryogenic freezing of fresh date fruits for quality preservation during frozen storage. J. Saudi Soc. Agric. Sci. 2018, 17, 9–16. [Google Scholar] [CrossRef] [Green Version]
  7. Atia, A.; Abdelkarim, D.; Younis, M.; Alhamdan, A. Effects of calcium chloride and salicylic acid postharvest treatments on the quality of Khalal Barhi dates at different ripening levels during cold storage. J. Food Meas. Character. 2018, 12, 1156–1166. [Google Scholar] [CrossRef]
  8. Atia, A.; Abdelkarim, D.; Younis, M.; Alhamdan, A. Effects of pre-storage dipping in calcium chloride and salicylic acid on the quality attributes of stored Khalal Barhi dates. Int. J. Agric. Biol. Eng. 2020, 13, 206–212. [Google Scholar] [CrossRef]
  9. Alhamdan, A.; Hassan, B.; Alkahtani, H.; Abdelkarim, D.; Younis, M. Freezing of fresh Barhi dates for quality preservation during frozen storage. Saudi J. Biol. Sci. 2018, 25, 1552–1561. [Google Scholar] [CrossRef] [Green Version]
  10. Al-Redhaiman, K.N. Chemical changes during storage of Barhi dates under controlled atmospheric conditions. Hortic. Sci. 2005, 40, 1413–1415. [Google Scholar]
  11. Alsawmahi, O.N.; Al-Juhaimi, F.Y.; Alhamdan, A.M.; Ghafoor, K.; Adiamo, O.Q.; Mohamed Ahmed, I.A.; Hassan, B.H.; Ehmed, K.A.; Babiker, E.E.; Abdelkarim, D.; et al. Phenolic, tannin, antioxidant, color, and sensory attributes of Barhi date (Phoenix dactylifera) fruit stored in modified atmosphere packages. J. Food Biochem. 2018, 42, e12576. [Google Scholar] [CrossRef]
  12. Alsawmahi, O.N.; Al-Juhaimi, F.Y.; Alhamdan, A.M.; Ghafoor, K.; Mohamed Ahmed, I.A.; Hassan, B.H.; Ehmed, K.A.; Abdelkarim, D.; Younis, M.; Alashmawe, N.; et al. Enzyme activity, sugar composition, microbial growth and texture of fresh Barhi dates as affected by modified atmosphere packaging. J. Food Sci. Technol. 2018, 55, 4492–4504. [Google Scholar] [CrossRef] [PubMed]
  13. El-Gioushy, S.F.; El-Masry, A.M.; Fikry, M.; El-Kholy, M.F.; Shaban, A.E.; Sami, R.; Algarni, E.; Alshehry, G.; Aljumayi, H.; Benajiba, N.; et al. Utilization of Active Edible Films (Chitosan, Chitosan Nanoparticle, and CaCl2) for Enhancing the Quality Properties and the Shelf Life of Date Palm Fruits (Barhi Cultivar) during Cold Storage. Coatings 2022, 12, 255. [Google Scholar] [CrossRef]
  14. Ghafoor, K.; Al-Juhaimi, F.Y.; Babiker, E.E.; Mohamed Ahmed, I.A.; Shahzad, S.A.; Alsawmahi, O.N. Quality Attributes of Refrigerated Barhi Dates Coated with Edible Chitosan Containing Natural Functional Ingredients. Foods 2022, 11, 1584. [Google Scholar] [CrossRef] [PubMed]
  15. Abdelkarim, D.O.; Mohamed Ahmed, I.A.; Ahmed, K.A.; Younis, M.; Yehia, H.M.; Zein El-Abedein, A.I.; Alhamdan, A. Extending the Shelf Life of Fresh Khalal Barhi Dates via an Optimized Postharvest Ultrasonic Treatment. Plants 2022, 11, 2029. [Google Scholar] [CrossRef] [PubMed]
  16. Yolmeh, M.; Jafari, S.M. Applications of Response Surface Methodology in the Food Industry Processes. Food Bioprocess Technol. 2017, 10, 413–433. [Google Scholar] [CrossRef]
  17. Weremfo, A.; Abassah-Oppong, S.; Adulley, F.; Dabie, K.; Seidu-Larry, S. Response Surface Methodology as a Tool to Optimize the Extraction of Bioactive Compounds from Plant Sources. J. Sci. Food Agric. 2023, 103, 26–36. [Google Scholar] [CrossRef]
  18. Frontuto, D.; Carullo, D.; Harrison, S.M.; Brunton, N.P.; Ferrari, G.; Lyng, J.G.; Pataro, G. Optimization of Pulsed Electric Fields-Assisted Extraction of Polyphenols from Potato Peels Using Response Surface Methodology. Food Bioprocess Technol. 2019, 12, 1708–1720. [Google Scholar] [CrossRef]
  19. Chen, B.-K.; Chang, C.-K.; Cheng, K.-C.; Hou, C.-Y.; Lin, J.-A.; Chen, M.-H.; Santoso, S.P.; Chen, C.-P.; Hsieh, C.-W. Using the response surface methodology to establish the optimal conditions for preserving bananas (Musa acuminata) in a pulsed electric field and to decrease browning induced by storage at a low temperature. Food Packag. Shelf Life 2022, 31, 100804. [Google Scholar] [CrossRef]
  20. Salehi, F. Physico-chemical properties of fruit and vegetable juices as affected by pulsed electric field: A review. Inter. J. Food Proper. 2020, 23, 1036–1050. [Google Scholar] [CrossRef]
  21. Koch, Y.; Witt, J.; Lammerskitten, A.; Siemer, C.; Toepfl, S. The influence of Pulsed Electric Fields (PEF) on the peeling ability of different fruits and vegetables. J. Food Eng. 2022, 322, 110938. [Google Scholar] [CrossRef]
  22. Pataro, G.; Ferrari, G. Limitations of pulsed electric field utilization in food industry. In Pulsed Electric Fields to Obtain Healthier and Sustainable Food for Tomorrow; Barba, F.J., Parniakov, O., Wiktor, A., Eds.; Academic Press: London, UK, 2020; pp. 283–310. [Google Scholar]
  23. Mohammed, M.E.A.; Eissa, A.H.A.; Aleid, S.M. Application of Pulsed Electric Field for Microorganisms Inactivation in Date palm Fruits. J. Food Nutr. Res. 2016, 4, 646–652. [Google Scholar]
  24. Siddeeg, A.; Manzoor, M.F.; Ahmad, M.H.; Ahmad, N.; Ahmed, Z.; Khan, M.K.I.; Maan, A.A.; Mahr-Un-Nisa; Zeng, X.-A.; Rahaman, A.; et al. Pulsed Electric Field-Assisted Ethanolic Extraction of Date Palm Fruits: Bioactive Compounds, Antioxidant Activity and Physicochemical Properties. Processes 2019, 7, 585. [Google Scholar] [CrossRef] [Green Version]
  25. Siddeeg, A.; Zeng, X.-A.; Rahaman, A.; Manzoor, M.F.; Ahmed, Z.; Al-Farga, A. Effect of Pulsed Electric Field Pretreatment of Date Palm Fruits on Free Amino Acids, Bioactive Components, and Physicochemical Characteristics of the Alcoholic Beverage. J. Food Sci. 2019, 84, 3156–3162. [Google Scholar] [CrossRef] [PubMed]
  26. Siddeeg, A.; Zeng, X.-A.; Rahaman, A.; Manzoor, M.F.; Ahmed, Z.; Al-Farga, A. Quality characteristics of the processed dates vinegar under influence of ultrasound and pulsed electric field treatments. J. Food Sci. Technol. 2019, 56, 4380–4389. [Google Scholar] [CrossRef]
  27. Association of Official Analytical Chemists—International. Official Methods of Analysis, 18th ed.; AOAC: Gaithersburg, MD, USA, 2005. [Google Scholar]
  28. Bouhlali, E.T.; Derouich, M.; Meziani, R.; Bourkhis, B.; Filali-Zegzouti, Y.; Alem, C. Nutritional, mineral and organic acid composition of syrups produced from six Moroccan date fruit (Phoenix dactylifera L.) varieties. J. Food Comp. Anal. 2020, 93, 103591. [Google Scholar] [CrossRef]
  29. Almusallam, I.A.; Mohamed Ahmed, I.A.; Babiker, E.E.; Al Juhaimi, F.Y.; Fadimu, G.J.; Osman, M.A.; Al Maiman, S.A.; Ghafoor, K.; Alqah, H.A.S. Optimization of ultrasound-assisted extraction of bioactive properties from date palm (Phoenix dactylifera L.) spikelets using response surface methodology. LWT-Food Sci. Technol. 2021, 140, 110816. [Google Scholar] [CrossRef]
  30. Liu, Y.; Wei, S.; Wu, M.; Yang, S. Phenolic compounds from date pits: Ultrasonic-assisted extraction, antioxidant activity and component identification. J. Food Measur. Character. 2018, 12, 967–973. [Google Scholar] [CrossRef]
  31. Erbay, Z.; Icier, F. Optimization of hot air drying of olive leaves using response surface methodology. J. Food Eng. 2009, 91, 533–541. [Google Scholar] [CrossRef]
  32. Martín-Belloso, O.; Elez-Martínez, P. Enzymatic Inactivation by Pulsed Electric Fields. In Emerging Technologies for Food Processing; Sun, D.-W., Ed.; Academic Press: Cambridge, MA, USA; Elsevier: Amsterdam, The Netherlands, 2005; pp. 155–181. [Google Scholar]
  33. Rios-Corripio, G.; Morales-de la Peña, M.; Welti-Chanes, J.; Guerrero-Beltran, J.A. Pulsed electric field processing of a pomegranate (Punica granatum L.) fermented beverage. Inno. Food Sci. Emerg. Technol. 2022, 79, 103045. [Google Scholar] [CrossRef]
  34. Buitimea-Cantúa, G.V.; Rico-Alderete, I.A.; de Jesus Rostro-Alanís, M.; Welti-Chanes, J.; Escobedo-Avellaneda, Z.J.; Soto-Caballero, M.C. Effect of High Hydrostatic Pressure and Pulsed Electric Fields Processes on Microbial Safety and Quality of Black/Red Raspberry Juice. Foods 2022, 11, 2342. [Google Scholar] [CrossRef] [PubMed]
  35. González-Casado, S.; Martín-Belloso, O.; Elez-Martínez, P.; Soliva-Fortuny, R. Induced accumulation of individual carotenoids and quality changes in tomato fruits treated with pulsed electric fields and stored at different post-treatments temperatures. Posthar. Biol. Technol. 2018, 146, 117–123. [Google Scholar] [CrossRef]
  36. Shayanfar, S.; Chauhan, O.; Toepfl, S.; Heinz, V. The interaction of pulsed electric fields and texturizing—Antifreezing agents in quality retention of defrosted potato strips. Int. J. Food Sci. Technol. 2013, 48, 1289–1295. [Google Scholar] [CrossRef]
  37. Bi, X.; Liu, F.; Rao, L.; Li, J.; Liu, B.; Liao, X.; Wu, J. Effects of electric field strength and pulse rise time on physicochemical and sensory properties of apple juice by pulsed electric field. Innov. Food Sci. Emerg. Technol. 2013, 17, 85–92. [Google Scholar] [CrossRef]
  38. Ramadan, B.R.; Selim, M.A.A.; Nagy, K.S.A.; Mohamed, Z.S. Influence of Packaging and Cold Storage Conditions on the Physiochemical Properties of Barhi Date Fruits. Assiut J. Agric. Sci. 2020, 51, 79–91. [Google Scholar]
  39. López-Gámez, G.; Elez-Martínez, P.; Martín-Belloso, O.; Soliva-Fortuny, R. Enhancing phenolic content in carrots by pulsed electric fields during post-treatment time: Effects on cell viability and quality attributes. Innov. Food Sci. Emerg. Technol. 2020, 59, 102252. [Google Scholar] [CrossRef]
  40. Gagneten, M.; Leiva, G.; Salvatori, D.; Schebor, C.; Olaiz, N. Optimization of Pulsed Electric Field Treatment for the Extraction of Bioactive Compounds from Blackcurrant. Food Bioprocess Technol. 2019, 12, 1102–1109. [Google Scholar] [CrossRef]
  41. Mahnič-Kalamiza, S.; Vorobiev, E.; Miklavčič, D. Electroporation in food processing and biorefinery. J. Membr. Biol. 2014, 247, 1279–1304. [Google Scholar] [CrossRef]
  42. Janositz, A.; Noack, A.-K.; Knorr, D. Pulsed electric fields and their impact on the diffusion characteristics of potato slices. LWT-Food Sci. Technol. 2011, 44, 1939–1945. [Google Scholar] [CrossRef]
  43. Oziembłowski, M.; Trenka, M.; Czaplicka, M.; Maksimowski, D.; Nawirska-Olszánska, A. Selected Properties of Juices from Black Chokeberry (Aronia melanocarpa L.) Fruits Preserved Using the PEF Method. Appl. Sci. 2022, 12, 7008. [Google Scholar]
Figure 1. Different growth and maturity stages of Barhi date fruit (post-anthesis weeks) [1].
Horticulturae 09 00155 g001
Figure 2. Response surface plots of total soluble solids (TSS) of Barhi dates as a function of PEF time and PEF intensity (a), PEF number of pluses and PEF intensity (b), storage temperature and PEF intensity (c), storage time and PEF intensity (d), PEF number of pulses and PEF time (e), storage temperature and PEF time (f), storage time and PEF time (g), storage temperature and PEF number of pulses (h), storage time and PEF number of pulses (i), and storage time and storage temperature (j).
Horticulturae 09 00155 g002
Figure 3. Response surface plots of firmness of Barhi dates as a function of PEF time and PEF intensity (a), PEF number of pluses and PEF intensity (b), storage temperature and PEF intensity (c), storage time and PEF intensity (d), PEF number of pulses and PEF time (e), storage temperature and PEF time (f), storage time and PEF time (g), storage temperature and PEF number of pulses (h), storage time and PEF number of pulses (i), and storage time and storage temperature (j).
Horticulturae 09 00155 g003
Figure 4. Response surface plots of total color change (ΔE) of Barhi dates as a function of PEF time and PEF intensity (a), PEF number of pluses and PEF intensity (b), storage temperature and PEF intensity (c), storage time and PEF intensity (d), PEF number of pulses and PEF time (e), storage temperature and PEF time (f), storage time and PEF time (g), storage temperature and PEF number of pulses (h), storage time and PEF number of pulses (i), and storage time and storage temperature (j).
Horticulturae 09 00155 g004
Figure 5. Response surface plots of total viable count (TVC) of Barhi dates as a function of PEF time and PEF intensity (a), PEF number of pluses and PEF intensity (b), storage temperature and PEF intensity (c), storage time and PEF intensity (d), PEF number of pulses and PEF time (e), storage temperature and PEF time (f), storage time and PEF time (g), storage temperature and PEF number of pulses (h), storage time and PEF number of pulses (i), and storage time and storage temperature (j).
Horticulturae 09 00155 g005
Figure 6. Response surface plots of total phenolic content (TPC) of Barhi dates as a function of PEF time and PEF intensity (a), PEF number of pluses and PEF intensity (b), storage temperature and PEF intensity (c), storage time and PEF intensity (d), PEF number of pulses and PEF time (e), storage temperature and PEF time (f), storage time and PEF time (g), storage temperature and PEF number of pulses (h), storage time and PEF number of pulses (i), and storage time and storage temperature (j).
Horticulturae 09 00155 g006
Figure 7. Response surface plots of antioxidant activity (DPPH inhibition, %) of Barhi dates as a function of PEF time and PEF intensity (a), PEF number of pluses and PEF intensity (b), storage temperature and PEF intensity (c), storage time and PEF intensity (d), PEF number of pulses and PEF time (e), storage temperature and PEF time (f), storage time and PEF time (g), storage temperature and PEF number of pulses (h), storage time and PEF number of pulses (i), and storage time and storage temperature (j).
Horticulturae 09 00155 g007
Figure 8. Response surface plots of glucose content of Barhi dates as a function of PEF time and PEF intensity (a), PEF number of pluses and PEF intensity (b), storage temperature and PEF intensity (c), storage time and PEF intensity (d), PEF number of pulses and PEF time (e), storage temperature and PEF time (f), storage time and PEF time (g), storage temperature and PEF number of pulses (h), storage time and PEF number of pulses (i), and storage time and storage temperature (j).
Horticulturae 09 00155 g008
Figure 9. Response surface plots of fructose content of Barhi dates as a function of PEF time and PEF intensity (a), PEF number of pluses and PEF intensity (b), storage temperature and PEF intensity (c), storage time and PEF intensity (d), PEF number of pulses and PEF time (e), storage temperature and PEF time (f), storage time and PEF time (g), storage temperature and PEF number of pulses (h), storage time and PEF number of pulses (i), and storage time and storage temperature (j).
Horticulturae 09 00155 g009
Table 1. Independent variables and their level used for central composite design.
Independent VariablesLevel
PEF intensity, kV/cm (X1)10 (−1)20 (−0.333)30 (0.333)40 (1)
PEF exposure time, μs (X2)40 (−1)80 (−0.333)120 (0.333)160 (1)
PEF No. of Pulses, (X3)50 (−1)100 (−0.333)150 (0.333)200 (1)
Storage temperature, °C (X4)1 (−1)5 (−0.667)15 (0.167)25 (1)
Storage time, days (X5)1 (−1)6 (−0.5)11 (0)16 (0.5)21 (1)
Table 2. PEF Regression coefficients for process variables and product responses.
FactorsTSSHardnessΔETVCTPCDPPHGlucoseFructose
Intercept
β040.420 **322.682 *2.940 **0.724 *0.537 ***59.121 **10.177 *7.949 *
Linear
X1 (β1)−0.36210.8350.1130.5550.144−0.9560.607 *0.949 **
X2 (β2)−0.110 *−4.441−0.952−0.017 *−0.068 **0.507 *−0.112−0.134
X3 (β3)0.108−1.603−0.0330.0250.081−0.0660.259 *0.304 **
X4 (β4)−0.129−19.757 *−0.732 *0.025 *−0.189−1.807 *−0.450 **−1.647 ***
X5 (β5)0.341 **9.831 *−0.030 **−0.809 *0.102 *2.188 *0.2671.817
Interaction
X1X2 (β12)0.0140.012−0.337−0.038−0.021−0.0550.0560.015
X1X3 (β13)−0.012 *0.0140.3330.030 *0.0660.0190.032 *0.019 *
X1X4 (β14)−0.0100.057 *0.682 *0.038−0.016 **0.030 *−0.0240.012
X1X5 (β15)−0.0640.089−0.136 *−0.091 *0.0210.0700.0610.014
X2X3 (β23)0.0930.040−0.246−0.055−0.010−0.033−0.064−0.090
X2X4 (β24)0.0360.012−0.298 *−0.041 *−0.0160.022 *−0.018−0.076
X2X5 (β25)−0.012 *−0.0180.0410.0690.0650.0530.0160.020
X3X4 (β34)0.0150.0600.0720.0800.040−0.024−0.091 *−0.057 *
X3X5 (β35)−0.075−0.054−0.205−0.0270.024 **0.053 *−0.027−0.037
X4X5 (β45)0.0990.113 *0.378 *−0.032 *0.0160.016 *−0.016−0.016
Quadratic
X12 (β11)0.086−0.296−2.640−0.012−0.029 **0.0170.011 **0.013 *
X22 (β22)0.0460.0190.4010.011−0.029−0.0230.0700.077
X32 (β33)−0.0460.035−0.572−0.0120.069 *0.014−0.050−0.056
X42 (β44)0.0180.549−0.638−0.0440.0360.0530.0350.069
X52 (β55)−0.057−0.4084.0800.0410.011−0.119−0.099−0.080
Model F-value0.4741.4500.8710.7723.2802.1451.9242.290
Model p-value0.0090.0280.0080.0410.00030.0030.0360.049
Mean38.0991.343.473.471.8366.4218.6511.04
C.V. %7.772.1682.4451.4458.467.602.5112.563
Adeq. precision10.4736.7999.7055.70411.7478.5328.2866.847
R20.9760.9790.9740.9780.9890.9760.9860.957
Adjusted R20.9620.9650.9240.9290.9240.9690.9630.931
Std. Dev.2.96118.0711.8911.8920.3375.0545.5135.041
F-value (Lack of Fit)12.00117.40221.49211.04322.3511.15015.45012.352
p-value (Lack of Fit)0.2380.2331.0751.0690.3750.0790.7680.375
* p < 0.05, ** p < 0.01, *** p < 0.001.
Disclaimer/Publisher’s Note: The statements, opinions and data contained in all publications are solely those of the individual author(s) and contributor(s) and not of MDPI and/or the editor(s). MDPI and/or the editor(s) disclaim responsibility for any injury to people or property resulting from any ideas, methods, instructions or products referred to in the content.

