Article

Effects of Root and Foliar Application of Corn Steep Liquor on Pepper Plants: A Physiological, Nutritional, and Morphological Study

by
Iván Navarro-Morillo
1,
Valeria Navarro-Perez
2,
Rafael Perez-Millan
1,
Eloy Navarro-León
3,
Begoña Blasco
3,
Jose Maria Cámara-Zapata
4,* and
Francisco Garcia-Sanchez
2
1
R + D Department of Atlántica Agrícola, 03400 Villena, Spain
2
Centro de Edafología y Biología Aplicada del Segura, Consejo Superior de Investigaciones Científicas, 30100 Murcia, Spain
3
Departamento de Fisiología Vegetal, Facultad de Ciencias, Universidad de Granada, 18071 Granada, Spain
4
Centro de Investigación e Innovación Agroalimentaria y Agroambiental (CIAGRO-UMH), Universidad Miguel Hernández, 03312 Orihuela, Spain
*
Author to whom correspondence should be addressed.
Horticulturae 2023, 9(2), 221; https://doi.org/10.3390/horticulturae9020221
Submission received: 10 January 2023 / Revised: 31 January 2023 / Accepted: 3 February 2023 / Published: 7 February 2023
(This article belongs to the Section Vegetable Production Systems)

Abstract

:
The industrial washing of corn grain during its milling generates a residue known as “corn steep liquor (CSL)”. This residue is rich in amino acids, carbohydrates, vitamins, and mineral nutrients that can stimulate the vegetative growth when applied to plants. However, the mode of action of this product is not yet known. This work involved the foliar and root application to pepper plants, at a dose of 5 mL L−1, of two CSL products (CSL-H and CSL-B), which differ in the way they have been stabilized. In both cases, the size of the plants was increased, root application being more efficient than foliar. According to the studies carried out, this was because the CSL products increased the synthesis of hormones related to cell division and elongation, the net assimilation rate of CO2, and the concentrations of the amino acids alanine, proline, and tryptophan. In addition, root application of CSL-H also increased the concentrations of arginine, isoleucine, leucine, and cysteine. These data suggest that the mode of action of these products is related to regulation, synthesis of hormones, and the stimulation of carbon and nitrogen metabolism, the CSL-H treatment being the one that produced the most changes in the amino acids analyzed.

1. Introduction

Global maize production exceeds one billion tonnes per year and represents approximately 35% of the total cereal production. One of the uses of maize is the industrial production of starch. In this process, a by-product known as “corn macerated liquor (CSL)” is obtained. This residue is generated when the corn is washed during its milling. CSL is a soluble solid, representing 40–50% (w/w) of the dry weight of corn, which is composed mainly of amino acids, sugars, sulfites, proteins, vitamins, and mineral macro- and micronutrients [1,2]. Its composition has led to the use of this by-product for different industrial purposes. Historically, CSL has been used as a source of supplemental nutrients in fermentation processes, livestock feed, antibiotic production, and culture media for microorganisms, and as an integral part of fertilizers and soil regulators [3,4]. CSL is widely used as an additive medium in the production of important compounds, such as penicillin, glutamic acid, lactic acid, and glucose oxidase. It is often a cheap source of C, N, vitamins, or micronutrients [5,6]. The most relevant example of the use of CSL is as a supplement in culture media in the production of antibiotics by Penicillium chrysogenum. Another of its commercial uses is in the manufacture of biosurfactants [7] that are used in industries such as the dairy sector. However, CSL is considered a waste in primary industry, since it has high concentrations of sulfites and organic matter, which make it difficult to treat, and existing treatments have a high economic cost. Its discharge as wastewater pollutes the environment greatly. Managing the large amounts of CSL generated by the corn industry has become a major problem. In recent years, research has been focused on its use: (i) in manufacturing industries as a component of culture media for microorganisms; (ii) in the production of cellulose, enzymes, organic acids, alcohols, and biosurfactants; (iii) in low-cost animal feed; and (iv) as an ingredient in biostimulant agrochemicals.
CSL contains a wide variety of proteins and other compounds that promote plant growth. In addition, it contains acetic acid, lactic acid, ferulic acid, vanillic acid, umaric acid, sinapinic acid, caffeic acid, and other bioactive molecules, and so it has the potential to combat plant pathogens [8,9,10]. When applied to the soil, changes are produced in its physicochemical properties, altering the concentrations of phosphorus, nitrogen, and potassium. In the case of hydroponic crops, the use of CSL promotes the production of healthy plants and prevents root diseases [11]. CSL also supports the growth of nitrogen-fixing bacteria and phosphorus-solubilizing bacteria. Therefore, CSL can be used as a biocontrol agent. Under hydroponic conditions, the use of CSL favors the establishment of microbial ecosystems and is an adequate means to promote microbial interactions [12]. Further, the inclusion of CSL in the hydroponic nutrients could inhibit the onset and development of lettuce root rot. Therefore, within the framework of the circular economy, the use of CSL in agriculture should be promoted since it disposes of this waste, while reducing the use of inputs such as fertilizers and phytosanitary products and improving the health and nutritional status of crop plants.
The increase in the world population entails a growing demand for food that has forced the improvement of crop productivity, linked to an excessive consumption of fertilizers. These production models have led to a loss of soil quality and deterioration of terrestrial and aquatic ecosystems [13]. Among the current challenges of agriculture, the need to develop sustainable production strategies that allow the growing world population to be fed, with a parallel use of fewer resources, stands out [14]. Among these strategies, alternatives are being promoted to replace conventional fertilizers, but this has to happen in the face of adverse environmental conditions as a consequence of climate change.
Biostimulants (BSs) are products that can be applied to crops, with the aim of increasing the availability of nutrients in the soil or the rhizosphere, improving efficiency in the use of nutrients, favoring plant tolerance of abiotic stress, and/or improving the quality of the harvested product [15,16,17,18,19]. Among the BSs, there is a great variation in composition, and they are available in various forms, both solid and liquid [20]. Their mode of action is independent of their nutrient content, which distinguishes them from conventional fertilizers [21], and includes the activation of N metabolism, the solubilization of soil P, the stimulation of soil microbial activity, the incorporation of active PGPR materials, and the improvement of root growth. Some BSs favor plant growth by activating physiological processes, such as photosynthesis, metabolic pathways, and nutrient uptake from the soil, thereby increasing crop productivity and harvest quality, and they can prolong the postharvest shelf life of agricultural products. BSs can also mitigate the effects of drought, heat, salinity, cold, frost, oxidative stress, and damage caused by mechanical and chemical factors [18].
Depending on their composition, BSs can consist of organic substances based on humic and fulvic acids; protein hydrolysates of animal or vegetable origin; amino acids or other compounds containing N, poly- and oligosaccharides [22], vitamins, chitins, and chitosan; seaweed extracts; inorganic substances, such as silicon [23]; plant extracts (seeds, leaves, roots, and fruits); and/or microorganisms, mycorrhizal fungi, and rhizobacteria that promote plant growth (strains belonging to the genera Azospirillum, Azotobacter, and Rhizobium) [17,24,25]. In addition, BSs can be by-products of sectors, such as the food industry and paper production [26].
One of the solutions to the problem created in the corn industry due to the high amount of CSL produced is its application in agriculture. It has been demonstrated that its application can improve plant growth. Ref. [27] applied to bean plants concentrations of 1%, 2%, 5%, and 10% CSL in the irrigation solution. The authors concluded that the application of 1% CSL improved germination, plant growth (height and fresh weight of the aerial part), and early flowering. In addition, they observed increases in the foliar concentrations of the nutrients N, P, K, Mn, and Cu, which could explain the results obtained. Therefore, the objective of this work was to evaluate the biostimulant effect of two CSL products from the company Atlántica Agrícola SA, which differ in the stabilization method used (CSL-B and CSL-H). It was also intended to determine the most appropriate form of application, root versus foliar, as well as the mechanisms of their effects on plants. For this, these products were applied to pepper plants, and growth parameters and indicators of basic physiological processes, such as photosynthesis, N metabolism, hormonal composition, and nutritional status, were determined.

2. Materials and Methods

2.1. Plant Material and Growth Condicitons

To carry out this work, pepper plants (Capsicum annuum cv. Alycum) were used. After germination, the plants were grown in a tray with 3 cm × 3 cm × 10 cm cells for 45 days. Next, they were transplanted into pots with 2 L of substrate (a mix of perlite:peat, 1:3) and placed in a growth chamber with 60/80% relative humidity (day/night), a temperature of 29/20 °C (day/night), and a photoperiod of 16 h with a photosynthetic photon-flux density (PPFD) of 450 µmol photons m−2 s−1. The plants were irrigated once a week with Hoagland nutrient solution (4 mM KNO3, 2 mM Ca(NO3)2, 2 mM MgSO4, 1 mM KH2PO4, 1 mM NaH2PO4, 2 µM MnCl2, 1 µM ZnSO4, 0.25 µM CuSO4, 0.1 µM Na2MoO4, 125 µM Fe-EDDHA, and 50 µM H3BO3), with a pH of 5.8, adding 50–100 mL, depending on the growth of the plants.

2.2. Experimental Design

Fifty-two days after germination, the application of the treatments was carried out—T1: control, without application of CSL; T2: root application of CSL-B at a dose of 5 mL L−1; T3: root application of CSL-H at a dose of 5 mL L−1; T4: foliar application of CSL-B at a dose of 5 mL L−1; and T5: foliar application of CSL-H at a dose of 5 mL L−1. The volume used in both root application and foliar treatment was 50 mL. To ensure foliar sprays did not get on root treatments, plastic enclosures were used to protect the aerial part and also to isolate the substrate. The CSL came from the wet milling of corn kernels. It is rich in organic and mineral substances, including free amino acids, mineral nutrients, phenolic compounds (vanillic, ferulic, coumaric, sinapinic, and caffeic acids), and low-molecular-weight soluble sugars.
The two CSL products tested, CSL-B and CSL-H, include in their composition (%, g/100 g on fresh product), respectively: free amino acids (5.0–6.0 and 5.5–6.5), total organic matter (40.0 and 30.0), total humic extract (30.0 and 20.0), fulvic acids (30.0 and 20.0), total nitrogen (3.0), ammoniacal nitrogen (0.3), organic nitrogen (2.7), potassium (K2O) (2.5), and phosphorus (P2O5) (3.0). Micronutrients were not detected. The differences between the two CSL products are due to the fact that CSL-H is obtained directly from industry, whereas CSL-B undergoes a stabilization of the suspended solids, and its useful life is increased (using a method that is pending the award of a patent to Atlántica Agrícola SA), allowing its proper industrial handling without settling problems.
The application of the different treatments began 7 days after transplanting the plants to the growth chamber. The CSL-B and CSL-H products, by both the root and foliar routes, were applied four times, with 7 days between applications. The experimental design consisted of a complete randomized block with eight plants per treatment, arranged in individual pots, with the treatments randomly distributed in the growth chamber.

2.3. Measurements of Gas Exchange and Chlorophylls Fluorescence

At the end of the experiment, 7 days after the last treatment application, the gas exchange parameters and chlorophyll fluorescence of the plants were measured.

2.3.1. Photosynthetic Efficiency

Measurements were made with a LICOR 6800 Portable Photosynthesis System Infrared Gas Analyzer (IRGA: LICOR Inc., Lincoln, NE, USA) on one leaf of six plants per treatment. The intermediate leaves, under optimal growth conditions, were introduced into the measurement cuvettes, and measurements were made at 500 μmol photons m−2 s−1 of photosynthetically active radiation (PAR), a CO2 concentration of 400 μmol mol¹, a leaf temperature of 30 °C, and 60% relative humidity. The net photosynthetic rate, A; the transpiration rate, E; and the stomatal conductance, gs, were recorded simultaneously. The data were analyzed using “Photosyn Assistant” software. The instantaneous water use efficiency (WUE) was calculated by dividing A by E [28].

2.3.2. Fluorescence of Chlorophyll a

The fluorescence kinetics of Chl a were determined with a Handy PEA Chlorophyll Fluorimeter (Hansatech Ltd., King’s Lynn, Norfolk, UK). Red light (650 nm) with a light intensity of 3000 µmol photons m−2 s−1 was used to induce the OJIP phases. The OJIP fluorescence phases were analyzed using the JIP test [28]. Measurements were made on fully developed leaves in the middle of the plant. To study the energy fluxes and photosynthetic activity, the following parameters obtained from the JIP test were used: initial fluorescence (Fo); maximum fluorescence (Fm); variable fluorescence (Fv = Fm − Fo); fluorescence value at 300 µs (K peak); maximum quantum product of primary photochemistry (Fv/Fm); performance index (PIABS); ratio of active reaction centers (RC) (RC/ABS); and the value 1–Vj, which indicates the electron output, mainly from photosystem II [28].

2.4. Analysis of Plant Samples

Seven days after the last application of the treatments, and once the gas exchange and chlorophyll fluorescence measurements had been made, all the plants were processed for analysis. Plant material was weighed and then washed with DECON-90 nonionic soap. Afterwards, it was washed three times with deionized water and then dried with filter paper. Leaf samples were taken from each plant and were kept fresh or frozen at −40 °C to determine the oxidative indicators, hormonal profile, aminogram, enzymatic activity, and nitrate concentration. Leaves were also taken, which, after drying in a forced-air oven, were used to determine the dry weight (DW), as well as to measure the concentrations of mineral nutrients and the N use efficiency of the plants (NUtE). The parameters included in this section were determined according to [29]. The leaf area was measured with an optical reader LI-COR, model LI-3000A. The specific leaf area (SLA) is the relationship between leaf area and leaf weight.

2.4.1. Concentrations of Oxidative Indicators (MDA, H2O2, and O2)

For malondialdehyde (MDA) extraction, fresh plant material was homogenized with 5 mL of 50 mM buffer (0.07% NaH2PO4·2H2O and 1.6% Na2HPO4·12H2O) in a mortar and centrifuged at 20,000× g for 25 min. Subsequently, a 1 mL aliquot of the supernatant was mixed with 4 mL of 20% trichloroacetic acid containing 0.5% thiobarbituric acid. The resulting mixture was heated at 95 °C for 30 min and then quickly cooled in an ice bath. The samples were then centrifuged at 10,000× g for 10 min, and the absorbance of the supernatant was measured at 532 nm. The value for non-specific absorption at 600 nm was subtracted from the reading obtained at 532 nm. The MDA concentration was calculated using the MDA molar extinction coefficient of 155 mM−1 cm−1 [30].
The H2O2 concentration was measured colorimetrically, according to [31]. Fresh plant material was homogenized in cold acetone. A 1 mL aliquot of the extract was mixed with 200 µL of 0.1% titanium dioxide in 20% H2SO4 (v:v), and the mixture was centrifuged at 6000× g for 15 min. The intensity of the yellow color of the supernatant was measured at 415 nm. The H2O2 concentration was calculated from an H2O2 standard curve.
The O2 concentration was measured colorimetrically, according to [32]. A 0.1 g sample of fresh plant material was macerated, 300 μL of 50 mM phosphate buffer were added, and the mixture was centrifuged at 10,000× g for 15 min. A 250 μL sample of the supernatant was taken, and 1 mL 50 mM phosphate buffer and 250 μL of 10 mM hydroxylamine were added. The mixture was incubated for 20 min at 25 °C. Subsequently, 180 μL of 17 mM sulfonylic acid and 180 μL of 7 mM α-1-naphthylamine were added to 60 μL of supernatant. The mixture was incubated for 1 h at room temperature, and the intensity of the color was measured at 530 nm. The O2 concentration was calculated from an O2 standard curve.

2.4.2. Hormonal Profile

Indoleacetic acid (IAA), gibberellins (GA, GA1 + GA3 + GA4), cytokinins (CKs: trans-zeatin (tZ) + isopentenyl adenine (iP)), and melatonin were analyzed, according to [33] with some modifications. A 30 mg sample of lyophilized material was homogenized in 0.5 mL of cold (−20 °C) methanol/water (80/20, v/v) solution. The solids were separated by centrifugation (20,000× g, 15 min) and re-extracted for 30 min at 4 °C into an additional 0.5 mL of the same extraction solution. The pooled supernatants were passed through a Sep-Pak Plus-C18 cartridge (SepPak Plus, Waters, Bedford, MA, USA). To remove the interfering lipids and part of the plant pigments, they were evaporated at 40 °C under vacuum or until the organic solvent was eliminated. The residue was dissolved in 1 mL of methanol/water (20/80, v/v) solution in an ultrasonic bath. The dissolved samples were filtered through 13 mm-diameter Millex filters, having a nylon membrane with a pore size of 0.22 μm (Millipore, Bedford, MA, USA). A 10 μL sample of each filtered extract was injected into a U-HPLC-MS system, consisting of an Accela Series U-HPLC (ThermoFisher Scientific, Waltham, MA, USA) coupled to an Exact mass spectrometer (ThermoFisher Scientific, Waltham, MA, USA) using a heated electrospray ionization interface (HESI). Mass spectra were obtained with Xcalibur version 2.2 software (ThermoFisher Scientific, Waltham, MA, USA). For the quantification of plant hormones, calibration curves were constructed for each component analyzed (1, 10, 50, and 100 μg L−1), with correction for 10 μg L−1 of deuterated internal standards. The recovery percentages were between 92 and 95%.

2.4.3. Aminogram

Soluble amino acids were extracted, using the method of [34] with some modifications. A 0.1 g sample of fresh leaves was homogenized in 1 mL of MCW (methanol:chloroform:water, 12:5:1); 50 μL of L−2 aminobutyric acid were added as internal standard. The mixture was centrifuged at 20,000 × g for 10 min. To the supernatant were added 700 μL of Milli-Q water and 1.2 mL of chloroform, and this mixture was incubated for 24 h at 4 °C. Subsequently, the aqueous phase was lyophilized, and the resulting extract was diluted with 0.1 M HCl. Instrumental analysis of soluble amino acids was carried out using an AccQ Tag Ultra Derivatization Kit precolumn (Waters, Milford, MA, USA). Derivatization was performed, according to the manufacturer’s protocol: to 10 μL of the sample were added 60 μL of borate buffer, 10 μL of 0.1 N NaOH, and 20 μL of reconstituted AccQ Tag Ultra reagent. LC fluorescence analysis was performed on a Waters Acquity® UHPLC system equipped with an Acquity fluorescence detector. UHPLC separation was performed on a Waters AccQ Tag Ultra column (2.1 × 100 mm, 1.7 µm). The flow rate was 0.7 mL min−1 and the column temperature was maintained at 55 °C. The injection volume was 1 μL, and detection was established at an excitation wavelength of 266 nm and an emission wavelength of 473 nm. The solvent system consisted of two eluents: a 1:20 dilution of concentrated AccQ Tag Ultra eluent A and AccQ Tag Ultra eluent B. The profile was as follows: 0–0.54 min, 99.9% A and 0.1% B; 5.74 min, 90.9% A and 9.1% B; 7.74 min, 78.8% A and 21.2% B; 8.04 min, 40.4% A and 59.6% B; 8.05–8.64 min, 10% A and 90% B; and 8.73–9.50 min, 99.9% A and 0.1% B.

2.4.4. Enzymatic Activities Involved in Nitrogen Metabolism

Nitrate reductase (NR) activity was determined by following the procedure described by [35]. Fresh plant material (0.2 g) was macerated in a mortar with 1 mL of extraction buffer containing 2 mM EDTA-Na, 2 mM DTT, and 1% (w/v) PVPP in 100 mM KH2PO4 (pH 7.5). The suspension obtained was centrifuged for 20 min at 20,600× g, at 4 °C. The resulting supernatant was added to a reaction mixture containing: 100 mM KNO3, 2 mM NADH, 10 mM cysteine, and 10 mM MgCl2 in 100 mM KH2PO4 buffer (pH 7.5). This mixture was incubated at 30 °C for 30 min. Subsequently, 1 mM Zn acetate was used to stop the reaction, and 1% sulfanilamide in 1.5 M HCl and 0.02% (w/v) NNEDA in 0.2 M HCl were added for the detection of the NO2 produced. Finally, the NR activity was determined by measuring the absorbance of NO2 at 540 nm.
Glutamine synthetase (GS) activity was determined by adapting the hydroxamate synthetase assay of [35]. A 0.1 g sample of leaves was macerated in a mortar with 1 mL of extraction buffer containing: 100 mM sucrose, 2% (v/v) β-mercaptoethanol, and 20% (v/v) ethylene glycol in 100 mM maleic acid-KOH (pH 6.8). The suspension was centrifuged for 20 min at 20,600× g, at 4 °C. The resulting extract was used to measure GS activity. The reaction mixture used consisted of 150 mM sodium glutamate, 30 mM hydroxylamide, and 10 mM ATP as substrates, together with 45 mM MgSO4·7H2O and 4 mM EDTA-Na, all of them dissolved in 150 mM imidazole-HCl buffer (pH 7.8). After incubation at 28 °C for 30 min, glutamylhydroxamate formation was determined by measuring its absorbance at 540 nm, after binding with acidified ferric chloride.

2.4.5. Concentrations of Total Nutrients and Nitrate and Nitrogen Use Efficiency

The determination of the concentrations of the nutrients P, K, Ca, Mg, S, Fe, Cu, Mn, Zn, Mo, and B was performed using ICP-OES. Leaf samples were subjected to a mineralization process, following the method of [36]. A sample of 0.2 g of dry leaves was subjected to digestion with HNO3 and 30% H2O2 at 300 °C, and the mineralized extract obtained was used for the analysis of ionic elements. Another 0.2 g sample of dry leaves was ground and mineralized with 98% H2SO4 and 30% H2O2, at a temperature of 300 °C, and the mineralized material was used for total N analysis. The concentration of total N was determined by colorimetry based on the Berthelot reaction, according to the method described by [37]. To determine the soluble NO3 concentration, an aqueous extraction was carried out, and the colorimetric reaction of NO3 with salicylic acid in a basic medium was used [38]. Finally, the nitrogen use efficiency (NUtE) was estimated as the relationship between the biomass production (Bw) and the amount of N in the leaves (Nl).

2.5. Statistical Analysis

All the analyses were performed in triplicate, and the results were statistically evaluated using an analysis of variance, ANOVA, with a 95% confidence interval. The differences between the means of the treatments were analyzed using the least significant difference test of Fisher (LSD) at a probability level of 95%. Significance levels were expressed as: * p < 0.05; ** p < 0.01; *** p < 0.001; NS not significant.

3. Results

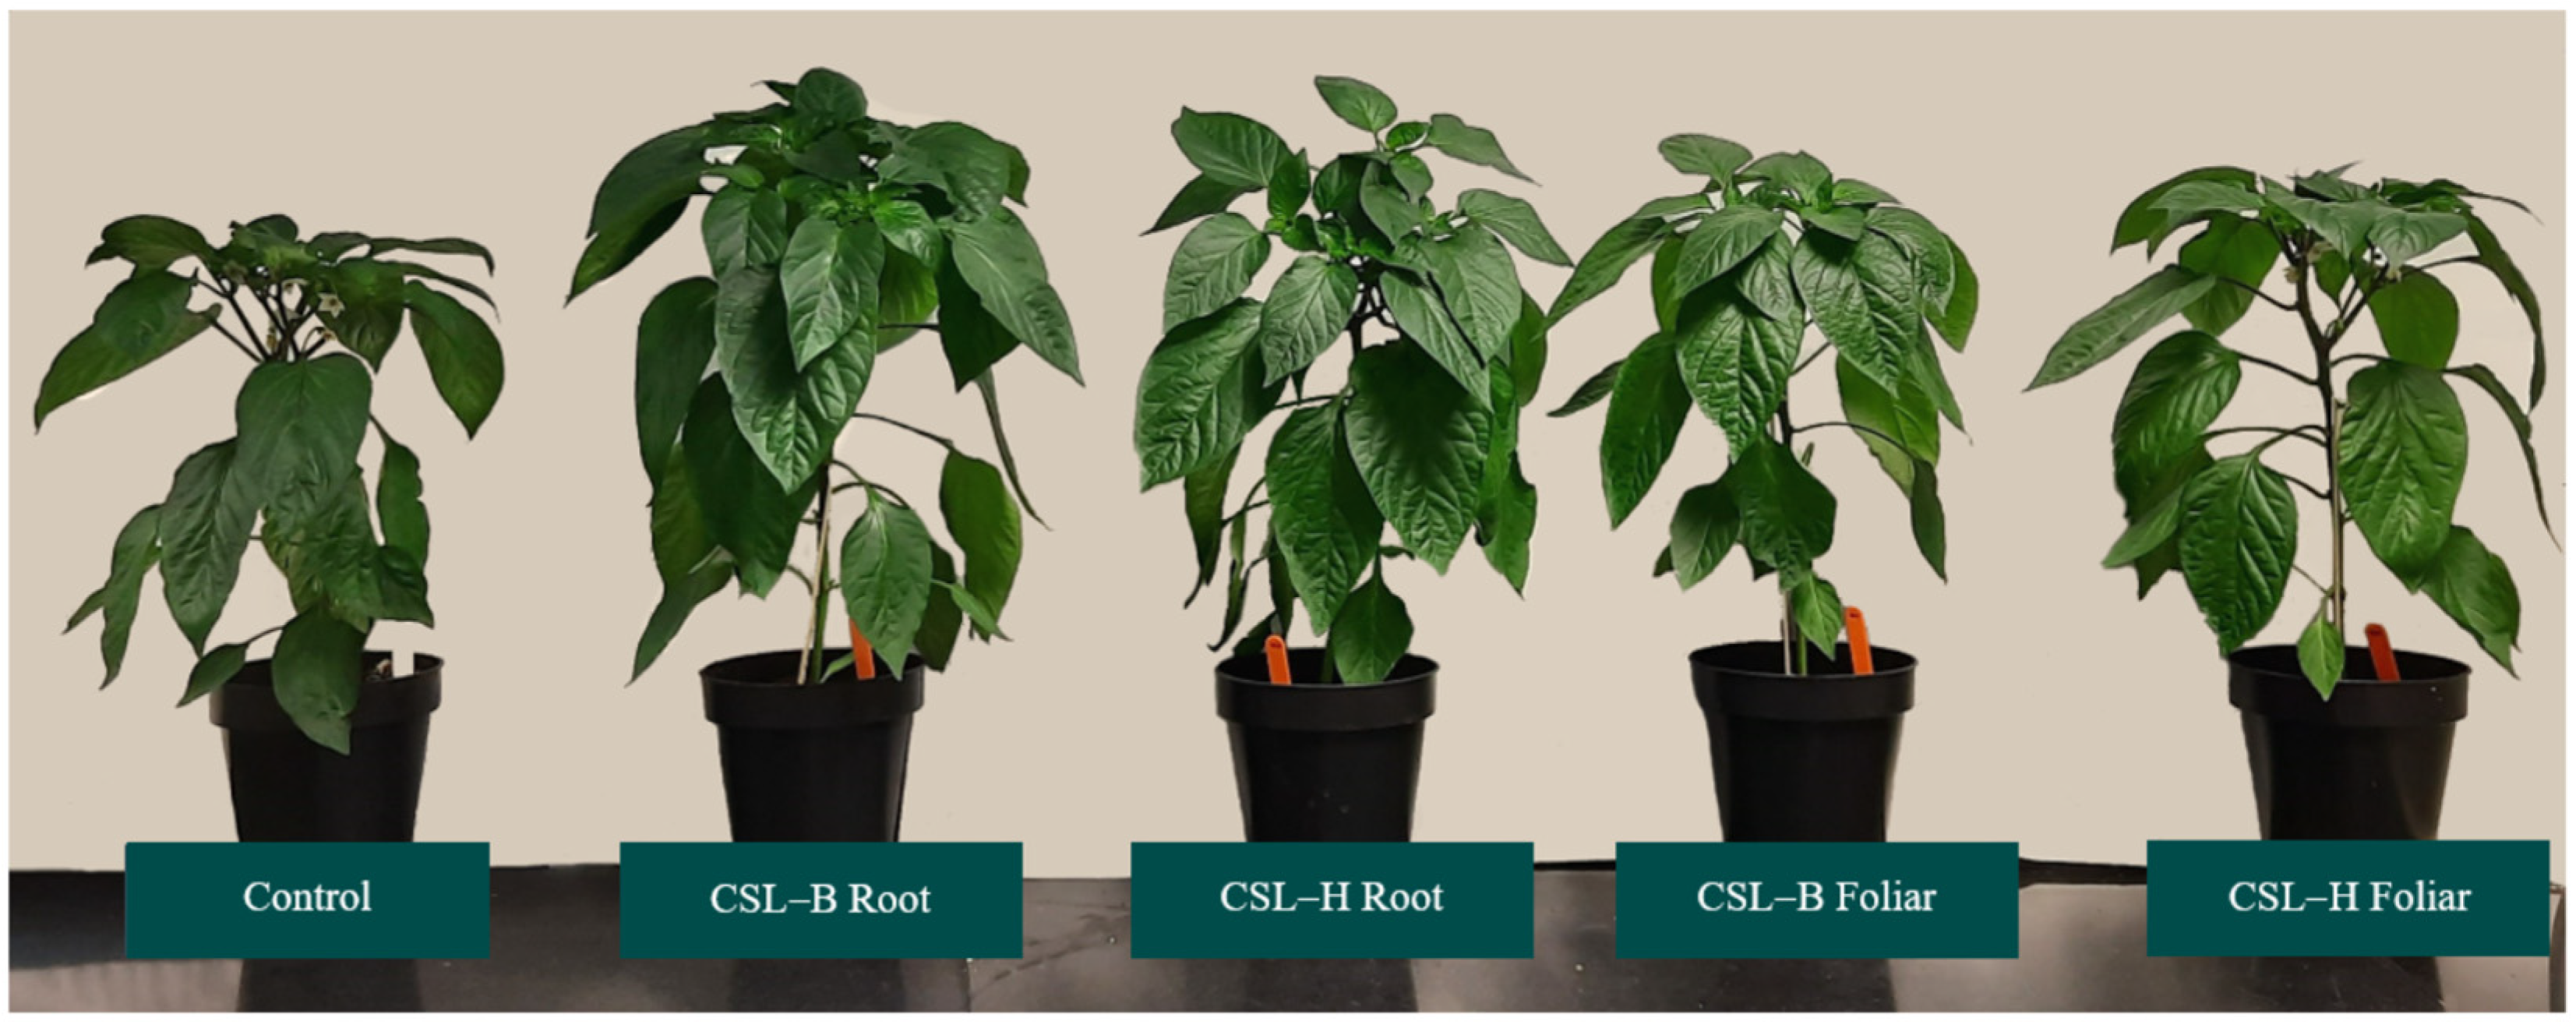
3.1. Biomass and Leaf Area

For the dry weight of the aerial part and the leaf area (Table 1, Figure 1), regardless of the mode of application, the CSL-B and CSL-H products gave an increase in these parameters compared to control plants. The CSL-B root treatment was the one that produced the most vigorous plants, with an increase of 65% and 22% in the leaf dry weight and leaf area, respectively, in comparison to control plants, although the dry weight did not differ from that of the root CSL-H treatment. Regarding the mode of application, the products applied via the roots were more effective (Table 1), although there were no significant differences between the root and foliar CSL-H treatments. The SLA value was reduced in the plants treated with CSL, except for the CSL-B foliar treatment, which had values similar to those of the control.
These results indicate that the products analyzed have positive effects on the growth of pepper plants under adequate conditions and do not have phytotoxic effects. In particular, the CSL-B treatment applied via the roots induced a greater production of leaf biomass and a greater leaf area of the pepper plants. Other authors, such as [27], found that the root application of the CSL product improved the growth of bean plants.

3.2. Gas Exchange Parameters

The application of the CSL-B and CSL-H products, both root and foliar, increased the net CO2 assimilation rate (A), but did not affect the stomatal conductance (gs) or foliar transpiration (E). This response caused the water use efficiency (WUE = A/E) to be significantly higher in CSL-treated plants than in control plants (Table 2). Of all the CSL treatments, CSL-B Root produced the highest values of A and WUE. Regarding the mode of application, differences were only observed with the CSL-B product, with root application being more effective than foliar application for A and WUE.

3.3. Chl a Fluoresence

The values of the RC/ABS and PIABS photochemical activity indices were higher in plants receiving certain CSL treatments than in control plants. Thus, plants receiving the CSL-B Root or CSL-H Root treatment had significantly higher RC/ABS values than control plants, while the highest PIABS values were observed in all CSL-treated plants, except those of the CSL-B Root treatment (Table 3). The values of Fv/Fm and 1–Vj did not exhibit significant differences due to the treatments. This indicates that the light capture and utilization machinery of the plants treated with CSL, especially that of the CSL-B Root plants, was in better condition than that of the control plants.

3.4. Study of Oxidative Stress

The plants treated with CSL did not have altered concentrations of MDA, H2O2, or O2 with respect to those of the control plants (Table 4). The values recorded following root application of the products did not differ from those for foliar application.

3.5. Hormonal Profile

The application of CSL-B or CSL-H, to the roots or foliage, produced significant increases in the concentrations of auxin growth hormones (AIAs), trans-zeatin (tZ), and active gibberellins (GA1, GA3, and GA4), compared to those found in the control plants (Table 5). For AIA, tZ, GA1, and GA4, root application increased the concentration more than foliar application, in such a way that the CSL-B and CSL-H root treatments gave higher concentrations than the respective foliar applications. For GA3, foliar and root applications gave rise to similar concentrations.

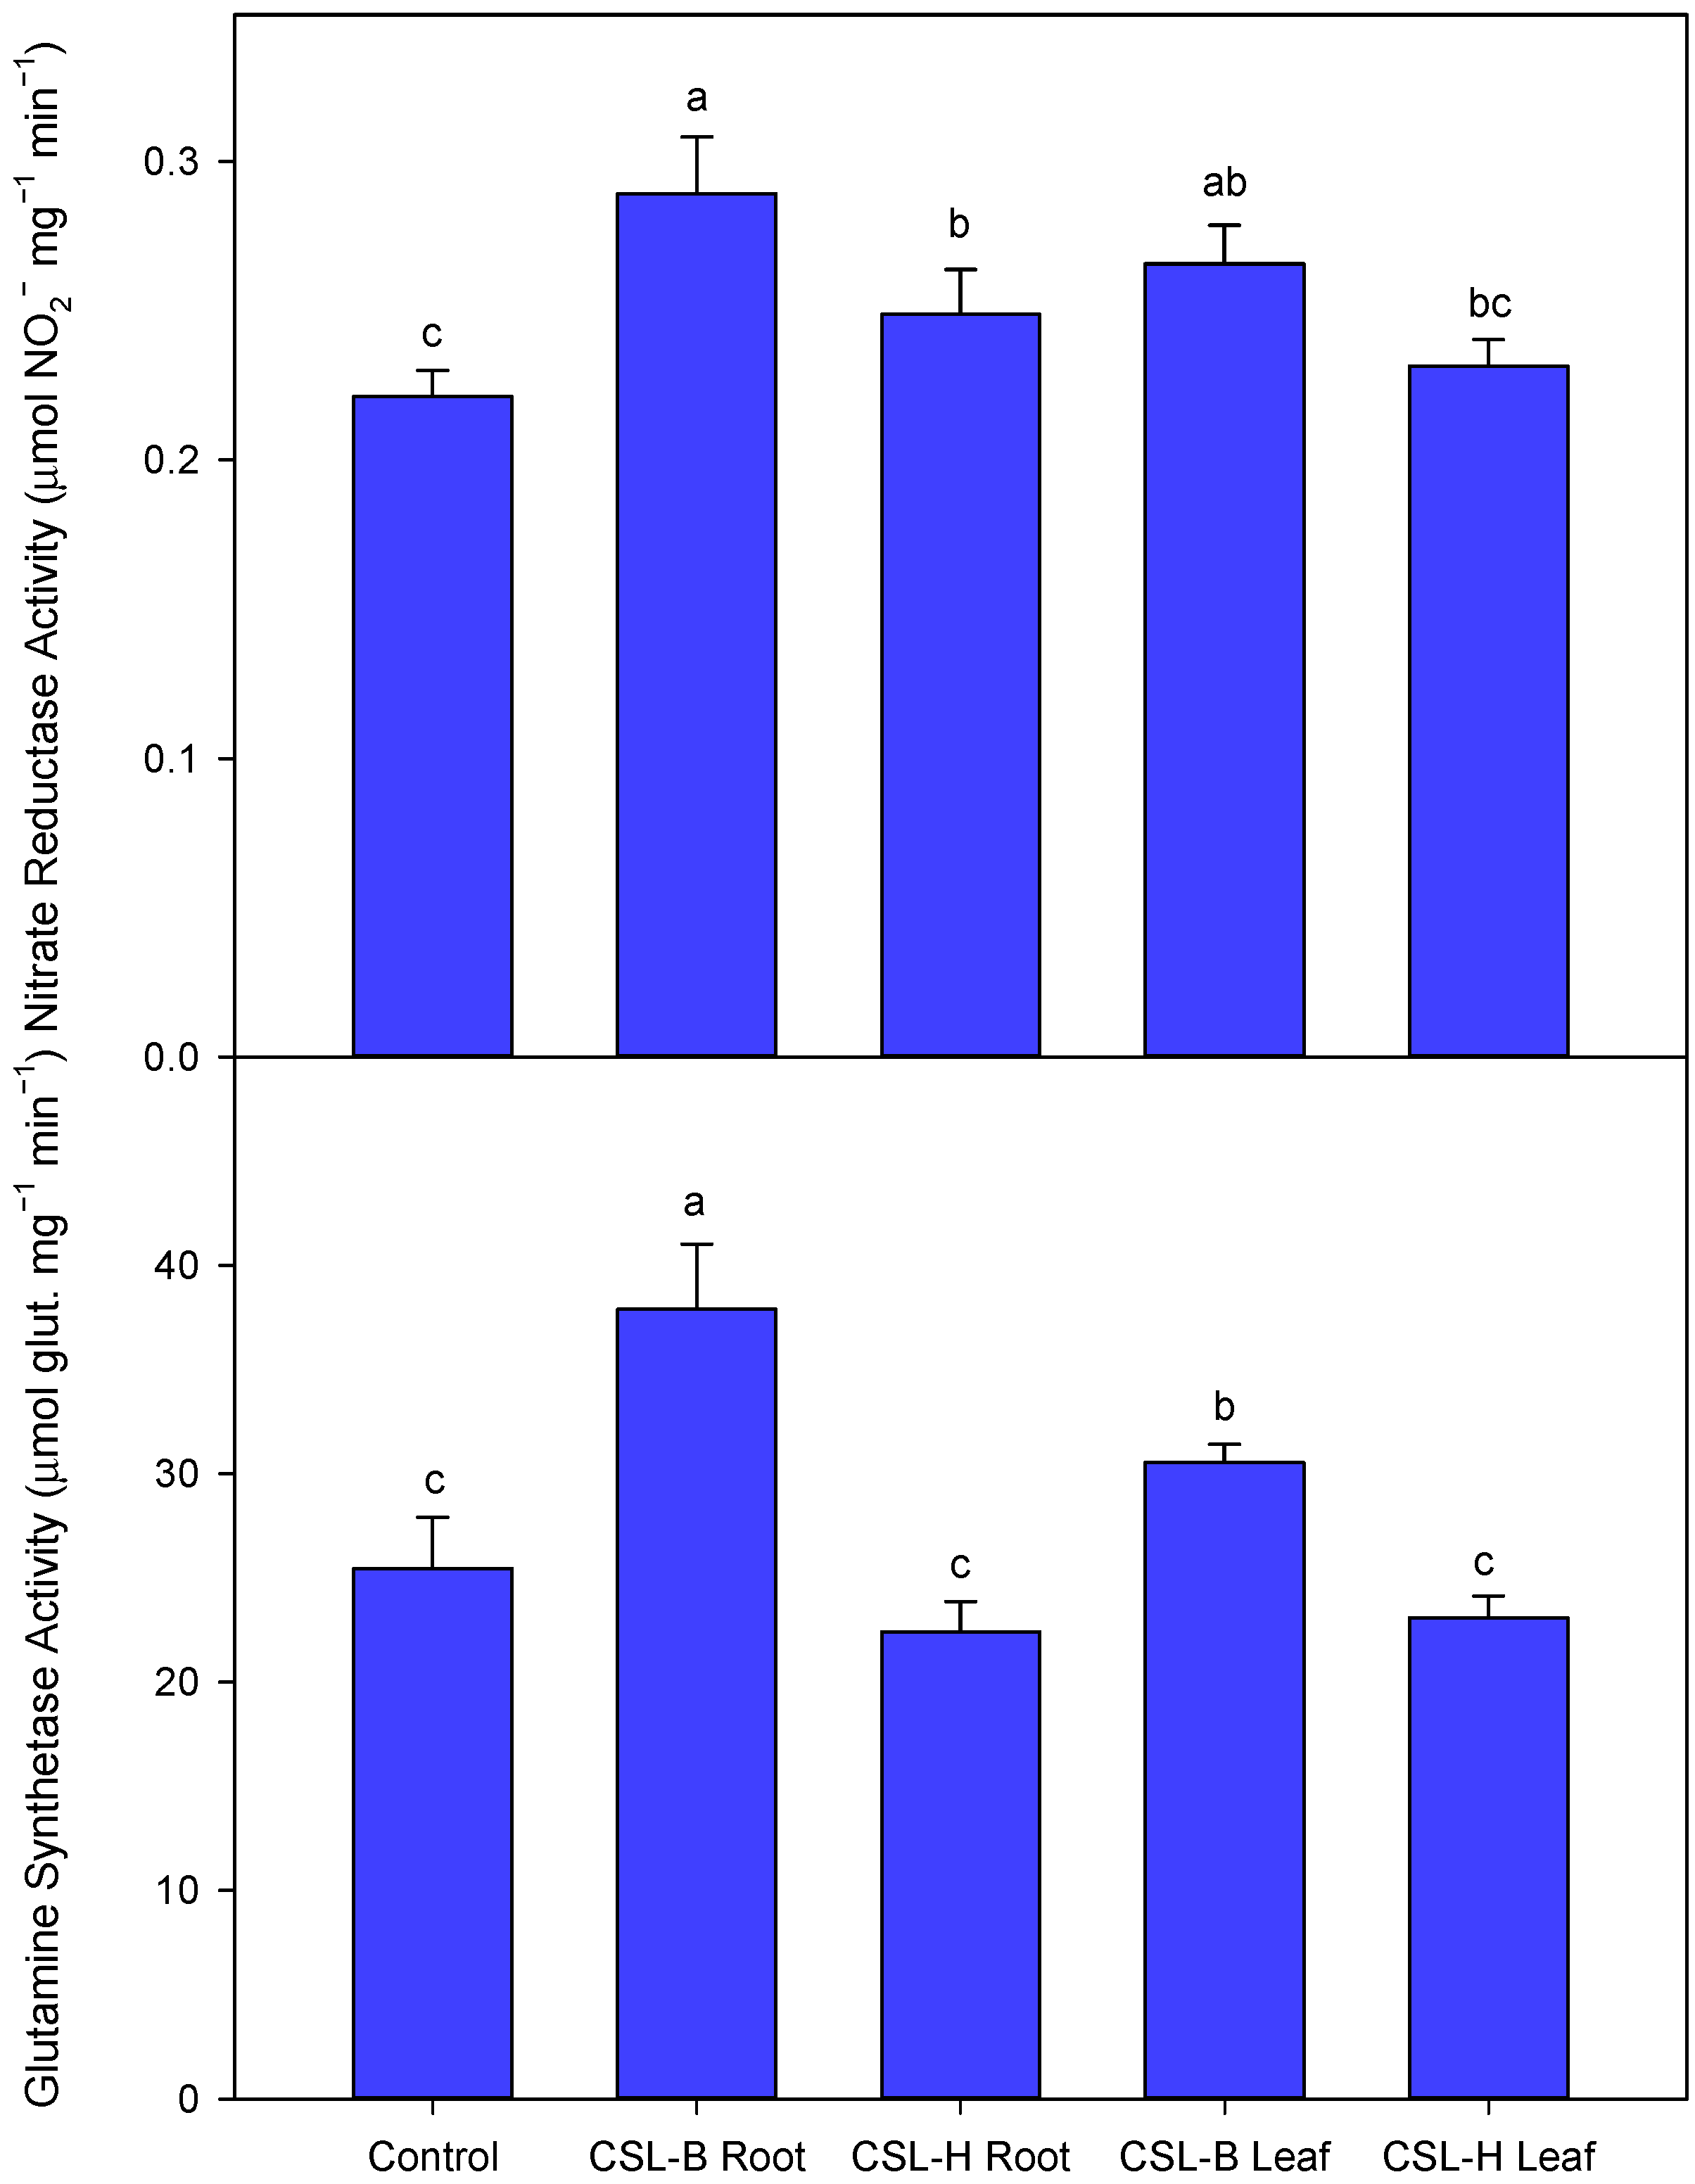
3.6. Enzymatic Activities Associated with Nitrogen Metabolism (Nitrate Reductase, NR, and Glutamine Synthetase, GS)

The application of CSL-B to the roots or foliage produced a significant increase in the NR and GS activities (Figure 2), relative to the rest of the treatments. Root application of CSL-H produced significantly higher values than the CSL-H foliar treatment and the control.

3.7. Aminogram

The CSL treatments gave rise to total amino acid concentrations higher than those of control plants (Table 6). Specifically:
  • Root application of CSL-B produced the highest values of proline, serine, and threonine;
  • Root application of CSL-H gave the highest concentrations of asparagine, aspartate, isoleucine, leucine, phenylalanine, proline, valine, and cysteine;
  • Foliar application of CSL-B produced the highest values of asparagine, phenylalanine, and tryptophan;
  • The foliar CSL-H treatment produced the highest values of alanine, glycine, histidine, lysine, phenylalanine, serine, and tryptophan.

3.8. Concentrations of Nutrients

The total nitrogen concentration was not altered by the treatments. The concentration of nitrate was highest for the plants to which the CSL-H Root treatment was applied and was lowest for the plants of the CSL-B Root and CSL-B Foliar treatments (Table 7).
The foliar concentrations of P, K, Ca, and Mg were significantly higher for the plants to which CSL was applied, regardless of the treatment. The foliar application of CSL-H produced the highest concentrations of P, K, Ca, and Mg, although in some cases there were no significant differences with respect to the other CSL treatments, as in the case of K, where the concentration was not significantly different for CSL-H Root, and Mg, for CSL-B Root and CSL-B Foliar. The concentration of sulfur was highest for the CSL-B Root treatment.
The concentrations of the micronutrients Fe, Zn, and Mo were influenced significantly by the treatments. For these nutrients, the root application of CSL-B gave the highest concentrations, although they did not differ significantly from those of the CSL-H Foliar treatment for Fe and Zn.

4. Discussion

The CSL product derived from the corn industry is rich in a large number of compounds that have physiological activity in plants and that can, in turn, promote the action of microorganisms that are beneficial for plants [39]. In this work the pepper plants treated with the CSL products had greater vegetative growth (biomass of the aerial part, Table 1 and Figure 1) than the control plants to which no product was applied, revealing that these types of products can help plants reach their full growth potential. In other work, it has been seen that these products can act as biostimulants in different growing conditions and for very different types of plant. Ref. [40] used two fertilizers made with residues in a blackberry crop cultivated in soil under organic production conditions. One of them was made with CSL and the other with waste from the fish industry. The CSL fertilizer was stabilized through a biological fermentation process, giving rise to a biostimulant. The results show that the application of these products supplied the mineral nutrients necessary for the crop to develop. Ref. [41] compared organic fertilization in the form of CSL with conventional organic fertilization for Chinese cabbage plants grown in a floating hydroponic system. The most relevant effects were seen in the quality of the harvested product; the application of CSL increased the concentrations of aspartate, threonine, serine, glycine, valine, and ascorbic acid. There were no differences in the fresh and dry weights of the leaves or in the mineral concentrations. Ref. [42] observed that the application of CSL to a lettuce crop, growing in rockwool floating in a hydroponic nutrient solution, prevented the proliferation of Fusarium sp. and had a biostimulant effect by stimulating the beneficial microorganisms that grew in the substrate. Based on our experiment and the results of these researchers, we can conclude, based on the growth parameters (Table 1 and Figure 1), that application of the CSL products via the roots is more effective than foliar application, and that there are no differences in the growth of the plants between the CSL-B and CSL-H products, which differ due to the stabilization process to which they were subjected.
The beneficial effects of the application of CSL are due to the fact that it contains a wide variety of active ingredients with synergistic effects among themselves that enhance its action. Among the substances that it has been possible to quantify in the tested products, CSL-B and CSL-H, are free amino acids, humic and fulvic acids, organic nitrogen, potassium, and phosphorus. Among the free amino acids, those with the highest concentrations are aspartic acid, glutamic acid, serine, glycine, arginine, alanine, valine, leucine, and proline and the vitamin cocktail (B2, B3, B5, and B6). Other amino acids found at lower concentrations are histidine, methionine, phenylalanine, isoleucine, and hydroxyproline. Yet, in addition, other researchers have also detected acetic acid, lactic acid, ferulic acid, proteins, and other bioactive molecules [43,44,45]. All researchers, however, agree on the difficulty of analyzing these compounds due to the complexity of the matrix, and there are no reference materials or inter-laboratory tests to verify the results of the analysis. This lack of knowledge makes it necessary to know at least the mode of action of these products on plants in order to develop new biostimulants from them. The studies carried out on the use of CSL in agriculture have been focused on supplying this product as a source of organic fertilizer to replace the N, P, and K supplied by conventional fertilizers [40,41,42], and so it has been applied in large quantities. In our work, however, the application of these products was carried out to stimulate the physiological processes of the plants—directly, through the action of their compounds on the plants, or indirectly, through their effects on soil microorganisms. Thus, a low dose (5 mL L−1) was applied, which did not significantly increase the concentrations of N, P, K, and Ca of the Hoagland nutrient solution with respect to the control treatment, but did produce a series of physiological responses in the plants, including:
  • An increase in ACO2 without changes in Eleaf; therefore, there was an increase in the water use efficiency. There were no changes in the parameter Fv/Fm (Table 2 and Table 3).
  • An increase in the hormones AIA, tZ, GA1, GA3, and GA4 (Table 5).
  • An increase in the foliar concentrations of P, K, Ca, Mg, and S of 19, 19, 16, 41, and 15%, respectively, without reaching values toxic for plants (Table 7).
  • Changes in the aminogram, with increases in the concentrations of alanine, proline, and tryptophan of more than 30%, and a decrease of more than 30% for tyrosine and methionine, for the 4 CSL treatments. There were also differences among the treatments, with the concentrations of 7, 10, 4, and 9 amino acids increasing by more than 30% for the treatments CSL-B Root, CSL-H Root, CSL-B Foliar, and CSL-H Foliar, respectively (Table 6).
  • Increased NR and glutamine synthetase activity in the CSL-B Root treatment.
The responses described above indicate that the application of CSL, to the roots or foliage, stimulated and improved all the processes related to C metabolism, including gas exchange processes and the water use efficiency. This physiological process generates and supplies the energy and carbon assimilation necessary for plant growth [46]. Therefore, the increased metabolism of C and absorption of CO2 could be responsible for the greater biomass of the plants that were treated with CSL, with respect to the plants that were not. Another of the modes of action of these products is hormonal activation and regulation, since a strong increase in gibberellins and cytokinins, which are related to cell elongation and division, was observed, and this would stimulate gas exchange processes and, therefore, plant growth [47]. These results, implying the activation of C metabolism, are also supported by the aminograms of the leaves. Amino acids are essential due to their roles in plant growth, with functions in primary metabolism—such as chlorophyll synthesis; photosynthetic activity; control of water relations in the plant; synthesis of growth hormones, such as auxin; and protein synthesis—while also acting as precursors of other amino acids [48,49]. Increases in alanine, phenylalanine, and tryptophan were the common response for CSL-treated plants. Alanine is an amino acid that intervenes in the pyruvate pathway, and in plants, it can have physiological functions related to the synthesis of chlorophylls, photosynthetic activity, and the protection of plants against different abiotic stresses [50]. Tryptophan belongs to the shikimate pathway. Its functions within plants are related to the synthesis of auxin precursors, which favors plant growth through stomatal regulation and ion transport, lignin synthesis, signaling processes, and the defense against abiotic and biotic stresses [51]. Proline is an amino acid that acts as a structural component of proteins. It is involved in osmotic adjustment, protection of cell membranes, and deactivation of reactive oxygen species (ROS), and acts as a nitrogen reserve compound [52].
In addition, it should be noted that the application of CSL-H to the roots was the only treatment that increased the concentrations of arginine, isoleucine, leucine, and cysteine. These amino acids, belonging to the aspartic family, form part of the pyruvate pathway and the Calvin cycle, and are, thus, related to the metabolism of C and N [53]. This indicates that the CSL-H Root treatment was the one that most stimulated the metabolism of the plants. However, no significant differences from the other CSL treatments were seen, probably because the length of the assay, 7 days, was not enough to observe differences among the plants. The responses of the plants to CSL indicate that its application could be effective in helping plants to adapt to adverse environmental conditions, since the amino acids proline and isoleucine have a strong osmoprotective character [54]. In fact, ref. [55] observed that the application of proline to tomato plants supplied with saline water enabled them to adapt to these conditions due to a decrease in oxidative stress.
Regarding mineral nutrition (macro and micronutrients), the plants of all the treatments showed values within the normal range for each of the elements analyzed [56] (Table 7). The CSL treatments increased the concentrations of some nutrients (P, K, Ca, Mg, and S), with respect to control plants, without producing toxicities. Taking into account that the application of CSL to the nutrient solution was only 5 mL L−1, these increases cannot be explained solely by the amount of extra mineral nutrients provided by the CSL. This indicates that the active substances of the CSL could have increased the uptake of mineral elements by the roots. Therefore, this increase in foliar nutrient concentrations could be related to the stimulation capacity of the CSL products with regard to plants and/or to their effect on soil microorganisms, thus supporting our hypothesis that the application of CSL at low doses stimulates physiological and biochemical processes.

5. Conclusions

The results obtained show that the CSL-B and CSL-H products, regardless of the form of application (root and/or foliar), can be part of biostimulant formulations aimed at improving the growth of horticultural plants. These CSL products are made up of a wide variety of active materials—such as free amino acids, humic and fulvic acids, vitamins, organic nitrogen, potassium, and phosphorus—that can stimulate plant growth. It seems that their mode of action is related to the stimulation of C metabolism, increased hormone synthesis, and an increased net CO2 assimilation rate. Their application at a concentration as low as 5 mL L−1 resulted in an increase in the foliar concentration of nutrients, supporting the idea that their effects are related to the stimulation of physiological processes.

Author Contributions

Conceptualization, E.N.-L., J.M.C.-Z. and F.G.-S.; methodology, E.N.-L., J.M.C.-Z. and F.G.-S.; software, I.N.-M., V.N.-P. and R.P.-M.; validation, R.P.-M., E.N.-L. and B.B.; formal analysis, I.N.-M., V.N.-P. and R.P.-M.; investigation, I.N.-M., V.N.-P. and R.P.-M.; resources, I.N.-M., R.P.-M., J.M.C.-Z. and F.G.-S.; data curation, E.N.-L. and B.B.; writing—original draft preparation, I.N.-M., V.N.-P. and R.P.-M.; writing—review and editing, E.N.-L., B.B., J.M.C.-Z. and F.G.-S.; visualization, I.N.-M., V.N.-P., R.P.-M., E.N.-L. and B.B.; supervision, J.M.C.-Z. and F.G.-S.; project administration, J.M.C.-Z. and F.G.-S.; funding acquisition, J.M.C.-Z. and F.G.-S. All authors have read and agreed to the published version of the manuscript.

Funding

This research received no external funding.

Data Availability Statement

No new data were created or analyzed in this study. Data sharing is not applicable to this article.

Conflicts of Interest

The authors declare no conflict of interest.

References

  1. Cornejo-Villegas, M.; Rincón-Londoño, N.; Real-López, D.; Rodríguez-García, M.E. The efect of Ca2+ ions on the pasting, morphological, structural, vibrational, and mechanical properties of corn starch-water system. J. Cereal Sci. 2018, 79, 174–182. [Google Scholar] [CrossRef]
  2. Martínez-Arcos, A.; Moldes, A.B.; Vecino, X. Adding value to secondary streams of corn wet milling industry. CyTA-J. Food 2021, 19, 675–681. [Google Scholar] [CrossRef]
  3. Lawford, H.G.; Rousseau, J.D. Corn steep liquor as a cost-efective nutrition adjunct in high-performance Zymomonas ethanol fermentation. Appl. Biochem. Biotech. 1997, 63–65, 287–304. [Google Scholar] [CrossRef]
  4. Maddipati, P.; Atiyeh, H.K.; Bellmer, D.N.; Huhnke, R.L. Ethanol production from Syngas by Clostridium strain P11 using corn steep liquor as a nutrient replacement to yeast extract. Bioresour. Technol. 2011, 102, 6494–6501. [Google Scholar] [CrossRef] [PubMed]
  5. Hofer, A.; Hauer, S.; Kroll, P.; Fricke, J.; Herwig, C. In-depth characterization of the raw material corn steep liquor and its bioavailability in bioprocesses of Penicillium chrysogenum. Process Biochem. 2018, 70, 20–28. [Google Scholar] [CrossRef]
  6. Sekoai, P.T.; Ayeni, A.O.; Daramola, M.O. Parametric optimization of citric acid production from apple pomace and corn steep liquor by a wild type strain of Aspergillus niger: A response surface methodology approach. Int. J. Eng. Res. Afr. 2018, 36, 98–113. [Google Scholar] [CrossRef]
  7. López-Prieto, A.; Martínez-Padrón, H.; Rodríguez-López, L.; Moldes, A.B.; Cruz, J.M. Isolation and characterization of a microorganism that produces biosurfactants in corn steep water. CyTA-J. Food 2019, 17, 509–516. [Google Scholar] [CrossRef]
  8. Hull, S.R.; Yang, B.Y.; Venzke, D.; Kulhavy, K.; Montgomery, R. Composition of corn steep water during steeping. J. Agr. Food Chem. 1996, 44, 1857–1863. [Google Scholar] [CrossRef]
  9. Shin, H.D.; McClendon, S.; Le, T.; Taylor, F.; Chen, R.R. A complete enzymatic recovery of ferulic acid from corn residues with extracellular enzymes from Neosartorya spinosa NRRL 185. Biotechnol. Bioeng. 2006, 95, 1108–1115. [Google Scholar] [CrossRef]
  10. Amiri, A.; Bundur, Z.B. Use of corn-steep liquor as an alternative carbon source for biomineralization in cement-based materials and its impact on performance. Constr. Build. Mater. 2018, 165, 655–662. [Google Scholar] [CrossRef]
  11. Obayori, O.S.; Ilori, M.O.; Adebusoye, S.A.; Oyetibo, G.O.; Omotayo, A.E.; Amund, O.O. Efects of corn steep liquor on growth rate and pyrene degradation by Pseudomonas strains. Curr. Microbiol. 2010, 60, 407–411. [Google Scholar] [CrossRef]
  12. Obayori, O.S.; Salam, L.B.; Anifowoshe, W.T.; Odunewu, Z.M.; Amosu, O.E.; Ofulue, B.E. Enhanced degradation of petroleum hydrocarbons in corn-steep-liquor-treated soil microcosm. Soil Sediment Contam. 2015, 24, 731–743. [Google Scholar] [CrossRef]
  13. Hamedani, S.R.; Rouphael, Y.; Colla, G.; Colantoni, A.; Cardarelli, M. Biostimulants as a tool for improving environmental sustainability of greenhouse vegetable crops. Sustainability 2020, 12, 5101. [Google Scholar] [CrossRef]
  14. Kocira, S.; Szparaga, A.; Findura, P.; Treder, K. Modification of yield and fiber fractions biosynthesis in Phaseolus vulgaris by treatment with biostimulants containing amino acids and seaweed extract. Agronomy 2020, 10, 1338. [Google Scholar] [CrossRef]
  15. Caradonia, F.; Ronga, D.; Flore, A.; Barbieri, R.; Moulin, L.; Terzi, V.; Francia, E. Biostimulants and cherry rootstock increased tomato fruit yield and quality in sustainable farming systems. Ital. J. Agron. 2020, 15, 121–131. [Google Scholar] [CrossRef]
  16. Poberezny, J.; Szczepanek, M.; Wszelaczynska, E.; Prus, P. The quality of carrot after field biostimulant application and after storage. Sustainability 2020, 12, 1386. [Google Scholar] [CrossRef]
  17. Francesca, S.; Arena, C.; Hay Mele, B.; Schettini, C.; Ambrosino, P.; Barone, A.; Rigano, M.M. The use of a plant-based biostimulant improves plant performances and fruit quality in tomato plants grown at elevated temperatures. Agronomy 2020, 10, 363. [Google Scholar] [CrossRef]
  18. Du Jardin, P. Plant biostimulants: Definition, concept, main categories and regulation. Sci. Hort. 2015, 196, 3–14. [Google Scholar] [CrossRef]
  19. Zarzecka, K.; Gugala, M.; Mystkowska, I.; Sikorska, A. Total and true protein content in potato tubers depending on herbicides and biostimulants. Agronomy 2020, 10, 1106. [Google Scholar] [CrossRef]
  20. Conesa, M.R.; Espinosa, P.J.; Pallarés, D.; Pérez-Pastor, A. Influence of plant biostimulant as technique to harden citrus nursery plants before transplanting to the field. Sustainability 2020, 12, 6190. [Google Scholar] [CrossRef]
  21. Soppelsa, S.; Kelderer, M.; Testolin, R.; Zanotelli, D.; Andreotti, C. Effect of biostimulants on apple quality at harvest and after storage. Agronomy 2020, 10, 1214. [Google Scholar] [CrossRef]
  22. Dalal, A.; Bourstein, R.; Haish, N.; Shenhar, I.; Wallach, R.; Moshelion, M. Dynamic physiological phenotyping of drought-stressed pepper plants treated with “productivity-enhancing” and “survivability-enhancing” biostimulants. Front. Plant Sci. 2019, 10, 905. [Google Scholar] [CrossRef]
  23. Cozzolino, E.; Giordano, M.; Fiorentino, N.; El-Nakhel, C.; Pannico, A.; Di Mola, I.; Mori, M.; Kyriacou, M.C.; Colla, G.; Rouphael, Y. Appraisal of biodegradable mulching films and vegetal-derived biostimulant application as eco-sustainable practices for enhancing lettuce crop performance and nutritive value. Agronomy 2020, 10, 427. [Google Scholar] [CrossRef]
  24. Rouphael, Y.; Giordano, M.; Cardarelli, M.; Cozzolino, E.; Mori, M.; Kyriacou, M.; Bonini, P.; Colla, G. Plant-and seaweed-based extracts increase yield but differentially modulate nutritional quality of greenhouse spinach through biostimulant action. Agronomy 2018, 8, 126. [Google Scholar] [CrossRef]
  25. Hellequin, E.; Monard, C.; Chorin, M.; Lebris, N.; Daburon, V.; Klarzynski, O.; Binet, F. Responses of active soil microorganisms facing to a soil biostimulant input compared to plant legacy effects. Sci. Rep. 2020, 10, 13727. [Google Scholar] [CrossRef]
  26. Campobenedetto, C.; Grange, E.; Mannino, G.; van Arkel, J.; Beekwilder, J.; Karlova, R.; Garabello, C.; Contartese, V.; Bertea, C.M. A biostimulant seed treatment improved heat stress tolerance during cucumber seed germination by acting on the antioxidant system and glyoxylate cycle. Front. Plant Sci. 2020, 11, 836. [Google Scholar] [CrossRef] [PubMed]
  27. Zhu, M.-M.; Liu, E.-Q.; Bao, Y.; Duan, S.-L.; She, J.; Liu, H.; Wu, T.-T.; Cao, X.-Q.; Zhang, J.; Li, B.; et al. Low concentration of corn steep liquor promotes seed germination, plant growth, biomass production and flowering in soybean. Plant Growth Regul. 2019, 87, 29–37. [Google Scholar] [CrossRef]
  28. Strasser, R.; Srivastava, A.; Tsimilli-Michael, M. The fluorescence transient as a tool to characterize and screen photosynthetic samples. In Probing Photosynthesis: Mechanism, Regulation and Adaptation, 1st ed.; Yunus, M., Pathre, U., Mohanty, P., Eds.; Taylor & Francis: London, UK, 2000; pp. 443–480. [Google Scholar]
  29. Marcelis, D.F.M.; Heuvelink, E.; Goudriaan, J. Modelling biomass production and yield of horticultural crops: A review. Sci. Hortic. 1998, 74, 83–111. [Google Scholar] [CrossRef]
  30. Fu, J.; Huang, B. Involvement of antioxidants and lipid peroxidation in the adaptation of two cool-season grasses to localized drought stress. Environ. Exp. Bot. 2001, 45, 105–114. [Google Scholar] [CrossRef]
  31. Mukherjee, S.P.; Choudhuri, M.A. Implications of water stress-induced changes in the levels of endogenous ascorbic acid and hydrogen peroxide in Vigna seedlings. Physiol. Plant. 1983, 58, 166–170. [Google Scholar] [CrossRef]
  32. Barrameda-Medina, Y.; Montesinos-Pereira, D.; Romero, L.; Blasco, B.; Ruiz, J.M. Role of GSH homeostasis under Zn toxicity in plants with different Zn tolerance. Plant Sci. 2014, 227, 110–121. [Google Scholar] [CrossRef] [PubMed]
  33. Ghanem, M.E.; Albacete, A.; Martínez-Andújar, C.; Acosta, M.; Romero-Aranda, R.; Dodd, I.C.; Lutts, S.; Pérez-Alfocea, F. Hormonal changes during salinity-induced leaf senescence in tomato (Solanum lycopersicum L.). J. Exp. Bot. 2008, 59, 3039–3050. [Google Scholar] [CrossRef] [PubMed]
  34. Bieleski, R.L.; Turner, N.A. Separation and estimation of amino acids in crude plant extracts by thin-layer electrophoresis and chromatography. Anal. Biochem. 1996, 17, 278–293. [Google Scholar] [CrossRef] [PubMed]
  35. Navarro-León, E.; Barrameda-Medina, Y.; Lentini, M.; Esposito, S.; Ruiz, J.M.; Blasco, B. Comparative study of Zn deficiency in L. sativa and B. oleracea plants: NH4+ assimilation and nitrogen derived protective compounds. Plant Sci. 2016, 248, 8–16. [Google Scholar] [CrossRef]
  36. Wolf, B. A comprehensive system of leaf analyses and its use for diagnosing crop nutrient status. Commun. Soil Sci. Plan. 1982, 13, 1035–1059. [Google Scholar] [CrossRef]
  37. Krom, M.D. Spectrophotometric determination of ammonia: A study of a modified Berthelot reaction using salicylate and dichloroisocyanurate. Analysis 1980, 105, 305–316. [Google Scholar] [CrossRef]
  38. Cataldo, D.A.; Maroon, M.; Schrader, L.E.; Youngs, V.L. Rapid colorimetric determination of nitrate in plant tissue by nitration of salicylic acid. Commun. Soil Sci. Plan. 1975, 6, 71–80. [Google Scholar] [CrossRef]
  39. Zhou, K.; Yu, J.; Ma, Y.; Cai, L.; Zheng, L.; Gong, W.; Liu, Q. Corn Steep Liquor: Green Biological Resources for Bioindustry. Appl. Biochem. Biotech. 2022, 194, 3280–3295. [Google Scholar] [CrossRef]
  40. Fernandez-Salvador, J.; Strick, B.C.; Bryla, D.R. Liquid Corn and Fish Fertilizers Are Good Options for Fertigation in Blackberry Cultivars Grown in an Organic Production System. HortScience 2015, 50, 225–233. [Google Scholar] [CrossRef]
  41. Kano, K.; Kitazawa, H.; Suzuki, K.; Widiastuti, A.; Odani, H.; Zhou, S.; Chinta, Y.D.; Eguchi, Y.; Shinohara, M.; Sato, T. Effects of Organic Fertilizer on Bok Choy Growth and Quality in Hydroponic Cultures. Agronomy 2021, 11, 491. [Google Scholar] [CrossRef]
  42. Chinta, Y.D.; Kano, K.; Widiastuti, A.; Fukahori, M.; Kawasaki, S.; Eguchi, Y.; Misu, H.; Odani, H.; Zhou, S.; Narisawa, K.; et al. Effect of corn steep liquor on lettuce root rot (Fusarium oxysporum f. sp. lactucae) in hydroponic cultures. J. Sci. Food Agr. 2014, 94, 2317–2323. [Google Scholar] [CrossRef] [PubMed]
  43. Zhang, J.; Zhou, J.W.; Liu, J.; Chen, K.J.; Liu, L.M.; Chen, J.A. Development of chemically defined media supporting high cell density growth of Ketogulonicigenium vulgare and Bacillus megaterium. Bioresour. Technol. 2011, 102, 4807–4814. [Google Scholar] [CrossRef] [PubMed]
  44. Xiao, X.; Hou, Y.Y.; Liu, Y.; Liu, Y.J.; Zhao, H.Z.; Dong, L.; Du, J.; Wang, Y.; Bai, G.; Luo, G.A. Classification and analysis of corn steep liquor by UPLC/Q-TOF MS and HPLC. Talanta 2013, 107, 344–348. [Google Scholar] [CrossRef] [PubMed]
  45. Hofer, A.; Herwiga, C. Quantitative determination of nine water-soluble vitamins in the complex matrix of corn steep liquor for rawmaterial quality assessment. J. Chem. Technol. Biot. 2017, 92, 2106–2113. [Google Scholar] [CrossRef]
  46. Cho, M.-H.; Park, H.L.; Hahn, T.-R. Engineering leaf carbon metabolism to improve plant productivity. Plant Biotechnol. Rep. 2015, 9, 1–10. [Google Scholar] [CrossRef]
  47. Blázquez, M.A.; Nelson, D.C.; Weijers, D. Evolution of plant hormone response pathways. Annu. Rev. Plant Biol. 2020, 71, 327–353. [Google Scholar] [CrossRef]
  48. Iqbal, A.; Qiang, D.; Alamzeb, M.; Xiangru, W.; Huiping, G.; Hengheng, Z.; Nianchang, P.; Xiling, Z.; Meizhen, S. Untangling the molecular mechanisms and functions of nitrate to improve nitrogen use efficiency. J. Sci. Food Agr. 2020, 100, 904–914. [Google Scholar] [CrossRef]
  49. The, S.V.; Snyder, R.; Tegeder, M. Targeting nitrogen metabolism and transport processes to improve plant nitrogen use efficiency. Front. Plant Sci. 2021, 11, 628366. [Google Scholar] [CrossRef]
  50. D’Mello, J.P.F. (Ed.) Amino Acids in Higher Plants; CABI International: Edinburgh, UK, 2015. [Google Scholar]
  51. Mustafa, A.; Hussain, A.; Naveed, M.; Ditta, A.; Nazli, Z.E.H.; Sattar, A. Response of okra (Abelmoschus esculentus L.) to soil and foliar applied L-tryptophan. Soil Environ. 2016, 35, 76–84. [Google Scholar]
  52. Lehmann, S.; Funck, D.; Szabados, L.; Rentsch, D. Proline metabolism and transport in plant development. Amino Acids 2010, 39, 949–962. [Google Scholar] [CrossRef]
  53. Van der Sar, S.; Kim, H.K.; Meissner, A.; Verpoorte, R.; Choi, Y.H. Nuclear Magnetic Resonance spectroscopy for plant metabolite profiling. In The Handbook of Plant Metabolomics, 1st ed.; Weckwerth, W., Kahl, G., Eds.; Wiley-VCH: Weinheim, Germany, 2013; pp. 57–76. [Google Scholar]
  54. Pervaiz, A.; Iqbal, A.; Khalid, A.; Manzoor, A.; Noreen, S.; Ayaz, A.; Zafar, Z.U.; Athar, H.; Ashraf, M. Proline induced modulation in physiological responses in wheat plants. J. Agric. Environ. Sci. 2019, 8, 112–119. [Google Scholar] [CrossRef]
  55. Alfosea-Simón, M.; Simón-Grao, S.; Zavala-Gonzalez, E.A.; Cámara-Zapata, J.M.; Simón, I.; Martínez-Nicolás, J.J.; Lidón, V.; Rodríguez-Ortega, W.M.; García-Sánchez, F. Application of biostimulants containing amino acids to tomatoes could favor sustainable cultivation: Implications for tyrosine, lysine, and methionine. Sustainability 2020, 12, 9729. [Google Scholar] [CrossRef]
  56. Epstein, E.; Bloom, A.J. Mineral Nutrition of Plants: Principles and Perspectives, 2nd ed.; Sinauer Associates: Sunderland, MA, USA, 2005. [Google Scholar]
Figure 1. Appearance of the plants at the end of the experiment.
Horticulturae 09 00221 g001
Figure 2. Activity of nitrate reductase (NR) and glutamine synthetase (GS). The values represent the means ± standard deviation (SD) for n = 3. The differences between the treatments were analyzed with Fisher’s least significant difference test (LSD; p = 0.05); in each graph, significant differences between treatments at p < 0.05 are indicated. In the ANOVA, the significance level is represented by p < 0.001 (***).
Horticulturae 09 00221 g002
Table 1. Biomass of the aerial part, 7 days after the last application of the treatments to the plants.
TreatmentBiomass of the Aerial Part (Dry Weight)
(g Plant¹)
Leaf Area
(dm2)
Specific Leaf Area
(dm² g¹)
Control4.1 ± 0.7 c10.4 ± 0.1 d0.23 ± 0.01 a
CSL-B Root6.7 ± 0.7 a12.6 ± 0.3 a0.12 ± 0.01 c
CSL-B Foliar5.1 ± 0.3 b11.0 ± 0.1 c0.22 ± 0.01 a
CSL-H Root6.4 ± 0.9 a12.1 ± 0.2 b0.13 ± 0.01 c
CSL-H Foliar5.3 ± 0.7 b11.4 ± 0.2 c0.16 ± 0.01 b
p-value*********
The values represent the means ± standard deviations (SD) (n = 8). The differences between treatments were analyzed with Fisher’s least significant difference test (LSD; p = 0.05); different letters in each column indicate significant differences between treatments at p < 0.05. In the ANOVA, the significance level is represented by *** (p < 0.001).
Table 2. Gas exchange parameters of the plants according to the treatment. A: net assimilation of CO2, E: leaf transpiration, gs: stomatal conductance, WUE: water use efficiency.
TreatmentA
(mmol m−2 s−1)
E
(mmol m−2 s−1)
gs
(mmol m−2 s−1)
WUE
(μmol mmol−1)
Control3.8 ± 0.3 c0.28 ± 0.03 ab24 ± 3 ab13.5 ± 0.3 d
CSL-B Root6.6 ± 0.9 a0.29 ± 0.05 ab24 ± 5 ab22.6 ± 0.8 a
CSL-B Foliar5.1 ± 0.4 b0.25 ± 0.05 b21 ± 6 b20.5 ± 1.6 b
CSL-H Root5.9 ± 0.7 ab0.35 ± 0.02 a29 ± 2 a16.8 ± 1.3 c
CSL-H Foliar5.1 ± 0.6 b0.29 ± 0.03 ab32 ± 4 ab17.7 ± 0.8 c
p-value*******
The values represent the means ± standard deviations (SD) (n = 6). The differences between treatments were analyzed with Fisher’s least significant difference test (LSD; p = 0.05); in each column, different letters indicate significant differences between treatments at p < 0.05. In the ANOVA, the significance levels are represented by *, **, and *** (p < 0.05, 0.01, and 0.001).
Table 3. Plant photochemical activity measured, 7 days after the last application of the treatments, as Chl a fluorescence: Fv/Fm, quantum yield of primary photosynthesis; RC/ABS, active reaction centers of photosystems; PIABS, photosynthetic performance index; 1–Vj, electron output from photosystem II.
TreatmentFv/FmRC/ABSPIABS1–Vj
Control0.809 ± 0.0090.74 ± 0.05 b4.7 ± 0.8 b0.70 ± 0.02
CSL-B Root0.820 ± 0.0050.85 ± 0.04 a8.5 ± 1.3 a0.69 ± 0.02
CSL-B Foliar0.811 ± 0.0030.77 ± 0.07 ab6.0 ± 1.0 b0.66 ± 0.02
CSL-H Root0.814 ± 0.0030.83 ± 0.06 a8.2 ± 1.3 a0.69 ± 0.02
CSL-H Foliar0.816 ± 0.0040.81 ± 0.05 ab7.7 ± 1.1 a0.67 ± 0.03
p-valueNS***NS
The values represent the means ± standard deviations (SD) (n = 6). The differences between treatments were analyzed with Fisher’s least significant difference test (LSD; p = 0.05); in each column, different letters indicate significant differences between treatments at p < 0.05. In the ANOVA, the significance levels are represented by p < 0.05 and 0.01 (* and **, respectively), and “NS” indicates no significant differences.
Table 4. Oxidative stress indicators, 7 days after the last application of the treatments.
TreatmentMDA
(µmol g¹ FW)
Concentration of O2
(µg g¹ FW)
Concentration of H2O2
(µg g¹ FW)
Control3.2 ± 0.25.5 ± 0.6124 ± 9
CSL-B Root3.4 ± 0.45.2 ± 0.6117 ± 9
CSL-B Foliar3.4 ± 0.65.4 ± 0.3114 ± 13
CSL-H Root3.1 ± 0.15.9 ± 0.9117 ± 6
CSL-H Foliar3.6 ± 0.55.4 ± 0.2121 ± 15
p-valueNSNSNS
The values represent the means ± standard deviations (SD) (n = 8). In the ANOVA, “NS” indicates no significant differences between treatments.
Table 5. Hormonal profile, 7 days after the last application of the treatments. IAA: indoleacetic acid (auxin); tZ: trans-zeatin; Ip: isopentenyl adenine; GA: gibberellin; ABA: abscisic acid; ACC: aminocyclopropane carboxylic acid; JA: jasmonic acid; SA: salicylic acid.
ControlCSL-B
Root
CSL-B
Foliar
CSL-H
Root
CSL-H
Foliar
p-Value
AIA1.5 ± 0.1 c2.2 ± 0.4 a1.8 ± 0.2 b2.0 ± 0.2 a1.9 ± 0.3 b***
tZ480 ± 10 d820 ± 20 a710 ± 20 b820 ± 20 a680 ± 20 c***
iP0.58 ± 0.030.62 ± 0.030.61 ± 0.020.62 ± 0.050.61 ± 0.07NS
GA10.31 ± 0.03 c0.52 ± 0.03 a0.40 ± 0.02 b0.50 ± 0.02 a0.41 ± 0.02 b***
GA30.13 ± 0.03 d0.21 ± 0.03 bc0.18 ± 0.02 c0.23 ± 0.03 a0.18 ± 0.02 c***
GA40.22 ± 0.01 c0.46 ± 0.06 a0.30 ± 0.02 b0.41 ± 0.03 a0.32 ± 0.01 b***
ABA57 ± 360 ± 262 ± 260 ± 259 ± 2NS
ACC14.5 ± 0.214.7 ± 0.115.2 ± 0.214.9 ± 0.615.3 ± 0.6NS
JA410 ± 6403 ± 6400 ± 4393 ± 4409 ± 6NS
SA3300 ± 3003300 ± 2003300 ± 2003400 ± 3003300 ± 200NS
The values represent the means ± standard deviations (SD) (n = 8). The differences between treatments were analyzed with Fisher’s least significant difference test (LSD; p = 0.05); in each row, different letters indicate significant differences between treatments at p < 0.05. In the ANOVA, the significance level is represented by p < 0.001 (***), and “NS” indicates no significant differences.
Table 6. Aminogram of each of the treatments tested in this experiment. The data are from the last sampling, 7 days after the last application of the treatments.
ControlCSL-B
Root
CSL-H
Root
CSL-B
Foliar
CSL-H
Foliar
p-Value
Alanine20 ± 1 d47 ± 2 b51 ± 3 b31 ± 2 c71 ± 4 a***
Arginine3.2 ± 0.2 b2.7 ± 0.1 c4.7 ± 0.2 a1.3 ± 0.1 d1.3 ± 0.1 d***
Asparagine4.7 ± 0.2 bNdNd6.3 ± 0.3 aNd***
Aspartate53 ± 3 b56 ± 3 b61 ± 3 a31 ± 2 c57 ± 3 ab***
Glutamate236 ± 12 b275 ± 13 a238 ± 12 b69 ± 3 d186 ± 9 c***
GlycineNdNd42 ± 2 bNd58 ± 3 a***
Histidine3.2 ± 0.2 c4.2 ± 0.2 b3.5 ± 0.2 c2.0 ± 0.1 d5.9 ± 0.2 a***
Isoleucine560 ± 30 d630 ± 30 c810 ± 40 a720 ± 40 b670 ± 30 bc***
Leucine820 ± 40 d920 ± 50 c1180 ± 60 a1060 ± 50 b970 ± 50 bc***
Lysine1.41 ± 0.07 b0.84 ± 0.04 d0.59 ± 0.03 e1.03 ± 0.05 c2.0 ± 0.1 a***
Phenylalanine179 ± 9 b187 ± 9 b220 ± 10 a220 ± 10 a220 ± 10 a***
Proline80 ± 4 d210 ± 10 a210 ± 10 a190 ± 10 b170 ± 9 c***
Serine14.8 ± 0.7 c23 ± 1 a17.4 ± 0.9 b12.4 ± 0.6 d24 ± 1 a***
Threonine7.4 ± 0.4 c11.9 ± 0.6 a10.0 ± 0.5 b4.7 ± 0.2 d10.1 ± 0.5 b***
Tryptophan244 ± 12 c336 ± 17 b327 ± 16 b510 ± 30 a520 ± 30 a***
Tyrosine331 ± 17 a148 ± 7 c176 ± 9 b134 ± 7 c184 ± 9 b***
Valine111 ± 6 e155 ± 5 c200 ± 10 a136 ± 7 d176 ± 9 b***
Methionine25 ± 1 a18 ± 1 b12 ± 1 c9 ± 1 d18 ± 1 b***
Cysteine1.16 ± 0.06 b1.03 ± 0.05 c1.53 ± 0.08 aNdNd***
4–OH Proline6.1 ± 0.3 c9.7 ± 0.5 a8.7 ± 0.4 b4.7 ± 0.2 d8.4 ± 0.4 b***
Total270 ± 100 d3000 ± 200 c3600 ± 200 a3200 ± 200 bc3400 ± 200 ab***
The values represent the means ± standard deviations (SD) (n = 8). The differences between treatments were analyzed with Fisher’s least significant difference test (LSD; p = 0.05); in each row, different letters indicate significant differences between treatments at p < 0.05. In the ANOVA, the significance level is represented by p < 0.001 (***).
Table 7. Foliar concentrations of macronutrients (mg g−1 DW) and micronutrients (µg g−1 DW), for each of the treatments tested.
TreatmentPKCaMgSNNO3
Control4.6 ± 0.2 d41 ± 2 c17.5 ± 0.7 c4.5 ± 0.2 c4.01 ± 0.2 e65 ± 2 b14.2 ± 0.3 b
CSL-B Root5.3 ± 0.2 bc47 ± 2 b19.2 ± 0.8 b6.7 ± 0.3 a5.2 ± 0.2 a65 ± 2 c12.8 ± 0.6 c
CSL-H Root5.1 ± 0.2 c50 ± 2 a19.3 ± 0.8 b5.7 ± 0.2 b4.5 ± 0.2 b63 ± 2 a16 ± 1 a
CSL-B Foliar5.6 ± 0.2 b46 ± 2 b21.3 ± 0.9 a6.3 ± 0.3 a4.2 ± 0.2 d63 ± 2 c12.9 ± 0.7 c
CSL-H Foliar6.0 ± 0.2 a51 ± 2 a21.2 ± 0.9 a6.7 ± 0.3 a4.8 ± 0.2 c64 ± 2 b14.9 ± 0.3 b
p-value*********************
FeCuMnZnMoB
Control88 ± 4 d59 ± 2106 ± 455 ± 2 c0.58 ± 0.02 c12.4 ± 0.4
CSL-B Root106 ± 4 a55 ± 1108 ± 473 ± 3 a1.12 ± 0.04 a11.1 ± 0.5
CSL-H Root95 ± 4 bc59 ± 2103 ± 464 ± 3 b0.91 ± 0.04 b14.0 ± 0.6
CSL-B Foliar90 ± 4 cd58 ± 2112 ± 463 ± 3 b0.89 ± 0.04 b12.6 ± 0.5
CSL-H Foliar100 ± 4 ab57 ± 2111 ± 473 ± 3 a0.66 ± 0.03 c13.1 ± 0.5
p-value**NSNS******NS
The values represent the means ± standard deviations (SD) (n = 8). The differences between treatments were analyzed with Fisher’s least significant difference test (LSD; p = 0.05); in each column, different letters indicate significant differences between treatments at p < 0.05. In the ANOVA, the significance levels are represented by p < 0.01 and 0.001 (**, ***), and “NS” indicates no significant differences.
Disclaimer/Publisher’s Note: The statements, opinions and data contained in all publications are solely those of the individual author(s) and contributor(s) and not of MDPI and/or the editor(s). MDPI and/or the editor(s) disclaim responsibility for any injury to people or property resulting from any ideas, methods, instructions or products referred to in the content.

