Article

Transcriptome Analysis Reveals Regulatory Networks and Hub Genes in the Flavonoid Metabolism of Rosa roxburghii

1
Key Laboratory of Plant Physiology and Development Regulation, Guizhou Normal University, Guiyang 550001, China
2
Laboratory of State Forestry Administration on Biodiversity Conservation in Mountainous Karst Area of Southwestern China, Guizhou Normal University, Guiyang 550001, China
3
School of Life Sciences, Guizhou Normal University, Guiyang 550001, China
4
Kiwifruit Breeding and Utilization Key Laboratory of Sichuan Province, Sichuan Provincial Academy of Natural Resource Sciences, Chengdu 610044, China
*
Authors to whom correspondence should be addressed.
Horticulturae 2023, 9(2), 233; https://doi.org/10.3390/horticulturae9020233
Submission received: 11 January 2023 / Revised: 6 February 2023 / Accepted: 7 February 2023 / Published: 9 February 2023
(This article belongs to the Section Genetics, Genomics, Breeding, and Biotechnology (G2B2))

Abstract

:
Rosa roxburghii Tratt, the most popular fruit that blooms in the southwest of China, has high antioxidant properties and is rich in different flavonoids. However, the regulatory network and critical genes that regulate the flavonoid biosynthesis of R. roxburghii are still unknown. In this study, HPLC analysis revealed that total flavonoids, anthocyanins, and catechin were enriched in mature fruits, flowers, and leaves, respectively. Differentially expressed genes (DEGs) between five organs of R. roxburghii involved in flavonoid metabolism were obtained by transcriptome sequencing. A total of 1130 DEGs were identified, including 166 flavonoid pathway biosynthesis genes, 622 transcription factors (TFs), 301 transporters, and 221 cytochrome P450 proteins. A weighted gene co-expression network analysis (WGCNA) of the DEGs was conducted to construct co-expression networks. Regarding enzymes in the biosynthesis of flavonoids, cytochrome P450 CYP749A22 and CYP72A219 were highlighted in the regulation of total flavonoids of mature fruits. Anthocyanin 3-O-glucosyltransferase and F3′H were the top two critical enzymes for anthocyanin accumulation in flowers. By contrast, caffeic acid 3-O-methyltransferase, 4-coumarate-CoA ligase, and shikimate O-hydroxycinnamoyltransferase were essential for catechin accumulation in leaves. Additionally, we analyzed the eigengene network of the “black” module, which had high correlations with total flavonoids (r = 0.9, p = 5 × 10⁻⁶). There were 26 eigengenes in the “black” module, consisting of 6 flavonoid biosynthesis, 14 TFs, and 6 transporters. Among them, the transcription factors RrWRKY45 (DN142829_c1_g5), RrTCP20 (DN146443_c1_g1), and RrERF118 (DN141507_c3_g2) were screened as the hub genes, which significantly correlated with total flavonoids in R. roxburghii. The present biochemical and transcriptomic data provide insights into functional genomics for breeding R. roxburghii with flavonoid accumulation.

1. Introduction

Rosa roxburghii Tratt, a deciduous shrub and Chinese ethnomedicine that belongs to the Rosacea family, is commercially cultivated and consumed in China. Many studies prove that flavonoids extracted from R. roxburghii are in multiple forms and have high antioxidant potential and other beneficial health properties. For example, they are reported to exert antioxidant functions, scavenge free radicles, reduce high cholesterol, and have antimutagenic properties [1]. Besides, they offer protection against radiation-induced apoptosis and inflammation [2,3,4]. Previous studies show that R. roxburghii is rich in different kinds of flavonoid compounds, including kaempferol, quercetin, anthocyanin, isoquercitrin, and procyanidin, which especially highly accumulate in fruits with a purity of 34.26% quercetin and 2.97% catechin [5,6,7,8]. Nevertheless, little information is available regarding the exact molecular mechanism underlying flavonoid accumulation in R. roxburghii.
Flavonoids, a kind of polyphenolic metabolite, play multiple physiological roles in plant development and are known for wide distribution, even in different organs [9]. Flavonoids comprise many compounds, including anthocyanins, isoflavones, flavanones, flavanols, catechin, and phenolic acid derivatives synthesized through the phenylpropanoid and different branched sub-pathways [10,11]. The precursors of most flavonoids are malonyl-CoA and ρ-coumaroyl-CoA, and the biosynthesis begins in the phenylpropanoid pathway. Some key biosynthesis enzymes directly regulate flavonoid accumulation. For example, chalcone synthase (CHS) deletion renders no flavonoid accumulation in Arabidopsis transparent testa4 plants [10]. In addition to flavonoid pathway-related enzymes, cytochrome P450 proteins, a large family of heme-containing monooxygenases, catalyze diverse types of chemical reactions and play an essential role in flavonoid metabolism in general [12]. The generations of ρ-coumaroyl-CoA and cinnamic acid 4-hydroxylase are catalyzed by CYP73A [13,14]. CYP98 is responsible for hydroxylating the 3′-position of the phenolic ring [15]. Kaempferol is transformed into quercetin through catalysis by CYP75A [16]. Cytochrome P450 proteins are also involved in the biosynthesis of flavones, such as (2S)-flavanone 2-hydroxylase and flavone synthase II (CYP93B), 3,9-dihydroxypterocarpan 6a-hydroxylase (CYP93A), and 2-hydroxyisoflavanone synthase (IFS) (CYP93C) [17].
The types and contents of flavonoids depend not only on the flavonoid biosynthesis enzymes but also on the bio-modification, transportation processes, and transcription factors [18]. H+-ATPases are the primary driving force to transport flavonoids [19]. ATP-binding cassette (ABC) and multidrug and toxic compound extrusion (MATE) transporters are also assumed to play essential roles in the sequestration of flavonoids into the vacuole [20,21,22]. Moreover, membrane vesicle-mediated (MVT), requiring vacuolar sorting receptor (VSR), and soluble N-ethylmaleimide sensitive factor attachment protein receptors (SNARE), are all implicated in flavonoid accumulation [23]. Glutathione S-transferase (GST) catalyzes the conjugation of the tripeptide glutathione as flavonoid binding proteins and is involved in flavonoid transport [24]. Besides, numerous transcription factors (TFs) influence the biosynthesis of flavonoid glycosides [25]. For example, v-myb avian myeloblastosis viral oncogene homologs (MYBs) activate the structural genes from the flavonoid pathway branch, rendering flavonoid generation [26]. In addition, MYBs interact with basic helix–loop–helix (bHLH) and WD40 proteins to form an MYB-bHLH-WD40 complex to regulate flavonoid metabolism [27,28,29]. Besides, NACs (NAM, ATAF1/2, and CUC2) enhance the transcripts of genes associated with flavonoid biosynthesis. The expression of some flavonoid biosynthesis genes and the content of anthocyanins are significantly increased in AtNAC overexpression transgenic Arabidopsis, whereas they are reduced when AtNAC is knockout, thus implying that AtNAC influences the accumulation of flavonoids [30].
Given that so many factors could influence flavonoid compounds, it is essential to reveal the critical genes that play important roles in determining the total flavonoid content in R. roxburghii. An R analytical package named weighted gene co-expression network analysis (WGCNA) is a systems biology approach aimed at understanding networks between genes instead of individual genes [31,32]. The highest degree nodes are often called ‘hubs’, and thought to serve specific purposes in their networks. Therefore, WGCNA has been widely used to determine different gene modules of highly correlated genes with a module eigengene (ME) and provides some highly connected hub genes [33,34]. The previous paper showed that ten transporters and seven TFs were critical genes in the anthocyanin accumulation of Lycium ruthenicum Murray [35]. Twenty-four genes encoding proteins putatively associated with anthocyanin regulation, biosynthesis, and transport were critical for anthocyanin in an apple (Malus × domestica) yellow fruit somatic mutation [36].
Given that the distributions of flavonoids vary differently among various tissues, the transcriptome of the R. roxburghii stem, leaf, flower, young fruit, and mature fruit has been conducted using the Illumina HiSeq 3000 platform [37]. In this study, differentially expressed genes were identified to obtain insights into the flavonoid metabolites and transcriptional regulation in R. roxburghii. Furthermore, we obtained flavonoid-related co-expression gene modules and screened some critical genes involved in flavonoid synthesis by WGCNA.

2. Materials and Methods

2.1. Plant Materials and Sampling

Seedlings of R. roxburghii were planted under natural conditions in the Guizhou Normal University, Guizhou province, China (Guiyang N 26°42.408′; E 106°67.353′). Tissues were collected, including stems, leaves, flowers, and fruits at young (50 DAF, days after flowering) and mature development (120 DAF). Five organs were snap-frozen in liquid nitrogen, then mechanically ground into a fine powder, and finally kept at −80 °C for subsequent experiments.

2.2. Extraction and Quantification of Total Flavonoid, Anthocyanin, and Catechin

Samples (10 mg) were extracted using 500 μL 80% methanol, processing with ultrasonic treatment for 1 h followed by incubation at 4 °C for 18 h. The homogenates were centrifuged at 12,000 rpm for 15 min and the supernatant was stored for measuring [38]. A total of 50 μL of the extraction was transferred into 1 mL tube with 450 μL ddH2O, then 30 μL NaNO2 was added before shaking, and the reaction mixture was left for 5 min. Then, 30 μL 10% Al(NO3)3 was added and mixed for 10 min at room temperature. Then, 200 μL 1 mol/L NaOH was added to the tube, followed by the addition of ddH2O up to a volume of 1 mL. The absorbance of the mixtures was measured at 500 nm, and the contents of the total flavonoids in five organs were calculated with commercial rutin (No#380709, Sigma-Aldrich) as standard. The flavonoids were expressed as mg/100 g of fresh weight (FW) [5].
The sample solution was filtered by 0.45 μm organic membranes. An amount of 20 μL was injected to determine the content of the anthocyanin and catechin. The HPLC analysis of anthocyanin was performed by adding 3% (v/v) formic acid to the methanolic extract. Dried delphinidin 3,5-diglucoside chloride (No#PHL89626, Supelco) and catechin (No#43412, Supelco) standard materials were used to make regression equations to measure the content of catechin in samples. Chromatographic conditions-A C18 column (4.6 mm × 200 mm, 5 μm, Waters Corporation) was used. The mobile phase consisted of A: 5% (v/v) formic acid in water; solvent B: 5% (v/v) formic acid in acetonitrile. The anthocyanin was separated by starting with 100% A with a linear gradient to 25% B over 20 min, ramping to 80% B over 2 and 3 min to re-equilibrate to initial in acetonitrile. The absorption was evaluated at 520 nm [23]. The catechin was separated by a solution consisting of methanol (solvent A) and pure water (solvent B), and the flow rate was 1.0 mL/min. The optimal gradient program started with 15% methanol and was kept in the 0–20 min period, while 25% methanol was kept in the 20–33 min period. The temperature of the column oven was maintained at 30 °C. The eluent was passed through a photodiode array (PDA) detector, and the detection wavelength was 270 nm [5].

2.3. RNA-Seq Data and Analysis of Differentially Expressed Genes (DEGs)

Five samples were applied to high-throughput Illumina sequencing and have been published [37]. Tissue collection and preparation were performed as previously described [37]. The reads were de novo assembly using the Trinity with default settings based on the de Bruijn graph algorithm [33]. All clean reads generated by Illumina sequencing have been deposited and can be readily queried in the NCBI Gene Expression Omnibus (GEO) database under the accession number GSE122014. Fragments per kilobase of transcript per million mapped reads (FPKM) value of each unigene was calculated using cufflinks [39], and the read counts were determined by htseq-count [40]. The data were normalized for the gene expression using the DESeq2 protocol [41]. An adjusted p-value of false discovery rate (FDR) ≤ 0.01 and abs [log2 (Fold change)] ≥ 1 were performed as the threshold to identify the significance of DEGs based on their FPKM values. To determine the DEGs related to the flavonoid, we performed BLASTx alignment with an E-value ≤ 10−5, including the non-redundant (Nr) protein database (https://www.ncbi.nlm.nih.gov/, accessed on 1 January 2023) and Kyoto Encyclopedia of Genes and Genomes (KEGG, https://www.genome.jp/kegg/, accessed on 1 January 2023) [42]. Blast2GO determined the Gene Ontology (GO) to analyze the functional classification [43,44]. We used heatmaps to visualize the expression level of genes. The axis variables were divided into ranges from yellow to purple. Purple indicates high expression, and yellow indicates low expression.

2.4. Co-Expression Network Analysis with WGCNA

Functional unigenes were annotated by BLASTx. The highly co-expressed gene modules were based on FPKM of DEGs associated with flavonoid biosynthesis, transport, transcription factors and cytochrome P450 using an R package (v 1.68) named weighted gene co-expression network analysis (WGCNA) [32]. The WGCNA network and module were conducted using an unsigned type of topological overlap matrix (TOM). The calculation parameters “soft thresholding power” = 2 and “merge Cut Height” = 0.5 were selected to analyze the DEGs. Finally, the module eigengene value was calculated to evaluate the relationships among modules, total flavonoid, anthocyanin and catechin content in the five organs of modules with each tissue type.

2.5. Identification of Hub Genes

The kME (for modular membership, also known as eigengene-based connectivity) was determined as the Pearson correlation coefficient between each gene. The module eigengene was used to evaluate the association of the module with total flavonoid contents. The most significant module of genes with WGCNA edge weight > 0.80 was represented using Cytoscape (v3.7.2, https://cytoscape.org/, accessed on 1 January 2023). The hub genes of this module were screened based on the number of edges (degree of connectivity) associated with the corresponding nodes within the network. The selection parameters were set as the top nodes ranked with the maximum number of edges in the module.

2.6. Quantitative Real-Time PCR (qRT-PCR) Analysis

Tissues used for RT-qPCR were the same batch as those used for RNA-seq. Firstly, RNA was extracted from five organs using the Trizol method (Trizol, Takara Bio, Shiga, Japan) with the addition of RNAiso-mate to remove polysaccharides and polyphenol molecules. Then the purified RNA was transcribed using RT-PCR Kit (TaKaRa, Japan) with an oligo dT-adaptor primer following the manufacturer’s instructions. An SYBR Premix Ex Taq kit (Takara) was used to conduct quantitative real-time RT-PCR. Amplification was carried out according to the following cycling parameters: denaturing for 10 min at 95 ℃, 40 cycles of denaturation at 95 °C for 15 s, annealing for 30 s at 55 °C, and extension at 72 °C for 30 s. The primer pairs were designed using Primer Premier 6 and listed in Table S1. β-actin was used as an internal control. The 2—ΔΔCt method was used to assess the relative gene expression. Three biological replicates and three technical replicates were tested to ensure the reproducibility of the results.

2.7. Statistical Analysis

The data were expressed as mean ± standard deviation (SD) and analyzed by a one-way analysis of variance (ANOVA) followed by Turkey’s post hoc test using Statistical Product and Service Solutions (SPSS) version 20.0 (SPSS Inc., Chicago, IL, USA).

3. Results

3.1. Quantification of Total Flavonoids, Anthocyanin and Catechin in Different Tissues

This study used tissues from stems, leaves, flowers, young fruits, and mature fruits of R. roxburghii to investigate the accumulation of total flavonoids in divergent organs. The flavonoid was present in all tissues (Figure 1). Their content was highest in mature fruits (237.03 mg/100 g FW), followed by young fruits, flowers, and leaves, with contents between 70.27 and 175.87 mg/100 g FW. However, anthocyanins were highly accumulated in the flowers of R. roxburghii. The content of anthocyanin in flowers was 5.63 mg/100 g FW, followed by the other four tissues, ranging from 2.27 to 0.90 mg/100 g FW. Moreover, we determined the contents of catechin in five organs. The values varied from 8.47 to 1.10 mg/100 g FW, with a descending order of leaves, mature fruits, young fruits, flowers, and stems, confirming that the leaves were highly rich in catechin. These results indicated that total flavonoids and specific components of flavonoids could accumulate in various tissues of R. roxburghii at relatively high concentrations. Therefore, to decipher the hub genes that regulated these flavonoids, especially the accumulation of total flavonoids, we performed transcriptome sequencing from various tissues.

3.2. GO and KEGG Analysis of DEGs

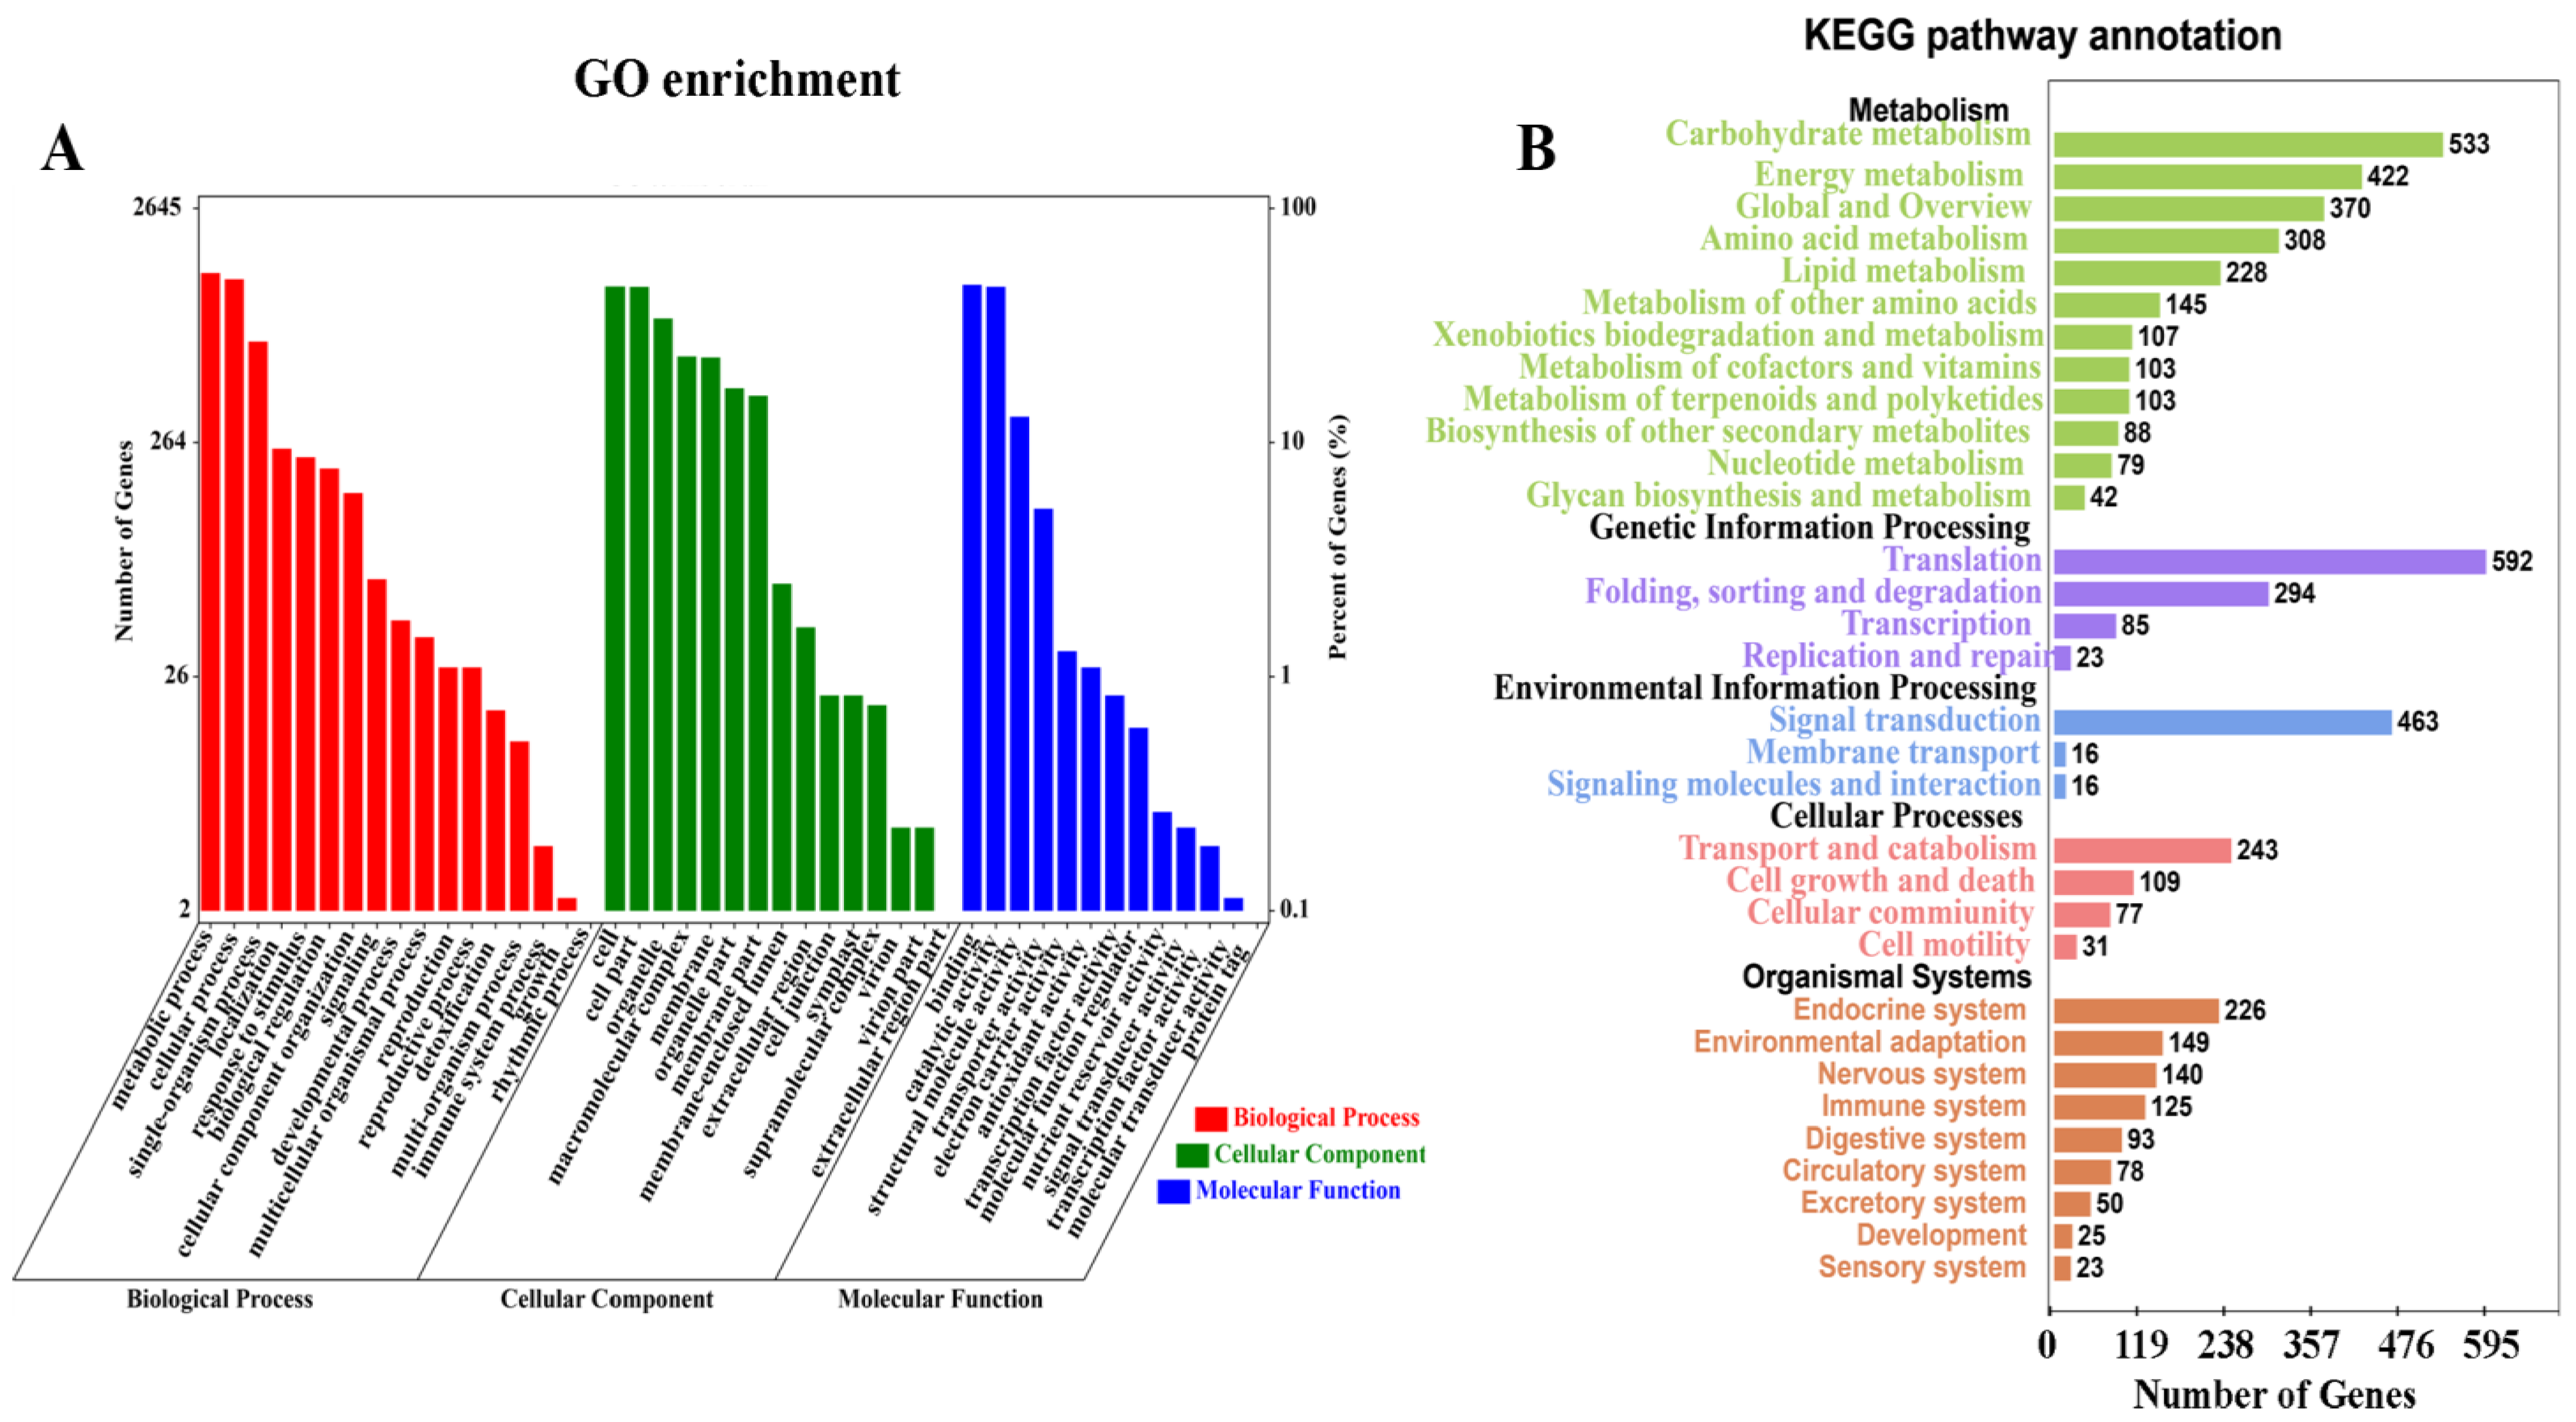
To preliminarily explore gene expression, we first determined a total of 25,449 DEGs between any two tissues based on an adjusted p-value of FDR ≤ 0.01 and abs [log2 (Fold change)] ≥ 1. Then, we performed GO enrichment and KEGG pathway of the DEGs to facilitate the organization of the R. roxburghii transcripts into putative groups. A total of 9354 DEGs were assigned to GO ontologies due to their similarity to sequences with already-known roles (Figure 2A). In the biological process, the GO showed that 52.97% DEGs (5291) were involved in the metabolic process. “Cell”, “cell part”, and “organelle” were the dominant subcategories in the cellular component. The majority of DEGs were assigned to the categories “binding”, “catalytic activity”, and “structural molecule activity”, which suggests that many DEGs play essential roles during the development of R. roxburghii. It is worth noting that the KEGG enrichment displayed that 88 DEGs were implicated in the biosynthesis of other secondary metabolites, consisting of phenylpropanoid synthesis (44), flavonoid biosynthesis (10), anthocyanin biosynthesis (3), flavone and flavanol biosynthesis (3) and others (28), implying that the secondary metabolic processes are active pathways in R. roxburghii development (Figure 2B).

3.3. DEGs Involved in the Flavonoid Biosynthesis Pathway

We evaluated enzyme-encoding genes of the flavonoid pathways using BLASTx alignment (Table S2). The analysis of transcriptome data uncovered that 166 key candidates exerted direct influences over 20 enzymes that were known to be involved in flavonoids’ KEGG biosynthesis pathways. We identified multiple transcripts encoding almost all known enzymes involved in flavonoid biosynthesis through the annotated R. roxburghii transcriptome. A brief outline is shown in Figure 3. Firstly, RrPAL (phenylalanine ammonia-lyase, 2 DEGs) catalyzes phenylalanine into cinnamic acid. Subsequently, Rr4CL (4-coumarate CoA ligase, 15 DEGs), RrCHS (chalcone synthase, 6 DEGs) and RrCHI (chalcone isomerase, 1 DEG) catalyze the cinnamic acid into naringenin or other flavonoids; flavone and flavanol biosynthesis can be produced by RrANS (anthocyanidin synthase, 1 DEG). All expression levels of DEGs showed differences in five organs. RrFLS (flavonol synthase, 12 DEGs) and RrDFR (dihydroflavanol 4-reductase, 1 DEG) were significantly up-regulated in mature fruits.
Some structures of flavonoids are very unstable. Thus, the metabolites are glycosylated, methylated, and acylated before transport to vacuole storage. Glycosyltransferases (RrUFGT and RrUGT75C1) were identified. Most of the RrUFGTs were highly expressed in flowers (DN144609_c4_g4, DN141737_c0_g2, and DN149333_c2_g2), and RrUGT75C1 (DN148844_c2_g6) was highly expressed in mature fruits.

3.4. DEGs Involved in Flavonoid Transport

The contents of flavonoids depend not only on the flavonoid biosynthesis pathway but also on the transportation processes. We determined 301 DEGs encoding candidate transporters (Table S3). The expression levels of ABC transporters were claimed to sequestration of flavonoids into the vacuole. This study identified 192 DEGs encoding ABC transporters d and 80 DEGs encoding GST. Besides, 14 DEGs encoding MATE, 13 DEGs encoding SNARE, and two encoding H+-ATPases were identified (Table S4). The expression levels of transporters, including ABC transporter, SNARE, GST, and MATE are shown in Figure 4A. However, most candidate ABC transporters and GST displayed no expression in five organs.

3.5. DEGs Annotated as Transcription Factors Involved in Flavonoid Metabolism

As many transcription factors (TFs) regulate the expression of flavonoid synthesis and transport, we also identified putative TFs based on the transcriptome. In our results, 622 unigenes were determined as putative TFs (Table S5). The number of unigenes encoding MYB (128 DEGs) was the highest. Additionally, bHLH (77 DEGs), and WD40 (20) were identified since a protein complex consists of MYB, bHLH and WD40, which plays a critical role in flavonoid metabolism. Moreover, ERF (79 DEGs), NAC (76 DEGs), and WRKY (69 DEGs) were found in this study, being the top abundant TFs. Most TFs were highly expressed in five organs, implying that they may take part in more metabolic processes of R. roxburghii compared with transporters (Figure 4B).

3.6. DEGs Annotated as Cytochrome P450 Family

P450 enzymes are involved in the generation of flavonoids. By searching the DEGs, 221 DEGs were annotated as putative cytochrome P450 members and could be grouped into CYP subfamilies (Table S6). Some belong to CYP71A, CYP72A, and CYP73A. The others were related to CYP81A, CYP86A, CYP90A, and CYP98B. Thus, the expression levels of cytochrome P450 would have more significant effects on the biosynthesis of flavonoids in R. roxburghii. The expression patterns of the CYP genes are displayed in Figure 4C. However, a more profound investigation of the roles of each CYP gene and the specific flavonoids still requires further study.

3.7. Co-Expression Network Analysis with WGCNA

To investigate the regulatory network and determine key genes influencing flavonoids in R. roxburghii, WGCNA was performed with the 1310 non-redundant putative DEGs combining biosynthesis, transport, and regulators, identifying 19 distinct co-expression modules corresponding to clusters of correlated transcripts. The modules were labeled with different colors shown by the dendrogram (Figure 5A), in which each tree branch constitutes a module. Each leaf of the branch was one unigene. The module eigengene can be considered a representative of the module’s gene expression profile. The results showed a hierarchical clustering dendrogram of the eigengenes (Figure 5B). The total flavonoids, anthocyanin, and catechin contents were the trait data for a module-trait relationship analysis (Figure 5C). The MEblack module (26 genes) presented the highest correlation with total flavonoids (r = 0.9, p = 5 × 10⁻⁶), followed by the MEpurple (10 genes, r = 0.89, p = 1 × 10⁻⁵), MElightgreen (4 genes, r = 0.88, p = 1 × 10⁻⁵) and MEblue (108 genes, r = 0.87, p = 3 × 10⁻⁵). Besides, we noticed that MEgreen (64 genes, r = 0.92, p = 1 × 10⁻⁶) and MEyellow (78 genes, r = 0.83, p = 1 × 10⁻⁴) displayed high correlations with anthocyanin and catechin accumulations, respectively. The genes in these modules are listed in Table S7. The results showed that different gene expressions played roles in specific flavonoid content.

3.8. Module Visualization and Hub Genes

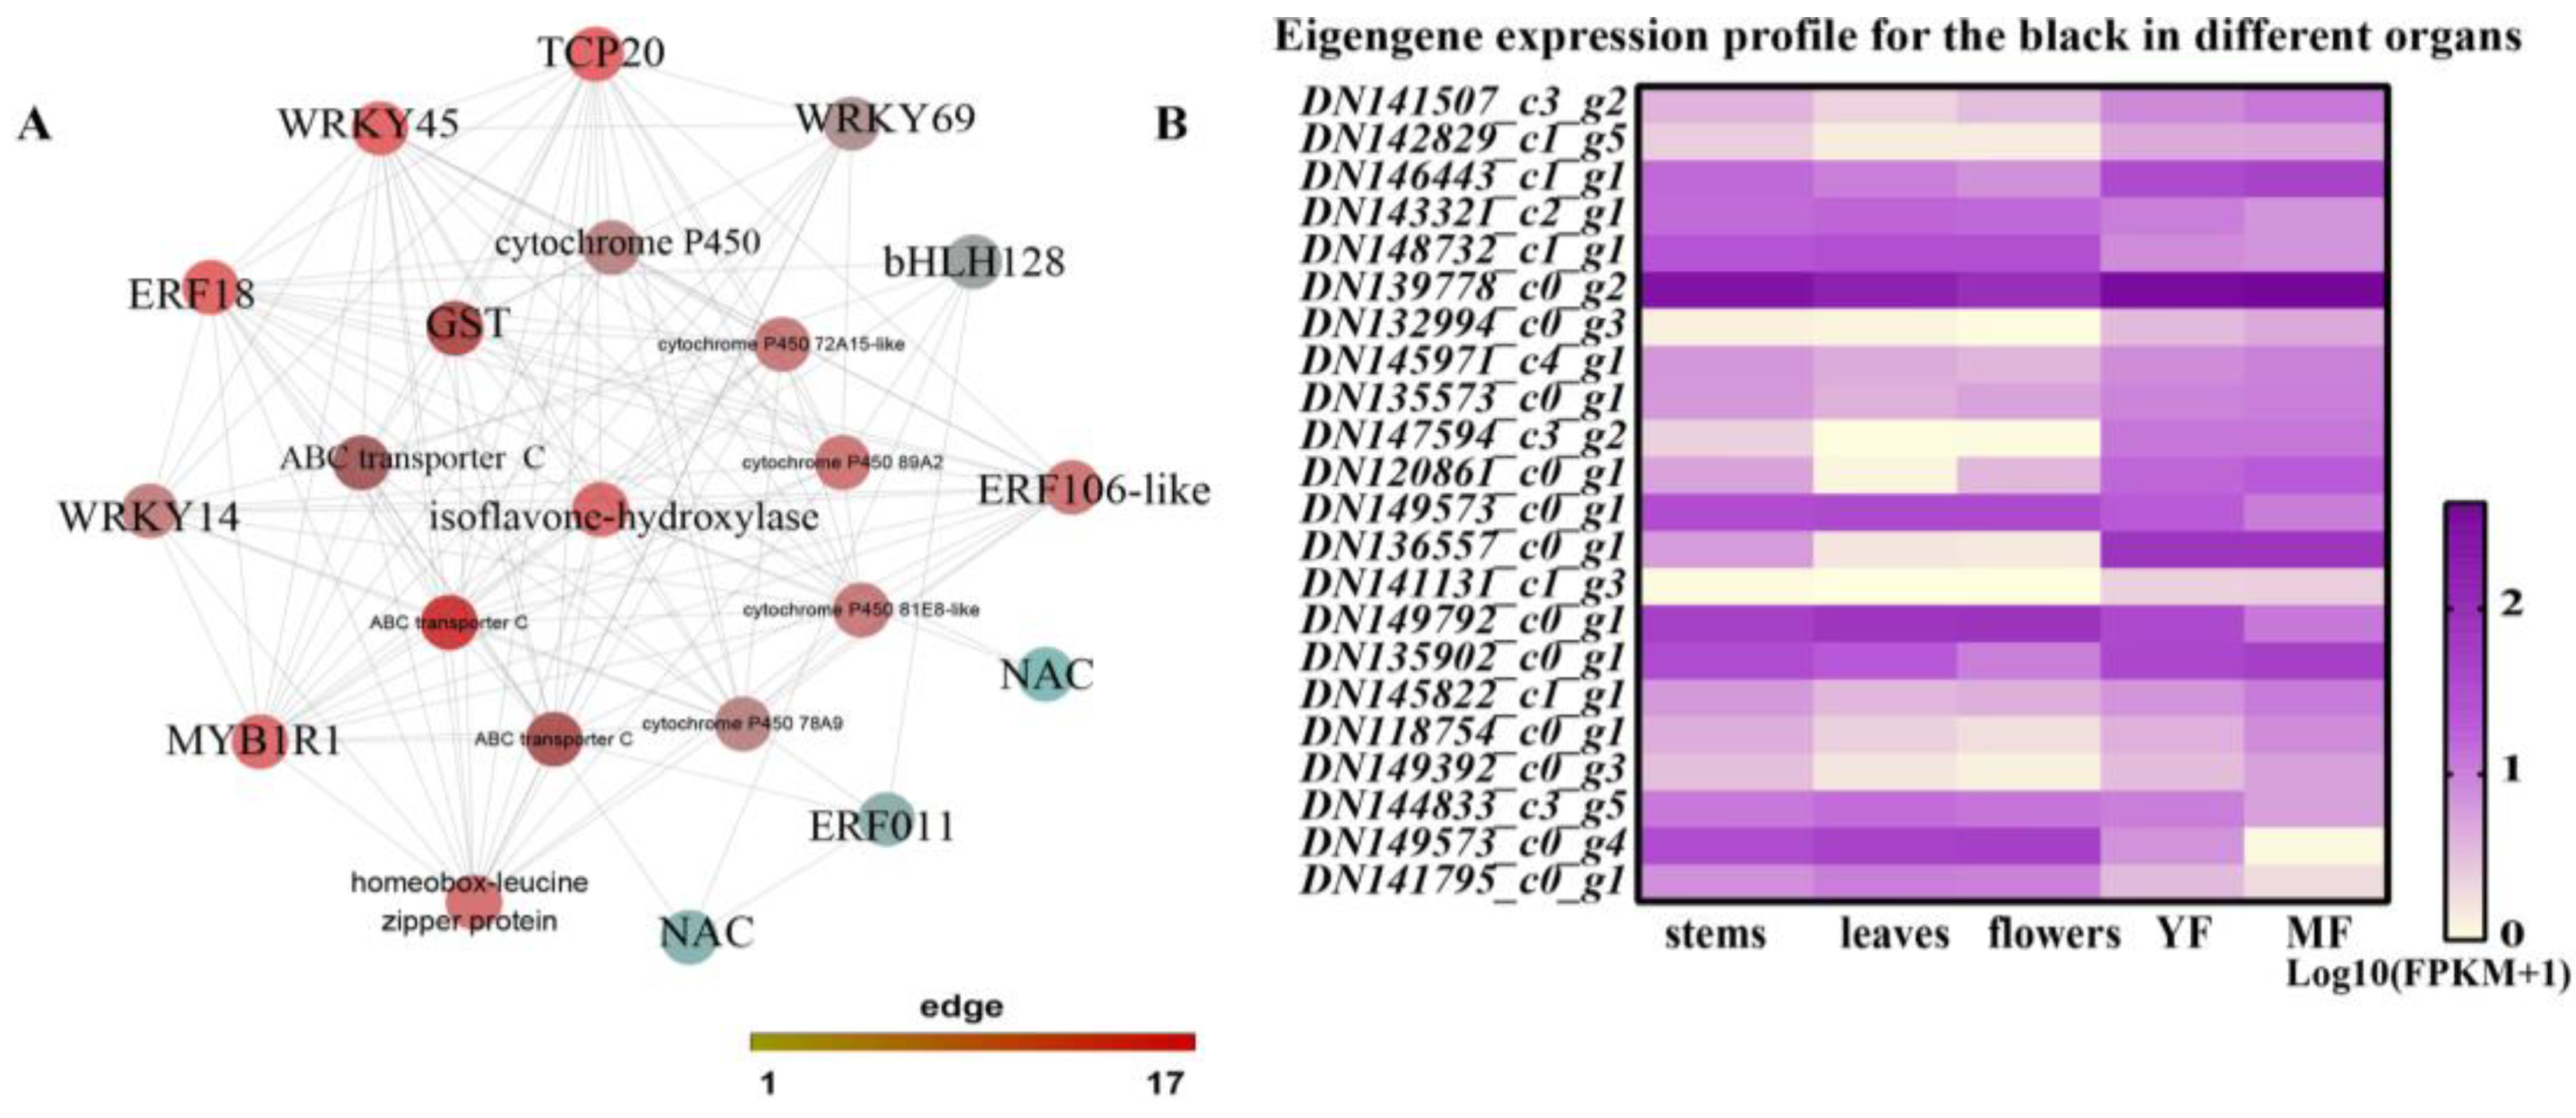
There were 26 eigengenes in the “black” module, including 6 flavonoid biosynthesis, 14 TFs, and 6 transporters. To explore the critical genes that influence flavonoid content, we used Cytoscape software to visualize the network of the genes in “black” modules (Figure 6A). Cytoscape representation of the 22 genes with WGCNA edge weight >0.80 indicated that these genes were highly positively connected in the “black” module. In the interaction network diagram, the outer layer consisted of 12 genes related to TFs, including RrWRKY45, RrTCP20 and RrERF118. In the middle of the network diagram, four flavonoid transporter genes were identified. Six genes related to biosynthesis were identified in the network. All genes in the “black” module showed high expression in mature fruits based on transcriptome (Figure 6B), illustrating that the black module was very relevant to flavonoid content.

3.9. Confirmation of the Hub Genes Using qRT-PCR

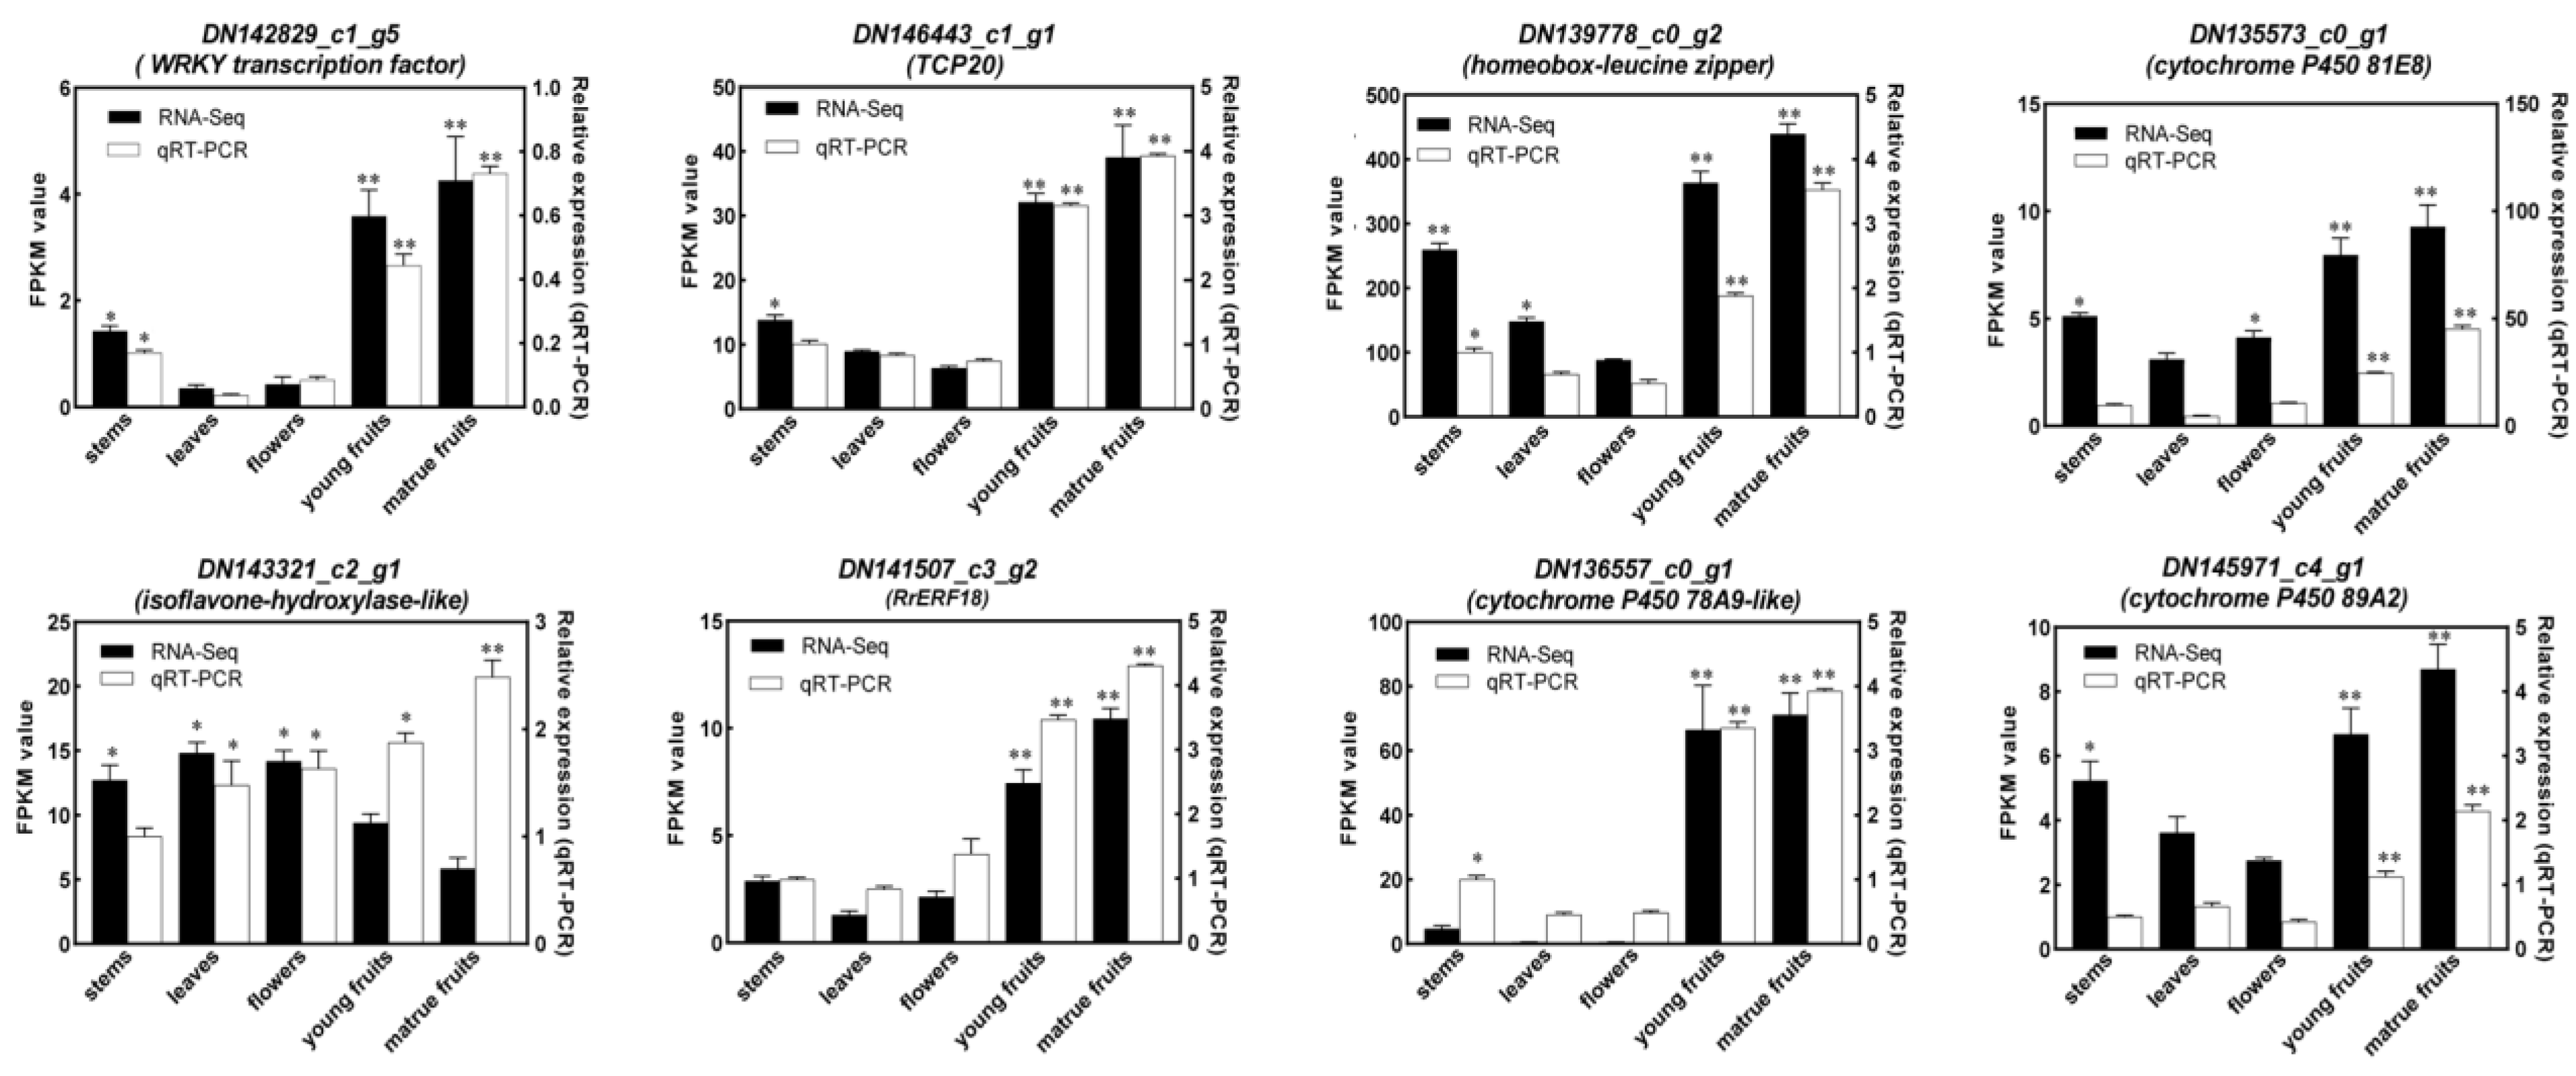
Based on ranking the connectivity of each node, we identified hub genes in the “black” module (edge ≥ 14). The expression levels of hub genes were determined by qRT-PCR using β-actin as an internal control. We discovered that the transcripts of DEGs found in module “black” were nearly consistent with the gene expression profiles obtained from RNA-seq (Figure 7), indicating the reliability and accuracy of the RNA-seq analysis. Noticeably, the expression of most genes displayed lower in the stem, leaf, and flower, whereas higher in fruits, especially in mature fruits, confirming the high correlation of hub genes with flavonoid accumulation. Additionally, the expression levels of the transcription factors RrWRKY45 (DN142829_c1_g5), RrTCP20 (DN146443_c1_g1), and RrEFR118 (DN141507_c2_g2) were remarkably higher in fruits, implying that they exert functions on regulation flavonoids in R. roxburghii. In addition to three cytochrome P450 members (DN136557_c0_g1, DN135573_c0_g1, and DN145971_c4_g1), isoflavone-hydroxylase (DN143321_c2_g1) is crucial for total flavonoids content.

4. Discussion

Transcriptome has become an effective tool for studying biosynthesis mechanisms in plants. For example, transcriptome analysis for flavonoid investigation in apple yellow fruit somatic mutation has been performed [36]. Another research reported candidate genes involved in flavonoid and stilbenoid metabolism in Gnetum parvifolium [38]. In the present study, we aimed to characterize the metabolic pathways of some important bioactive flavonoid compounds via a comprehensive and in-depth investigation of the R. roxburghii transcriptome using RNA-seq. To generate data for an overview of the plant genetic composition, we performed samples for RNA preparation from different tissues and selected to decipher a comprehensive coverage of tissues. Genomic survey sequencing for the genetic background of R. roxburghii was performed using next-generation sequencing technology by HiSeq 2500 sequencing [45]. The estimated genome size was 480.97 Mb based on the ratio of K-mer number to peak depth [45]. We obtained 63,727 unigenes in R. roxburghii, with an average GC content of 42.08% [37]. The coverage depth and accuracy of RNA-seq laid the foundation for obtaining gene expression. A total of 60,406 unigenes were annotated in at least one database, revealing that most annotations of these unigenes displayed high similarity in strawberry (Fragaria X ananassa) [37].
R. roxburghii is rich in many kinds of flavonoid compounds. Many studies proved that flavonoids extracted from R. roxburghii (FRR) leaves and fruits enhanced the radioprotective effect by inhibiting cell apoptosis [46]. However, flavonoids are complex and unevenly distributed in various tissues. Of these, anthocyanin is a typical flavonoid compound highly expressed in flowers [35]. The catechin content was relatively high among multiple flavonoid compounds in R. roxburghii, which was significant in leaves [5]. The flavonoids contents in mature fruits of R. roxburghii were higher than in other tissues (Figure 1). Therefore, they were selected as the three trait data for module-trait relationship analysis.
We identified 166 DEGs that encoded the known enzymes involved in the biosynthesis of the flavonoids and established a gene pool based on the R. roxburghii transcriptome. The DGEs showed different expression patterns in various tissues. For example, PAL catalyzes the first step in the biosynthesis of phenolic compounds [47]. High PAL activity is reported to be associated with the accumulation of anthocyanins in fruit tissues [48]. CHS is a critical enzyme in the flavonoid biosynthesis pathway [49]. Due to flavonoid composition responsible for pollen tube growth and germination, and alterations in fruit color, the expression of CHS was increased during the above-mentioned periods [50,51]. We analyzed the expression pattern of these DEGs related to RrPAL and RrCHS (Figure 2). We found that most of them plummeted in reproductive organs (flowers and fruits) compared with the vegetative organs (leaves and stems). However, our results determined that the total content of flavonoids in fruits was significantly higher than in other organs. The reason may contribute to some critical genes that play more essential roles in regulating flavonoid synthesis. Thus, conducting a comprehensive and in-depth investigation of the R. roxburghii flavonoid metabolism is necessary.
Flavonoid accumulation may be a multifactorial process in R. roxburghii, involving different strategies and the contribution of several transcriptional factors and transporters. Many transporters have been identified as critical factors in regulating flavonoid metabolisms, such as Lycium ruthenicum Murray, Dendrobium catenatum, and cranberry [33,52]. The relationships between the expression of ABC transporter genes and flavonoid content were studied [22]. The role of GST in plants is to be the carrier of flavonoids for transportation [24]. Therefore, we analyzed candidate genes associated with transporters. Based on the analysis of putative DEGs involved in TFs, we revealed that the top four transcription factors were MYB (128), ERF (79), bHLH (77), and WRKY (68). Most of them were universally expressed genes among five organs. MYB, ERF and bHLH were all reported to regulate flavonoid biosynthesis in Arabidopsis, soybean, and grape [53,54]. These transcriptional factors may play essential roles in regulating genes associated with flavonoid biosynthesis and transporters, sequentially determining the flavonoid accumulation in R. roxburghii [16].
Overall, we identified 1310 DEGs, encompassing the most relevant flavonoid genes. WGCNA was implemented on transcriptomic data based on DEGs. This approach constructed a network that segregated the expression profiles of 1310 genes into 19 modules and showed high-quality gene clusters. We found that different modules had connectivity with specific flavonoid compounds. We analyzed the eigengenes in the modules to evacuate the significant factors influencing flavonoid accumulation (Figure 5). Anthocyanin 3-O-glucosyltransferase and F3′H were the two hub enzymes for anthocyanin content. The previous reports showed that the expression of anthocyanin 3-O-glucosyltransferase was significantly higher in the black fruits than in the white fruits of Lycium ruthenicum [35], F3′H was the hub gene in regulating anthocyanin of apple yellow fruit somatic mutation [36], and overexpression of P450 promoted flavonoid biosynthesis [55]. The results showed that the expressions of cytochrome P450 CYP749A22 and CYP72A219, which belong to heme-thiolate monooxygenase, were noticeably highlighted in regulating total flavonoids [56], indicating that they had close connectivity with flavonoids accumulation.
Hub genes displayed a high degree of connectivity in the module “black”, which showed a high correlation with flavonoids content based on the network. These putative genes were predicted to play more significant roles in total flavonoids accumulation in mature fruit. The WRKY family not only enhanced the expression level of CHS, F3′5′H, and F3′H but also regulated the hydroxylation steps of flavonoids and MATE vacuolar transporter [57,58]. RrWRKY45 (DN142829_c1_g5) was confirmed to have high connectivity with flavonoids in the present study. In addition, TCPs regulate plant development and defense responses via stimulating flavonoids in Arabidopsis [59]. The potential anthocyanin regulator EFR118 was also the hub gene in crabapple leaf color [60]. Likewise, our study demonstrated that RrTCP20 (DN146443-_c1_g1) and RrEFR118 (DN141507_c2_g2) were the hub genes in regulating flavonoid accumulation.

5. Conclusions

The total flavonoids and some specific compounds of flavonoids are distributed unevenly in various tissues, eventually resulting in pharmaceutical divergences. These findings could lead to genetic backgrounds involving biosynthesis, modification, transportation, and regulation of flavonoids accumulation, suggesting that the collection of flavonoids may be a multifactorial process in R. roxburghii, involving different strategies and the contribution of several biosynthetic enzymes, transcriptional factors, and transporters. Therefore, this study unravels the key genes that influenced flavonoids accumulation and further provides a powerful genomic tool for the analysis of flavonoids regulatory networks in R. roxburghii.

Supplementary Materials

The following supporting information can be downloaded at: https://www.mdpi.com/article/10.3390/horticulturae9020233/s1, Table S1. Primers used for qRT-PCR analysis; Table S2. The expressions of genes associated with flavonoid biosynthesis in five tissues; Table S3. The transcripts of genes associated with transporters in five tissues; Table S4. The number of unigenes involved in transporters and transcription factors; Table S5. The expressions of genes related to transcription factors in five tissues; Table S6. The expressions of genes associated with cytochrome P450 in five tissues; Table S7. The list of all genes in “black”, “purple”, “lightgreen”, “blue”, “green” and “yellow” modules.

Author Contributions

Sampling, X.H. and H.Y.; designed the study, Q.L. and G.S.; analyzed the data. X.H.; wrote the manuscript and conceived the experiments, H.Y. All authors have read and agreed to the published version of the manuscript.

Funding

This work was supported by grants from the National Natural Science Foundation of China (Grant Nos. 32160699 and 32060587). The Joint Fund of the National Natural Science Foundation of China and the Karst Science Research Center of Guizhou province (Grant No. U1812401). Guizhou Province Natural Science Foundation [QKHJC-ZK[2022]ZD032]. Supported by Sichuan Science and Technology Program (2021YJ0299 and 2021YFYZ0023).

Data Availability Statement

The RNA-Seq data of raw data is publicly available in the NCBI GEO database under the accession number GSE122014.

Acknowledgments

We thank Hong-Yin Zhou for providing the plant materials.

Conflicts of Interest

The authors declare no conflict of interest.

References

  1. Van der Westhuizen, F.H.; Van Rensburg, C.S.; Rautenbach, G.S.; Marnewick, J.L.; du Loots, T.; Huysamen, C.; Louw, R.; Pretorius, P.J.; Erasmus, E. In vitro antioxidant, antimutagenic and genoprotective activity of Rosa roxburghii fruit extract. Phytother. Res. 2008, 22, 376–383. [Google Scholar] [CrossRef] [PubMed]
  2. Xu, P.; Liu, X.; Xiong, X.; Zhang, W.; Cai, X.; Qiu, P.; Hao, M.; Wang, L.; Lu, D.; Zhang, X.; et al. Flavonoids of Rosa roxburghii tratt exhibit anti-apoptosis properties by regulating PARP-1/AIF. J. Cell. Biochem. 2017, 118, 3943–3952. [Google Scholar] [CrossRef] [PubMed]
  3. Xu, P.; Zhang, W.B.; Cai, X.H.; Lu, D.D.; He, X.Y.; Qiu, P.Y.; Wu, J. Flavonoids of Rosa roxburghii Tratt act as radioprotectors. Asian Pac. J. Cancer Prev. 2014, 15, 8171–8175. [Google Scholar] [CrossRef] [PubMed]
  4. Xu, S.J.; Zhang, F.; Wang, L.J.; Hao, M.H.; Yang, X.J.; Li, N.N.; Ji, H.L.; Xu, P. Flavonoids of Rosa roxburghii Tratt offers protection against radiation induced apoptosis and inflammation in mouse thymus. Apoptosis 2018, 23, 470–483. [Google Scholar] [CrossRef]
  5. Hao, M.H.; Zhang, F.; Liu, X.X.; Zhang, F.; Wang, L.J.; Xu, S.J.; Zhang, J.H.; Ji, H.L.; Xu, P. Qualitative and quantitative analysis of catechin and quercetin in flavonoids extracted from Rosa roxburghii Tratt. Trop. J. Pharm. Res. 2018, 17, 71–76. [Google Scholar] [CrossRef]
  6. Xu, P.; Cai, X.; Zhang, W.; Li, Y.; Qiu, P.; Lu, D.; He, X. Flavonoids of Rosa roxburghii Tratt exhibit radioprotection and anti-apoptosis properties via the Bcl-2(Ca(2+))/Caspase-3/PARP-1 pathway. Apoptosis 2016, 21, 1125–1143. [Google Scholar] [CrossRef]
  7. Liu, M.H.; Zhang, Q.; Zhang, Y.H.; Lu, X.Y.; Fu, W.M.; He, J.Y. Chemical Analysis of Dietary Constituents in Rosa roxburghii and Rosa sterilis Fruits. Molecules 2016, 21, 1204. [Google Scholar] [CrossRef]
  8. Tang, L.; Zhang, S.; Zhang, M.; Wang, P.J.; Liang, G.Y.; Gao, X.L. Analysis of protective effects of Rosa Roxburghii Tratt fruit polyphenols on lipopolysaccharide-induced acute lung injury through network pharmacology and metabolomics. Food Sci. Nutr. 2022, 10, 4258–4269. [Google Scholar] [CrossRef]
  9. Xu, Y.; Zou, J.; Zheng, H.; Xu, M.; Zong, X.; Wang, L. RNA-Seq transcriptome analysis of rice primary roots reveals the role of flavonoids in regulating the rice primary root growth. Genes 2019, 10, 213. [Google Scholar] [CrossRef]
  10. Falcone Ferreyra, M.L.; Rius, S.P.; Casati, P. Flavonoids: Biosynthesis, biological functions, and biotechnological applications. Front. Plant Sci 2012, 3, 222. [Google Scholar] [CrossRef] [Green Version]
  11. Winkel-Shirley, B. Flavonoid biosynthesis. A colorful model for genetics, biochemistry, cell biology, and biotechnology. Plant Physiol. 2001, 126, 485–493. [Google Scholar] [CrossRef]
  12. Brown, D.E.; Rashotte, A.M.; Murphy, A.S.; Normanly, J.; Tague, B.W.; Peer, W.A.; Taiz, L.; Muday, G.K. Flavonoids act as negative regulators of auxin transport in vivo in Arabidopsis. Plant Physiol. 2001, 126, 524–535. [Google Scholar] [CrossRef]
  13. Chu, L.L.; Pandey, R.P.; Jung, N.; Jung, H.J.; Kim, E.H.; Sohng, J.K. Hydroxylation of diverse flavonoids by CYP450 BM3 variants: Biosynthesis of eriodictyol from naringenin in whole cells and its biological activities. Microb. Cell Fact. 2016, 15, 135. [Google Scholar] [CrossRef]
  14. Urban, P.; Werck-Reichhart, D.; Teutsch, H.G.; Durst, F.; Regnier, S.; Kazmaier, M.; Pompon, D. Characterization of recombinant plant cinnamate 4-hydroxylase produced in yeast. Kinetic and spectral properties of the major plant P450 of the phenylpropanoid pathway. Eur. J. Biochem. 1994, 222, 843–850. [Google Scholar] [CrossRef]
  15. Franke, R.; Humphreys, J.M.; Hemm, M.R.; Denault, J.W.; Ruegger, M.O.; Cusumano, J.C.; Chapple, C. The Arabidopsis REF8 gene encodes the 3-hydroxylase of phenylpropanoid metabolism. Plant J. 2002, 30, 33–45. [Google Scholar] [CrossRef]
  16. Lei, Z.; Zhou, C.; Ji, X.; Wei, G.; Huang, Y.; Yu, W.; Luo, Y.; Qiu, Y. transcriptome analysis reveals genes involved in flavonoid biosynthesis and accumulation in dendrobium catenatum from different locations. Sci. Rep. 2018, 8, 6373. [Google Scholar] [CrossRef]
  17. Ayabe, S.-i.; Akashi, T. Cytochrome P450s in flavonoid metabolism. Phytochem. Rev. 2006, 5, 271–282. [Google Scholar] [CrossRef]
  18. Jian, Z.; Dixon, R.A. The ‘ins’ and ‘outs’ of flavonoid transport. Trends Plant Sci. 2010, 15, 72–80. [Google Scholar] [CrossRef]
  19. Gomez, C.; Terrier, N.; Torregrosa, L.; Vialet, S.; Fournier-Level, A.; Verriès, C.; Souquet, J.M.; Mazauric, J.P.; Klein, M.; Cheynier, V. Grapevine MATE-type proteins act as vacuolar H+-dependent acylated anthocyanin transporters. Plant Physiol. 2009, 150, 402–415. [Google Scholar] [CrossRef]
  20. Braidot, E.; Zancani, M.; Petrussa, E.; Peresson, C.; Bertolini, A.; Patui, S.; Macrì, F.; Vianello, A. Transport and accumulation of flavonoids in grapevine (Vitis vinifera L.). Plant Signal. Behav. 2008, 3, 626–632. [Google Scholar] [CrossRef] [Green Version]
  21. Zhao, J.; Dixon, R.A. MATE transporters facilitate vacuolar uptake of epicatechin 3′-o-glucoside for proanthocyanidin biosynthesis in Medicago truncatula and Arabidopsis. Plant Cell 2009, 21, 2323–2340. [Google Scholar] [CrossRef] [PubMed]
  22. Klein, M.; Martinoia, E.; Hoffmann-Thoma, G.; Weissenbock, G. A membrane-potential dependent ABC-like transporter mediates the vacuolar uptake of rye flavone glucuronides: Regulation of glucuronide uptake by glutathione and its conjugates. Plant J. 2000, 21, 289–304. [Google Scholar] [CrossRef] [PubMed]
  23. Pourcel, L.; Irani, N.G.; Lu, Y.; Riedl, K.; Schwartz, S.; Grotewold, E. The formation of Anthocyanic Vacuolar Inclusions in Arabidopsis thaliana and implications for the sequestration of anthocyanin pigments. Mol. Plant 2010, 3, 78–90. [Google Scholar] [CrossRef]
  24. Conn, S.; Curtin, C.; Bézier, A.; Franco, C.; Wei, Z. Purification, molecular cloning, and characterization of glutathione S-transferases (GSTs) from pigmented Vitis vinifera L. cell suspension cultures as putative anthocyanin transport proteins. J. Exp. Bot. 2008, 59, 3621–3634. [Google Scholar] [CrossRef] [PubMed]
  25. Zhang, S.; Zhang, A.; Wu, X.; Zhu, Z.; Yang, Z.; Zhu, Y.; Zha, D. Transcriptome analysis revealed expression of genes related to anthocyanin biosynthesis in eggplant (Solanum melongena L.) under high-temperature stress. BMC Plant Biol. 2019, 19, 387. [Google Scholar] [CrossRef]
  26. Kocabek, T.; Mishra, A.K.; Matousek, J.; Patzak, J.; Lomnicka, A.; Khare, M.; Krofta, K. The R2R3 transcription factor HlMYB8 and its role in flavonoid biosynthesis in hop (Humulus lupulus L.). Plant Sci. 2018, 269, 32–46. [Google Scholar] [CrossRef]
  27. Nemesio-Gorriz, M.; Blair, P.B.; Dalman, K.; Hammerbacher, A.; Arnerup, J.; Stenlid, J.; Mukhtar, S.M.; Elfstrand, M. Identification of Norway Spruce MYB-bHLH-WDR transcription factor complex members linked to regulation of the flavonoid pathway. Front. Plant Sci. 2017, 8, 305. [Google Scholar] [CrossRef]
  28. Pandey, A.; Misra, P.; Trivedi, P.K. Constitutive expression of Arabidopsis MYB transcription factor, AtMYB11, in tobacco modulates flavonoid biosynthesis in favor of flavonol accumulation. Plant Cell Rep. 2015, 34, 1515–1528. [Google Scholar] [CrossRef]
  29. Qi, T.; Song, S.; Ren, Q.; Wu, D.; Huang, H.; Chen, Y.; Fan, M.; Peng, W.; Ren, C.; Xie, D. The Jasmonate-ZIM-domain proteins interact with the WD-Repeat/bHLH/MYB complexes to regulate Jasmonate-mediated anthocyanin accumulation and trichome initiation in Arab. Thaliana. Plant Cell 2011, 23, 1795–1814. [Google Scholar] [CrossRef]
  30. Morishita, T.; Kojima, Y.; Maruta, T.; Nishizawa-Yokoi, A.; Yabuta, Y.; Shigeoka, S. Arabidopsis NAC transcription factor, ANAC078, regulates flavonoid biosynthesis under high-light. Plant Cell Physiol. 2009, 50, 2210–2222. [Google Scholar] [CrossRef] [Green Version]
  31. Hollender, C.A.; Kang, C.; Darwish, O.; Geretz, A.; Matthews, B.F.; Slovin, J.; Alkharouf, N.; Liu, Z. Floral transcriptomes in woodland strawberry uncover developing receptacle and anther gene networks. Plant Physiol. 2014, 165, 1062–1075. [Google Scholar] [CrossRef]
  32. Langfelder, P.; Horvath, S. WGCNA: An R package for weighted correlation network analysis. BMC Bioinform. 2008, 9, 559. [Google Scholar] [CrossRef]
  33. Lin, C.T.; Xu, T.; Xing, S.L.; Zhao, L.; Sun, R.Z.; Liu, Y.; Moore, J.P.; Deng, X. weighted correlation network analysis (WGCNA) reveals the hub role of protein ubiquitination in the acquisition of desiccation tolerance in Boea Hygrometrica. Plant Cell Physiol. 2019, 60, 2707–2719. [Google Scholar] [CrossRef]
  34. Iancu, O.D.; Colville, A.; Oberbeck, D.; Darakjian, P.; McWeeney, S.K.; Hitzemann, R. Cosplicing network analysis of mammalian brain RNA-Seq data utilizing WGCNA and Mantel correlations. Front. Genet. 2015, 6, 174. [Google Scholar] [CrossRef]
  35. Li, T.; Fan, Y.; Qin, H.; Dai, G.; Li, G.; Li, Y.; Wang, J.; Yin, Y.; Chen, F.; Qin, X.; et al. transcriptome and flavonoids metabolomic analysis identifies regulatory networks and hub genes in black and white fruits of Lycium ruthenicum Murray. Front. Plant Sci. 2020, 11, 1256. [Google Scholar] [CrossRef]
  36. El-Sharkawy, I.; Liang, D.; Xu, K. Transcriptome analysis of an apple (Malus x domestica) yellow fruit somatic mutation identifies a gene network module highly associated with anthocyanin and epigenetic regulation. J. Exp. Bot. 2015, 66, 7359–7376. [Google Scholar] [CrossRef]
  37. Huang, X.; Yan, H.; Zhai, L.; Yang, Z.; Yi, Y. Characterization of the Rosa roxburghii Tratt transcriptome and analysis of MYB genes. PLoS ONE 2019, 14, e0203014. [Google Scholar] [CrossRef]
  38. Deng, N.; Chang, E.; Li, M.; Ji, J.; Yao, X.; Bartish, I.V.; Liu, J.; Ma, J.; Chen, L.; Jiang, Z.; et al. Transcriptome characterization of gnetum parvifolium reveals candidate genes involved in important secondary metabolic pathways of flavonoids and stilbenoids. Front. Plant Sci. 2016, 7, 174. [Google Scholar] [CrossRef]
  39. Roberts, A.; Trapnell, C.; Donaghey, J.; Rinn, J.L.; Pachter, L. Improving RNA-Seq expression estimates by correcting for fragment bias. Genome Biol. 2011, 12, R22. [Google Scholar] [CrossRef]
  40. Trapnell, C.; Williams, B.A.; Pertea, G.; Mortazavi, A.; Kwan, G.; van Baren, M.J.; Salzberg, S.L.; Wold, B.J.; Pachter, L. Transcript assembly and quantification by RNA-Seq reveals unannotated transcripts and isoform switching during cell differentiation. Nat. Biotechnol. 2010, 28, 511–515. [Google Scholar] [CrossRef] [Green Version]
  41. Anders, S.; McCarthy, D.J.; Chen, Y.; Okoniewski, M.; Smyth, G.K.; Huber, W.; Robinson, M.D. Count-based differential expression analysis of RNA sequencing data using R and Bioconductor. Nat. Protoc. 2013, 8, 1765–1786. [Google Scholar] [CrossRef] [PubMed]
  42. Kanehisa, M.; Goto, S.; Kawashima, S.; Okuno, Y.; Hattori, M. The KEGG resource for deciphering the genome. Nucleic Acids Res. 2004, 32, D277–D280. [Google Scholar] [CrossRef] [PubMed]
  43. Conesa, A.; Gotz, S.; Garcia-Gomez, J.M.; Terol, J.; Talon, M.; Robles, M. Blast2GO: A universal tool for annotation, visualization and analysis in functional genomics research. Bioinformatics 2005, 21, 3674–3676. [Google Scholar] [CrossRef] [PubMed]
  44. Ye, J.; Zhang, Y.; Cui, H.; Liu, J.; Wu, Y.; Cheng, Y.; Xu, H.; Huang, X.; Li, S.; Zhou, A.; et al. WEGO 2.0: A web tool for analyzing and plotting GO annotations, 2018 update. Nucleic Acids Res. 2018, 46, W71–W75. [Google Scholar] [CrossRef]
  45. Lu, M.; An, H.; Li, L. Genome survey sequencing for the characterization of the genetic background of Rosa roxburghii Tratt and leaf ascorbate metabolism genes. PLoS ONE 2016, 11, e0147530. [Google Scholar] [CrossRef]
  46. Yuan, H.; Wang, Y.; Chen, H.; Cai, X. Protective effect of flavonoids from Rosa roxburghii Tratt on myocardial cells via autophagy. 3 Biotech. 2020, 10, 58. [Google Scholar] [CrossRef]
  47. Jones, D.H. Phenylalanine ammonia-lyase: Regulations of its induction, and its role in plant development. Phytochemistry 1984, 23, 1349–1359. [Google Scholar] [CrossRef]
  48. Cheng, G.W.; Breen, P.J. Activity of Phenylalanine ammonia-lyase (PAL) and concentrations of anthocyanins and phenolics in developing strawberry fruit. J. Am. Soc. Hortic. Sci. 1991, 116, 865–869. [Google Scholar] [CrossRef]
  49. Akada, S.; Dube, S.K. Organization of soybean chalcone synthase gene clusters and characterization of a new member of the family. Plant Mol. Biol. 1995, 29, 189–199. [Google Scholar] [CrossRef]
  50. Li, H.; Dong, Y.; Yang, J.; Liu, X.; Wang, Y.; Yao, N.; Guan, L.; Wang, N.; Wu, J.; Li, X. De novo transcriptome of safflower and the identification of putative genes for oleosin and the biosynthesis of flavonoids. PLoS ONE 2012, 7, e30987. [Google Scholar] [CrossRef]
  51. Eldik, G.J.; Van Reijnen, W.H.; Ruiter, R.K.; Herpen, M.M.; Van Schrauwen, J.A.; Wullems, G.J. Regulation of flavonol biosynthesis during anther and pistil development, and during pollen tube growth in Solanum tuberosum. Plant J. 2010, 11, 105–113. [Google Scholar] [CrossRef]
  52. Sun, H.; Liu, Y.; Gai, Y.; Geng, J.; Chen, L.; Liu, H.; Kang, L.; Tian, Y.; Li, Y. De novo sequencing and analysis of the cranberry fruit transcriptome to identify putative genes involved in flavonoid biosynthesis, transport and regulation. BMC Genom. 2015, 16, 652. [Google Scholar] [CrossRef]
  53. Yan, J.; Wang, B.; Zhong, Y.; Yao, L.; Cheng, L.; Wu, T. The soybean R2R3 MYB transcription factor GmMYB100 negatively regulates plant flavonoid biosynthesis. Plant Mol. Biol. 2015, 89, 35–48. [Google Scholar] [CrossRef]
  54. Matus, J.T.; Poupin, M.J.; Canon, P.; Bordeu, E.; Alcalde, J.A.; Arce-Johnson, P. Isolation of WDR and bHLH genes related to flavonoid synthesis in grapevine (Vitis vinifera L.). Plant Mol. Biol. 2010, 72, 607–620. [Google Scholar] [CrossRef]
  55. Ahmad, N.; Jianyu, L.; Xu, T.; Noman, M.; Jameel, A.; Na, Y.; Yuanyuan, D.; Nan, W.; Xiaowei, L.; Fawei, W.; et al. Overexpression of a novel cytochrome P450 promotes flavonoid biosynthesis and osmotic stress tolerance in transgenic Arabidopsis. Genes 2019, 10, 756. [Google Scholar] [CrossRef]
  56. Han, J.Y.; Kim, H.J.; Kwon, Y.S.; Choi, Y.E. The Cyt P450 enzyme CYP716A47 catalyzes the formation of protopanaxadiol from dammarenediol-II during ginsenoside biosynthesis in Panax ginseng. Plant Cell Physiol. 2011, 52, 2062–2073. [Google Scholar] [CrossRef]
  57. Debeaujon, I.; Peeters, A.J.; Léonkloosterziel, K.M.; Koornneef, M. The TRANSPARENT TESTA12 gene of Arabidopsis encodes a multidrug secondary transporter-like protein required for flavonoid sequestration in vacuoles of the seed coat endothelium. Plant Cell 2001, 13, 853–871. [Google Scholar] [CrossRef]
  58. Gonzalez, A.; Brown, M.; Hatlestad, G.; Akhavan, N.; Smith, T.; Hembd, A.; Moore, J.; Montes, D.; Mosley, T.; Resendez, J. TTG2 controls the developmental regulation of seed coat tannins in Arabidopsis by regulating vacuolar transport steps in the proanthocyanidin pathway. Dev. Biol. 2016, 419, 54–63. [Google Scholar] [CrossRef]
  59. Li, S. The Arabidopsis thaliana TCP transcription factors: A broadening horizon beyond development. Plant Signal. Behav. 2015, 10, e1044192. [Google Scholar] [CrossRef]
  60. Yang, T.; Li, K.; Hao, S.; Zhang, J.; Song, T.; Tian, J.; Yao, Y. The use of RNA sequencing and correlation network analysis to study potential regulators of crabapple leaf color transformation. Plant Cell Physiol. 2018, 59, 1027–1042. [Google Scholar] [CrossRef]
Figure 1. The amounts of total flavonoid, anthocyanin, and catechin in different tissues of R. roxburghii. (A) The phenotypes of five tissues. (B) The values of flavonoids. The horizontal axis indicates different tissues, including stems, leaves, flowers, young fruits, and mature fruits. The contents are expressed as mg/100 g of the fresh weight. The vertical bar represents the means ± standard deviation of three separate experiments. Different (One-way ANOVA followed by Turkey’s post hoc test) letters indicate significance in the expression levels at the 0.05 level.
Horticulturae 09 00233 g001
Figure 2. Functional annotations of DEGs based on GO and KEGG enrichment analysis. (A) Different colors show categories in the biological process (red), cellular component (green), and molecular functions (blue) relevant to plant physiology. The left y-axis represents the numbers of unigenes with BLASTx matches to each GO term. The right y-axis indicates the percentage of genes. (B) Major functional categories use different colors, including metabolism, genetic information processing, environmental information processing, cellular processes, and organismal systems. The X-axis represents the numbers of unigenes with BLASTx matches to each KEGG term.
Horticulturae 09 00233 g002
Figure 3. Simplified scheme and heatmaps of flavonoid biosynthesis pathway genes in R. roxburghii based on KEGG pathway. Abbreviation: PAL phenylalanine ammonia-lyase; 4CL, 4-coumarate-CoA ligase; CHS, chalcone synthase; CHI, chalcone isomerase; ANS, anthocyanidin synthase; FLS, flavanol synthase; DFR, dihydroflavonol-4-reductase; LAR, leucoanthocyanidin reductase; ANR, anthocyanidin reductase. UFGT, UDP-glucose flavonoid 3-O-glucosyltransferase; UGT75C1, anthocyanidin 3-O-glucoside 5-O-glucosyltransferase; YF, young fruits; MF, mature fruits. Arrows represent enzyme reactions; enzymes are shown next to the arrows. The color scale represents the log-transformed FPKM+1 value. Purple indicates high expression, and yellow indicates low expression.
Horticulturae 09 00233 g003
Figure 4. Heatmap diagrams of the expression levels among five tissues. The DEGs are related to (A) transporters, (B) transcription factors, and (C) P450 in five organs. YF, young fruits; MF, mature fruits.
Horticulturae 09 00233 g004
Figure 5. Weighted gene co-expression network analysis (WGCNA) of DEGs related to the flavonoid. (A) Gene dendrogram obtained by clustering the dissimilarity is based on consensus topological overlap with the corresponding module colors indicated by the color row. Each colored row represents a color-coded module that contains a group of highly connected genes. (B) WGCNA obtains a dendrogram of consensus module eigengenes on the consensus correlation. The black line is the merging threshold, and groups of eigengenes below the threshold represent modules whose expression profiles are merged due to their similarity. (C) A heatmap plot of consensus module eigengenes and flavonoid, anthocyanin, and catechin content. The module type is on the left side. Numbers in the table report the corresponding module eigengenes and tissue correlations, with P values printed in the bracket. The table is color-coded by correlation according to the color legend. The intensity and direction of correlations are indicated on the right side of the heatmap (red, positively correlated; green, negatively correlated).
Horticulturae 09 00233 g005
Figure 6. Cytoscape representation of co-expressed genes with edge weight ≥0.80 in module “black”. (A) The edge number of the genes ranges from 1 to 17 (color-coded by the scale on the right from yellow through red). (B) Eigengene expression profile for the black in five organs. YF, young fruits; MF, mature fruits.
Horticulturae 09 00233 g006
Figure 7. Comparison of expression profiles of nine hub genes from module “black’’ as measured by RNA-seq and qRT-PCR. Columns represent expression determined by RNA-seq in FPKM values (left y-axis), while lines represent expression by qRT-PCR (right y-axis). The x-axis in each chart represents the five organs. Both for RNA-seq and qRT-PCR assay, all data are presented as means ± SD and analyzed using one-way ANOVA followed by Turkey’s test. Asterisks represent different levels of significance (* indicates the p values ≤ 0.05, ** indicates the p value ≤ 0.01).
Horticulturae 09 00233 g007
Disclaimer/Publisher’s Note: The statements, opinions and data contained in all publications are solely those of the individual author(s) and contributor(s) and not of MDPI and/or the editor(s). MDPI and/or the editor(s) disclaim responsibility for any injury to people or property resulting from any ideas, methods, instructions or products referred to in the content.