Article

Effect of Chitosan and Micro-Carbon-Based Phosphorus Fertilizer on Strawberry Growth and Productivity

by
El-Saied E. Metwaly
1,†,
Arwa Abdulkreem AL-Huqail
2,*,†,
Saad Farouk
3 and
Genesia F. Omar
4
1
Vegetable and Floriculture Department, Faculty of Agriculture, Mansoura University, Mansoura 35516, Egypt
2
Department of Biology, College of Science, Princess Nourah bint Abdulrahman University, P.O. Box 84428, Riyadh 11671, Saudi Arabia
3
Agricultural Botany Department, Faculty of Agriculture, Mansoura University, Mansoura 35516, Egypt
4
Horticulture Department, Faculty of Agriculture, Suez Canal University, Ismailia 41522, Egypt
*
Author to whom correspondence should be addressed.
These authors contributed equally to this work.
Horticulturae 2023, 9(3), 368; https://doi.org/10.3390/horticulturae9030368
Submission received: 28 January 2023 / Revised: 19 February 2023 / Accepted: 6 March 2023 / Published: 10 March 2023
(This article belongs to the Section Fruit Production Systems)

Abstract

:
High fertilization rates and pesticides are required for the intensive production of strawberries, which offer several therapeutic health benefits. Recently, chitosan (CHI), and phosphorus fertilizer based on Micro Carbon TechnologyTM (MCT-P) were applied to encourage strawberry sustainable production and enhance phosphorus-use efficiency. Field trials were conducted throughout 2020/2021 and 2021/2022, to evaluate the effectiveness of MCT–P and CHI in improving strawberry cv. Fortuna growth and yield as well as their quality. Foliar spraying of CHI and MCT-P considerably improved strawberry plant growth (i.e., plant height, secondary crown number per plant, leaf number and area per plant, and foliage fresh weight), photosynthetic pigment concentration (chlorophylla, chlorophyllb, and carotenoids), as well as its yield and quality (early fruit yield, total yield, average fruit weight, fruit firmness, fruit dry matter %, soluble solid content, total sugars (%), ascorbic acid, acidity, and anthocyanin). Compared to untreated plants, 1200 mgL−1 MCT-P and 1000 mg/L CHI supplementation was the most effective concentration for improving all studied characteristics. The interaction between CHI and MCT-P had a greater impact on all examined characteristics. It is recommended to spray strawberry cv. Fortuna with 1200 mg/L MCT-P plus 1000 mg/L CHI every two weeks, from 60 days after transplanting until two weeks before the end of harvesting season for the best fruit yield and quality.

1. Introduction

The consumption of more fruits and vegetables, which are a good source of dietary fiber, nutrients, and healthful phytochemicals, is advised by dietary guidelines worldwide for improving human health and to lower the risk of chronic diseases i.e., obesity, cardiovascular disorders, and cancer [1,2]. Berries have remarkable health benefits, due to their highly phytochemical compounds [3,4,5,6]. Among berries, strawberries (Rosaceae; Frageria ananassa Dutch) are widely consumed not only in fresh or frozen forms but also as processed products, i.e., yogurts, beverages, jams, and jellies. In 2021, 518,710 hectares of strawberries were cultivated worldwide, producing 12.565 million tons [7]. With a production rate of 3.38 million tons, China leads the world, followed by the US, Mexico, Egypt, and Turkey [7]. In Egypt, 12,579 hectares of strawberry cultivation produce a total of 470,913 tons [7]. Nutritionally, the strawberry is considered to be a good low-calorie carbohydrate source [8], as well as being a potential source of phytochemicals, several essential micronutrients that are indispensable in promoting human health and preventing diseases, such as cardiovascular, cancer, and neurological disorders [9,10]. In fact, strawberry phenolics (which mostly include anthocyanin) are best known for their antioxidant and anti-inflammatory effects. They also have direct and indirect antimicrobial, anti-allergy, and anti-hypertensive properties, and mitigate oxidative-stress-related diseases [2,4,10]. In Egypt, strawberry cultivars occupy an imperative rank among the untraditional vegetables attributable to their diverse utilization for local fresh consumption, food processing, and exportation [11]. Strawberry cv. Fortuna is a short-day strawberry cultivar with excellent marketability and a great early-season output. The fruit is a glossy bright to dark red color that is easy to harvest and has a pleasant flavor.
Phosphorus (P) plays a central role in improving crop performance, via promoting root system development, enhancing blooming, seed set, and early crop maturity, as well as increasing cold tolerance [12,13,14,15]. Commonly, P is a crucial constituent of energy-carrying phosphate molecules, phospholipids, nucleic acids, and important coenzymes [16]. Generally, foliar application of P was more efficient than soil amendment. In alkaline calcareous soil, phosphate ions react with calcium and magnesium to form less soluble complexes [17]. The effectiveness of traditional P fertilization used by crops ranges between 10–30% in the year it is used [18]. A Micro Carbon TechnologyTM-based P (MCT-P) fertilizer, Super Phos® (0-50-0), was produced specifically to prevent “tie-up” with calcium and magnesium in order to remain water soluble and available to plant roots [19,20]. Generally, MCT® is made from leonardite (an oxygen-rich form of coal), which has been refined into tiny carbon and oxygen-rich organic particles (www.bhn.us, 11 July 2014). The greater effectiveness of MTC-P is owed to the extremely large specific surface and, therefore, the enriched chemical activity of the organic material created by Micro Carbon Technology® [19,20]. Foliar application of MCT-P is recommended to target the nutrients to the principal site of photosynthetic reactions and to lessen nutrient loss from the soil [21]. Antón-Herrero et al. [19] found that the application of MCT-P drastically increased sweet pepper plant biomass, chlorophyll, and anthocyanin concentrations.
Using chitosan (CHI; obtained by the deacetylation of chitin) to improve crop performance has had newly increasing consideration worldwide [22,23,24]. Chitosan represents the second-most plentiful polysaccharide biopolymer present on earth after cellulose [25]. With 1.5 million tons of chitinous waste produced annually worldwide, 12% of it comes from the worldwide fish industry (crab and shrimp shells) [26,27,28]. Since it is an inexpensive material, that is eco-friendly and has a low toxicity, it has gained remarkable consideration as a possible biological resource for sustainable production [29]. Several studies concur that CHI application boosted growth, productivity, and stress tolerance, in addition to enhancing plant physio-anatomical pathways within normal or stressful environments [22,24,30,31,32,33,34,35,36]. Additionally, CHI lowered transpiration in pepper plants, resulting in a 26–43% reduction in water use linked with increased growth and productivity [37]. According to Rahman et al. [38], applying CHI concentrations to strawberry plants improved growth, chlorophyll concentrations, yield, and quality. Moreover, CHI lessens ROS injury by improving the antioxidant capacity that is associated with improving plant growth, chlorophyll assimilation levels, and photosynthetic rates as well as raising water use efficiency [39,40]. However, the impact of CHI supplementation on strawberry establishment and yield has not been well investigated yet.
The current study is designed to assess the role of chitosan and micro-carbon phosphorus on strawberry growth and productivity. It was anticipated to realize the superior treatments that generate the extra quality and quantities of strawberries.

2. Materials and Methods

2.1. Experimental Layout

Field trials were conducted using a drip irrigation system throughout 2020–2021 and 2021–2022, to evaluate the effectiveness of MCT–P and CHI for optimizing strawberry (cv. Fortuna) growth and yield as well as their quality. The experiment was set-up in split plots in complete randomized blocks design with three replications. Usually, MCT-P rates (0.0, 400, 800, and 1200 mg L−1, Huma-Gro Super-Phose 0-50-0®, Bio Huma Netics, Inc., Gilbert, AZ, USA) were settled in the main plots, while different levels of CHI (0.0, 500 and 1000 mg L−1) were assigned in the subplots. Strawberry fresh runners were transplanted on the 4th and 6th of September during both seasons, respectively. Transplants were planted 25 cm apart on two sides of the dripper line and each ridge had 2 dripper lines. The experimental unit was 19.2 m2 (3 beds × 1.6 m width × 4 m length). Defoliation and runner removal were completed in the fifth week following planting, and then, 60-micron black plastic mulch was applied to the beds (35 days from transplanting). In both seasons, foliar spraying with MCT-P and CHI began 60 days after planting, was repeated every 15 days, and finished two weeks before the end of the harvesting season. The experimental soil samples were taken (0–30 cm depth) for physio-chemical analysis (Table 1) before planting following the protocol of Page et al. [41]. The experimental site ecological data in the first and second seasons is shown in Supplementary Table S1.

2.2. Recorded Data

2.2.1. Vegetative Growth Parameters

On 15 February in the two seasons, five plants from separate plots were harvested to estimate the growth parameters, i.e., plant height (cm), foliage fresh weight (g), secondary crown number/plant, leaf no./plant, and leaf area/plant (cm2).

2.2.2. Photosynthetic Pigments (Chlorophylla, Chlorophyllb, Carotenoid)

Using ice-cold methanol with a trace amount of sodium carbonate, photosynthetic pigments were extracted from the 5th upper leaves for 48 h at laboratory Temperatures and quantified spectrophotometrically (T60 UV-Visible spectrophotometer, PG Instrument Limits, Lutterworth, UK) as described by Lichtenthaler and Wellburn [42].

2.2.3. Fruit Yield and Its Components

Early yield (ton/hectare) was estimated using the fresh weight of fruits harvested from October 29th to February 15th. The total yield (ton/hectare) was determined to be the fresh weight of all entirely picked fruit throughout the harvesting time that was completed on the 29th of May in both years. It involved marketable (fruit with a uniform color and good shape), unmarketable (rotten, green deformed, or water damaged fruit), and total fruit yield.

2.2.4. Fruit Physical Quality

A random selection of 10 fully ripe fruits from separate plots were collected after 150 days from transplanting to evaluate the following characteristics: average fruit weight, fruit firmness, and fruit dry matter%, once oven-dried at 70 °C to consistent weight. A digital penetrometer (TA-1000—made in Italy) with a 1 mm diameter fat end plunger was used to measure the fruit firmness, which was expressed in kg/cm2. Fruit firmness was assessed in the equatorial region at three different locations, and an average was taken [43]. Using a digital refractometer (Model HI96801, Hanna Instruments, Woonsocket, RI, USA) set to 20 °C, the total soluble solid content of the strawberry puree was assessed [44].

2.2.5. Fruit Chemical Quality

Ten randomly selected fresh fruits were taken from experimental plots after 150 days from transplanting for an estimation of fruit chemical quality: the strawberry puree’s titratable acidity was determined and given as the citric acid percentage per 100 g of fresh weight [45]. Meanwhile, the total sugar (%) was estimated based on the anthrone colorimetric procedure [46]. Additionally, ascorbic acid concentration was measured in accordance with the Sadasivam and Manickam [46] method, and it was expressed as mg/100 g of fresh weight. For the anthocyanin estimation, an aliquot of the fruit puree was mixed with acid ethanol (1:10) dilution and blended, then the absorbance at 520 nm was read using an ethanolic HCl solution as a blank. The formula used to calculate the total anthocyanin was W/W% = A/ɛL × MW × DE × V/Wt × 100, where: A = optical density; ɛ = cud-3-glu absorbance (26.900); MW = anthocyanin molecular weight (449.2); DF = dilution factor; V = final volume (ml); Wt = sample weight (mg), and L = cell pathlength (1 cm).

2.3. Statistical Analysis

The data homogeneity was achieved formerly before the analysis of variance (ANOVA). The data were exposed to two way-ANOVA using a CoHort Software statistical package (CoHort software, 2006; Raleigh, NC, USA). The mean values of treatments were compared via Tukey’s HSD-MRT test at p ≤ 0.05. Values that appeared with different letters were significantly dissimilar at p ≤ 0.05 [47]. The data presented are mean values ± standard error (SE).

3. Results

3.1. Vegetative Growth Characters

Table 2 shows that foliar application with MCT-P concentration considerably improved strawberry growth relative to non-treated plants. The greatest plant height (20.74 and 19.90 cm); foliage fresh weight (125.8 and 116.9 g); secondary crown number per plant (7.15 and 6.86); leaf number per plant (45.94 and 44.08); and leaf area per plant (1122 and 1054 cm2) in both seasons, respectively, was recorded after spraying with 1200 mgL−1 MCT-P as compared with other concentrations in untreated plants.
Foliar spraying with CHI (in concentrations of 500 and 1000 mgL−1) significantly increased growth characteristics above the non-treated plants. Foliar spraying of 1000 mgL−1 CHI significantly increased plant height, foliage fresh weight, secondary crown number/plant, number of leaves/plant, and leaf area per plant from 19.3 cm, 116.9 g, 6.67, 41.23, and 1044 cm2 to 20.86 cm, 126.9 g, 7.19, 45.06, and 1133 cm2, respectively, in the first season, alternatively, from 18.41 cm, 109.1 g, 6.35 g, 39.26, and 983 cm2 to 20.08 cm, 117.6 g, 6.92, 43.36, and 1060 cm2 in the second season (Table 2).
Figure 1 shows that the spraying with MCT-P plus CHI had an additive significant effect over each one alone and the untreated plants. The interaction between 1200 mgL−1 MCT-P and 1000 mgL−1 CHI produced the highest values of growth characteristics, i.e., plant height, foliage fresh weight, secondary crown number per plant, leaf number per plant, and the leaf area of 13.5%, 14.61%, 13.88%, 25.48%, and 14.38% in the first season (Figure 1A,C,E,G,I), and 15.50%, 13.86%, 15.58%, 27.33%, and 13.80% in the second season (Figure 1B,D,F,H,I) over the untreated plants.

3.2. Photosynthetic Pigment Concentration

In comparison to the untreated control plants, the concentration of chlorophylla, chlorophyllb, and total carotenoids considerably increased in both seasons by MCT-P application. Chlorophylla was enhanced by 12.85 and 14.57%, chlorophyllb by 14.06 and 14.57%, and total carotenoid by 27.59% and 15.33% above the untreated control plants within the first and second seasons, correspondingly, with 1200 mgL−1 MCT-P foliar spraying (Table 3).
Relative to the untreated plants, the application of 1000 mgL−1 CHI resulted in the greatest values of chlorophylla (92.62 and 89.85 mg/100 g FW), chlorophyllb (46.17 and 44.43 mg/100 g FW), and total carotenoid (26.39 and 25.39 mg/100 g FW) in both seasons, respectively (Table 3).
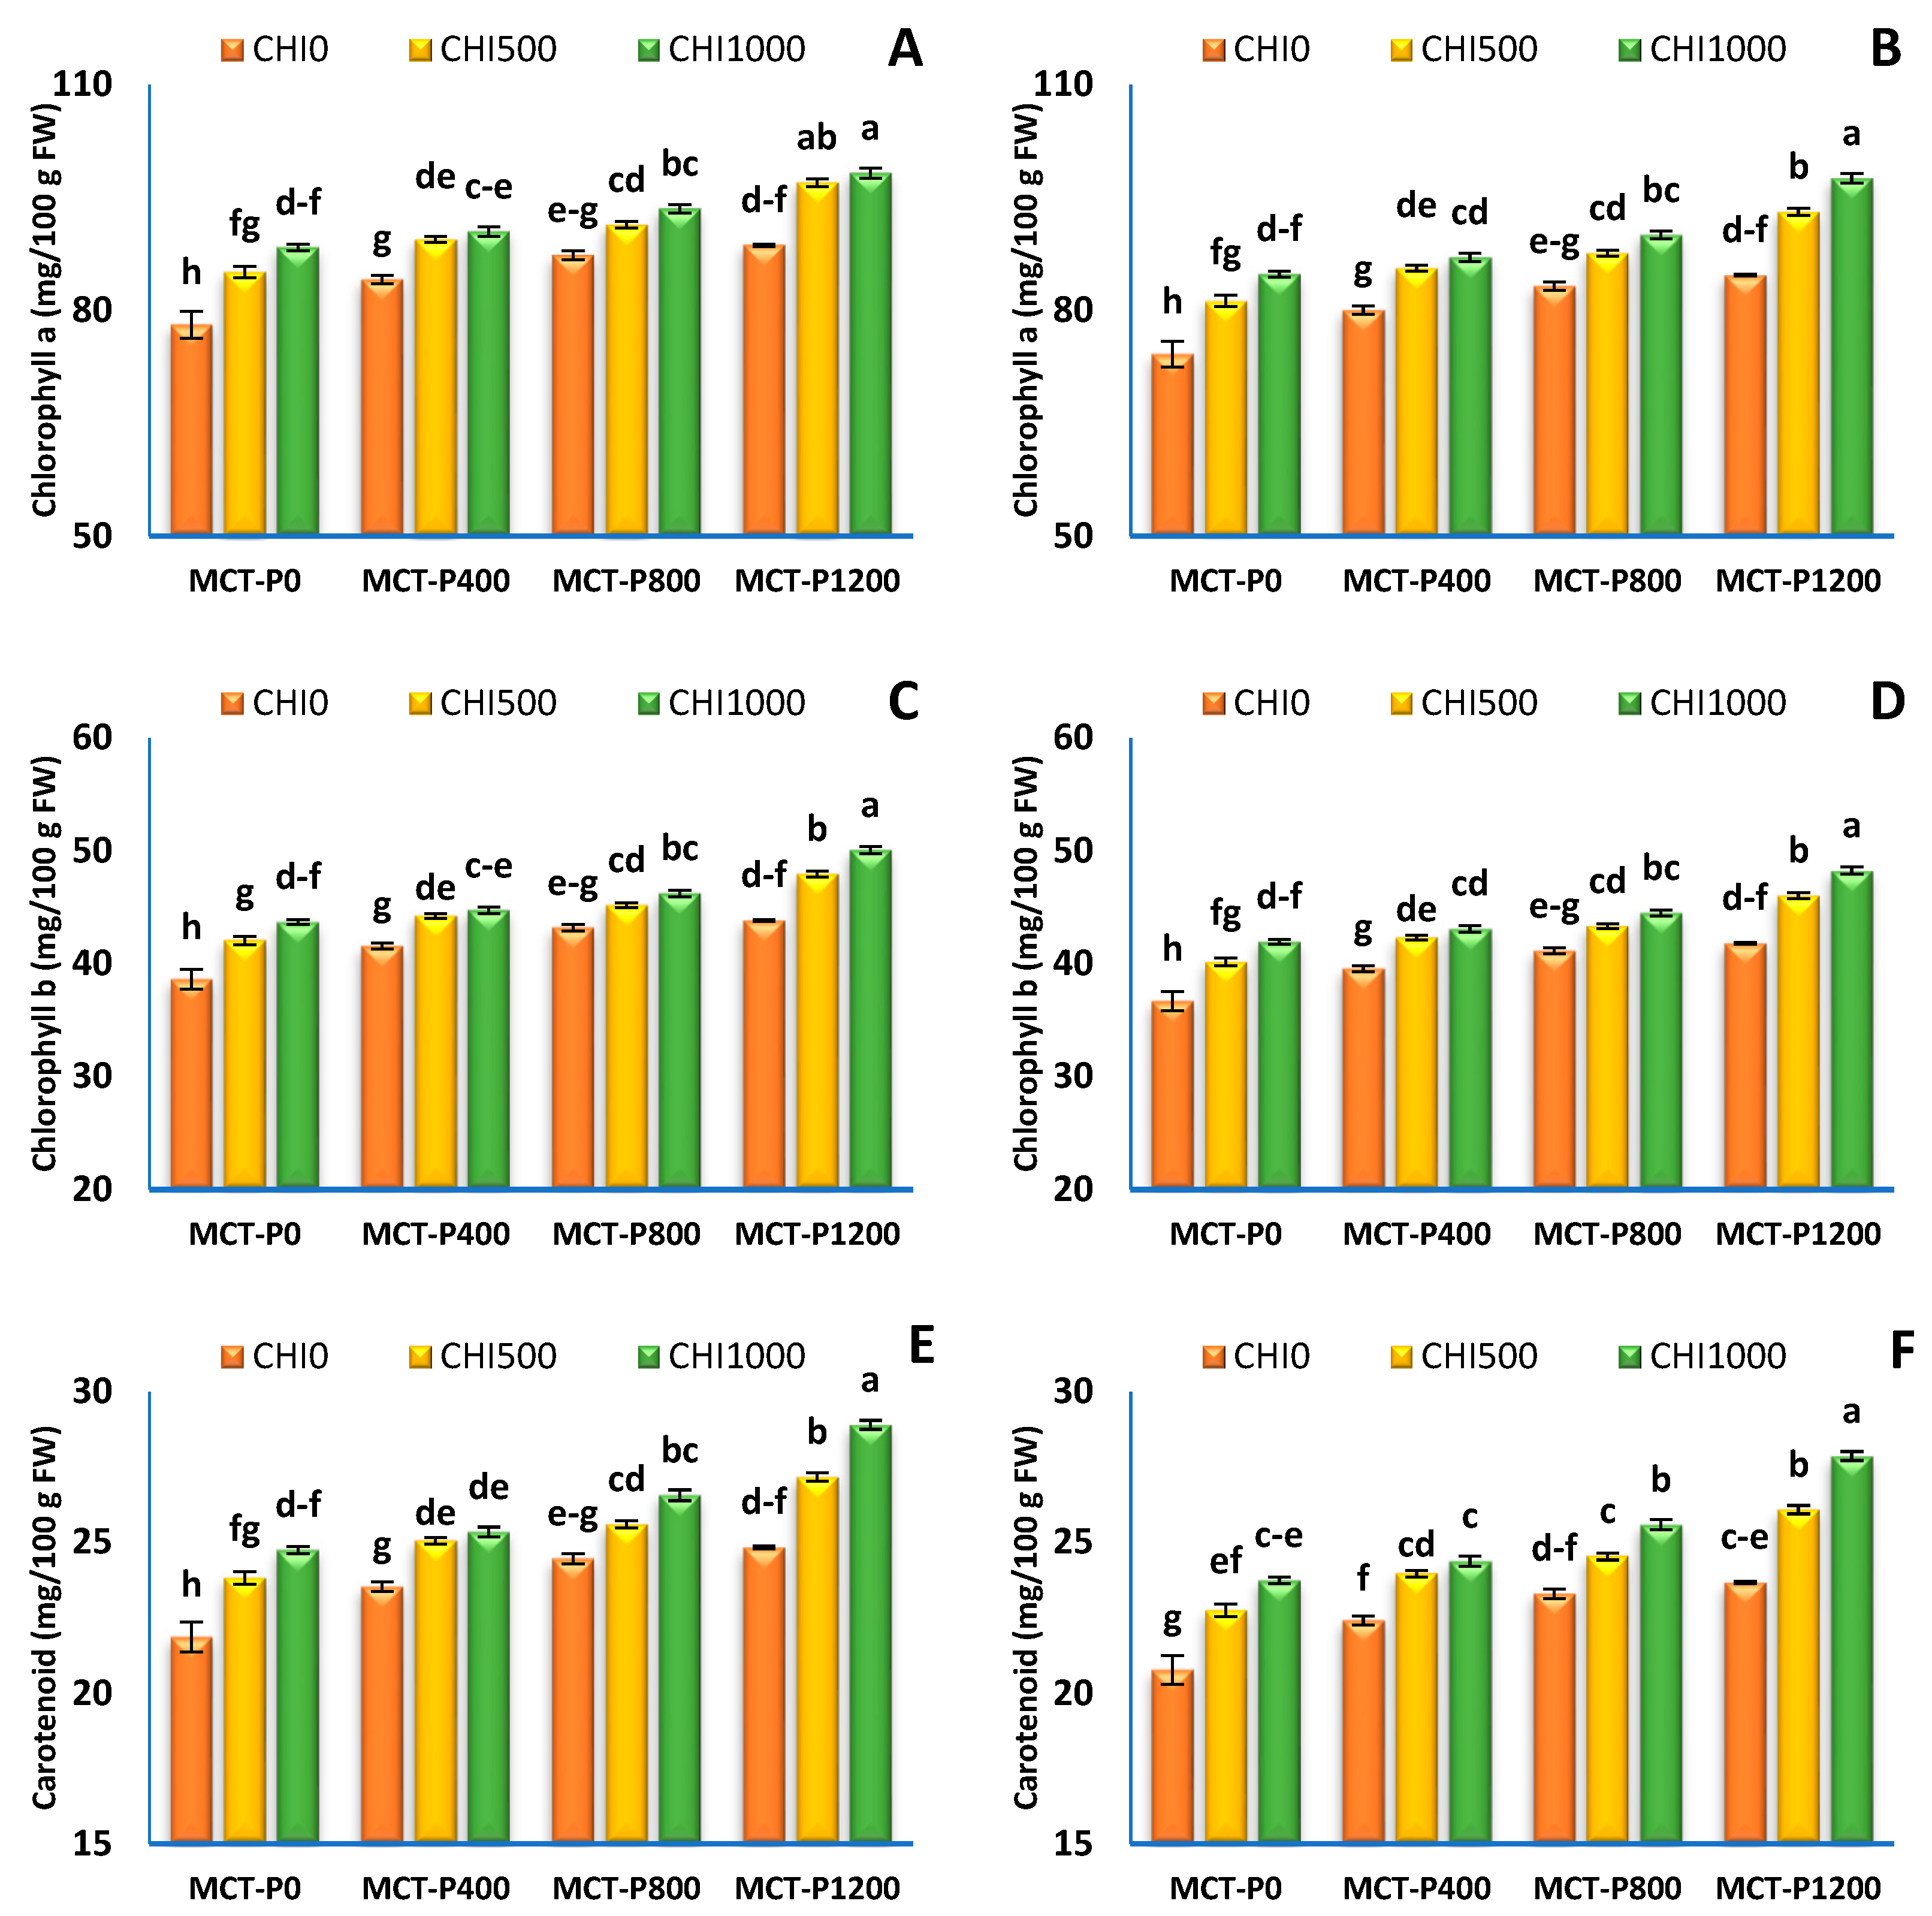
Regarding the interaction effects, Figure 2 shows that all interactions significantly increased photosynthetic pigments over the non-treated plants. The most effective treatment in this regard was 1200 mgL−1 MCT-P plus 1000 mgL−1 CHI which increased chlorophylla, chlorophyllb, and carotenoid by 25.77, 29.62, and 32.14% in the first season (Figure 2A,C,E) and by 31.53, 31.54 and 34.07% in the second season (Figure 2B,D,F) relative to each one alone or the untreated plants.

3.3. Fruit Yield and Its Components

Data in Table 4 show that foliar application of MCT-P concentration significantly increased the total early yield and the total yield of strawberry associated with a significant decline in unmarketable fruit yield in both experimental seasons. The higher early and total yield was recorded after 1200 mgL−1 MCT-P spraying that increased early marketable yield (22.0 and 18.9%), early unmarketable yield (51.5 and 44.5%), total early yield (15.2 and 13.4%), total marketable yield (7.50 and 8.35%), total unmarketable yield (40.9 and 39.3%), and total yield (5.20 and 5.86%) in the first and second year, respectively, above the untreated plants.
As for the effects of CHI, the data in Table 4 reveals that foliar spraying with 500 or 1000 mgL−1 CHI significantly increased early and total yield attributes above the untreated plants, with the greatest total early yield (19.73 and 18.60 ton/hectare), and total yield (75.18 and 72.13 ton/ hectare) associated with a higher early marketable yield (18.45 and 17.52 ton/hectare) and total marketable yield (72.87 and 70.07 ton/hectare) as well as a low early unmarketable yield (1.066 and 1.033 ton/hectare) and total unmarketable yield (2.488 and 2.448 ton/hectare) relative to non-treated plants in the first and second year, respectively.
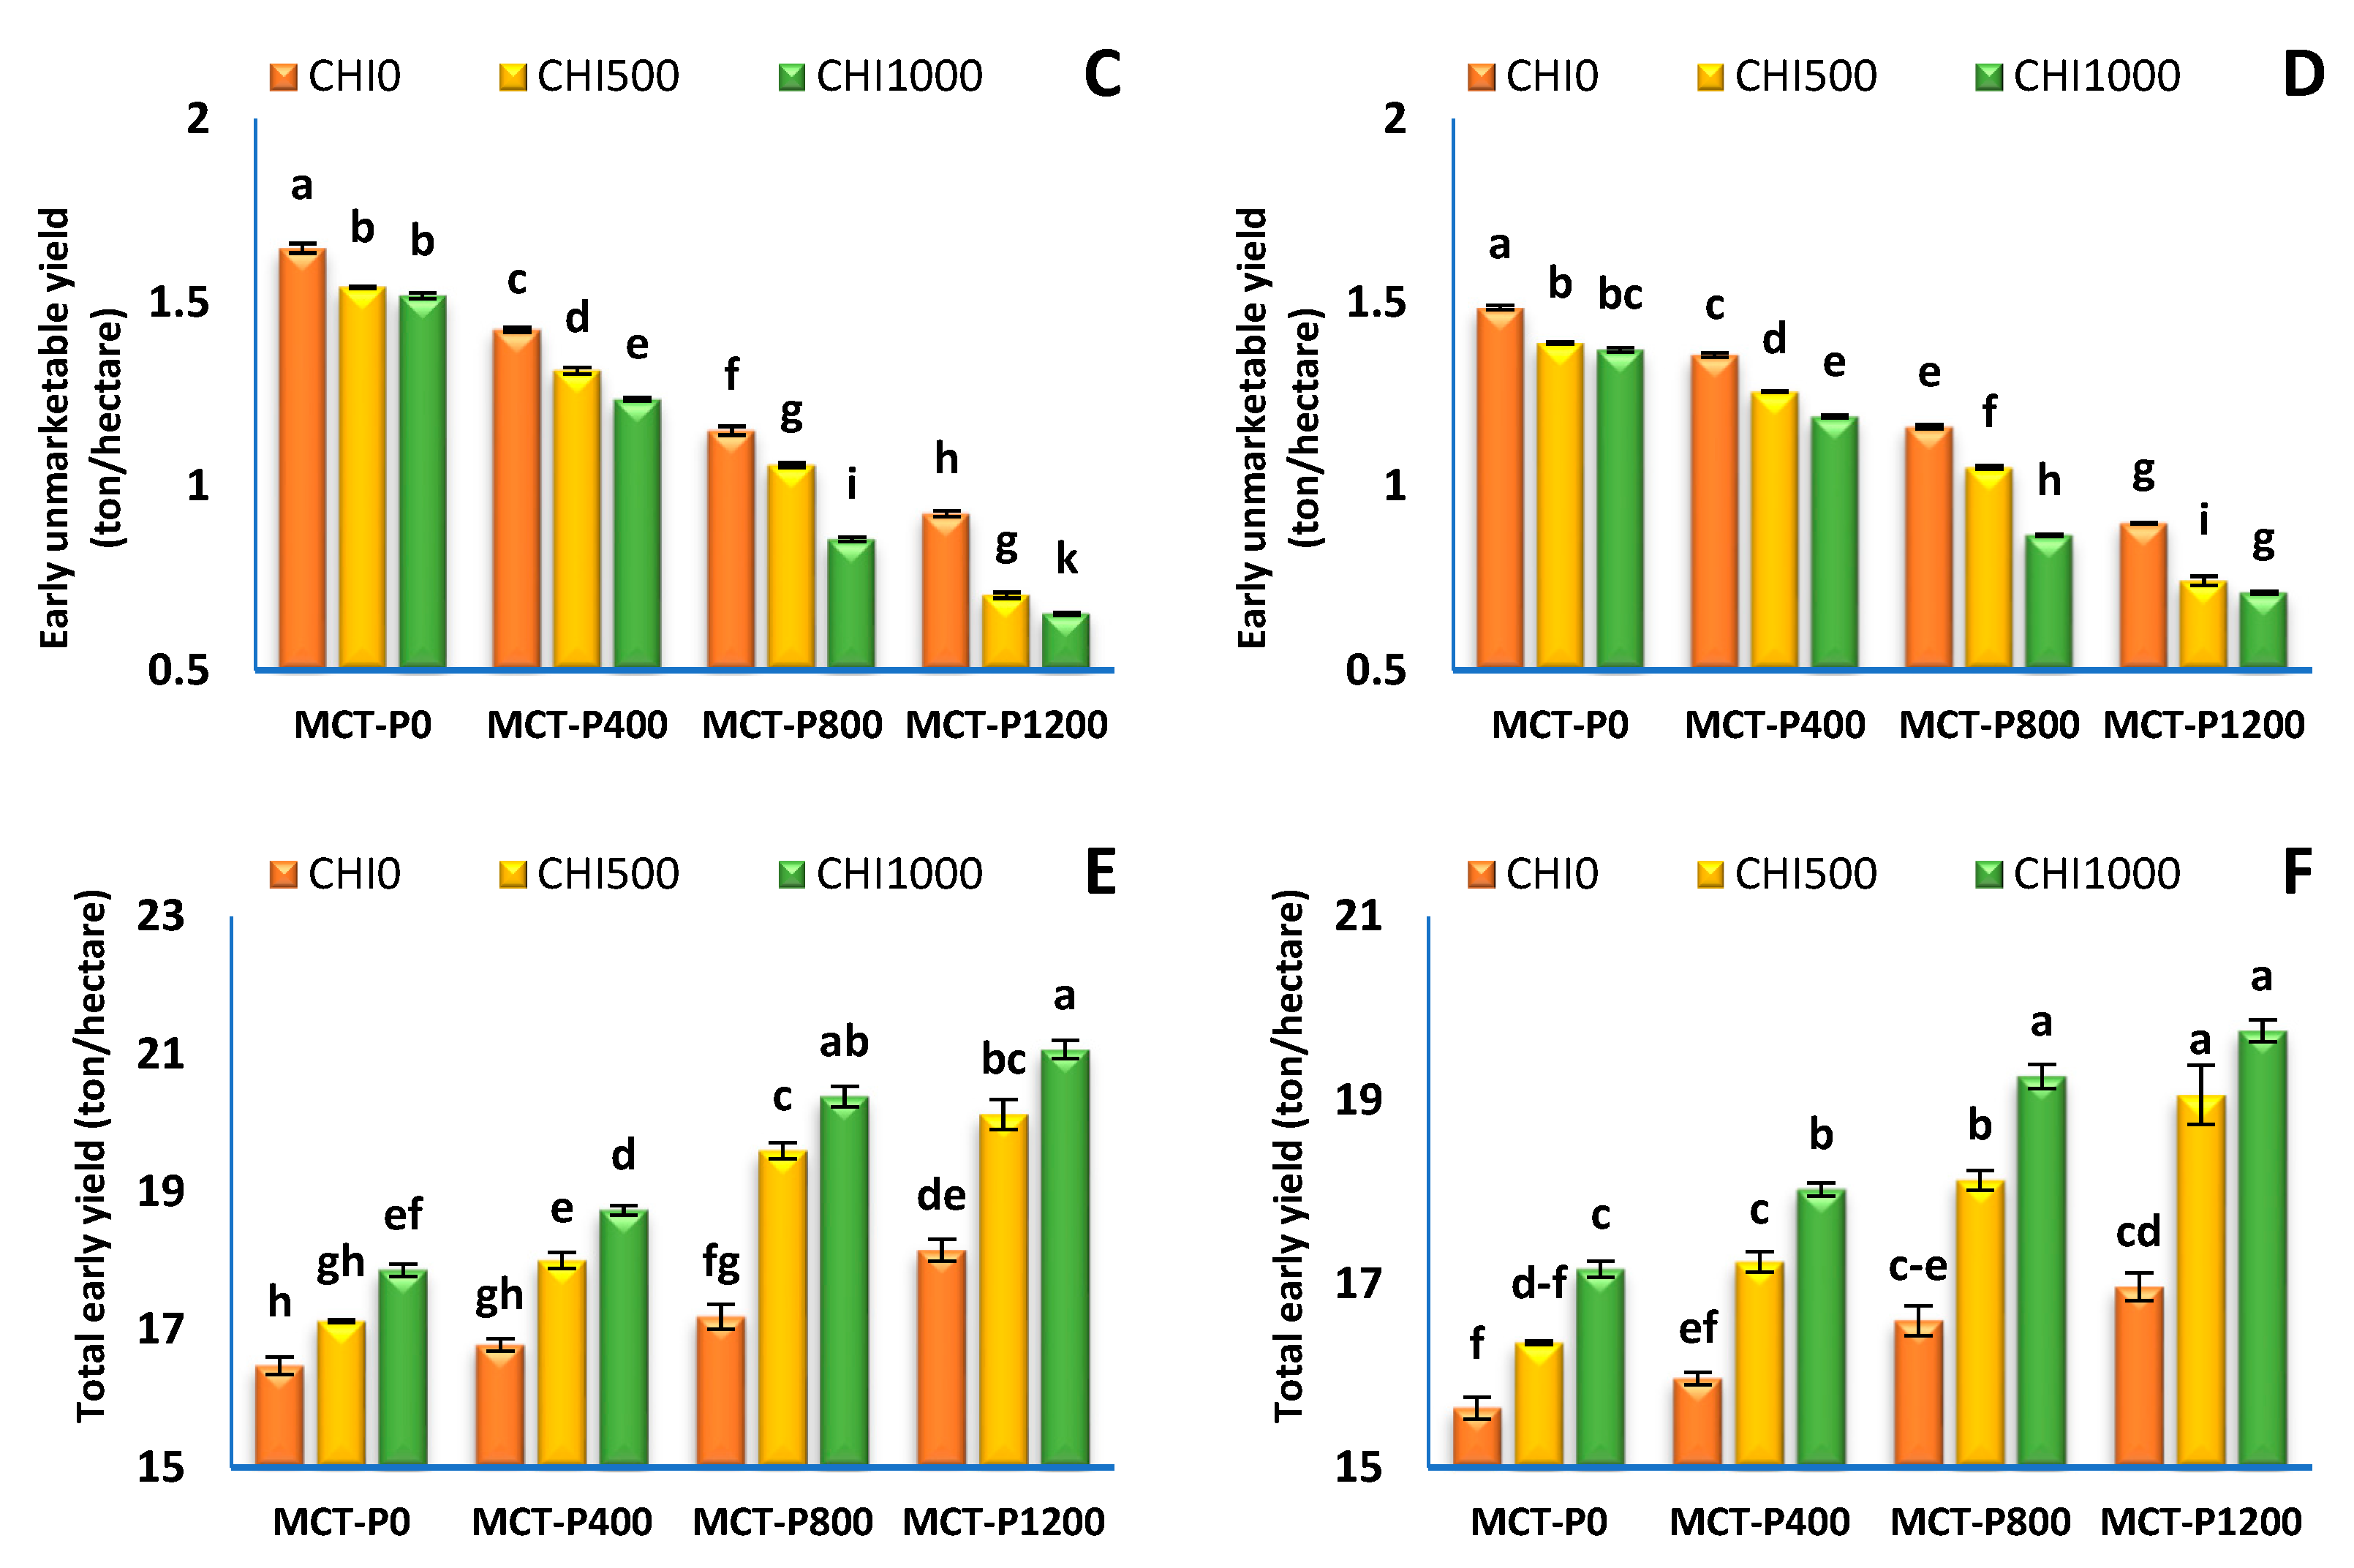
Regarding the interaction effects, Figure 3 shows that all interactions between MCT-P and CHI significantly increased the early marketable yield (Figure 3A,B), total marketable yield (Figure 4A,B), total early yield (Figure 3E,F), and total yield (Figure 4E,F) associated with a significant decline in early unmarketable yield (Figure 3D) and total yield (Figure 4C,D) as compared to untreated plants in the first and second season, respectively. The highest total early yield (21.07 and 19.76 ton/hectare), and total yield (77.50 and 74.71 ton/hectare) was recorded once plants were treated with 1200 mgL−1 MCT-P plus 100 mgL−1 CHI, compared to the untreated plants in the first and second year, respectively.
Data in Table 5 and Figure 5 show that foliar application of either MCT-P and CHI and their interaction significantly increased the strawberry fruit’s physical attributes. The data indicate that the most effective MCT-P concentration was 1200 mgL−1, which significantly increased the average fruit weight, fruit firmness, fruit dry matter percentage, and total soluble solid content by 4.93, 9.91, 7.91, and 14.7% in the first year and by 5.42, 9.43, 6.60, and 15.2% in the second year over the untreated plants.
Foliar spraying with 1000 mgL−1 CHI yielded the greatest values of average fruit weight (21.93 and 21.10 g), fruit firmness (395.4 and 372.3 kg/cm2), fruit dry matter % (9.56 and 9.43%), and total soluble solid content (6.24 and 6.01 Brix) over the untreated plants in the first and second years, respectively (Table 5).
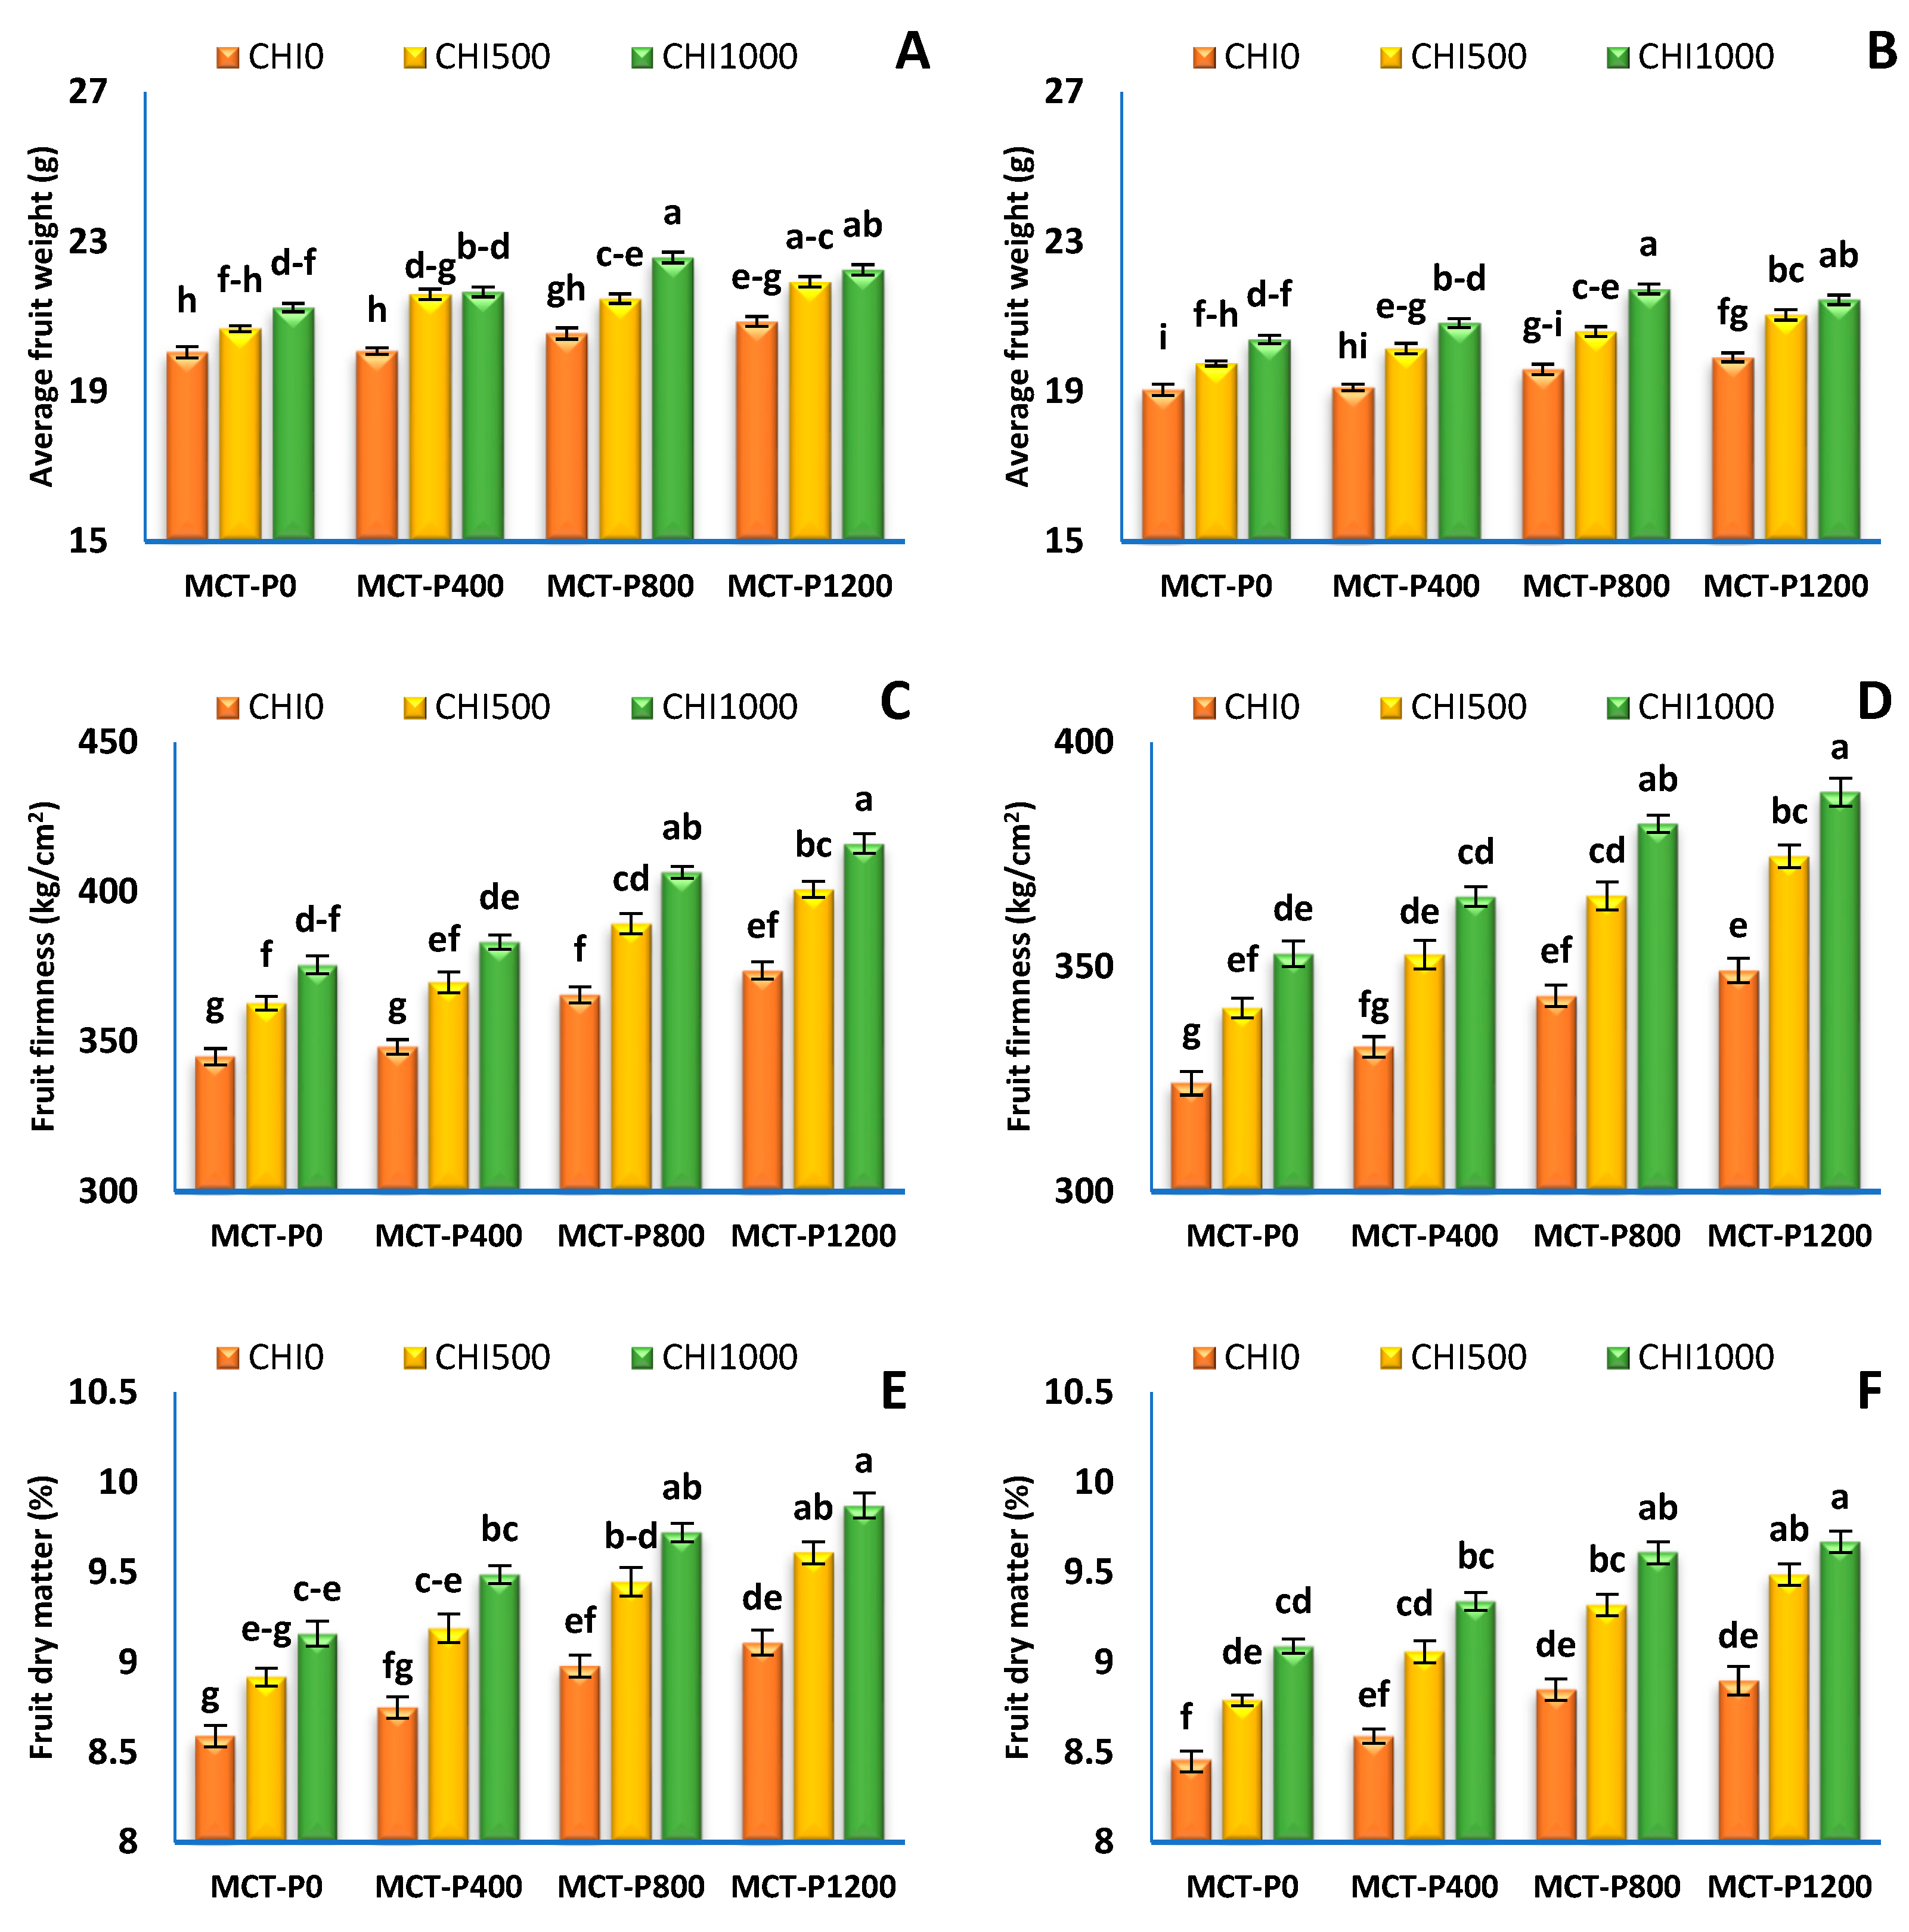
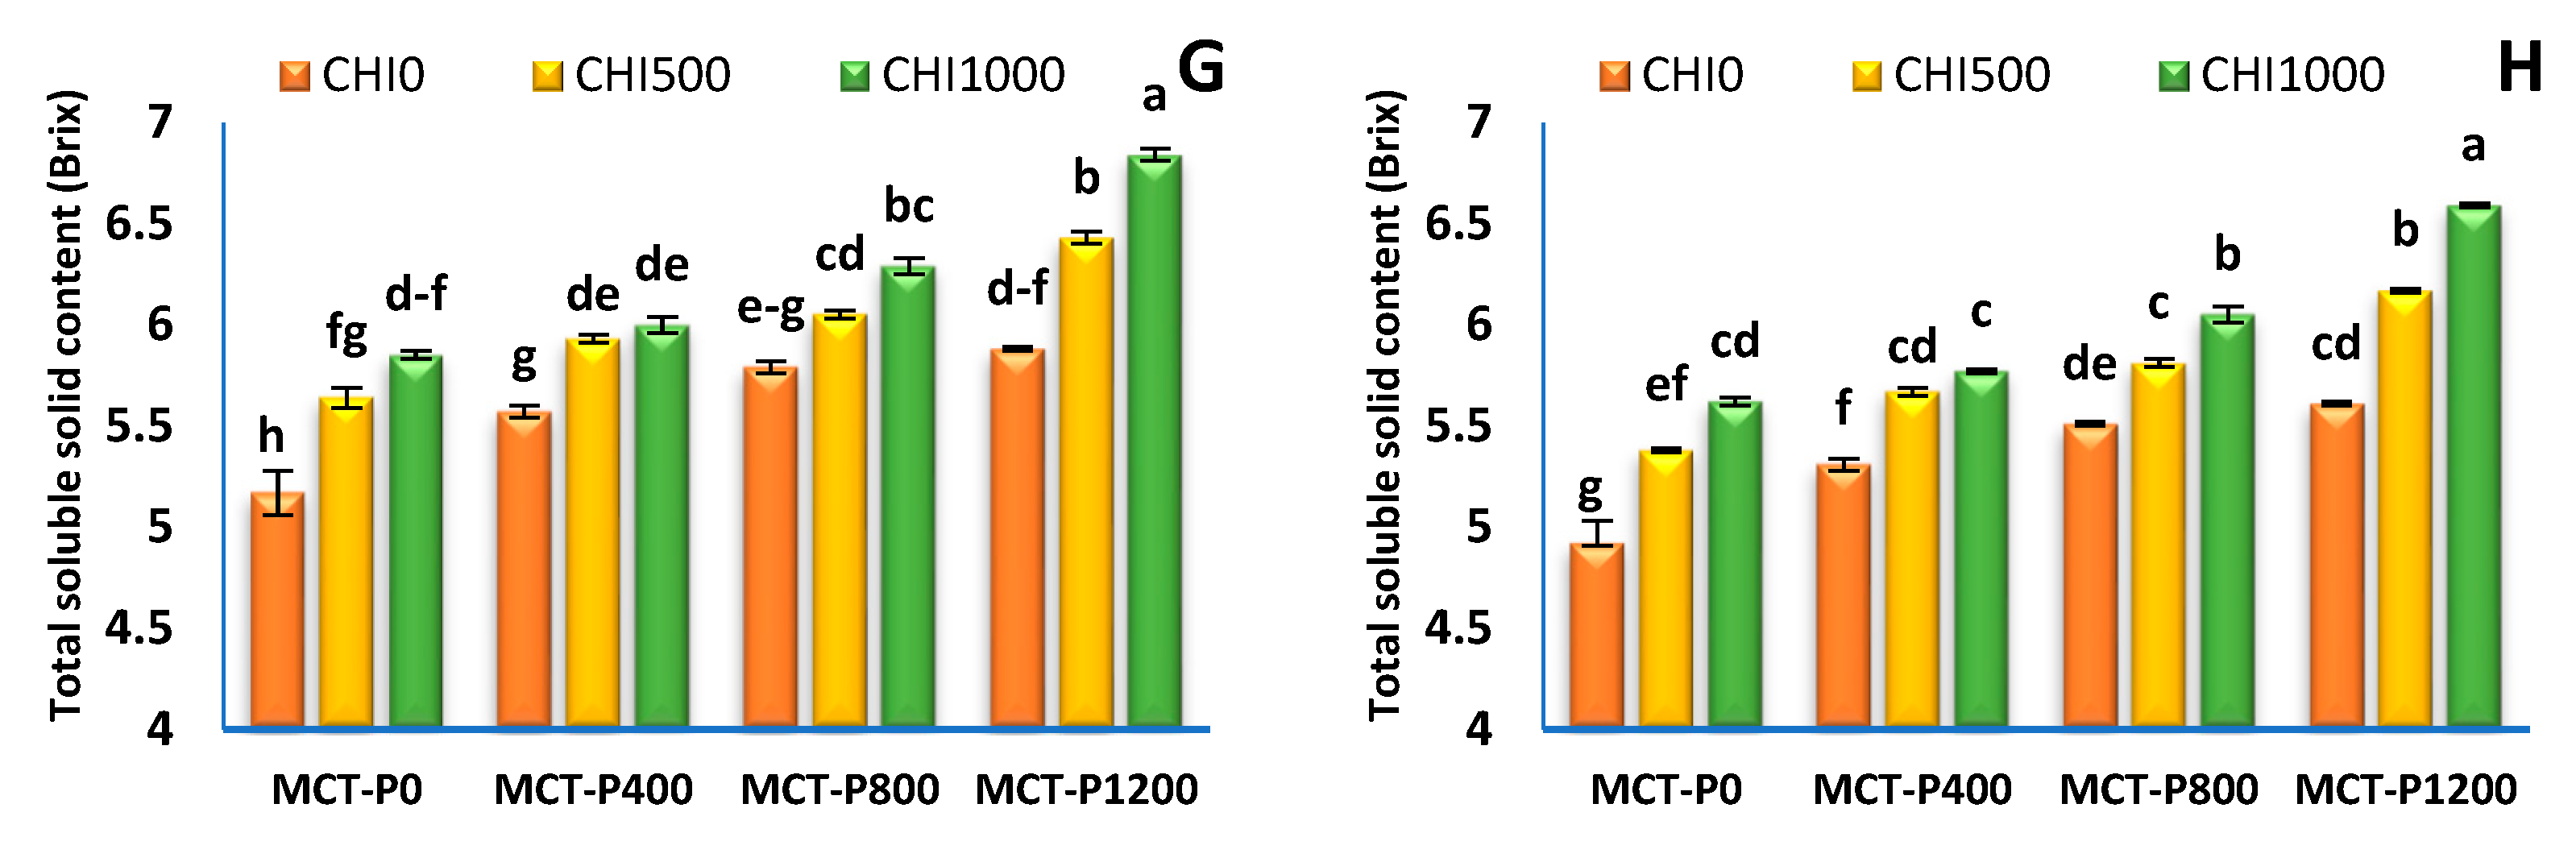
Regarding the interaction effects, Figure 5A–H show that all interaction treatments significantly increased all physical attributes of the strawberry fruit in both years. The greatest values of average fruit weight (22.58 and 21.74 g) were recorded within the foliar application of 800 mgL−1 MCT-P plus 1000 mgL−1 CHI in both years over the untreated plants (Figure 5A,B). On the other hand, the application of 1200 mgL−1 MCT-P plus 1000 mgL−1 CHI gave the highest fruit firmness (416.1 and 388.9 kg/cm2), fruit dry matter percentage (9.87 and 9.67%), and total soluble solid content (6.84 and 6.59 Brix) in the first and second year relative to all interactions or the untreated plants.

3.4. Fruit Quality

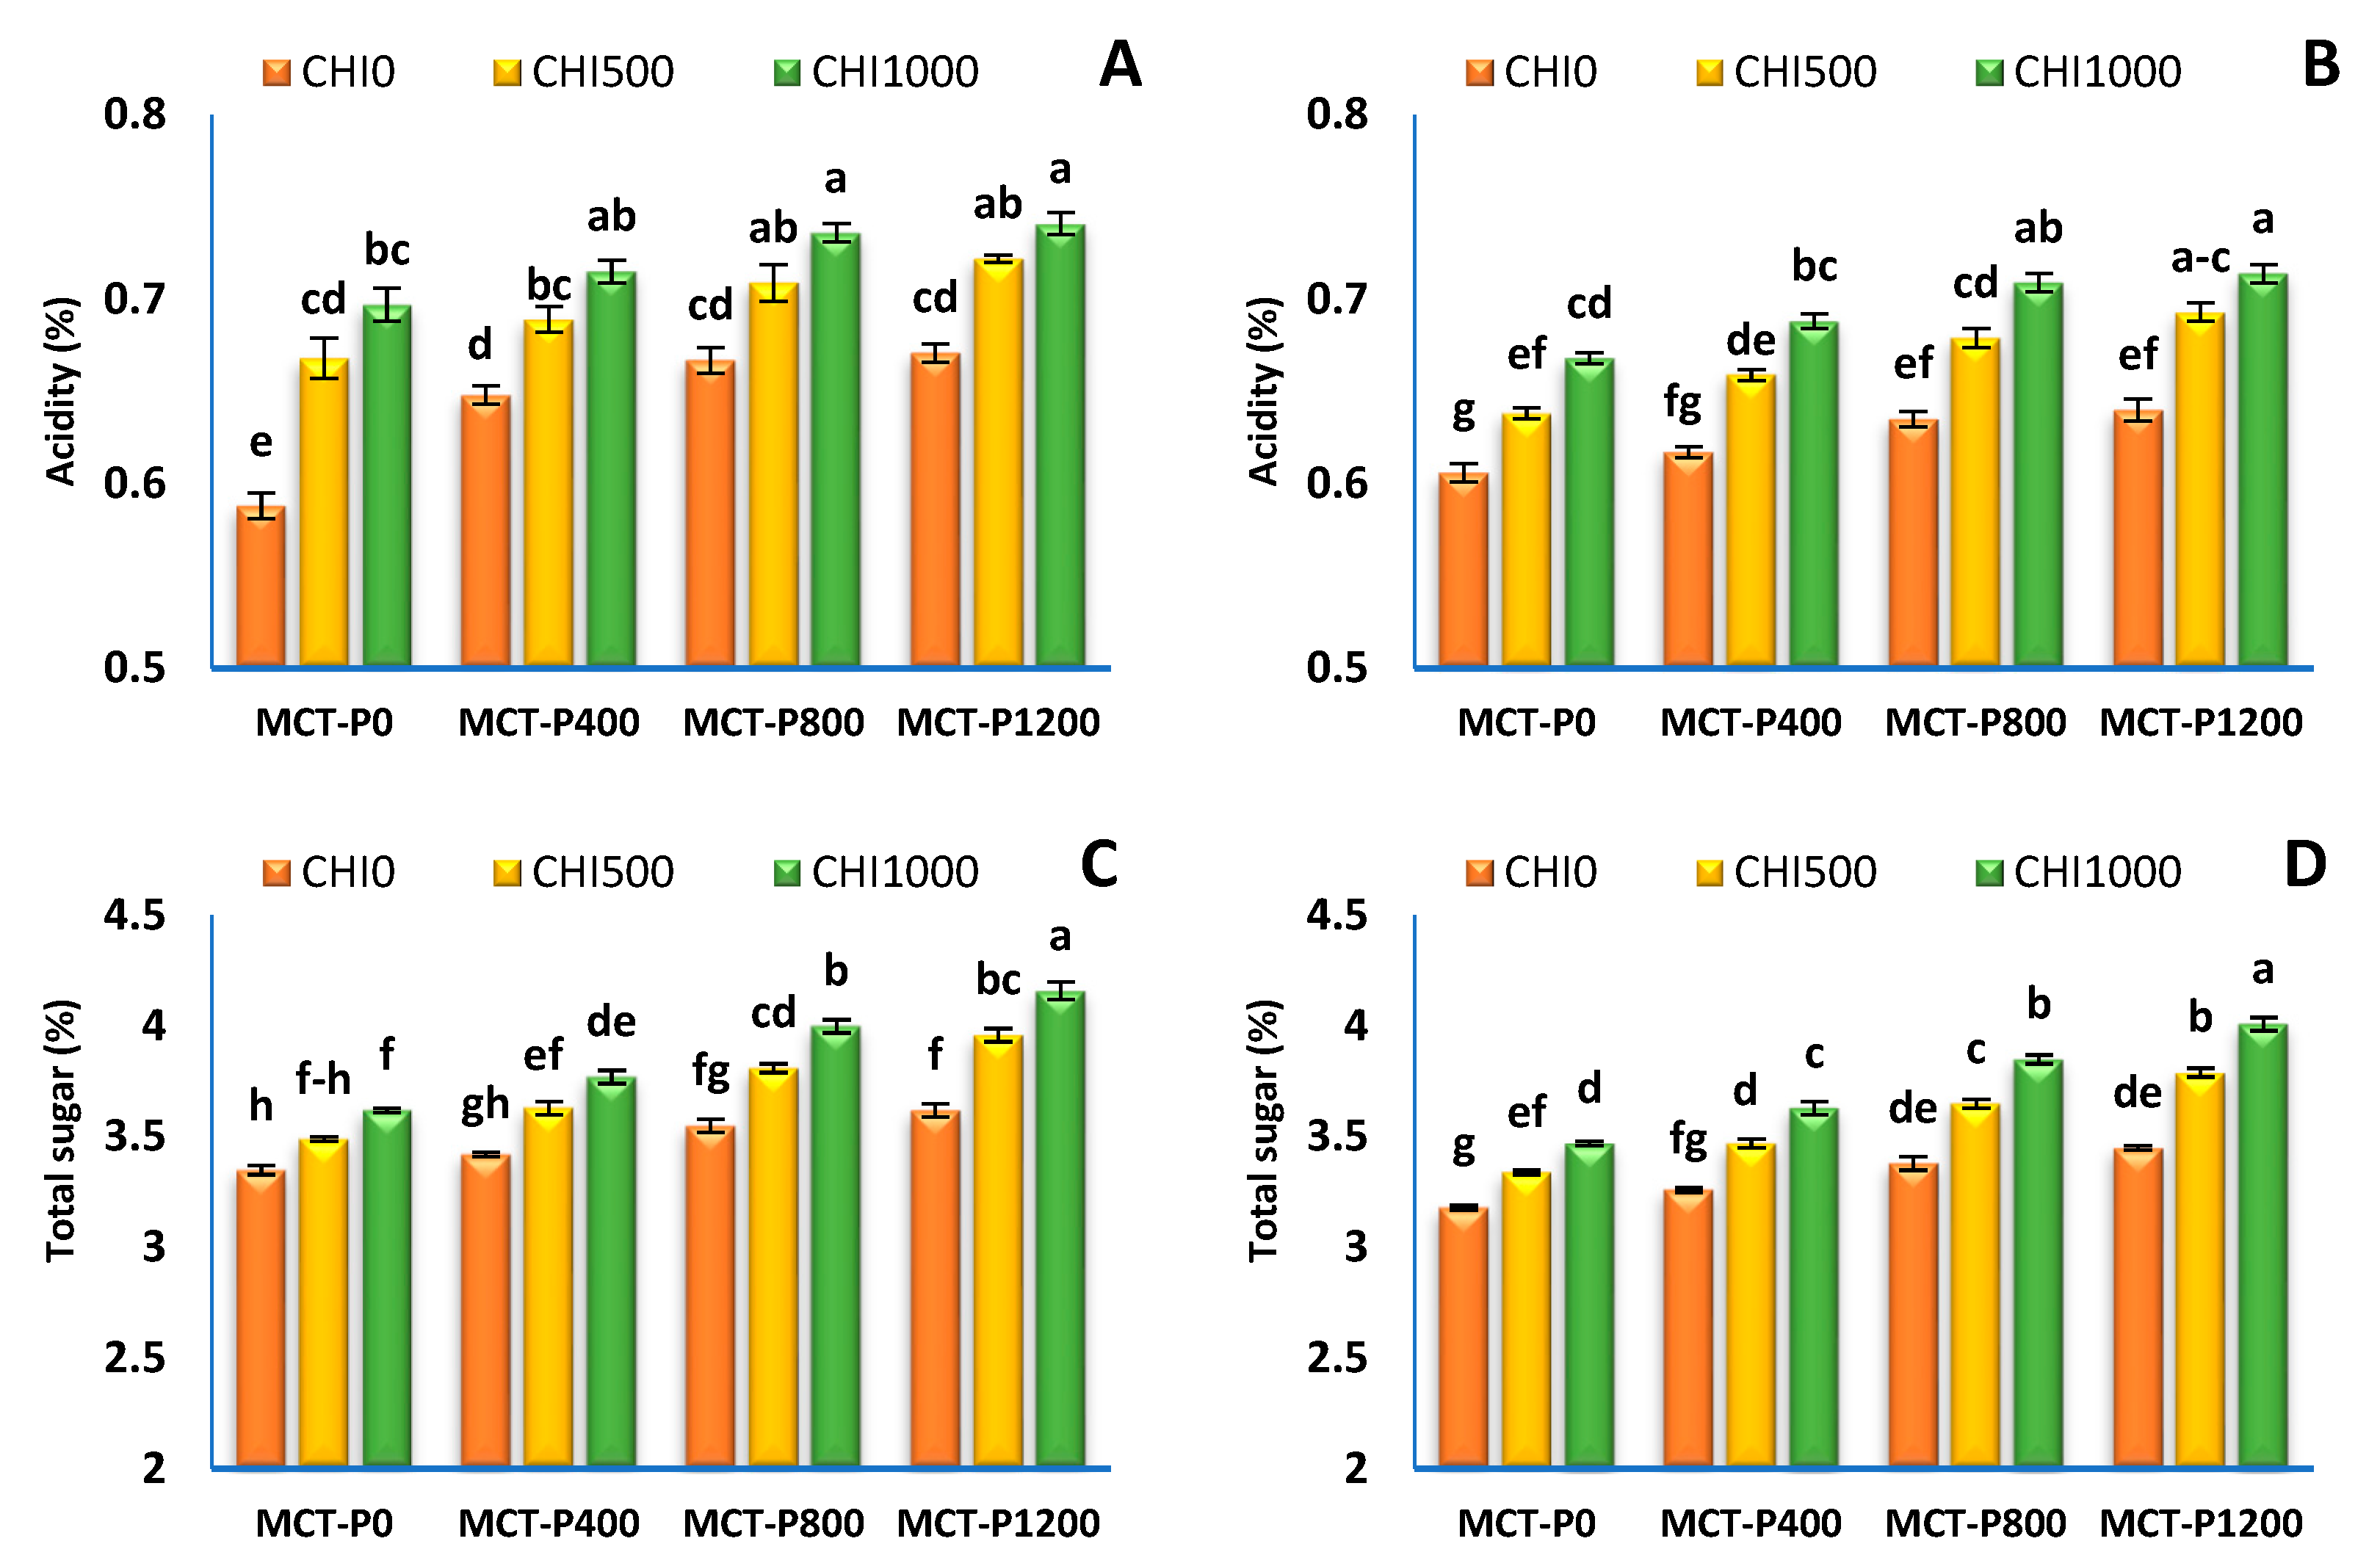
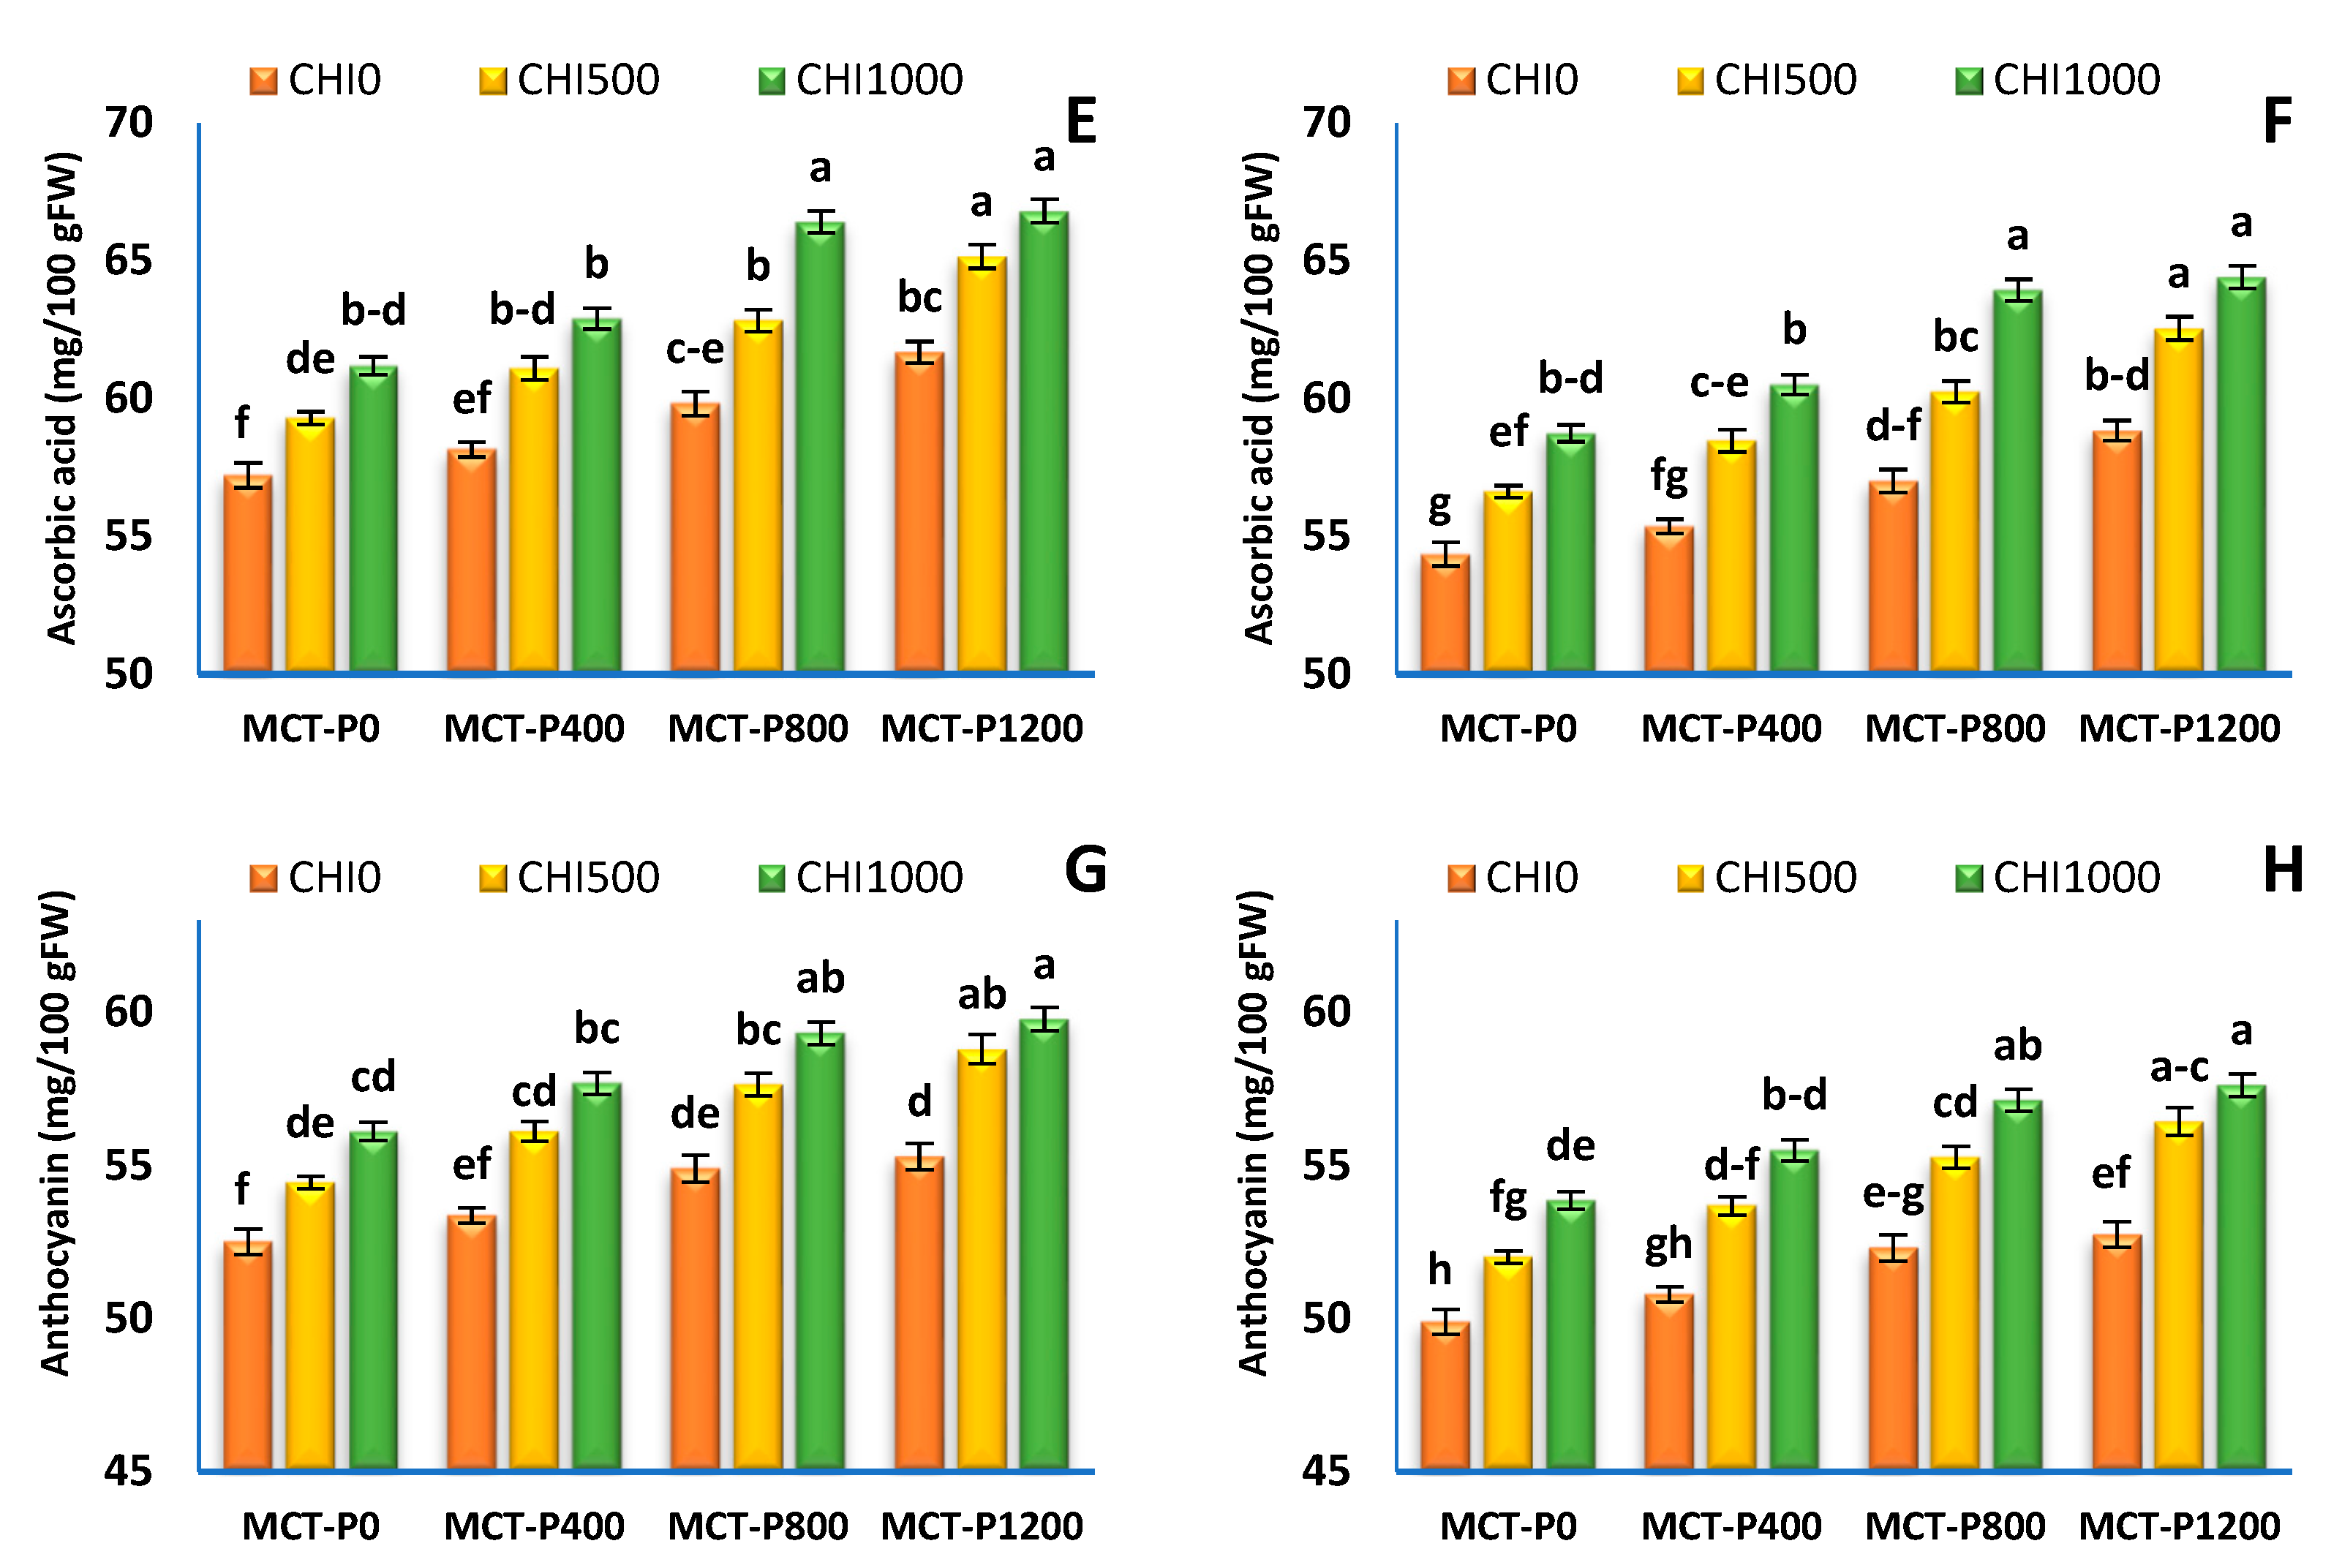
Data presented in Table 6 and Figure 6 show that spraying of either MCT-P or CHI and their combinations significantly increased all fruit quality parameters, i.e., acidity, total sugars, vitamin C, and anthocyanin concentration relative to the untreated plants. The most effective MCT-P level was 1200 mgL−1, CHI was 1000 mgL−1 and additionally, the interaction between them yielded the greatest values relative to their other concentrations or the control plants.

4. Discussion

Chitosan and phosphorus have been described as naturally occurring, high-potential biomolecules that stimulate the growth and development of several plants [22,24,30,31,32,36,38,39,40] for CHI; and [14,15,19] for phosphorus. It is unclear how CHI or MCT-P promote plant development, although there are a few possibilities that are presumably interconnected and can be summed up as follows: (1) Improvement of several biochemical pathways, including protein synthesis, cell elongation, enzymatic activity, as well as water and nutrient use efficiency [29,40] for CHI and [48,49] for P. (2) Enhancing the essential N-mobilizing enzyme activities, enhancing N-transportation in functioning leaves, and boosting the photosynthetic process and stomatal conductance [14,50,51,52]. (3) Reducing transpiration rate and then improving plant water status [37]. (4) Motivating plant growth substance production, such as auxin and cytokinin, which additionally boosts ion uptake, resulting from accelerated root cell divisions [24,53].
Supplemental CHI and MCT-P significantly increased photosynthetic pigment concentrations in a manner that was consistent with the results of Bakhoum et al. [24]; Farouk et al. [30]; Farouk et al. [31]; Farouk and Al-Sanoussi [34]; Khalil and Badr Eldin [36]; Akhtar et al. [40]; Farouk et al. [54]; for CHI; and Antón-Herrero et al. [19] for phosphorus. This increase possibly is attributable to (1) enhancing cytokinin assimilation that stimulated chlorophyll biosynthesis or the rise of amino acid accessibility released from CHI [55]; (2) an increase in carotenoids (Table 3) that shielded light receptors and photosystems from ROS; and (3) an increase in nitrogen and magnesium uptake that accelerates chlorophyll biosynthesis [19,53,56].
The increase in yield and its components was consistent with previously recorded studies [12,14,48,57,58] for P; and [24,32,38,39] for CHI. The increase may be due to: (1) Activating a number of metabolic pathways, which enhances vegetative development and accelerates the transport of photo-assimilation from source to sink. Accordingly, Ahmad et al. [12] and Rahman et al. [38] noted that the phosphorus and CHI spraying on strawberry, respectively, optimized yield components and quality. (2) Maintaining chloroplast fine structure and stomatal conductance, which boosted the production of photoassimilates and the accumulation of plant biomass [51]. (3) Modifying protein programming with the enrichment of certain storage proteins and hormone assimilation as well as accelerating overexpression of genes associated with photosynthesis [59]. (4) Inducing the accessibility of phosphorus which may have facilitated the development of more branches and a larger canopy and, in turn, increased the number of total fruits produced [15,20,56,60].
The use of either MCT-P or CHI concentrations alone or in combination improved all quality parameters in the majority of cases (Table 6). These findings concur with those of Rahman et al. [38] and Abdel-Mawgoud et al. [61] for CHI as well as Antón-Herrero et al. [19] and Balibrea et al. [62] for P. Accordingly, Ahmad et al. [12] and El-Miniawy et al. [63] found that P and CHI application on the strawberry, respectively, significantly improved fruit quality traits, such as total acidity, and ascorbic acid content.
Anthocyanin is a water-soluble phytochemical that gives the strawberry fruit color and is responsible for the cardio-protective effects of the strawberry fruit [64,65]. The chemoprevention activity of anthocyanin on human cancer cells is supported by a number of lines of evidence [66]. The treatment with 1200 mgL−1 MCT-P or 1000 mgL−1 CHI and their combinations was found to accelerate the highest anthocyanin concentrations (Table 6, Figure 6). According to Antón-Herrero et al. [19] and Rahman et al. [38], applying MCT-P and CHI raises anthocyanin levels in sweet pepper and strawberry fruits, respectively. In our research, we found that applying a low concentration of CHI and/or MCT-P to the strawberry plants’ canopy resulted in fresh strawberry fruit that had more anthocyanin than the untreated control. Additionally, Zhang and Quantick [67], found that the application of CHI on litchi fruit postponed changes in the concentrations of anthocyanin, flavonoid, and total phenolic and partially reduced post-harvest deterioration.
Strawberries are currently popular due to their extraordinarily high vitamin C content, which places them as the second-most significant source of vitamin C for human nutrition [68,69]. According to So’jka et al. [70] outcomes, ascorbic acid and anthocyanin combined contributed to the strawberry fruit’s antioxidant properties. There is scant information on the beneficial effects of CHI and MCT-P application on strawberry plants, which results in notable increases in the ascorbic acid and anthocyanin of freshly picked strawberry fruit. Ahmad et al. [12] reported that ascorbic acid concentration in strawberry fruit significantly increased with P application. Although the mechanism of CHI- and/or MCT-P-induced superior fruit yield and antioxidant capacity in strawberry fruit is not addressed currently, more research is required to confirm their functions in the strawberry’s antioxidant capacity [59,71].
The results of this study demonstrated that exogenously applying CHI and/or MCT-P might greatly boost the total sugars in strawberry fruits. There are two possible explanations for this. First, strawberry plants with a higher P content have better photosynthesis [40,72,73,74]. Second, the transport and partition of sugar may be impacted by phosphate [72,73]. There is evidence that the presence of P in plants affects how carbon is distributed between the roots and the shoots [75]. Phosphorus affects this reformed root trait by altering the developmental programs that normalize the initiation and emergence of lateral root primordia, primary and lateral root growth, and the density of root hair elongation [14,15].

5. Conclusions

The application of non-chemical technologies in crop production is more promising as we transition to organic farming. Accordingly, foliar application of CHI and MCT-P greatly boosted growth and fruit yield in addition to enhancing the strawberry fruit’s benefits for human health by causing a higher production of ascorbic acid, and anthocyanin. We recommend spraying strawberry cv. Fortuna with 1200 mgL−1 MCT-P plus 1000 mg L−1 CHI every two weeks, from 60 days after transplanting until two weeks before the end of harvesting season for the highest fruit yield and quality. Better use of CHI and/or MCT-P would result in more research into the mechanisms underlying the augmentation of strawberry growth, yield, and biochemical contents. The main objective of future research should be the induction of genes involved in the growth and excessive production of secondary metabolites in strawberries.

Supplementary Materials

The following supporting information can be downloaded at: https://www.mdpi.com/article/10.3390/horticulturae9030368/s1, Table S1: Mean of monthly climatic data of the experimental site throughout the experimental period.

Author Contributions

Conceptualization, E.-S.E.M. and S.F.; methodology, E.-S.E.M. and G.F.O.; software, S.F.; validation, E.-S.E.M., A.A.A.-H. and G.F.O.; formal analysis, E.-S.E.M. and S.F.; investigation, E.-S.E.M.; resources, E.-S.E.M.; data curation, E.-S.E.M., S.F. and G.F.O.; writing—original draft preparation, E.-S.E.M., A.A.A.-H. and G.F.O.; writing—review and editing, S.F.; visualization, E.-S.E.M., A.A.A.-H., S.F. and G.F.O.; supervision, S.F.; project administration, E.-S.E.M.; funding acquisition, A.A.A.-H. All authors have read and agreed to the published version of the manuscript.

Funding

This research was funded by Princess Nourah bint Abdulrahman University Researchers supporting project number (PNURSP2023R93), Princess Nourah bint Abdulrahman University, Riyadh, Saudi Arabia.

Institutional Review Board Statement

Not applicable.

Informed Consent Statement

Not applicable.

Data Availability Statement

Not applicable.

Acknowledgments

The authors express their gratitude to Princess Nourah bint Abdulrahman University Researchers supporting project number (PNURSP2023R93), Princess Nourah bint Abdulrahman University, Riyadh, Saudi Arabia, as well as Mansoura University and Suez Canal University, Egypt.

Conflicts of Interest

The authors declare no conflict of interest.

References

  1. Bach-Faig, A.; Berry, E.M.; Lairon, D.; Reguant, J.; Trichopoulou, A.; Dernini, S.; Medina, F.X.; Battino, M.; Belahsen, R.; Miranda, G.; et al. Mediterranean diet foundation expert group. Mediterranean diet pyramid today. Science and cultural updates. Public Health Nutr. 2011, 14, 2274–2284. [Google Scholar] [CrossRef] [PubMed] [Green Version]
  2. Giampieri, L.; Alvarez-Suarez, J.M.; Mazzoni, L.; Romandini, S.; Bompadre, S.; Diamanti, J.; Capocasa, F.; Mezzetti, B.; Quiles, J.L.; Ferreiro, M.S.; et al. The potential impact of strawberry on human health. Nat. Prod. Res. 2013, 27, 448–455. [Google Scholar] [CrossRef]
  3. Romandini, S.; Mazzoni, L.; Giampieri, F.; Tulipani, S.; Gasparrini, M.; Forbes-Hernandez, T.Y.; Locorotondo, N.; D’Alessandro, M.; Mezzetti, B.; Bompadre, S.; et al. Effects of an acute strawberry (Fragaria × ananassa) consumption on the plasma antioxidant status of healthy subjects. J. Berry Res. 2013, 3, 169–179. [Google Scholar] [CrossRef] [Green Version]
  4. Basu, A.; Nguyen, A.; Betts, N.M.; Lyons, T.J. Strawberry as a functional food: An evidence-based review. Crit. Rev. Food Sci. Nutr. 2014, 54, 790–806. [Google Scholar] [CrossRef] [PubMed]
  5. Nishu, S.M.; Bandral, J.D. Nutritional benefits and value added products of strawberry. Indian Farmer 2021, 8, 67–73. [Google Scholar]
  6. Hannum, S.M. Potential impact of strawberries on human health: A review of the science. Crit. Rev. Food Sci. Nutr. 2004, 44, 1–17. [Google Scholar] [CrossRef] [PubMed]
  7. FAOSTAT—Food and Agriculture Organization Corporate Statistical Database 2022. FAO Online Database. Available online: http://www.fao.org/faostat/en/#data (accessed on 1 March 2023).
  8. Sharma, K.; Negi, M. Effect of organic manures and inorganic fertilizers on plant growth of strawberry (Fragaria x ananassa) cv. Shimla delicious under mid-hill conditions of Uttarakhand. J. Pharmacogn. Phytochem. 2019, 8, 1440–1444. [Google Scholar]
  9. Wang, S.Y. Antioxidant and health benefits of Strawberry. Acta Hortic. 2014, 1049, 49–62. [Google Scholar] [CrossRef]
  10. Giampieri, F.; Forbes-Hernandez, T.Y.; Gasparrini, M.; Alvarez-Suarez, J.M.; Afrin, S.; Bompadre, S.; Quiles, J.L.; Mezzettia, B.; Battino, M. Strawberry as a health promoter: An evidence-based review. Food Funct. 2015, 6, 1386–1398. [Google Scholar] [CrossRef] [Green Version]
  11. Mohamed, F.A.; Gaber, S.M. Effect of organic manure and chemical fertilization on the growth, yield and quality characteristics of strawberry. J. Agric. Sci. Mansoura Univ. 2002, 27, 561–572. [Google Scholar] [CrossRef]
  12. Ahmad, H.; Sajjid, M.; Hayat, S.; Ullah, R.; Ali, M.; Jamal, A.; Rahman, A.; Aman, Z.; Ali, J. Growth, yield and fruit quality of strawberry (Frageria ananasa Dutch) under different phosphorus levels. Res. Agric. 2017, 2, 19–28. [Google Scholar] [CrossRef] [Green Version]
  13. Muhaba, S.; Dakora, F. Symbiotic performance, shoot biomass and water-use efficiency of three groundnut (Arachis hypogaea L.) genotypes in response to phosphorus supply under field conditions in Ethiopia. Front. Agric. Sci. Eng. 2020, 7, 455–466. [Google Scholar] [CrossRef]
  14. Dikr, W.; Abayechaw, D. Effects of phosphorus fertilizer on agronomic, grain yield and other physiological traits of some selected legume crops. J. Biol. Agric. Healthc. 2022, 12, 1–13. [Google Scholar]
  15. Gong, H.; Xiang, Y.; Wako, B.K.; Jiao, X. Complementary effects of phosphorus supply and planting density on maize growth and phosphorus use efficiency. Front. Plant Sci. 2022, 13, 983788. [Google Scholar] [CrossRef] [PubMed]
  16. Taiz, L.; Zeiger, E. Fisiologia Vegetal, 5th ed.; Artmed: Porto Alegre, Brazil, 2013; 918p. [Google Scholar]
  17. Johan, P.D.; Ahmed, O.H.; Omar, L.; Hasbullah, N.A. Phosphorus transformation in soils following co-application of charcoal and wood ash. Agronomy 2021, 11, 2010. [Google Scholar] [CrossRef]
  18. Malhi, S.S.; Haderlein, L.K.; Pauly, D.G.; Johnston, A.M. Improving fertilizer phosphorus use efficiency. Better Crops 2022, 86, 8–9. [Google Scholar]
  19. Antón-Herrero, R.; García-Delgado, C.; Mayans, B.; Camacho-Arévalo, R.; Eymar, E. Impact of new micro carbon technology-based fertilizers on growth, nutrient efficiency and root cell morphology of Capsicum annuum L. Agronomy 2020, 10, 1165. [Google Scholar] [CrossRef]
  20. Antón-Herrero, R.; García-Delgado, C.; Mayans, B.; Camacho-Arévalo, R.; Delgado-Moreno, L.; Eymar, E. Biostimulant effects of micro carbon technology (MCT®)-based fertilizers on soil and Capsicum annuum culture in growth chamber and field. Agronomy 2022, 12, 70. [Google Scholar] [CrossRef]
  21. Crawford, T. Use of Micro Carbon Technology to Improve Phosphorus Availability. SW Ag Summit. Available online: https://sbsoliplant.nl/en/mct/ (accessed on 17 November 2022).
  22. Bibi, A.; Ibrar, M.; Shalmani, A.; Rehan, T.; Quratulain. A review on recent advances in chitosan applications. Pure Appl. Biol. 2021, 10, 1217–1229. [Google Scholar] [CrossRef]
  23. Yu, J.; Wang, D.; Geetha, N.; Khawar, K.M.; Jogaiah, S.; Mujtaba, M. Current trends and challenges in the synthesis and applications of chitosan-based nanocomposites for plants: A review. Carbohydr. Polym. 2021, 261, 117904. [Google Scholar] [CrossRef] [PubMed]
  24. Bakhoum, G.S.; Sadak, M.S.; Tawfik, M.M. Chitosan and chitosan nanoparticle effect on growth, productivity and some biochemical aspects of Lupinus termis L. pant under drought conditions. Egypt. J. Chem. 2022, 65, 537–549. [Google Scholar]
  25. El Hadrami, A.; Adam, L.; El Hadrami, I.; Daayf, F. Chitosan in plant protection. Mar. Drugs 2010, 8, 968–987. [Google Scholar] [CrossRef] [PubMed]
  26. Algam, S.; Xie, G.; Li, B.; Yu, S.; Su, T.; Larsen, J. Effects of Paenibacillus strains and chitosan on plant growth promotion and control of Ralstonia wilt in tomato. J. Plant Pathol. 2010, 92, 593–600. [Google Scholar]
  27. Solgi, M. The application of new environmentally friendly compounds on postharvest characteristics of cut carnation (Dianthus caryophyllus L.). Braz. J. Bot. 2018, 41, 515–522. [Google Scholar] [CrossRef]
  28. Nguyen, T.; Thi, T.; Nguyen, T.T.; Le, T.; Vo, D.; Nguyen, D.; Nguyen, C.; Nguyen, D.; Nguyen, T.; Bach, L. Investigation of chitosan nanoparticles loaded with protocatechuic acid (Pca) for the resistance of Pyricularia oryzae fungus against rice blast. Polymers 2019, 11, 177. [Google Scholar]
  29. Hidangmayum, A.; Dwivedi, P.; Katiyar, D.; Hemantaranjan, A. Application of chitosan on plant responses with special reference to abiotic stress. Physiol. Mol. Biol. Plants 2019, 25, 313–326. [Google Scholar] [CrossRef]
  30. Farouk, S.; Ghoneem, K.M.; Ali, A.A. Induction and expression of systemic resistance to downy mildew disease in cucumber by elicitors. Egypt. J. Phytopathol. 2008, 36, 95–111. [Google Scholar]
  31. Farouk, S.; Mosa, A.A.; Taha, A.A.; Ibrahim, H.M.; El-Gahmery, A.M. Protective effect of humic acid and chitosan on radish (Raphanus sativus L. var. sativus) plants subjected to cadmium stress. J. Stress Physiol. Biochem. 2011, 7, 99–116. [Google Scholar]
  32. Farouk, S.; Ramadan, A.A. Improving growth and yield of cowpea by foliar application of chitosan under water stress. Egypt. J. Biol. 2012, 14, 14–26. [Google Scholar] [CrossRef] [Green Version]
  33. Helaly, M.; Farouk, S.; Arafa, S.A.; Amhimmid, N.B. Inducing salinity tolerance of rosemary (Rosmarinus Officinalis, L.) plants by chitosan or zeolite application. Asian J. Adv. Agric. Res. 2018, 5, 34. [Google Scholar] [CrossRef]
  34. Farouk, S.; Al-Sanoussi, A.J. The role of biostimulants in increasing barley plant growth and yield under newly cultivated sany soil. Cercet. Agron. În Mold. 2019, 2, 114–125. [Google Scholar]
  35. Faqir, Y.; Ma, J.; Chai, Y. Chitosan in modern agriculture production. Plant Soil Environ. 2021, 67, 679–699. [Google Scholar] [CrossRef]
  36. Khalil, H.A.; Badr Eldin, R.M. Chitosan improves morphological and physiological attributes of grapevines under deficit irrigation conditions. J. Hortic. Res. 2021, 29, 9–22. [Google Scholar] [CrossRef]
  37. Bittelli, M.; Flury, M.; Campbell, G.S.; Nichols, E.J. Reduction of transpiration through foliar application of chitosan. Agric. For. Meteorol. 2001, 107, 167–175. [Google Scholar] [CrossRef]
  38. Rahman, M.; Mukta, J.A.; Sabir, A.A.; Gupta, D.R.; Mohi-Ud-Din, M.; Hasanuzzaman, M.; Miah, M.G.; Rahman, M.; Islam, M.T. Chitosan biopolymer promotes yield and stimulates accumulation of antioxidants in strawberry fruit. PLoS ONE 2018, 13, e0203769. [Google Scholar] [CrossRef]
  39. Khordadi Varamin, J.; Fanoodi, F.; Masoud Sinaki, J.; Rezvan, S.; Damavandi, A. Foliar application of chitosan and nano-magnesium fertilizers influence on seed yield, oil content, photosynthetic pigments, antioxidant enzyme activities of sesame (Sesamum indicum L.) under water- limited conditions. Not. Bot. Horti Agrobot. Cluj-Napoca 2020, 48, 2228–2243. [Google Scholar] [CrossRef]
  40. Akhtar, G.; Faried, H.N.; Razzaq, K.; Ullah, S.; Wattoo, F.M.; Shehzad, M.A.; Sajjad, Y.; Ahsan, M.; Javed, T.; Dessoky, E.S.; et al. Chitosan-Induced Physiological and Biochemical Regulations Confer Drought Tolerance in Pot Marigold (Calendula officinalis L.). Agronomy 2022, 12, 474. [Google Scholar] [CrossRef]
  41. Page, A.L.; Miller, R.H.; Keeney, D.R. Methods of Soil Analysis—Chemical and Microbiology Properties; SSSA Inc.: Madison, WI, USA, 1982. [Google Scholar]
  42. Lichtenthaler, H.K.; Wellburn, A.R. Determinations of total carotenoids and chlorophylls a and b of leaf extracts in different solvents. Biochem. Soc. Trans. 1983, 11, 591–592. [Google Scholar] [CrossRef] [Green Version]
  43. Kumar, S.; Kumar, R.; Nambi, V.E.; Gupta, R.K. Postharvest changes in antioxidant capacity, enzymatic activity, and microbial profle of strawberry fruits treated with enzymatic and divalent ions. Food Bioprocess. Technol. 2014, 7, 2060–2070. [Google Scholar] [CrossRef]
  44. AOAC. Official Methods of Analysis, 20th ed.; Association of Official Analytical Chemists: Arlington, VA, USA, 1990. [Google Scholar]
  45. Mazumdar, B.C.; Majumder, K. Methods on Physico-Chemical Analysis of Fruits; Daya Publishing House: New Delhi, India, 2003. [Google Scholar]
  46. Sadasivam, S.; Manickam, A. Biochemical Methods, 3rd ed.; New Age International (P) Ltd. Publishers: New Delhi, India, 2008. [Google Scholar]
  47. Norman, G.R.; Streiner, D.L. PDQ Statistics, 3rd ed.; BC Deckker Inc.: London, UK, 2003. [Google Scholar]
  48. Marschner, H. Mineral Nutrition of Higher Plants, 2nd ed.; Academic Press Inc.: San Diego, CA, USA, 1990. [Google Scholar]
  49. Ibrahim, M.; Iqbal, M.; Tang, Y.-T.; Khan, S.; Guan, D.-X.; Li, G. Phosphorus mobilization in plant–soil environments and inspired strategies for managing phosphorus: A review. Agronomy 2022, 12, 2539. [Google Scholar] [CrossRef]
  50. Sultana, S.; Islam, M.; Khatun, M.A.; Hassain, M.A.; Huque, R. Effect of foliar application of oligo-chitosan on growth, yield and quality of tomato and eggplant. Asian J. Agric. Res. 2017, 11, 36–42. [Google Scholar] [CrossRef] [Green Version]
  51. Khan, W.M.; Prithiviraj, B.; Smith, D.L. Effect of foliar application of chitin oligosaccharides on photosynthesis of maize and soybean. Photosynthetica 2002, 40, 621–624. [Google Scholar] [CrossRef]
  52. Hameed, A.; Sheikh, M.; Hameed, A.; Farooq, T.; Basra, S.; Jamil, A. Chitosan priming enhances the seed germination, antioxidants, hydrolytic enzymes, soluble proteins and sugars in wheat seeds. Agrochimica 2013, 67, 32–46. [Google Scholar]
  53. Dzung, N.A.; Khanh, V.T.P.; Dzung, T.T. Research on impact of chitosan oligomers on biophysical characteristics, growth, development and drought resistance of coffee. Carbohydr. Polym. 2011, 84, 751–755. [Google Scholar] [CrossRef]
  54. Farouk, S.; Belal, B.E.A.; El-Sharkawy, H.H.A. The role of some elicitors on the management of Roumy Ahmar grapevines downy mildew disease and it’s related to inducing growth and yield characters. Sci. Hort. 2017, 225, 646–658. [Google Scholar] [CrossRef]
  55. Chibu, H.; Shibayama, H. Effects of Chitosan Applications on the Growth of Several Crops. In Proceedings of the Eighth International Chitin and Chitosan Conference and Fourth Asia Pacific Chitin and Chitosan Symposium, Yamaguchi, Japan, 21–23 September 2000; pp. 235–239. [Google Scholar]
  56. Bistgani, Z.E.; Hashemi, M.; Hamid, R. Fertilizer source and chitosan effect on productivity, nutrient accumulation, and phenolic compounds of Thymus daenensis Celak. Agron. J. 2021, 113, 5499–5515. [Google Scholar] [CrossRef]
  57. Mohamed, R.A.; Abd El-Aal, H.; Abd El-Aziz, M.G. Effects of phosphorus, zinc and their interactions on vegetative growth characters, yield and fruit quality of strawberry. J. Hort. Sci. 2011, 3, 106–114. [Google Scholar]
  58. Wondimkun, D.; Hailu, G. Evaluation of the agronomic traits and grain yield of mung bean (Vigna radiata L.) by different levels of phosphorus fertilizer with row spacings at abine germama kebele in Adamitulu Jido kombolcha Wereda. J. Biol. Agric. Healthc. 2022, 12, 25–36. [Google Scholar]
  59. Landi, L.; De MiccolisAngelini, R.M.; Pollastro, E.; Feliziani, S.; Faretra, F.; Romanazzi, G. Global transcriptome analysis and identification of differentially expressed genes in strawberry after preharvest application of Benzothiadiazole and chitosan. Front. Plant Sci. 2017, 8, 235. [Google Scholar] [CrossRef] [PubMed] [Green Version]
  60. Arega, A.; Zenebe, M. Common bean (Phaseolus vulgaris L.) varieties response to rates of blended NPKSB fertilizer at Arba Minch, Southern Ethiopia. In Proceedings of the Advances in Crop Science and Technology, Workshop, Addis Ababa, Ethiopia, 1–3 October 1990; 114p. [Google Scholar]
  61. Abdel-Mawgoud, A.M.R.; Tantawy, A.S.; El-Nemr, M.A.; Sassine, Y.N. Growth and yield responses of strawberry plants to chitosan application. Eur. J. Sci. Res. 2010, 39, 161–168. [Google Scholar]
  62. Balibrea, M.A.; Andujar, C.M.; Cuartero, J.; Bolarin, M.C.; Alfocea, F.P. The high fruit soluble sugar content in wild Lycopersicon species and their hybrids with cultivars depends on sucrose import during ripening rather than on sucrose metabolism. Funct. Plant Biol. 2006, 33, 279–288. [Google Scholar] [CrossRef]
  63. El-Miniawy, S.M.; Ragab, M.E.; Youssef, S.M.; Metwally, A.A. Response of strawberry plants to foliar spraying of chitosan. Res. J. Agric. Biol. Sci. 2013, 9, 366–372. [Google Scholar]
  64. Mozos, I.; Flangea, C.; Vlad, D.C.; Gug, C.; Mozos, C.; Stoian, D.; Luca, C.T.; Horbańczuk, J.O.; Horbańczuk, O.K.; Atanasov, A.G. Effects of anthocyanins on vascular health. Biomolecules 2021, 11, 811. [Google Scholar] [CrossRef] [PubMed]
  65. Aaby, K.; Skrede, G.; Wrolstad, R.E. Phenolic composition and antioxidant activities in flesh and achenes of strawberries (Fragaria ananassa). J. Agric. Food Chem. 2005, 53, 4032–4040. [Google Scholar] [CrossRef] [PubMed]
  66. Stoner, G.D.; Huang, C. Molecular mechanisms involved in chemoprevention of black raspberry extracts: From transcription factors to their target genes. Nutr. Cancer 2006, 54, 69–78. [Google Scholar]
  67. Zhang, D.; Quantick, P.C. Effects of chitosan coating on enzymatic browning and decay during postharvest storage of litchi (Litchi chinensis Son.) fruit. Postharv. Biol. Technol. 1997, 12, 195–202. [Google Scholar] [CrossRef]
  68. Ekinci, M.; Turan, M.; Yildirim, E.; Güneş, A.; Kotan, R.; Dursun, A. Effect of plant growth promoting rhizobac_teria on growth, nutrient, organic acid, amino acid and hormone content of cauliflower (Brassica oleracea L. var. botrytis) transplants. Acta Sci. Pol. Hortorum Cultus 2014, 13, 71–85. [Google Scholar]
  69. Scalzo, J.; Politi, A.; Pellegrini, N.; Mezzetti, B.; Battino, M. Plant genotype affects total antioxidant capacity and phenolic contents in fruit. Nutrition 2005, 21, 207–213. [Google Scholar] [CrossRef] [PubMed]
  70. Sójka, M.; Miszczak, A.; Sikorski, P.; Zagibajło, K.; Karlińska, E.; Kosmala, M. Pesticide residue levels in strawberry processing by-products that are rich in ellagitannins and an assessment of their dietary risk to consumers. NFS J. 2015, 1, 31–37. [Google Scholar] [CrossRef] [Green Version]
  71. Xoca-Orozco, L.Á.; Cuellar-Torres, E.A.; González-Morales, S.; Gutiérrez-Martínez, P.; López-García, U.; Herrera-Estrella, L.; Vega-Arreguín, J.; Chacón-López, A. Transcriptomic analysis of avocado hass (Persea americana Mill) in the interaction system fruit-chitosan-Colletotrichum. Front. Plant Sci. 2017, 8, 956. [Google Scholar] [CrossRef] [PubMed] [Green Version]
  72. Rouached, H.; Arpat, A.B.; Poirier, Y. Regulation of phosphate starvation responses in plants signaling players and cross-talks. Mol. Plant 2010, 3, 288–299. [Google Scholar] [CrossRef] [PubMed]
  73. Niu, Y.; Chai, R.; Dong, H. Effect of elevated CO2 on phosphorus nutrition of phosphate-deficient Arabidopsis thaliana (L.) Heynh under different nitrogen formsm. J. Exp. Bot. 2012, 64, 355–367. [Google Scholar] [CrossRef] [PubMed] [Green Version]
  74. Johnson, C.R. Phosphorus nutrition on mycorrhizal colonization, photosynthesis, growth and nutrient composition of Citrus aurantium. Plant Soil 1984, 80, 35–42. [Google Scholar] [CrossRef]
  75. Fredeen, A.L.; Rao, I.M.; Terry, N. Influence of phosphorus nutrition on growth and carbon partitioning in Glycine max. Plant Physiol. 1989, 89, 225–230. [Google Scholar] [CrossRef] [PubMed] [Green Version]
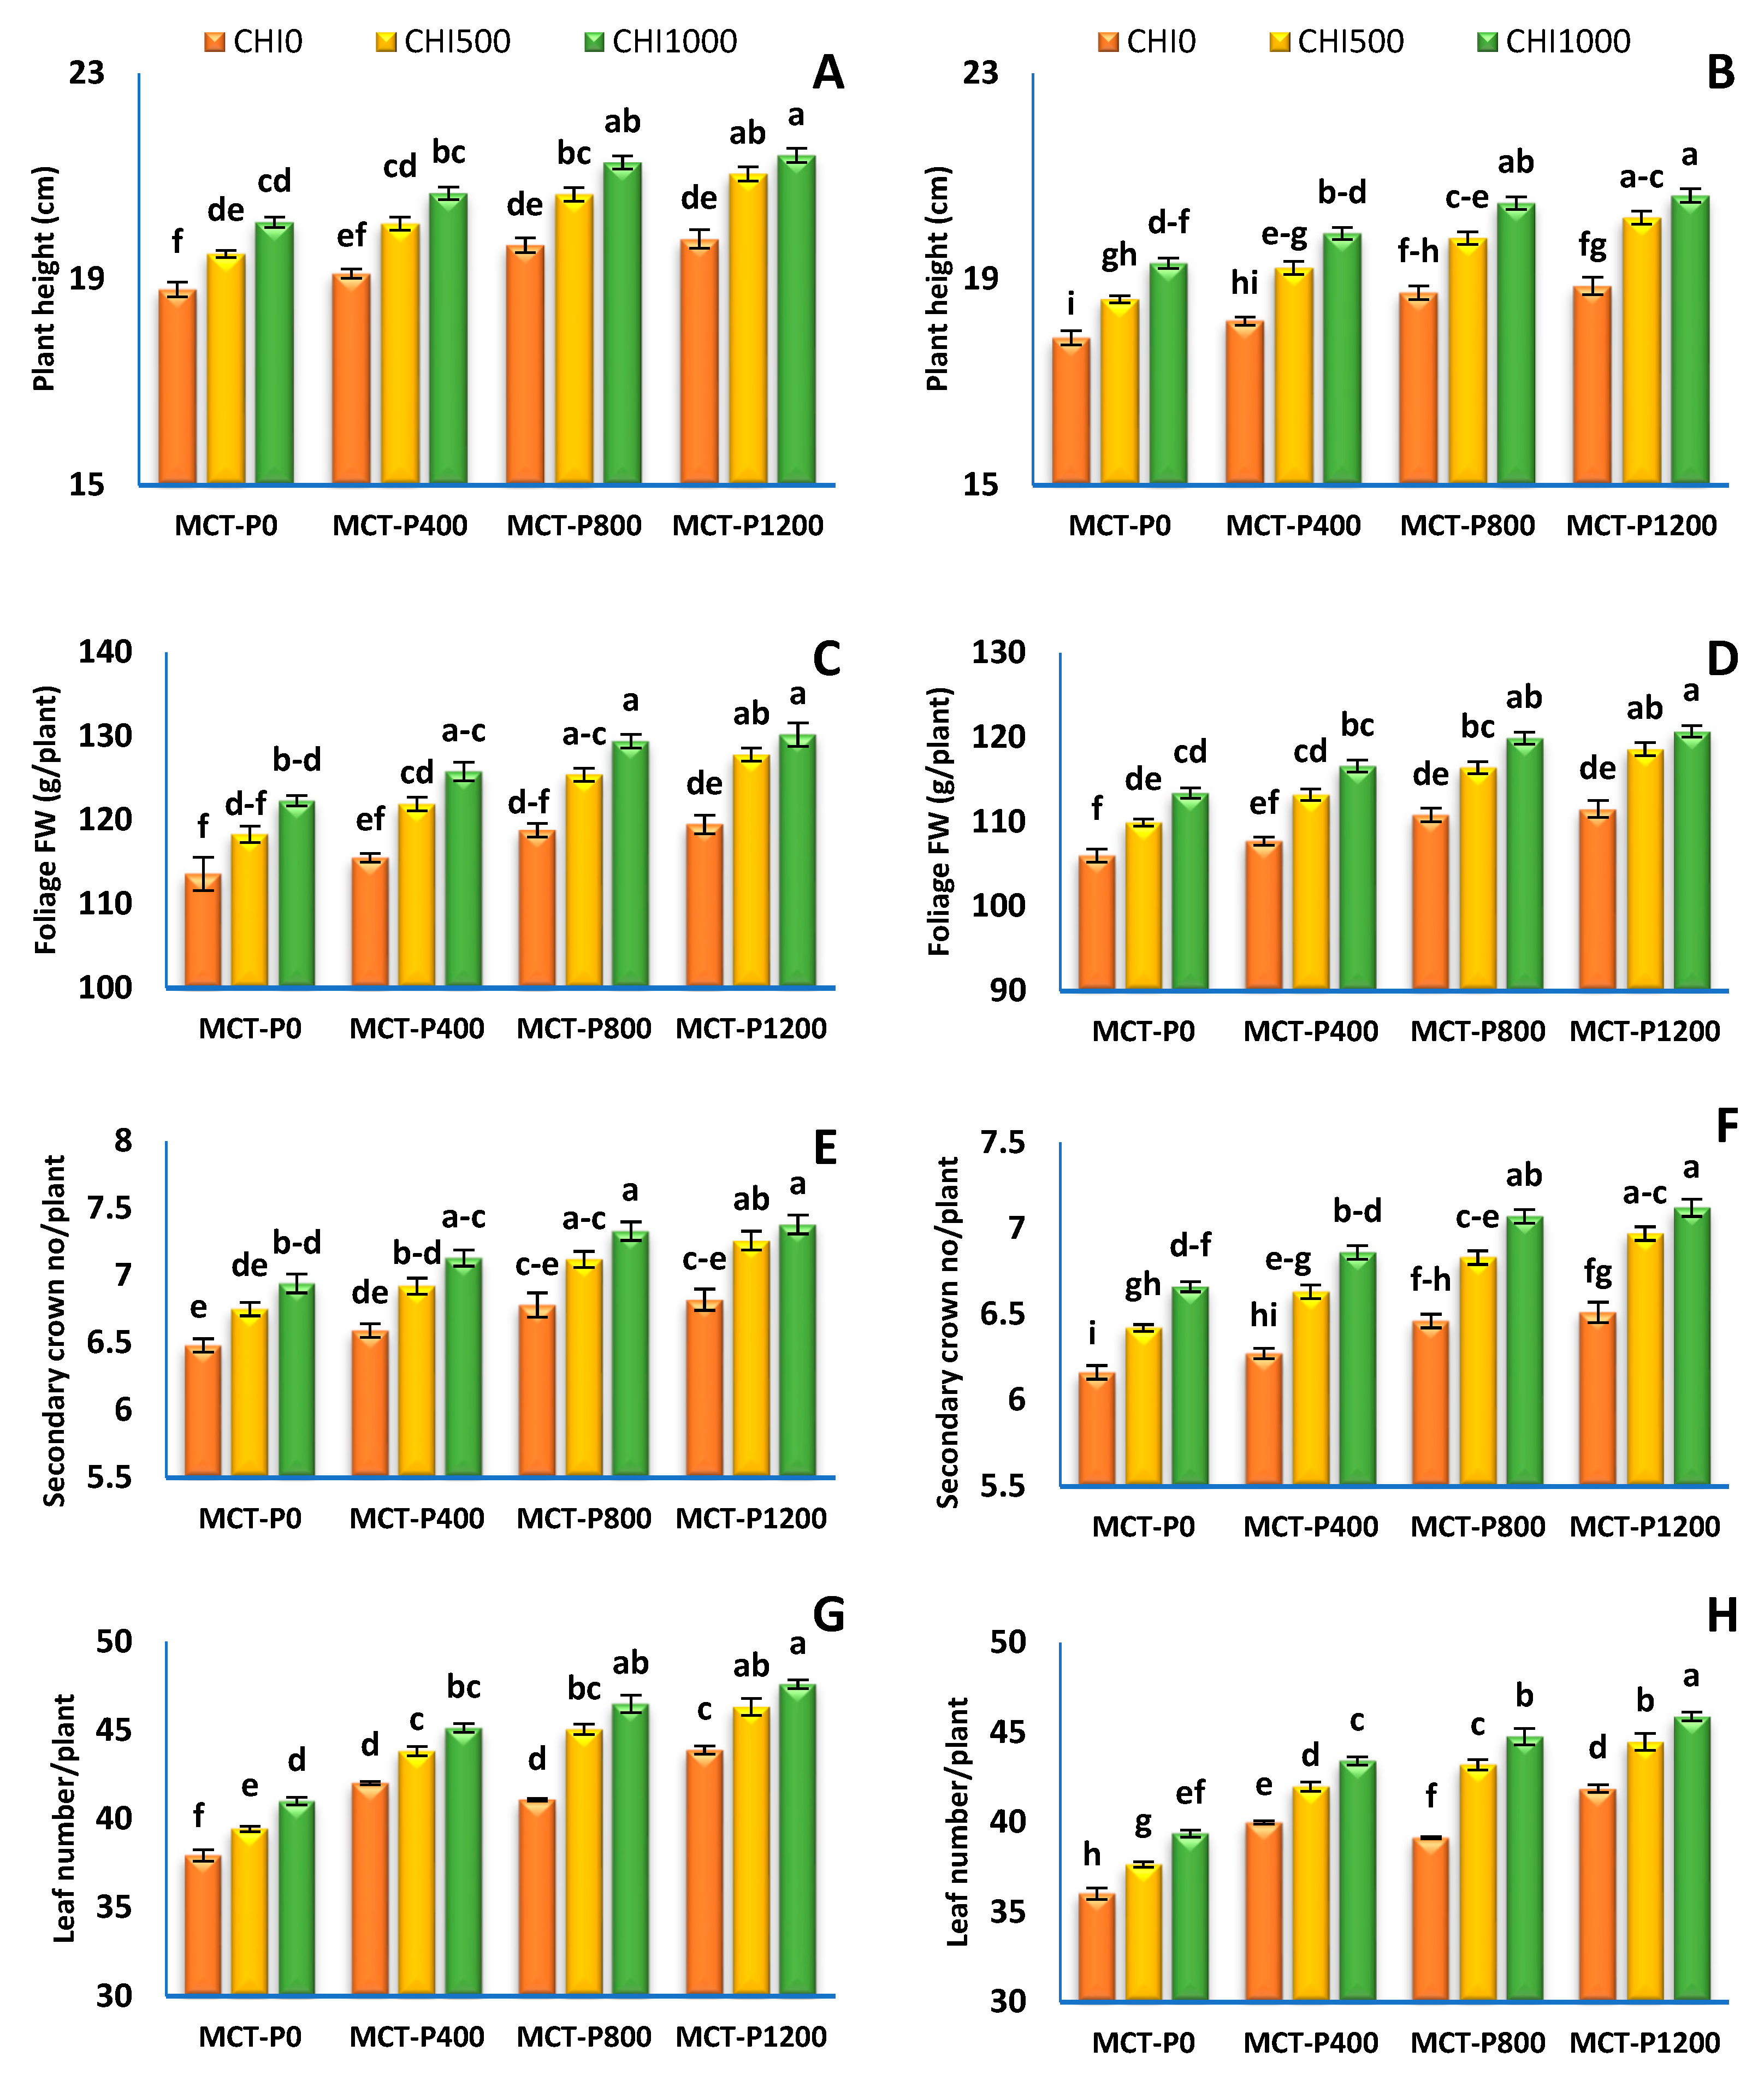
Figure 1. Strawberry plant height (A,B), foliage FW (C,D), secondary crown no./plant (E,F), leaf number/plant (G,H) and leaf area/plant (I,J) as affected by the interaction between chitosan and micro-carbon phosphorus in the first and second seasons, respectively. (CHI0, no chitosan; CHI500, 500 mgL−1 chitosan; CHI1000, 1000 mgL−1 chitosan; MCT-P0, no micro-carbon phosphorus; MCT-P400, 400 mgL−1 micro-carbon phosphorus; MCT-P800, 800 mgL−1 micro-carbon phosphorus; MCT-P1200, 1200 mgL−1 micro-carbon phosphorus; mg, milligram; g, gram; FW, fresh weight; cm, centimeter). Means values ± standard error within each column for every trial with a similar lower-case letter are not significantly different following Tukey’s HSD at p ≤ 0.05.
Horticulturae 09 00368 g001aHorticulturae 09 00368 g001b
Figure 2. Chlorophylla (A,B), Chlorophyllb (C,D) and total carotenoid (E,F) concentration (mg/100 g FW) in strawberry leaf as affected by the interaction between chitosan (CHI) and micro-carbon phosphorus (MCT-P) in the first and second season, respectively. (CHI0, no chitosan; CHI500, 500 mgL−1 chitosan; CHI1000, 1000 mgL−1 chitosan; MCT-P0, no micro-carbon phosphorus; MCT-P400, 400 mgL−1 micro-carbon phosphorus; MCT-P800, 800 mgL−1 micro-carbon phosphorus; MCT-P1200, 1200 mgL−1 micro-carbon phosphorus; mg, milligram; g, gram; FW, fresh weight). Means values ± standard error within each column for every trial with a similar lower-case letter are not significantly different following Tukey’s HSD at p ≤ 0.05.
Horticulturae 09 00368 g002
Figure 3. Early marketable (A,B), early unmarketable (C,D), and total (E,F) early fruit yield (ton/hectare) of strawberry as affected by the interaction between chitosan and micro-carbon phosphorus in the first and second seasons, respectively (CHI0, no chitosan; CHI500, 500 mgL−1 chitosan; CHI1000, 1000 mgL−1 chitosan; MCT-P0, no micro-carbon phosphorus; MCT-P400, 400 mgL−1 micro-carbon phosphorus; MCT-P800, 800 mgL−1 micro-carbon phosphorus; MCT-P1200, 1200 mgL−1 micro-carbon phosphorus). Means values ± standard error within each column for every trial with a similar lower-case letter are not significantly different following Tukey’s HSD at p ≤ 0.05.
Horticulturae 09 00368 g003aHorticulturae 09 00368 g003b
Figure 4. Marketable (A,B), unmarketable (C,D), and total (E,F) fruit yield (ton/hectare) of strawberry as affected by the interaction between chitosan and micro-carbon phosphorus in the first and second seasons, respectively (CHI0, no chitosan; CHI500, 500 mgL−1 chitosan; CHI1000, 1000 mgL−1 chitosan; MCT-P0, no micro-carbon phosphorus; MCT-P400, 400 mgL−1 micro-carbon phosphorus; MCT-P800, 800 mgL−1 micro-carbon phosphorus; MCT-P1200, 1200 mgL−1 micro-carbon phosphorus). Means values ± standard error within each column for every trial with a similar lower-case letter are not significantly different following Tukey’s HSD at p ≤ 0.05.
Horticulturae 09 00368 g004aHorticulturae 09 00368 g004b
Figure 5. Average fruit weight (A,B), fruit firmness (C,D), fruit dry matter % (E,F), and total soluble solid content (G,H) of strawberry fruits as affected by the interaction between chitosan and micro-carbon phosphorus in the first and second seasons, respectively (CHI0, no chitosan; CHI500, 500 mgL−1 chitosan; CHI1000, 1000 mgL−1 chitosan; MCT-P0, no micro-carbon phosphorus; MCT-P400, 400 mgL−1 micro-carbon phosphorus; MCT-P800, 800 mgL−1 micro-carbon phosphorus; MCT-P1200, 1200 mgL−1 micro-carbon phosphorus; g, gram; kg, kilogram; cm, centimeter; %, percentage). Means values ± standard error within each column for every trial with a similar lower-case letter are not significantly different following Tukey’s HSD at p ≤ 0.05.
Horticulturae 09 00368 g005aHorticulturae 09 00368 g005b
Figure 6. Acidity (%) (A,B), total sugar (%) (C,D), ascorbic acid concentration (E,F), and anthocyanin concentration (G,H) of strawberry fruits as affected by the interaction between chitosan and micro-carbon phosphorus in the first and second seasons, respectively (CHI0, no chitosan; CHI500, 500 mgL−1 chitosan; CHI1000, 1000 mgL−1 chitosan; MCT-P0, no micro-carbon phosphorus; MCT-P400, 400 mgL−1 micro-carbon phosphorus; MCT-P800, 800 mgL−1 micro-carbon phosphorus; MCT-P1200, 1200 mgL−1 micro-carbon phosphorus; %, percentage; mg, milligram; g, gram; FW, fresh weight). Means values ± standard error within each column for every trial with a similar lower-case letter are not significantly different following Tukey’s HSD at p ≤ 0.05.
Horticulturae 09 00368 g006aHorticulturae 09 00368 g006b
Table 1. Some physical and chemical characteristics of the experimental soil during both seasons of 2020/2021 and 2021/2022.
SeasonsSilt
(%)
Clay
(%)
Sand
(%)
Texture SoilpHE.C
(dSm−1)
Organic Matter (%)CaCO3
(%)
N
(mg/Kg Soil)
P (mg/Kg Soil)K
(meq/100 g Soil)
2020/202139.535.225.3Clay loamy8.121.631.783.88276326.79
2021/202239.735.524.8Clay loamy8.191.691.613.61266306.66
pH: potential of hydrogen; E.C: Electrical conductivity; CaCO3: calcium carbonate; N: Nitrogen; P: Phosphorus; K: Potassium.
Table 2. Strawberry plant growth as influenced by foliar application of chitosan and/or micro-carbon phosphors in both seasons.
TreatmentsPlant Height (cm).Foliage FW
(g/Plant)
Secondary Crown No/PlantLeaf
No/Plant
Leaf Area
(cm2)/Plant
S1S2S1S2S1S2S1S2S1S2
Micro-carbon phosphorus (MCT-P, mgL−1)
MCT-P 019.47 ± 0.19 c18.59 ± 0.16 c118.1 ± 1.43 c109.8 ± 1.1 c6.72 ± 0.07 c6.41 ± 0.07 c39.46 ± 0.46 c37.69 ± 0.48 c1053 ± 11 c989 ± 10 c
MCT-P 40019.95 ± 0.23 b19.10 ± 0.28 b121.1 ± 1.55 b112.5 ± 1.3 a6.88 ± 0.08 b6.59 ± 0.08 b43.68 ± 0.46 b41.80 ± 0.50 b1080 ± 13 b1014 ± 11 b
MCT-P 80020.53 ± 0.24 a19.67 b ± 0.26 a124.5 ± 1.59 a115.7 ± 1.3 a7.08 ± 0.08 a6.79 ± 0.09 a44.21 ± 0.82 b42.38 ± 0.85 b1111 ± 13 a1043 ± 12 a
MCT-P 120020.74 ± 0.25 a19.90 ± 0.26 a125.8 ± 1.71 a116.9 ± 1.4 a7.15 ± 0.09 a6.86 ± 0.09 a45.94 ± 0.57 a44.08 ± 0.61 a1122 ± 14 a1054 ± 13 a
ANOVA p values******************************
Chitosan (CHI mgL−1)
CHI 019.34 ± 0.13 c18.41 ± 0.15 c116.9 ± 0.9 c109.1 ± 0.7 c6.67 ± 0.05 c6.35 ± 0.04 c41.23 ± 0.65 c39.26 ± 0.64 c1044 ± 7 c983 ± 6 c
CHI 50020.32 ± 0.18 b19.46 ± 0.15 b123.4 ± 1.1 b114.5 ± 1.0 b7.01 ± 0.06 b6.71 ± 0.06 b43.67 ± 0.79 b41.83 ± 0.78 b1100 ± 10 b1032 ± 9 b
CHI 100020.86 ± 0.16 a20.08 ± 0.22 a126.9 ± 1.0 a117.6 ± 0.9 a7.19 ± 0.06 a6.92 ± 0.05 a45.06 ± 0.76 a43.36 ± 0.75 a1131 ± 9 a1060 ± 8 a
ANOVA p values******************************
S1: first season; S2: second season; g: gram; cm: centimeter; No: number. Levels of significance are represented *** p < 0.001. Means values ± standard error within each column for every trial with a similar lower-case letter are not significantly different following Tukey’s HSD at p ≤ 0.05.
Table 3. Strawberry leaf chlorophyll and carotenoid concentration as influenced by foliar application of chitosan and/or micro-carbon phosphorus in both seasons.
TreatmentsChlorophylla
(mg/100 g FW)
Chlorophyllb
(mg/100 g FW)
Carotenoids
(mg/100 g g FW)
S1S2S1S2S1S2
Micro-carbon phosphorus (MCT-P, mgL−1)
MCT-P 083.83 ± 1.61 d80.07 ± 1.65 d41.45 ± 0.79 d39.60 ± 0.81 d23.48 ± 0.45 d22.43 ± 0.46 d
MCT-P 40087.99 ± 1.02 c84.22 ± 1.09 c43.51 ± 0.50 c41.65 ± 0.54 c24.65 ± 0.28 c23.59 ± 0.30 c
MCT-P 80090.72 ± 0.93 b86.95 ± 1.02 b44.86 ± 0.46 b43.00 ± 0.50 b25.54 ± 0.31 b24.48 ± 0.33 b
MCT-P 120094.61 ± 1.52 a91.74 ± 1.92 a47.28 ± 0.92 a45.37 ± 0.95 a26.96 ± 059 a25.87 ± 0.60 a
ANOVA p values******************
Chitosan (CHI mgL−1)
CHI 084.53 ± 1.30 c80.50 ± 1.27 c41.80 ± 0.64 c39.81 ± 0.62 c23.68 ± 0.36 c22.55 ± 0.35 c
CHI 50090.71 ± 1.31 b86.88 ± 1.30 b44.86 ± 0.64 b42.97 ± 0.64 b25.41 ± 0.36 b24.34 ± 0.36 b
CHI 100092.62 ± 1.14 a89.85 ± 1.47 a46.17 ± 0.73 a44.43 ± 0.72 a26.39 ± 0.47 a25.39 ± 0.47 a
ANOVA p values******************
S1: first season; S2: second season; mg: milligram; g: gram; FW: fresh weight. Levels of significance are represented *** p < 0.001. Means values ± standard error within each column for every trial with a similar lower-case letter are not significantly different following Tukey’s HSD at p ≤ 0.05.
Table 4. Strawberry early and total yield as influenced by foliar application of chitosan and/or micro-carbon phosphorus in both seasons.
TreatmentsEarly Yield (Ton/Hectare)Total Yield (Ton/Hectare)
MarketableUnmarketableTotalMarketableUnmarketableTotal
S1S2S1S2S1S2S1S2S1S2S1S2
Micro-carbon phosphorus (MCT-P, mgL−1)
MCT-P 015.59
± 0.22 d
14.97
± 0.23 d
1.570
± 0.020 a
1.416
± 0.018 a
17.16
± 0.20 d
16.39
± 0.22 d
67.92
± 0.54 d
64.60
± 0.62 d
3.544
± 0.083 a
3.656
± 0.092 a
71.46
± 0.47 d
68.25
± 0.54 d
MCT-P 40016.52
± 0.31 c
15.81
± 0.32 c
1.326
± 0.027 b
1.269
± 0.024 b
17.84
± 0.29 c
17.08
± 0.30 c
69.02
± 0.66 c
66.04
± 0.79 c
3.096
± 0.049 b
2.980
± 0.111 b
72.11
± 0.61 c
69.02
± 0.68 c
MCT-P 80018.04
± 0.52 b
16.97
± 0.43 b
1.022
± 0.043 c
1.027
± 0.043 bc
19.06
± 0.48 b
17.99
± 0.39 b
71.37
± 1.08 b
68.38
± 1.15 b
2.395
± 0.108 c
2.318
± 0.109 c
73.77
± 0.99 b
70.70
± 1.04 b
MCT-P 120019.02
± 0.47 a
17.81
± 0.46 a
0.761
± 0.042 d
0.785
± 0.029 c
19.78
± 0.43 a
18.60
± 0.43 a
73.08
± 0.97 a
70.00
± 1.01 a
2.092
± 0.118 d
2.129
± 0.077 d
75.18
± 0.87 a
72.13
± 0.93 a
ANOVA
p values
************************************
Chitosan (CHI mgL−1)
CHI 015.86
± 0.27 c
15.07
± 0.22 c
1.288
± 0.08 a
1.226
± 0.066 a
17.15
± 0.20 c
16.30
± 0.16 c
67.49
± 0.44 c
64.10
± 0.47 c
3.101
± 0.15 a
3.119
± 0.188 a
70.60 ± 0.35 c67.22
± 0.35 c
CHI 50017.56
± 0.45 b
16.59
± 0.38 b
1.155
± 0.09 b
1.111
± 0.073 b
18.72
± 0.36 b
17.70
± 0.31 b
70.68
± 0.73 b
67.59
± 0.75 b
2.757
± 0.16 b
2.744
± 0.172 b
73.44
± 0.58 b
70.34 ± 0.59 b
CHI 100018.45
± 0.48 a
17.52
± 0.38 a
1.066
± 0.10 c
1.035
± 0.078 c
19.52
± 0.38 a
18.55
± 0.31 a
72.87
± 0.77 a
70.07
± 0.76 a
2.488
± 0.19 c
2.448
± 0.184 c
75.36
± 0.58 a
72.51
± 0.59 a
ANOVA
p values
************************************
S1: first season; S2: second season. Levels of significance are represented *** p < 0.001. Means values ± standard error within each column for every trial with a similar lower-case letter are not significantly different following Tukey’s HSD at p ≤ 0.05.
Table 5. Some physical attributes of strawberry fruits as influenced by the foliar application of chitosan and/or micro-carbon phosphorus in both seasons.
TreatmentsAverage Fruit Weight (g)Fruit Firmness
(kg/ cm2)
Fruit Dry
Matter (%)
Total Soluble Solid Content (Brix)
S1S2S1S2S1S2S1S2
Micro-carbon phosphorus (MCT-P, mgL−1)
MCT-P 020.66 ± 0.18 b19.73 ± 0.20 c361.1 ± 4.6 c339.2 ± 4.3 d8.89 ± 0.08 c8.78 ± 0.09 c5.56 ± 0.10 d5.31 ± 0.10 d
MCT-P 40020.94 ± 0.23 b20.03 ± 0.25 b367.1 ± 5.2 c350.2 ± 5.0 c9.14 ± 0.11 b9.00 ± 0.11 b5.83 ± 0.06 c5.58 ± 0.07 c
MCT-P 80021.54 ± 0.30 a20.64 ± 0.31 a387.2 ± 6.0 b363.7 ± 5.7 b9.39 ± 0.11 a9.26 ± 0.11 a6.04 ± 0.07 b5.79 ± 0.07 b
MCT-P 120021.68 ± 0.22 a20.80 ± 0.24 a396.9 ± 6.3 a370.9 ± 5.9 a9.53 ± 0.11 a9.36 ± 0.12 a6.38 ± 0.14 a6.12 ± 0.14 a
ANOVA p values************************
Chitosan (CHI mgL−1)
CHI 020.39 ± 0.11 c19.41 ± 0.11 c358.1 ± 3.7 c337.2 ± 3.1 c8.86 ± 0.07 c8.70 ± 0.06 c5.60 ± 0.08 c5.33 ± 0.08 c
CHI 50021.29 ± 0.15 b20.39 ± 0.15 b380.7 ± 4.7 b358.5 ± 4.0 b9.29 ± 0.08 b9.17 ± 0.08 b6.01 ± 0.09 b5.76 ± 0.08 b
CHI 100021.93 ± 0.17 a21.10 ± 0.16 a395.4 ± 5.1 a372.3 ± 4.3 a9.56 ± 0.08 a9.43 ± 0.07 a6.24 ± 0.11 a6.01 ± 0.11 a
ANOVA p values************************
S1: first season; S2: second season; g, gram; kg, kilogram; cm, centimeter; %, percentage. Levels of significance are represented *** p < 0.001. Means values ± standard error within each column for every trial with a similar lower-case letter are not significantly different following Tukey’s HSD at p ≤ 0.05.
Table 6. Strawberry fruit quality as influenced by foliar application of chitosan and micro-carbon phosphorus in both seasons.
TreatmentsAcidity (%)Total Sugar (%)Ascorbic Acid
(mg/100 g FW)
Anthocyanin
(mg/100 g FW)
S1S2S1S2S1S2S1S2
Micro-carbon phosphorus (MCT-P, mgL−1)
MCT-P 00.651 ±
0.017 c
0.637 ±
0.009 c
3.49 ±
0.03 d
3.33 ±
0.04 d
59.23 ±
0.60 d
56.57 ±
0.65 d
54.36 ±
0.54 c
51.92 ±
0.59 c
MCT-P 4000.684 ±
0.010 b
0.655 ±
0.010 b
3.61 ±
0.05 c
3.45 ±
0.05 c
60.72 ±
0.71 c
58.11 ±
0.77 c
55.72 ±
0.65 b
53.33 ±
0.70 b
MCT-P 8000.704 ±
0.010 a
0.647 ±
0.011 a
3.79 ±
0.06 b
3.63 ±
0.06 b
63.02 ±
0.97 b
60.40 ±
1.02 b
57.29 ±
0.67 a
54.91 ±
0.72 a
MCT-P 12000.711 ±
0.010 a
0.682 ±
0.011 a
3.91 ±
0.08 a
3.75 ±
0.08 a
64.55 ±
0.78 a
61.94 ±
0.84 a
57.96 ±
0.71 a
55.61 ±
0.76 a
ANOVA p values************************
Chitosan (CHI mgL−1)
CHI 00.643 ±
0.006 c
0.624 ±
0.004 c
3.49 ±
0.03 c
3.32 ±
0.03 c
59.21 ±
0.54 c
56.39 ±
0.53 c
54.02 ±
0.38 c
51.44 ±
0.38 c
CHI 5000.697 ±
0.007 b
0.667 ±
0.006 b
3.72 ±
0.05 b
3.56 ±
0.05 b
62.09 ±
0.67 b
59.48 ±
0.67 b
56.75 ±
0.51 b
54.36 ±
0.52 b
CHI 10000.722 ±
0.006 a
0.695 ±
0.005 a
3.89 ±
0.06 a
3.74 ±
0.06 a
64.33 ±
0.73 a
61.90 ±
0.73 a
58.23 ±
0.46 a
56.03 ±
0.46 a
ANOVA p values************************
S1: first season; S2: second season; %, percentage; mg, milligram; g, gram; FW, fresh weight. Levels of significance are represented *** p < 0.001. Means values ± standard error within each column for every trial with a similar lower-case letter are not significantly different following Tukey’s HSD at p ≤ 0.05.
Disclaimer/Publisher’s Note: The statements, opinions and data contained in all publications are solely those of the individual author(s) and contributor(s) and not of MDPI and/or the editor(s). MDPI and/or the editor(s) disclaim responsibility for any injury to people or property resulting from any ideas, methods, instructions or products referred to in the content.