Article

Transcriptomic Analysis Revealed the Discrepancy between Early-Ripening ‘Geneva Early’ and Late-Ripening ‘Hanfu’ Apple Cultivars during Fruit Development and Ripening

1
Shenzhen Research Institute, Northwest A&F University, Shenzhen 518000, China
2
State Key Laboratory of Crop Stress Biology for Arid Areas/Shaanxi Key Laboratory of Apple, College of Horticulture, Northwest A&F University, Xianyang 712100, China
3
Department of Horticulture, The University of Haripur, Haripur 22620, Pakistan
*
Author to whom correspondence should be addressed.
Horticulturae 2023, 9(5), 570; https://doi.org/10.3390/horticulturae9050570
Submission received: 24 March 2023 / Revised: 5 May 2023 / Accepted: 8 May 2023 / Published: 11 May 2023
(This article belongs to the Special Issue New Advances in Molecular Biology of Horticultural Plants)

Abstract

:
Apples (Malus × domestica Borkh.) can be categorized into early-, medium-, and late-ripening cultivars based on the length of the fruit developmental phases. The lengthening of the apple ripening period has a direct impact on its economic worth and market competitiveness, although the underlying mechanism is mostly unclear. In the current study, the development and maturation of the early-ripening ‘Geneva Early’ (GE) and late-ripening ‘Hanfu’ (HF) cultivars of apple fruit were studied using transcriptomics to detect and identify the changes of differential genes. Results showed that the two varieties had different ripening periods, but in both, the development process of fruit ripening required cell division, cell expansion, starch accumulation, and secondary metabolite accumulation. In the early stages of fruit development (G1 to G2), the GE’s fruit size was larger than HF’s, and the GO analysis revealed an enrichment in genes involved in the metabolism of fatty acids and carbon molecules. In G2 phase, the GE involved numerous regulatory factors of hormonal pathways, while in HF this phase was mainly enriched in the metabolism of sugars and carbohydrates. The results indicated that during GE development, the relevant genes regulating fruit development were expressed earlier than HF, which made fruit development enter the next development phase earlier, thereby shortening the fruit development phase. These findings contributed to an improved understanding of the molecular basis of apple ripening and provide a reliable reference for apple breeding using genomics.

1. Introduction

Apple (Malus × domestica Borkh.), which belongs to the family Rosaceae, is rich in carbohydrates, vitamins, minerals, and dietary phytonutrients, which are essential for humans [1]. Apple fruit is derived from the hypanthium, a tube of fused sepals, petals, and anther-derived tissue [2]. Like other fruits, the development of apple fruit includes the 4-week post-flowering phase of cell division, cell expansion phase, maturity, and ripening [3]. The final fruit size of apples is caused by differences in total cell number and cell size [4]. The ripening of apple is a complex physiological and biochemical process regulated by many genes, including changes in aroma, flavor, color, and texture [5,6]. Changing the length of the fruit ripening phase directly affects the economic value and market competitiveness. The metabolism and accumulation of carbohydrates, organic acids, and amino acids in apples are all related to the developmental stage [7,8]. The majority of carbohydrates are rapidly metabolized via glycolysis and the tricarboxylic acid (TCA) cycles during the early stages of fruit development [9,10]. At this stage, high levels of organic acids and amino acids accumulate in fruit, with low levels of sugars [8,10]. Similarly, during the early stage of apple fruit growth and development, cell wall invertase (CWIV), sorbitol dehydrogenases (SDH), and neutral invertase (NINV) activities are also high. The soluble sugar metabolism in the fruit quickly satisfies the needs of energy and carbon skeleton production, but cannot be accumulated [11,12]. The requirement for energy and carbon backbone declines as cells and fruits enlarge; as a result, the carbohydrate metabolism slows, the enzymes’ transcription levels are downregulated, their activities decline, and fructose and sucrose gradually accumulate in the vacuole. In the later stage of fruit development, starch is hydrolyzed by amylase, which is accompanied by increased expression of sucrose phosphate synthases (SPS) and increased sucrose accumulation, resulting in rapid accumulation of soluble sugars and further reduction of organic acid levels in fruits [8].
Climacteric fruits, such as apples and tomatoes (Solanum lycopersicum) exhibit a sharp rise in respiration rate at the early-ripening stage, which turned to a rapid decline after reaching a peak, accompanied by a rapid biosynthesis of the gaseous hormone ethylene [13,14,15]. Ethylene Responsive Factors (ERFs), as the final component of ethylene signaling pathways and direct regulators of ethylene response genes, are involved in all aspects of the ripening process such as ethylene biosynthesis, color change, fruit softening, and fruit flavor formation [16,17]. In bananas, MaERF11 binds to the promoters of MaACS1 and MaACO1, inhibiting their activity, while MaERF9 activates the activity of the MaACO1 promoter, regulating ethylene biosynthesis [18]. In apples, the ethylene plays a key role in promoting fruit ripening, as the two ERF members, MdERF2 and MdERF3, have been shown to affect ethylene biosynthesis and fruit ripening by antagonizing the transcription of MdACS1 [19].
In addition to ethylene, a variety of plant hormones are also involved in the development and ripening of the fruit [20]. Auxin is considered to be required for apple fruit growth, while some ERFs can also be activated by IAA, or by both ethylene and IAA [2,21,22]. ABA and Brassinosteroid (BR) can also act on the ethylene signal transduction and transcriptional pathways to induce fruit ripening progress [20]. In apples, MdARF5 binds to the promoter of MdERF2, which encodes a transcription factor (TF) in the ethylene signaling pathway, as well as promoters of the ACC synthase (ACS) gene (MdACS3a and MdACS1) and an ACC oxidase (ACO) gene MdACO1, thereby inducing its expression [23]. Overexpression of ARF2A leads to spotted ripening patterns in tomatoes, with some parts of the fruit ripening faster than others, and in rin (ripening-inhibitor), nor (nonripening), and Nr (Never ripen) maturation mutants, the expression of ARF2A decreases and responds to exogenously applied ethylene, auxin, and ABA. ARF2A interacts with the ABA STRESS RIPENING (ASR1) protein, suggesting that ASR1 may be a junction between ABA and ethylene-dependent maturation [21]. ABA also affects various aspects of fruit ripening which is synergistic with ethylene [24]. ABA had a role in chlorophyll degradation, and hence the de-greening of fruits [25]. ABA upregulated ethylene biosynthesis pathway genes (LeACS1A, LeACS1, and LeACO1) during the early tomato fruit development stage [26].
To date, a number of these TFs that control fruit ripening have been discovered, including the ones that soften the fruit and promote the formation of sugars, acids, pigments, and volatile and phenolic compounds [27]. Multiple transcription factors families have been reported to affect the development and ripening of fruits, such as ERF, NAC, MADS, MYB, and bHLH. In apples, MdERF3 is a key regulator of ethylene biosynthesis, regulated by transcription of MdMYB1, involved in anthocyanin biosynthesis [27]. The pears (Pyrus pyrifolia) ERF genes, including PyERF3, Pp4ERF24, and Pp12ERF96, are involved in the accumulation and regulation of anthocyanin biosynthesis during fruit ripening by interlinking with MYB114 and bHLH3 [28].
In 1991, Messeguer reported the initial discovery of differential DNA methylation in two genera of tomatoes [29]. DNA demethylase 2 (DML2) regulates tomato genomic DNA demethylation, and a correlation has been shown between tomato fruit development and genomic DNA demethylation [14]. Additionally, it was discovered that freezing the tomato fruits instantly increased DNA methylation, which inhibited flavor genes from being expressed [30]. DNA methylation also inhibits gene expression during fruit development in grapes [31], strawberries [32], and oranges [33]. In apples, MdMYB10 promoter DNA methylation regulates the MdMYB10 gene expression and anthocyanin accumulation during fruit ripening [34]. In recent years, scientists have aimed to use genomics and post-genomics tools to uncover the regulatory mechanisms during fruit development and maturation [10,35]. ‘Royal Gala’ as a mid-ripening cultivar has been the subject of a number of genomics studies of apple fruits, including microarray research of fruit development [2] and fruit ripening [3]. However, research on the mechanism of ripening advance in apple fruit are still very limited.
In this work, the transcriptomic analysis was performed at four different developmental stages of the early-ripening cultivar ‘Geneva Early’ (GE) and the late-ripening cultivar ‘Hanfu’ (HF). Moreover, we conducted differential gene enrichment analysis for four identical developmental stages of GE and HF to understand the developmental processes of early- and late-ripening fruits. In order to explore the potential regulatory mechanism of early ripening, we further studied the differential expression genes specific to early and late maturing varieties. The transcriptome was used to reveal the developmental dynamics of apple fruits at different stages of early and late development, which provided a strong basis for understanding the regulatory mechanism of early ripening of commercial apples and auxiliary molecular breeding.

2. Materials and Methods

2.1. Plant Materials and Sample Collection

In this experiment, the early-ripening cultivar ‘Geneva Early’ was donated by the Zhengzhou Institute of Pomology, Chinese Academy of Agricultural Sciences, and the late-ripening cultivar ‘Hanfu’ was planted in the horticultural farm of Northwest A&F University in Yangling, Shaanxi Province, and standard orchard cultural practices were carried out (except chemical fruit thinning which was not allowed). For 7 DAP samples, the whole fruit was stripped of petioles, but no further dissection was performed. For samples taken at other time points, only the petiole was removed and the whole fruit was sampled. Six fruits from different positions of each tree were sliced into small pieces and mixed evenly into one replicate. Similarly, three replicates were sampled from every three healthy trees and immediately frozen in liquid nitrogen for −80 °C storage. The fruit samples from the four developmental stages were then subjected to transcriptomic analysis. There were three biological replicates at each stage.

2.2. Determination of Fruit Quality Characteristics

The maximum longitudinal diameter and transverse diameter of the fruit were measured with a digital vernier caliper. Twenty apple fruits were selected from four developmental stages as biological replicates. TSS (Total Soluble Solids) content was determined by PAL-1 handheld refractometer while the TA (Titratable Acidity) content was determined by GMK-835F fruit acidity meter. Each fruit was cut into small pieces at 3 different positions and mixed evenly into one replicate, with 20 apple fruits of each cultivar as biological replicates at fruit ripening.

2.3. RNA Extraction and Transcriptome Analysis

Total RNA was extracted from apple fruits of ‘Geneva Early’ and ‘Hanfu’ at 4 different developmental stages with the cetyltrimethylammonium bromide (CTAB), and three biological replicates were made for each sample [36]. For transcriptomic analysis, the RNA-seq library was constructed as previously reported by Xie et al. [36]. Next, according to the effective library concentration and data amount required, the qualified libraries were pooled and sequenced on Illumina platforms with PE150 strategy in Novogene (Beijing, China). The clean data were mapped to the Malus × domestica genome sequence (GDDH13 version 1.1, https://iris.angers.inra.fr/gddh13/downloads/GDDH13_1-1_formatted.fasta.bz2, accessed on 18 November 2021) using HISAT2 v2.1.0. Subsequently, SAMtools v1.9 was used to perform BAM conversion, sorting, and indexing. Intragenic read counts were analyzed using HTSeq v0.12.4 gene annotation file (https://iris.angers.inra.fr/gddh13/downloads/gene_models_20170612.gff3.bz2, accessed on 18 November 2021). Differentially expressed genes (DEGs) were identified using DESeq2 v1.30.1 with parameters adjusted to p-value < 0.05 and |log2 (fold change)| ≥ 1. The length of genes were calculated by GenomicFeatures v1.42.3, and the quantification of the gene expression level was performed by TBtools v1.116 to calculate FPKMs (Fragments per kilo-base of exon per million fragments mapped). The software Pheatmap v1.0.12 was used to plot the heat maps of the gene expression levels. Gene Ontology (GO) enrichment was analyzed by agriGO v2.0 and clusterProfiler v.3.18.1.

2.4. RT-qPCR Analysis

Total RNA was extracted from fruit using CTAB [36]. The DNA was removed by digestion with RNase-free DNase I (Thermo Scientific, USA). For Quantitative PCR (qPCR) analysis, 1 μg of total RNA was reverse transcribed to first-strand cDNA using a Hifair® III 1st Strand cDNA Synthesis SuperMix for qPCR (gDNA digester plus) (Yeasen Biotechnology, Shanghai, China). ChamQ Universal SYBR qPCR Master Mix (Vazyme, C601, China) was used to perform qRT-PCR on the CFX96 real-time system (Bio-Rad, Hercules, CA, USA). The MdMDH (Malate dehydrogenase) gene was used as the reference gene and relative expression was calculated by the 2−ΔΔCt method. Three biological replicates with three technical replicates were used. The primers used are listed in Supplemental Table S1.

2.5. Statistical Analyses

This research was reported as the mean ± standard deviation and determined by Student’s two-tailed t-test: * p < 0.05, ** p < 0.01, and *** p < 0.001.

3. Results

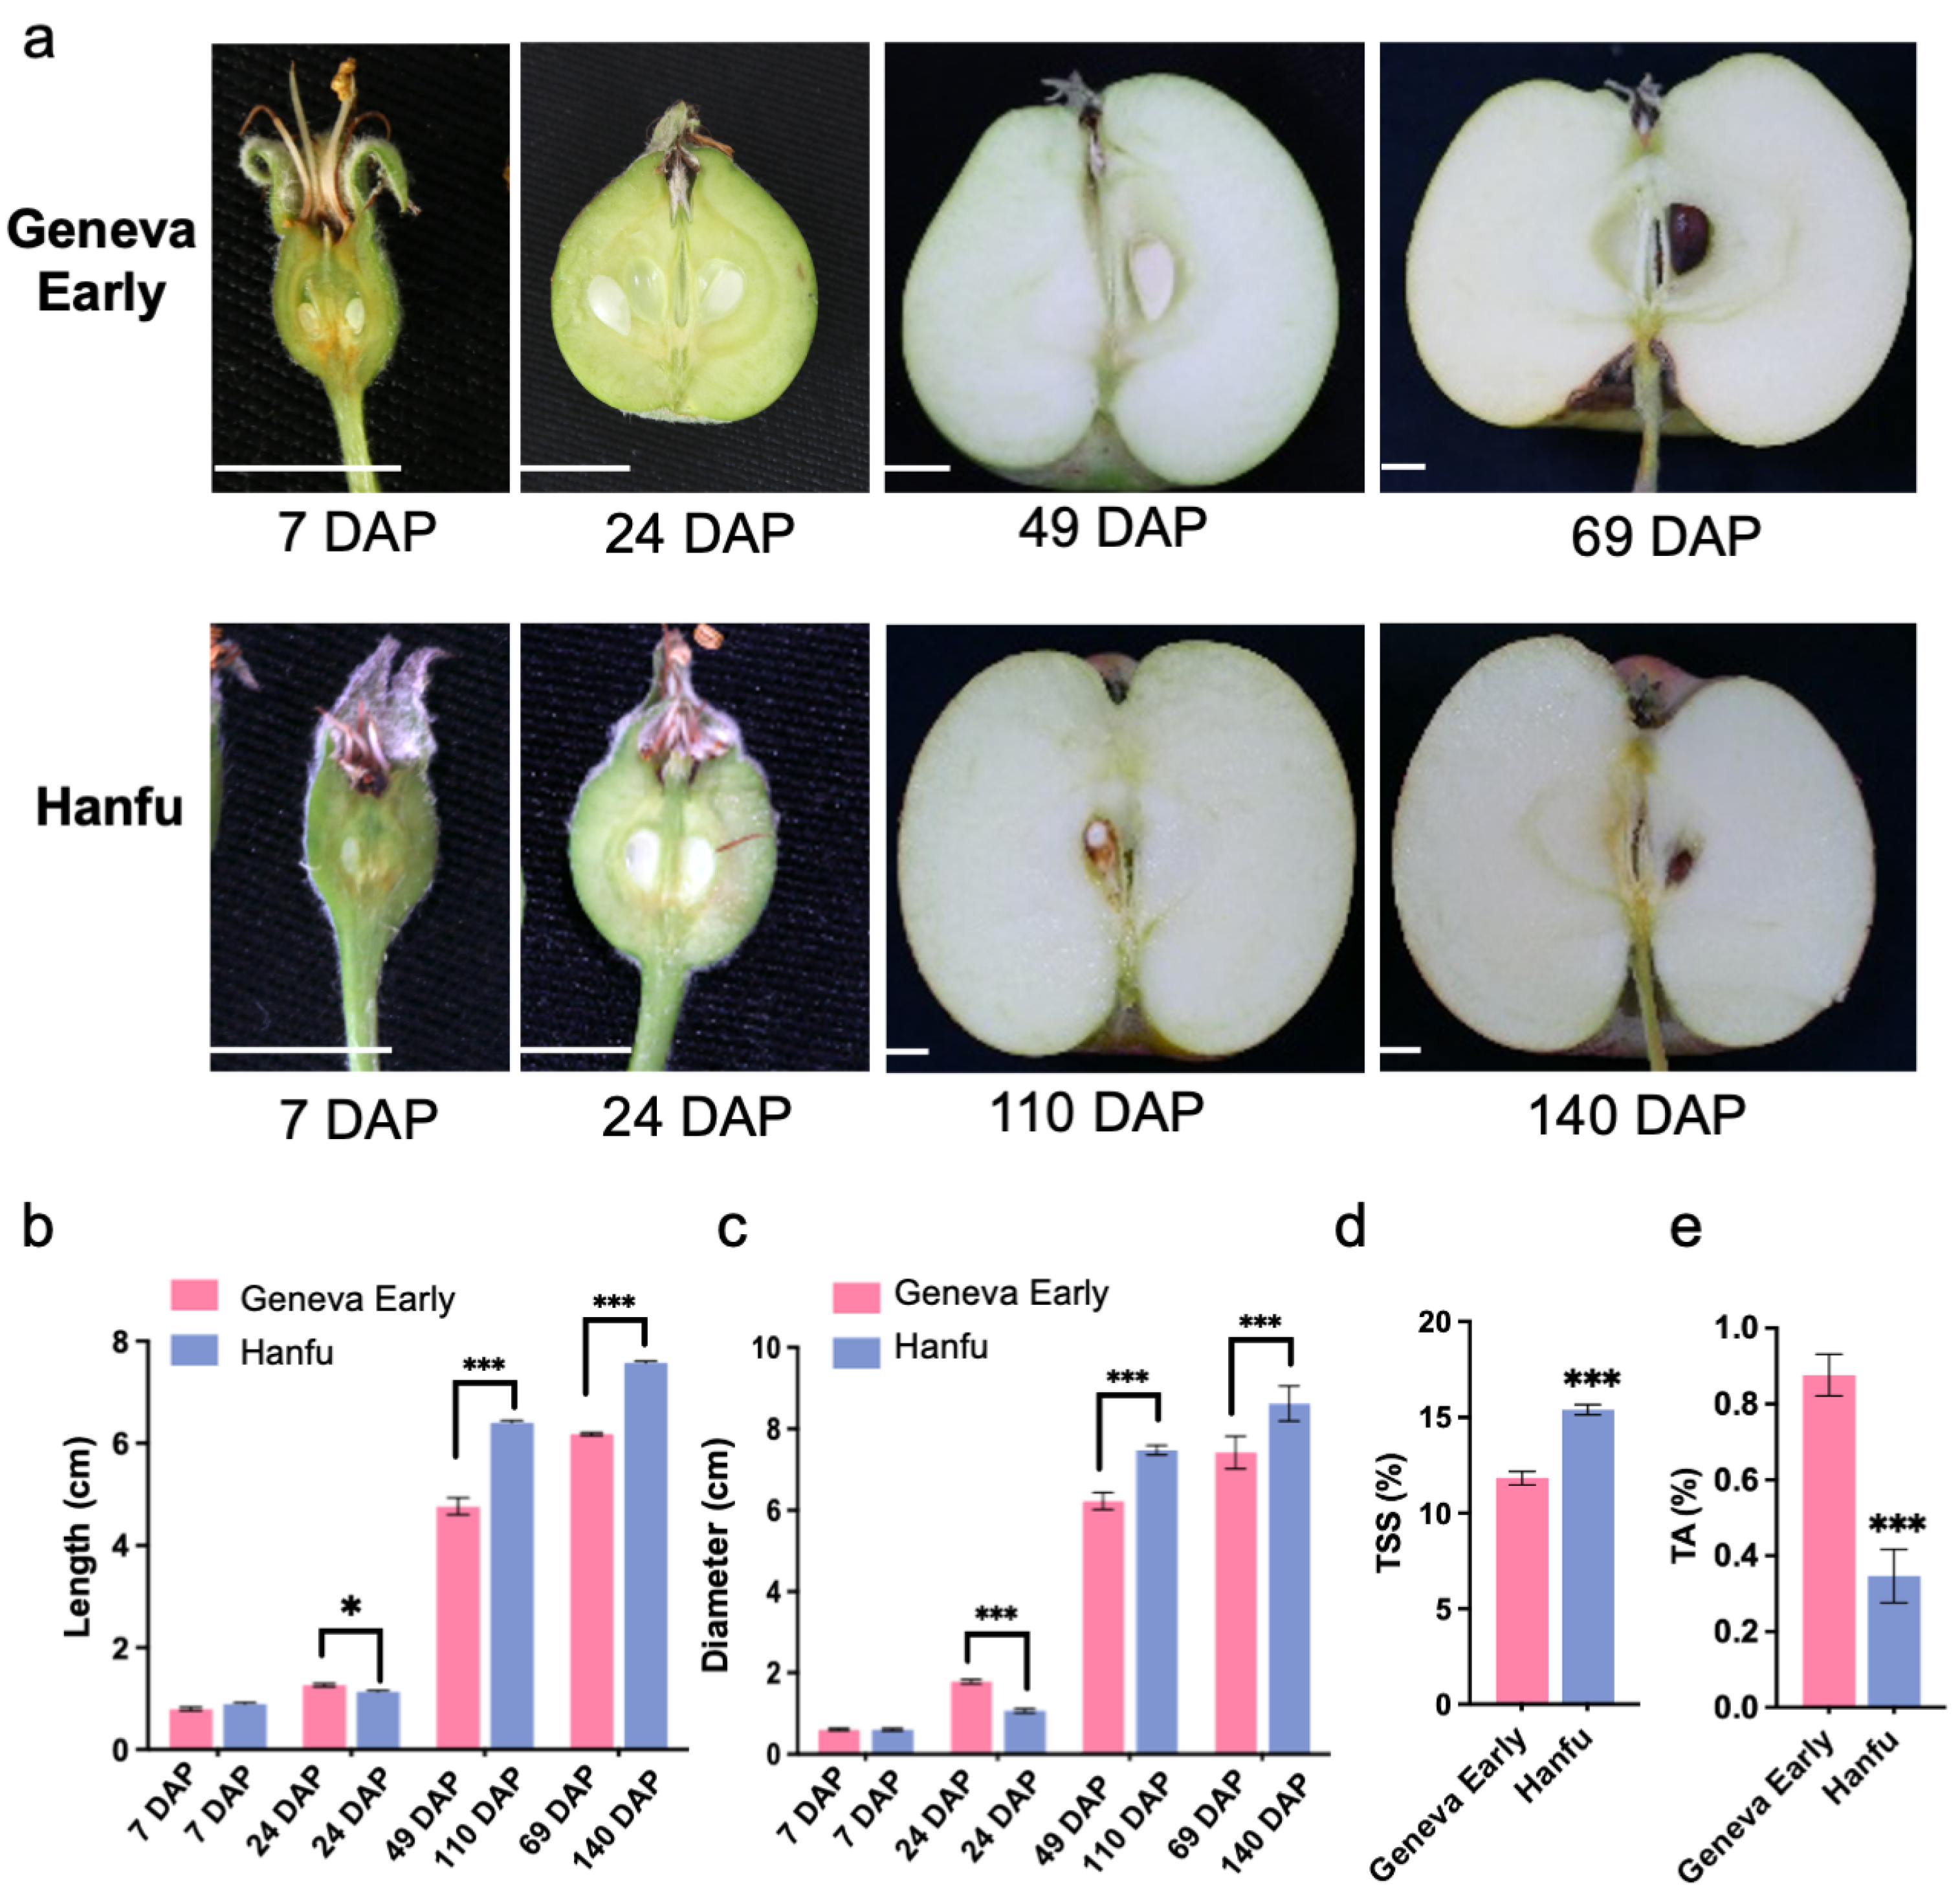
3.1. Apple Fruit Quality Characteristics in ‘Geneva Early’ and ‘Hanfu’

The apple tree ‘Geneva Early’ (Malus domestica Borkh.) (GE) originated from a ‘Quinte’ × ‘Julyred’ cross made in 1964, which is one of the very earliest ripening of all cultivars [37,38]. The GE apple trees are vigorous with early bloom season where flowering occurs in mid-April in Zhengzhou, and fruits are fully colored and mature in mid-June, and fruit development days is about 70 days. ‘Hanfu’ (‘Dongguang’ × ‘Fuji’) (HF) is a very influential cultivar in China [39,40], a late-ripening variety that blooms at the end of April in the Yangling area, ripens in early October, and takes about 140 days of fruit development. Mark individual fully open flowers when apple trees GE and HF are in full bloom (buds are more than 50% open).
Based on the physiological and morphological studies of apple fruit development, we selected four-time points for sampling to further investigate the molecular mechanism of apple fruit development and ripening in early and late-ripening cultivars (Figure 1a). The first sample of both early- and late-ripening cultivars was taken at 7 Days After Pollination (DAP), and the second sample was taken at 14 DAP, during which the apple fruit entered the cell division phase and the number of cells would proliferate rapidly [2,4]. At 49 DAP, the fruits of GE had initiated coloration [38], while HF started coloration at 110 DAP [39], so we collected the third samples at these time points. The next fourth sample was collected at fruit ripening (in GE at 69 DAP and in HF at 140 DAP).
Through observation and statistics, we found that at 7 DAP, the longitudinal diameter length of GE fruit was smaller than that of HF, but the length of the fruit transverse diameter was significantly larger than that of HF (Figure 1b,c). As the fruit developed into the cell division stage, the longitudinal diameter length of the GE fruit was 1.25 cm, which was greater than that of the HF, and the transverse diameter length was 1.78 cm, which was significantly higher than the HF (1.01 cm). When the fruit entered the third period, the length of the HF fruit was significantly higher than that of the GE fruit. At fruit ripening, the total soluble solids (TSS) content of HF fruit was about 15.2%, which was significantly higher than that of GE (Figure 1d), while the titratable acid (TA) content of HF fruit was significantly lower than that of GE (Figure 1e). In general, we found that ‘Geneva Early’, as an early-ripening variety, had larger fruits than HF in the first and second developmental stages, and HF fruits enlarged, TSS accumulated and TA degraded in the third and fourth developmental stages.

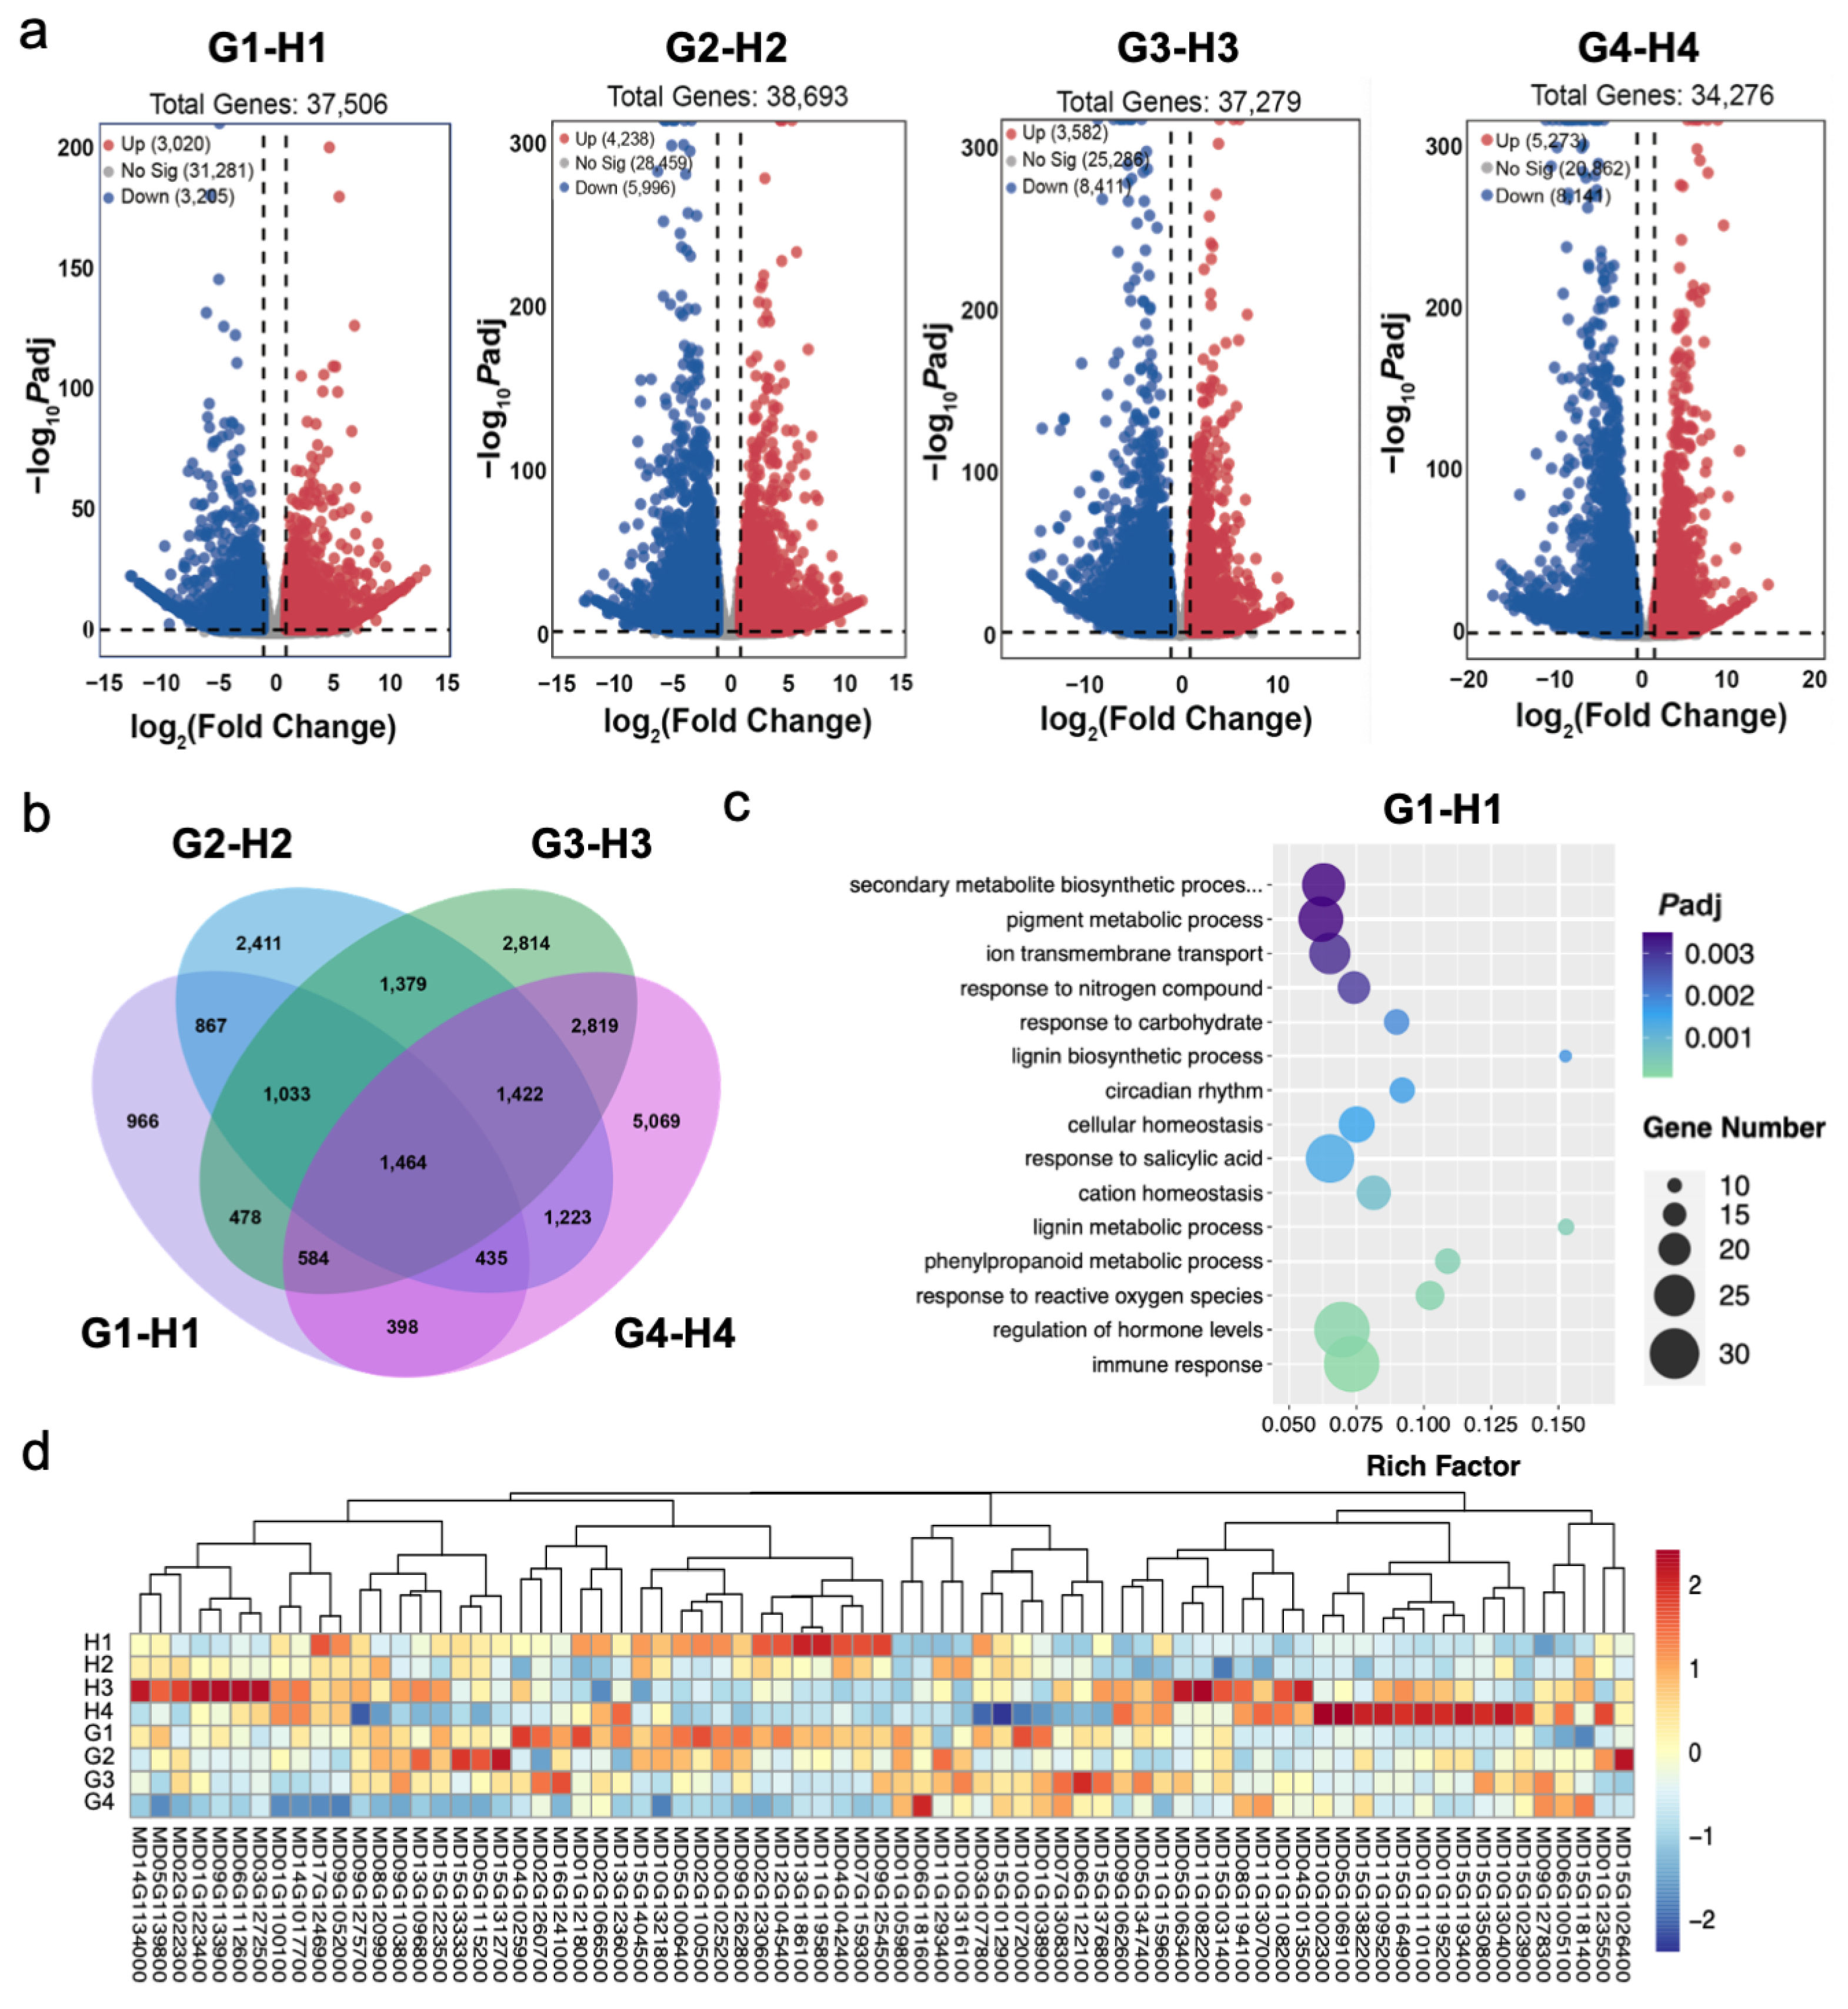
3.2. Transcriptomic Analysis of ‘Geneva Early’ and ‘Hanfu’ during the Four Fruit Developmental Stages

Earlier studies have reported that the expression patterns of metabolic-related genes are associated with ‘Pinova’ fruit development [10]. In order to explore the transcriptional regulatory mechanisms of apple fruit development and maturation in early- and late-ripening cultivars, we performed RNA-sequencing (RNA-seq) experiments to analyze the transcriptome on the fruits of GE at 7 DAP (G1), 24 DAP (G2), 49 DAP (G3), 69 DAP (G4), and that of HF fruits at 7 DAP (H1), 24 DAP (H2), 110 DAP (H3), and 140 DAP (H4). In this work, the differentially expressed genes (DEGs) were identified using DESeq2. As shown in Figure 2a, there was a significant separation of the GE and HF fruit samples at different developmental stages, and the PC scores of the three replicates at each fruit developmental stage were similar. These results indicated that the transcription level of the fruit samples changed significantly at different developmental stages, and the separation between replicates was small. In addition, we found that there was also significant separation between the two varieties, indicating that the transcript levels of the expressed genes were significantly different between the two cultivars. Therefore, we focused on the expression of various genes of GE and HF at different developmental stages. A total of 9281 genes showed significantly different expression (log2 [fold change] ≥ 1, false discovery rate-adjusted p-value [Padj] < 0.05) between GE fruits at the G1 and G2 stage (G1-G2). Meanwhile, 9923 and 11,147 genes were discovered in adjacent stages of G2 and G3 (G2-G3), and of G3 and G4 (G3-G4), respectively (Figure 2b and Figure S1, Table S2). The results showed that the number of DEGs increased significantly with fruit development (Figure 2b and Figure S1). In the early ripening of GE fruit, the number of DEGs from G1 to G2 gradually increased. However, in the late-ripening HF fruit, the number of DEGs in the H2 to H3 stages was significantly higher than in the adjacent two stages, and these DEGs may be related to the specific gene expression of late-ripening cultivars during fruit expansion and coloration.
Previous studies have shown that the development and ripening of ‘Royal Gala’ apple fruits was carried out in different stages, mainly including the cell division, cell expansion, and maturation process, accompanied by accumulation and degradation of starch [3]. In order to investigate whether the fruit development process of different ripening stages was consistent, we overlapped DEGs of GE and HF at the same developmental stage, including (G1-G2) vs. (H1-H2), (G2-G3) vs. (H2-H3), (G3-G4) vs. (H3-H4), and screened out genes co-expressed in the fruits of the two cultivars at the same developmental stage for Gene Ontology (GO) enrichment analysis (Figure 2c): (1) The results showed that during the G1 to G2/(H1 to H2) period, the common differential genes were mainly enriched in DNA replication initiation (GO: 0006270), regulation of cell cycle (GO: 0010564), regulation of mitotic cell cycle (GO: 0007346), and meiotic nuclear division (GO: 0140013), among which response to auxin (GO: 0009733) was also enriched (Figure 2c). Consistent with previous reports, in the first period of fruit development, a large number of genes related to cell cycle and cell division were mainly enriched; (2) During the G2 to G3/(H2 to H3) period, the main enrichments were metabolic process including the cellular glucan (GO: 0006073), cellular polysaccharide (GO: 0044264), and cellular carbohydrate (GO: 0044262), which was also enriched in pigment biosynthetic process (GO: 0046148), cellular response to abscisic acid stimulus (GO: 0071215), indicating that this period was mainly the accumulation of nutrients such as polysaccharides and carbohydrates; (3) During the last G3 to G4/(H3 to H4) period (Figure 2c), an abundance of flavonoid metabolic processes (GO: 0009812), phenylpropanoid metabolic processes (GO: 0009698), secondary metabolite biosynthetic processes (GO: 0044550), hormone metabolic process (GO: 0042445) were enriched. The accumulation of phenolic and flavonoid compounds was closely related to the variation of flavor changes in the process during fruit ripening. In general, GE and HF had different lengths of ripening periods, but in both, the whole development process of fruit ripening requires cell division, cell expansion, and accumulation of starch and secondary metabolite.

3.3. Expression of DEGs among Different Fruit Development Stages of Apples

To investigate the differences in fruit-ripening phases in GE and HF apple fruits, we screened the genes specifically expressed from the overlapping results of DEGs in the same developmental period of them. The Venn plot showed that with fruit development, the number of particular genes with differential expression displayed a trend of first increasing and subsequently decreasing (Figure 3a and Figure S1), and the number of specific differentially expressed genes in GE (SGs) (5559 and 6946) was significantly higher than that of HF (SFs) (3433 and 5441) at the first and third stage, which correspond to the stage of G1 to G2 and G3 to G4 in apple fruits, respectively. Conversely, in the second developmental period, the number of SGs in the GE was 4841, which was much less than that of HF (7691). To further explore the mechanism of fruit ripening differences in GE and HF, we functionally enriched genes specifically expressed at different stages of the two cultivars. Data in Figure 3b showed that during the early developmental stage of G1 to G2, the metabolic pathways of SGs were mainly enriched in fatty acid (GO: 0006633), alpha-amino acid (GO: 1901605), pigment metabolic (GO: 0042440), tetrapyrrole biosynthetic (GO: 0033014). A series of fatty acid desaturase (FAD) genes (FAD7, FAD8, and FAD2) had high levels of expression in the early developmental stage of the GE (Figure 3c), and the reported FAD genes have been confirmed to be involved in catalyzing desaturation of fatty acid in plants [41,42]. The acetyl-CoA carboxylase 1 (ACC1), which was a key rate-limiting enzyme for FA synthesis, expressed in G1-G2 has also been reported to catalyze the first step of fatty acid synthesis [43]. MYB43 was reported to regulate phenylalanine and cell wall biosynthesis [44,45].
During the of 24 DAP (G2) to 49 DAP (G3) phase of development, an abundant number of DEGs were enriched in response to hormones, such as salicylic acid, abscisic acid, ethylene, while other DEGs were enriched into metabolic processes, such as fatty acid, starch catabolic, lipid storage, and phenylpropanoid (Figure 3b and Figure S2). When the fruit reached the third stage (G3 to G4), the increase in fruit size gradually becomes slow (Figure 1a–c), and the differential genes unique to GE were mainly enriched in the cellular response to environmental stimulus, heat, far-red light, also some protein kinase binding (Figure 3b and Figure S3). The overlapping analysis of SGs at three developmental stages of the GE showed that there were 344 DEGs throughout the whole developmental period (Figure 3d).
Unlike GE, in the three stages of HF fruit ripening, the specific genes in the first stage were mainly enriched in cell wall macromolecule metabolic process, plant organ formation, cell wall biogenesis, and positive regulation of cell differentiation (Figures S4 and S5). When the HF fruit development entered the second stage (H2 to H3), GO analysis showed that a large number of SHs was enriched into metabolically related pathways, including carbohydrate, tetrapyrrole, polysaccharide, chlorophyll, fatty acid, and some kinase activities were also enriched (Figure S4B). In the last stage, SHs also undergo great changes, mainly enriched in carbohydrates, chlorophyll metabolism, and methyltransferase activity (Figure S4C). The developmental phase of HF fruit was as long as 140 days, but only 178 DEGs overlap during the entire development process, which was significantly less than GE (Figure S4D). In general, the specific differential genes of GE and HF were enriched into different pathways at different developmental stages. In comparison, GE begins the stage of nutrient accumulation in G1 to G2 earlier than HF does.

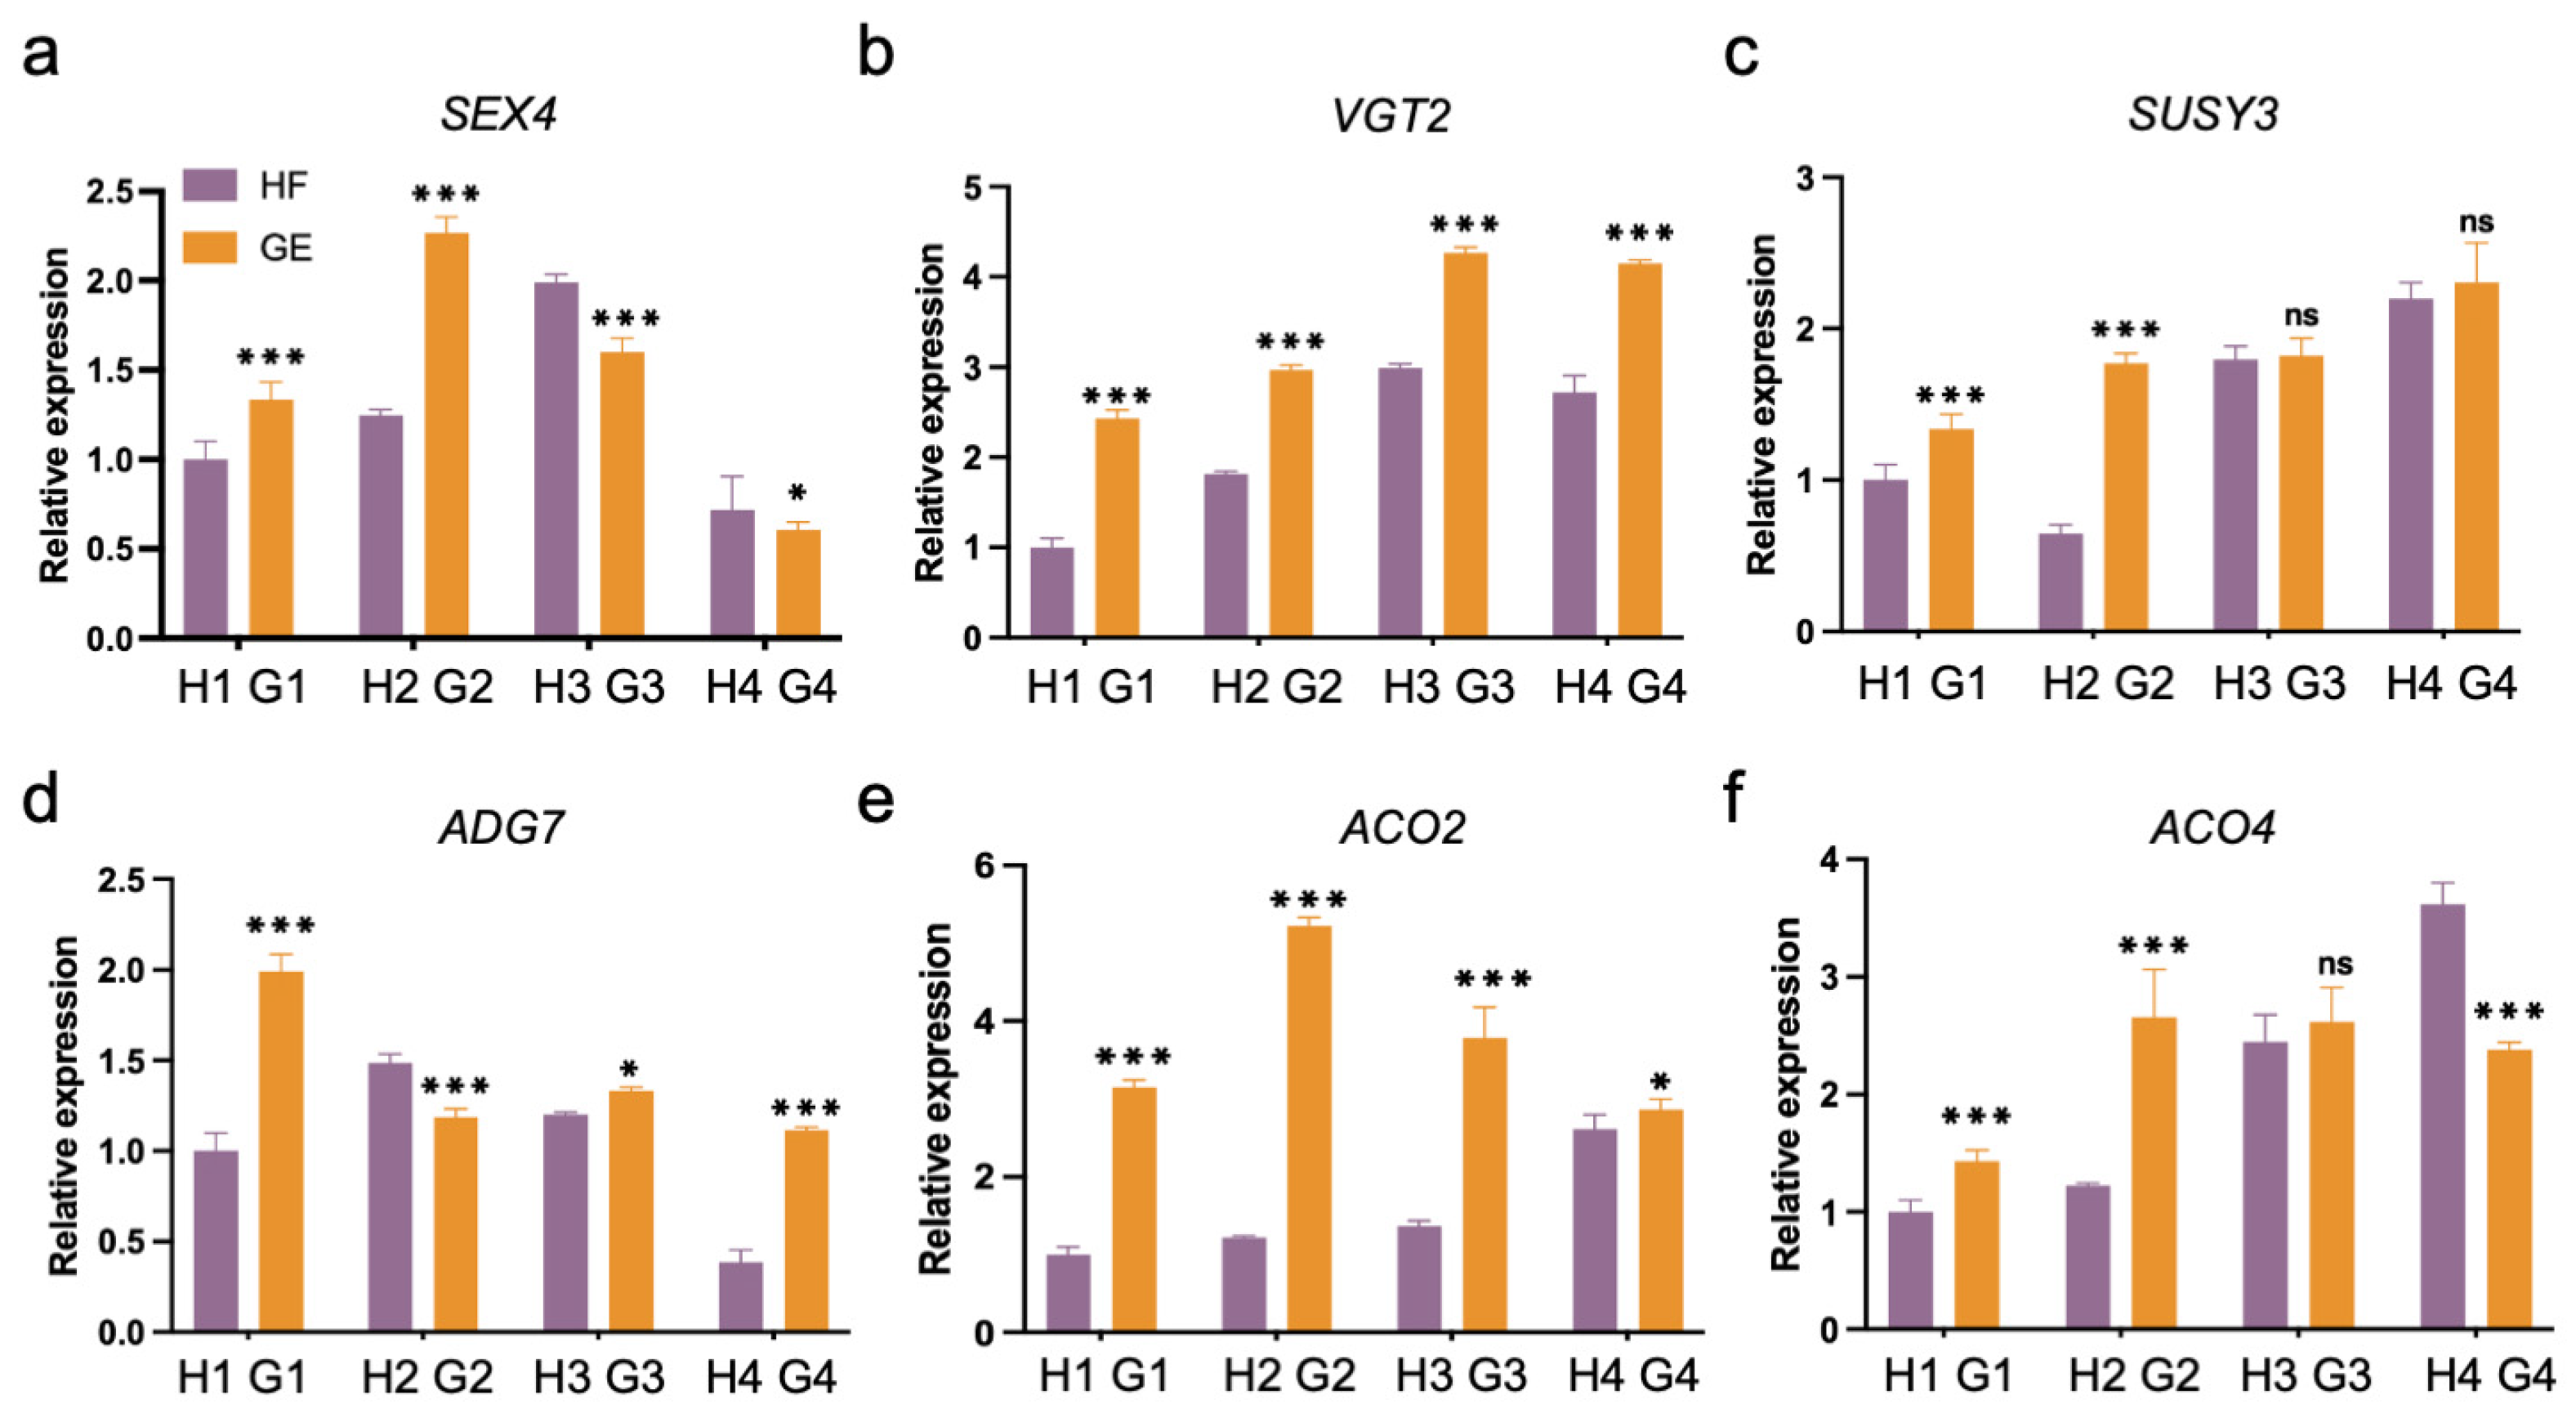
3.4. Expression of Various Functional Groups of Genes during Different Fruit Development Stages

To further investigate the differences in the same developmental time point of the GE and HF fruits, we performed differential expression analysis of DEGs on G1 compared with H1 (G1-H1), G2 compared with H2 (G2-H2), G3 compared with H3 (G3-H3), G4 compared with H4 (G4-H4) (Figure 4). Figure 4a shows the number of significantly different expression genes for these four comparison combinations. In G1-H1, a total of 6225 DEGs were identified, of which 3020 genes were upregulated and 3205 were downregulated (Figure 4a). For G2-H2, 4238 were upregulated and 5996 genes were downregulated. The above results showed that most DEGs were downregulated from the early fruit stage G1 to the fruit expansion stage G2, followed by the premature stage G3, where 3582 genes were upregulated and 8411 were downregulated. In contrast, the differential expression at G4 showed that more genes were upregulated and the number of downregulated genes decreased, where 5273 genes were upregulated and 8141 were downregulated, indicating that the number of differential genes increased as abundant metabolites accumulated at the fruit ripening stage (Figure 4a). In addition, a Venn diagram (Figure 4b) was performed between these four combinations, where a total of 1464 DEGs were observed in all four combinations. The overlaping of (G1-H1), (G2-H2) and (G3-H3) {(G1-H1) vs. (G2-H2) vs. (G3-H3)} has a total of 1033 DEGs, while (G2-H2) vs. (G3-H3) vs. (G4-H4) has 1422 DEGs, (G1-H1) vs. (G3-H3) vs. (G4-H4) with 584 DEGs, (G1-H1) vs. (G2-H2) vs. (G4-H4) with 435 DEGs. We observed that the number of common differential genes between nonadjacent developmental phases decreased, indicating that these differential genes functioned at multiple developmental phases. Furthermore, to investigate the involved biological processes of differential expression genes, they were enriched with Gene ontology. As shown in (Figure 4c), these differential genes were involved throughout in apple development and ripening, including significant involvement in immune response, hormone levels, ion transmembrane transport, and metabolic processes such as phenylpropanoid, lignin, nitrogen compound, and pigment.
Furthermore, to investigate the transcriptional regulations which cause the differences in the development and ripening of GE and HF apples, we performed a heatmap analysis of the DEGs involved in different metabolic pathways. As shown in Figure 4d, we found some genes related to the glucose metabolism pathway at a high level of expression in G1 compared with H1. Several genes were involved in sugar metabolism and transport, including neutral invertase3 (NIVN3, MD05G1115200); sucrose phosphate synthase7 (SPS7, MD02G1260700) and sucrose synthase1 (SUSY1, MD02G1260700). Some genes related to starch metabolism, such as starch synthetase2 (SS2, MD01G1218000) and starch synthetase4 (SS4, MD10G1321800), which are glycosyltransferases [12]; starch excess1 (SEX1, MD13G1096800); phosphoglucan waterdikinase (PWD, MD04G1025900); ADP-Glcpyrophosphorylase (ADG2, MD10G1072000). Noticeably, as compared to H2, the neutral invertase3 (NIVN3, MD05G1115200); starch excess1 (SEX1, MD13G1096800); starch excess4 (SEX4, MD01G1038900), disproportionating enzyme1 (DPE1, MD15G1333300); and vacuole glucose transporter (vGT, MD01G1235500) were highly expressed during G2. In contrast, we found high levels of SPS4, phosphoglucoisomerase (PGI, MD15G1031400), ADG1 (MD09G1133900), ADG2, SUSY3 (MD15G1031400), and NINV5 (MD11G1159600) in H3 and H4 (Figure 4d). In conclusion, some key genes for sugar synthesis and transport in glucose metabolic pathways are preferentially expressed in G1 and G2 stages of the GE fruits, while in case of HF fruits these genes are mainly expressed in H3 and H4 stages.
Furthermore, it was found that the expression levels of some hormone-related differential genes were significantly different at various developmental stages of the GE and HF fruits. Ethylene biosynthesis, signal transduction or gene transcript levels affect fruit ripening. In the ethylene biosynthetic pathway, the expression levels of ethylene-forming enzyme. ACOs (MD09G1114800, MD17G1106300), gradually increased in G1 and G2 development stages of the GE as compared to HF. In contrast, in HF fruit ripening, the ACO1 (MD05G1354000) was found to have a high expression at H4 (Figure S6). In addition, many genes involved in the ABA response were found to be highly expressed during the early development of GE fruits (Figure S6).
Finally, we examined the expression levels of six genes in different metabolic pathways during fruit development to determine the role of these genes in promoting fruit ripening by RT-qPCR. As expected, the expression of these genes was higher in GE (G1, G2) than in HF during the early development of fruits (Figure 5). In the pathway of sugar biosynthesis, the expression level of SEX4 gene was higher than HF in early development stages of GE (G1, G2), but that was reversed in fruit ripening development (H3, H4) (Figure 5a). The expression of VGT2 gene was significantly higher than HF in all four developmental periods of GE fruit (Figure 5b). Sucrose synthase (SUSY) is a glycosyl transferase enzyme that plays a key role in sugar metabolism, SUSY3 gene has a higher expression level only in fruit developmental phase of GE in advance (G1, G2), compared to HF (Figure 5c). In the G1 stages, the expression level of ADG7, which was a key pyrophosphorylase of the synthetic starch pathway, in GE fruit was almost twice that of HF (Figure 5d). The relative expression level of ethylene biosynthesis related genes, ACO2 and ACO4 had a higher expression level in late fruit developmental phase of HF (H3, H4) (Figure 5e,f). On the contrary, these two genes in the G2 phase of GE had advanced into higher levels of gene expression (Figure 5e,f). As expected, the expression of these genes was higher in GE (G1, G2) than in HF during the early development of fruits (Figure 5). Taken together, these results suggest that the expression of these genes during the early development of GE can affect the expression of sugar accumulation, ABA and ethylene synthesis related genes, thus promoting fruit ripening.

4. Discussion

China is a major fruit producer, and it has surpassed all other countries to become the world’s top producer and exporter of apples with a total planted area of 2.08 million hm2 and a yield of 44 million tons [46]. In the present Chinese apple industry, ‘Red Fuji’ accounts for more than 70% of the variety structure [46], concentrated on the market after October, resulting in a serious shortage of diversified varieties with market characteristics and limited consumer choices. Changes in the fruit ripening phase directly affect the commodity value and market competitiveness of the fruit market. Apples are perennial woody plants with a childhood period of about 5 years, so the traditional apple breeding technology based on phenotypic selection has a long cycle, high cost, and low efficiency. The current development of molecular breeding techniques based on genomic genetic marker selection is the basis for the efficient improvement of important traits in apples and an effective way to create new apple cultivars [2,47,48]. Here, we applied transcriptomics to analyze the expression characteristics of the different genes between the early-ripening cultivar ‘Geneva Early’ and the late-ripening cultivar ‘Hanfu’ as a function of fruit development and ripening. The expression changes of genes related to development and ripening in apple fruit were comprehensively analyzed, which provided a strong foundation for us to further explore the regulatory mechanism of apple fruit ripening.
Previous studies have reported that apple fruit is developed and matured at different stages, mainly including cell division, cell expansion, and maturation processes [7,8]. The accumulation of carbohydrates, organic acids, and sugars is all associated with fruit development. In early fruit development, carbon accumulation is used for carbon skeleton production and cell wall construction [7,8], while starch accumulation, as well as fructose, sucrose, and glucose content, is associated with fruit development [10], and this sugar accumulation pattern corresponds to the development of strawberries [49] and tomato [50]. Similarly, our results showed that DEGs from adjacent stages of the GE and HF overlapped in the same developmental period, and at the first stage of fruit development (G1-G2) vs. (H1-H2), the DEGs were mainly enriched into the cell cycle, cell division process, and hormonal pathways (Figure 2c) [3,10]. In the second and third periods of fruit development, the DEGs were enriched into metabolic pathways of polysaccharide and carbohydrate, as well as phenolic and flavonoid compounds, respectively. Although the length of developmental days of early and late maturing varieties varies greatly, but their whole developmental process is strikingly similar, which may be due to the other mechanisms in early-ripening varieties that promote fruit ripening. To further explore the key genes that regulate fruit ripening, we selected the specifically expressed genes from the results of DEGs overlapping in adjacent developmental stages of the GE and HF (Figure 3). During the first developmental stage, the SGs mainly showed an enrichment in the process of amino acid metabolism, fatty acid metabolism, tetrapyrrole metabolic, and pigment metabolic; while in the second stage of development, it was mainly enriched in the starch catabolism, lipid storage, phenylpropanoid biosynthetic, and cellular polysaccharide catabolism. From the differential gene analysis of the GE and HF at the same developmental stage, we identified that the MD10G1321800 gene (involved in the glucose metabolism pathway) and the homologous gene of Arabidopsis STARCH SYNTHASE 4 (SS4) [51] (a key enzyme for normal starch grain synthesis) has high levels of expression at G1 (Figure 4d).
Apple is a typical of climacteric fruit, which release a large amount of ethylene during the ripening process [51]. The early fruit development of the early-ripening variety ‘Anna’ had increased ethylene production, that was correlated with the high expression of the ethylene biosynthetic genes MdACS3a, MdACO2, 4, and 7 [52]. Virus-induced gene silencing (VIGS) was applied to silence the expressions of LeACS2, LeACS4, and LeACO1 genes, resulting in a significant decrease in the activities of ACS and ACO and inhibiting the development and maturation process of fruits [53]. Similarly, our investigation also discovered that a number of genes involved in hormone metabolism were present in G2, including the highly expressed gene MdACO2 (Figure S6). In Arabidopsis, AtABF2 has been reported to bind to and increase the expression of promoters of chlorophyll metabolism-related genes PAO and NYC1, thereby accelerating chlorophyll degradation [54]. Similarly, in the G2 stage of our results we also found a transcription factor MD08G1099600 (Figure S6), which is a homologous gene of the AtABF2. However, in the second developmental stage, SHs were enriched into metabolic pathways concerning sugars, carbon compounds, pigments, and amino acids (Figure S2).
In recent years, DNA methylation modification was found in tomato, orange, pear, banana, and strawberry fruits during development and ripening [32,33,55]. Previous studies describing the substantial changes of methylome dynamics in tomatoes, including the distribution of DNA methylation in the tomato genome during fruit development, and demethylation during ripening at specific promoters such as NON RIPENING (NOR) and COLORLESS NON RIPENING (CNR) promoters [32,33,55]. Active DNA demethylation is essential for the regulation of fruit ripening in tomatoes. The knockdown of the SlDML2 in tomatoes prevents fruit ripening primarily through hypermethylation and suppression of the production of ripening transcription factors [32,33,55]. Interestingly, our results showed that in the third developmental period (H3 to H4), differential genes were enriched into methylation and methyltransferase activity-related pathways. Taken together, it suggests that GE had a short development phase but the development process was consistent with HF, possibly due to the advanced expression of related genes regulating the fruit development compared with HF, so that fruit development enters the next developmental phase in advance.

5. Conclusions

In conclusion, the transcriptomic analysis of this study revealed differences between the early-ripening cultivar ‘Geneva Early’ (GE) and the late-ripening cultivar ‘Hanfu’ (HF) during apple fruit development and ripening. Changes in differential gene expression levels may reflect regulatory activities during fruit development. Further analysis of the specific differential genes of the two cultivars at the same developmental stage revealed the developmental differences in the early/late fruit ripening. Analysis of developmental differences in different periods further reveals the key genes that regulate apple ripening. These results gain a broader and better understanding of the molecular basis of apple ripening and provide a strong preference for the genome-assisted breeding of apples.

Supplementary Materials

The following supporting information can be downloaded at: https://www.mdpi.com/article/10.3390/horticulturae9050570/s1, Figure S1: Volcano plots of differentially expressed genes (DEGs). Figure S2: Heat map of specific differential gene expression among S (G2-G3) (specific DEGs of G2 compared with G3). Figure S3: Heat map of specific differential gene expression among S (G3-G4) (specific DEGs of G3 compared with G4). Figure S4: Specific differential gene expression analysis of HF. Figure S5: Heat map of specific differential gene expression at different developmental stages in HF. Figure S6: DEGs expression levels of hormone metabolic pathways in ‘Geneva Early’ and ‘Hanfu’ apple fruit at different developmental stages. Supplemental Table S1: Primers used in this study. Supplemental Table S2: Differentially Expressed Genes (DEGs) number of GE and HF apple fruit.

Author Contributions

Conceptualization, Q.Y., J.H., S.W. and Q.G.; formal analysis, J.H.; investigation, X.Y., P.C., W.S. and Y.S.; resources, F.M.; data curation, Q.Y.; writing—original draft preparation, Q.Y.; writing—review and editing, A.K. and Q.G.; project administration, Q.G.; funding acquisition, Q.G. All authors have read and agreed to the published version of the manuscript.

Funding

This research was supported by the Central Funds Guiding the Local Science and Technology Development of Shenzhen (2021Szvup117).

Data Availability Statement

The raw sequence data of RNA-seq have been deposited in the National Center for Biotechnology Information (https://www.ncbi.nlm.nih.gov/), accessed on 26 April 2023, under the accession number BioProject ID: PRJNA962024.

Acknowledgments

We would like to express our sincere thanks to Zhenli Yan of Zhengzhou Fruit Research Institute, Chinese Academy of Agricultural Sciences (CAAS), for providing the early-ripening variety ‘Geneva Early’ for this experiment. We thank Novogene company for helping us with transcriptome experiments.

Conflicts of Interest

The authors declare no conflict of interest.

References

  1. Nkuimi Wandjou, J.G.; Sut, S.; Giuliani, C.; Fico, G.; Papa, F.; Ferraro, S.; Caprioli, G.; Maggi, F.; Dall’Acqua, S. Characterization of nutrients, polyphenols and volatile components of the ancient apple cultivar ‘Mela Rosa Dei Monti Sibillini’ from Marche region, central Italy. Int. J. Food Sci. Nutr. 2019, 70, 796–812. [Google Scholar] [CrossRef] [PubMed]
  2. Devoghalaere, F.; Doucen, T.; Guitton, B.; Keeling, J.; Payne, W.; Ling, T.J.; Ross, J.J.; Hallett, I.C.; Gunaseelan, K.; Dayatilake, G.A.; et al. A genomics approach to understanding the role of auxin in apple (Malus × domestica) fruit size control. BMC Plant Biol. 2012, 12, 7. [Google Scholar] [CrossRef] [PubMed] [Green Version]
  3. Janssen, B.J.; Thodey, K.; Schaffer, R.J.; Alba, R.; Balakrishnan, L.; Bishop, R.; Bowen, J.H.; Crowhurst, R.N.; Gleave, A.P.; Ledger, S.; et al. Global gene expression analysis of apple fruit development from the floral bud to ripe fruit. BMC Plant Biol. 2008, 8, 16. [Google Scholar] [CrossRef] [Green Version]
  4. Malladi, A.; Hirst, P.M. Increase in fruit size of a spontaneous mutant of ‘Gala’ apple (Malus × domestica Borkh.) is facilitated by altered cell production and enhanced cell size. J. Exp. Bot. 2010, 61, 3003–3013. [Google Scholar] [CrossRef] [PubMed] [Green Version]
  5. Seymour, G.B.; Østergaard, L.; Chapman, N.H.; Knapp, S.; Martin, C. Fruit development and ripening. Annu. Rev. Plant Biol. 2013, 64, 219–241. [Google Scholar] [CrossRef] [Green Version]
  6. Aghdam, M.S.; Jannatizadeh, A.; Luo, Z.S.; Paliyath, G. Ensuring sufficient intracellular ATP supplying and friendly extracellular ATP signaling attenuates stresses, delays senescence and maintains quality in horticultural crops during postharvest life. Trends Food Sci. Tech. 2018, 76, 67–81. [Google Scholar] [CrossRef]
  7. Zhang, Y.Z.; Li, P.M.; Cheng, L.L. Developmental changes of carbohydrates, organic acids, amino acids, and phenolic compounds in ‘Honeycrisp’ apple flesh. Food Chem. 2010, 123, 1013–1018. [Google Scholar] [CrossRef]
  8. Li, M.J.; Feng, F.J.; Cheng, L.L. Expression Patterns of Genes Involved in Sugar Metabolism and Accumulation during Apple Fruit Development. PLoS ONE 2012, 7, e33055. [Google Scholar] [CrossRef] [PubMed] [Green Version]
  9. Araujo, W.L.; Martins, A.O.; Fernie, A.R.; Tohge, T. 2-Oxoglutarate: Linking TCA cycle function with amino acid, glucosinolate, flavonoid, alkaloid, and gibberellin biosynthesis. Front. Plant Sci. 2014, 5, 552. [Google Scholar] [CrossRef] [Green Version]
  10. Xu, J.D.; Yan, J.J.; Li, W.J.; Wang, Q.Y.; Wang, C.X.; Guo, J.X.; Geng, D.L.; Guan, Q.M.; Ma, F.W. Integrative Analyses of Widely Targeted Metabolic Profiling and Transcriptome Data Reveals Molecular Insight into Metabolomic Variations during Apple (Malus domestica) Fruit Development and Ripening. Int. J. Mol. Sci. 2020, 21, 4797. [Google Scholar] [CrossRef]
  11. Slewinski, T.L. Diverse Functional Roles of Monosaccharide Transporters and their Homologs in Vascular Plants: A Physiological Perspective. Mol. Plant 2011, 4, 641–662. [Google Scholar] [CrossRef] [PubMed]
  12. Ruan, Y.L. Sucrose Metabolism: Gateway to Diverse Carbon Use and Sugar Signaling. Annu. Rev. Plant Biol. 2014, 65, 33–67. [Google Scholar] [CrossRef]
  13. Johnston, J.W.; Gunaseelan, K.; Pidakala, P.; Wang, M.; Schaffer, R.J. Co-ordination of early and late ripening events in apples is regulated through differential sensitivities to ethylene. J. Exp. Bot. 2009, 60, 2689–2699. [Google Scholar] [CrossRef] [PubMed] [Green Version]
  14. Liu, M.; Pirrello, J.; Chervin, C.; Roustan, J.-P.; Bouzayen, M. Ethylene Control of Fruit Ripening: Revisiting the Complex Network of Transcriptional Regulation. Plant Physiol. 2015, 169, 2380–2390. [Google Scholar] [CrossRef] [PubMed] [Green Version]
  15. Yoo, S.-D.; Cho, Y.; Sheen, J. Emerging connections in the ethylene signaling network. Trends Plant Sci. 2009, 14, 270–279. [Google Scholar] [CrossRef] [Green Version]
  16. Wills, R.; McGlasson, W.; Graham, D.; Joyce, D. Physiology and biochemistry. In Postharvest: An Introduction to the Physiology and Handling of Fruit, Vegetables and Ornamentals; CABI: Wallingford, UK, 2007; pp. 28–51. [Google Scholar]
  17. Gao, J.; Zhang, Y.X.; Li, Z.G.; Liu, M.C. Role of ethylene response factors (ERFs) in fruit ripening. Food Qual. Saf. 2020, 4, 15–19. [Google Scholar] [CrossRef] [Green Version]
  18. Han, Y.-C.; Kuang, J.-F.; Chen, J.-Y.; Liu, X.-C.; Xiao, Y.-Y.; Fu, C.-C.; Wang, J.-N.; Wu, K.-Q.; Lu, W.-J. Banana Transcription Factor MaERF11 Recruits Histone Deacetylase MaHDA1 and Represses the Expression of MaACO1 and Expansins during Fruit Ripening. Plant Physiol. 2016, 171, 1070–1084. [Google Scholar] [CrossRef] [Green Version]
  19. Li, T.; Jiang, Z.; Zhang, L.; Tan, D.; Wei, Y.; Yuan, H.; Li, T.; Wang, A. Apple (Malus domestica) MdERF2 negatively affects ethylene biosynthesis during fruit ripening by suppressing MdACS1 transcription. Plant J. 2016, 88, 735–748. [Google Scholar] [CrossRef]
  20. Li, S.; Chen, K.; Grierson, D. Molecular and Hormonal Mechanisms Regulating Fleshy Fruit Ripening. Cells 2021, 10, 1136. [Google Scholar] [CrossRef]
  21. Breitel, D.A.; Chappell-Maor, L.; Meir, S.; Panizel, I.; Puig, C.P.; Hao, Y.; Yifhar, T.; Yasuor, H.; Zouine, M.; Bouzayen, M.; et al. AUXIN RESPONSE FACTOR 2 Intersects Hormonal Signals in the Regulation of Tomato Fruit Ripening. PLoS Genet. 2016, 12, e1005903. [Google Scholar] [CrossRef] [Green Version]
  22. El-Sharkawy, I.; Sherif, S.M.; Jones, B.; Mila, I.; Kumar, P.P.; Bouzayen, M.; Jayasankar, S. TIR1-like auxin-receptors are involved in the regulation of plum fruit development. J. Exp. Bot. 2014, 65, 5205–5215. [Google Scholar] [CrossRef] [Green Version]
  23. Yue, P.T.; Lu, Q.; Liu, Z.; Lv, T.X.; Li, X.Y.; Bu, H.D.; Liu, W.T.; Xu, Y.X.; Yuan, H.; Wang, A.D. Auxin-activated MdARF5 induces the expression of ethylene biosynthetic genes to initiate apple fruit ripening. New Phytologist. 2020, 226, 1781–1795. [Google Scholar] [CrossRef] [PubMed] [Green Version]
  24. Gupta, K.; Wani, S.H.; Razzaq, A.; Skalicky, M.; Samantara, K.; Gupta, S.; Pandita, D.; Goel, S.; Grewal, S.; Hejnak, V.; et al. Abscisic Acid: Role in Fruit Development and Ripening. Front. Plant Sci. 2022, 13, 817500. [Google Scholar] [CrossRef] [PubMed]
  25. Hou, B.Z.; Li, C.L.; Han, Y.Y.; Shen, Y.Y. Characterization of the hot pepper (Capsicum frutescens) fruit ripening regulated by ethylene and ABA. BMC Plant Biol. 2018, 18, 162. [Google Scholar] [CrossRef] [PubMed] [Green Version]
  26. Weng, L.; Zhao, F.; Li, R.; Xiao, H. Cross-talk modulation between ABA and ethylene by transcription factor SlZFP2 during fruit development and ripening in tomato. Plant Signal. Behav. 2015, 10, e1107691. [Google Scholar] [CrossRef] [Green Version]
  27. An, J.P.; Wang, X.F.; Li, Y.Y.; Song, L.Q.; Zhao, L.L.; You, C.X.; Hao, Y.J. EIN3-LIKE1, MYB1, and ETHYLENE RESPONSE FACTOR3 Act in a Regulatory Loop That Synergistically Modulates Ethylene Biosynthesis and Anthocyanin Accumulation. Plant Physiol. 2018, 178, 808–823. [Google Scholar] [CrossRef] [PubMed] [Green Version]
  28. Ni, J.; Bai, S.; Zhao, Y.; Qian, M.; Tao, R.; Yin, L.; Gao, L.; Teng, Y. Ethylene response factors Pp4ERF24 and Pp12ERF96 regulate blue light-induced anthocyanin biosynthesis in ‘Red Zaosu’ pear fruits by interacting with MYB114. Plant Mol. Biol. 2019, 99, 67–78. [Google Scholar] [CrossRef]
  29. Messeguer, R.; Ganal, M.W.; Steffens, J.C.; Tanksley, S.D. Characterization of the level, target sites and inheritance of cytosine methylation in tomato nuclear DNA. Plant Mol. Biol. 1991, 16, 753–770. [Google Scholar] [CrossRef] [PubMed]
  30. Zhang, B.; Tieman, D.M.; Jiao, C.; Xu, Y.; Chen, K.; Fei, Z.; Giovannoni, J.J.; Klee, H.J. Chilling-induced tomato flavor loss is associated with altered volatile synthesis and transient changes in DNA methylation. Proc. Natl. Acad. Sci. USA 2016, 113, 12580–12585. [Google Scholar] [CrossRef] [Green Version]
  31. Zou, L.; Liu, W.; Zhang, Z.; Edwards, E.J.; Gathunga, E.K.; Fan, P.; Duan, W.; Li, S.; Liang, Z. Gene body demethylation increases expression and is associated with self-pruning during grape genome duplication. Hortic. Res. 2020, 7, 84. [Google Scholar] [CrossRef]
  32. Cheng, J.F.; Niu, Q.F.; Zhang, B.; Chen, K.S.; Yang, R.H.; Zhu, J.K.; Zhang, Y.J.; Lang, Z.B. Downregulation of RdDM during strawberry fruit ripening. Genome Biol. 2018, 19, 212. [Google Scholar] [CrossRef] [Green Version]
  33. Huang, H.; Liu, R.; Niu, Q.; Tang, K.; Zhang, B.; Zhang, H.; Chen, K.; Zhu, J.K.; Lang, Z. Global increase in DNA methylation during orange fruit development and ripening. Proc. Natl. Acad. Sci. USA 2019, 116, 1430–1436. [Google Scholar] [CrossRef] [PubMed] [Green Version]
  34. Liu, Y.; Gao, X.H.; Tong, L.; Liu, M.Z.; Zhou, X.K.; Tahir, M.M.; Xing, L.B.; Ma, J.J.; An, N.; Zhao, C.P.; et al. Multi-omics analyses reveal MdMYB10 hypermethylation being responsible for a bud sport of apple fruit color. Hortic. Res. 2022, 9, uhac179. [Google Scholar] [CrossRef]
  35. Sun, X.; Jiao, C.; Schwaninger, H.; Chao, C.T.; Ma, Y.; Duan, N.; Khan, A.; Ban, S.; Xu, K.; Cheng, L.; et al. Phased diploid genome assemblies and pan-genomes provide insights into the genetic history of apple domestication. Nat. Genet. 2020, 52, 1423–1432. [Google Scholar] [CrossRef] [PubMed]
  36. Xie, Y.P.; Chen, P.X.; Yan, Y.; Bao, C.N.; Li, X.W.; Wang, L.P.; Shen, X.X.; Li, H.Y.; Liu, X.F.; Niu, C.D.; et al. An atypical R2R3 MYB transcription factor increases cold hardiness by CBF-dependent and CBF-independent pathways in apple. New Phytologist. 2018, 218, 201–218. [Google Scholar] [CrossRef] [PubMed]
  37. Way, R.D.; Livermore, K.G.; Aldwinckle, H.S. Geneva Early Apple. Hortscience 1982, 17, 989. [Google Scholar] [CrossRef]
  38. Baolin, S. Introduction of Zaojie Apple in southern Shandong Province. China Fruit Veg. 2006, 4, 11–12. [Google Scholar]
  39. Cai, M.; Gao, W.; Chen, J.; Qin, S.; Ma, H.; Lv, D.; Liu, G. Effects of different paper bag treatments on fruit quality development of Hanfu apple. North. Hortic. 2009, 7, 19–21. [Google Scholar]
  40. Zhao, D.; Liu, G.; Lv, D.; Qin, S.; Ma, H.; Wang, H. Evaluation of the specific characters of Hanfu apple cultivar. J. Fruit Sci. 2009, 26, 6–12. [Google Scholar]
  41. Li, N.N.; Xu, C.C.; Li-Beisson, Y.H.; Philippar, K. Fatty Acid and Lipid Transport in Plant Cells. Trends Plant Sci. 2016, 21, 145–158. [Google Scholar] [CrossRef] [Green Version]
  42. Lim, G.H.; Singhal, R.; Kachroo, A.; Kachroo, P. Fatty Acid- and Lipid-Mediated Signaling in Plant Defense. Annu. Rev. Phytopathol. 2017, 55, 505–536. [Google Scholar] [CrossRef] [PubMed]
  43. Ye, Y.J.; Nikovics, K.; To, A.; Lepiniec, L.; Fedosejevs, E.T.; Van Doren, S.R.; Baud, S.; Thelen, J.J. Docking of acetyl-CoA carboxylase to the plastid envelope membrane attenuates fatty acid production in plants. Nat. Commun. 2020, 11, 6191. [Google Scholar] [CrossRef] [PubMed]
  44. Geng, P.; Zhang, S.; Liu, J.Y.; Zhao, C.H.; Wu, J.; Cao, Y.P.; Fu, C.X.; Han, X.; He, H.; Zhao, Q. MYB20, MYB42, MYB43, and MYB85 Regulate Phenylalanine and Lignin Biosynthesis during Secondary Cell Wall Formation. Plant Physiol. 2020, 182, 1272–1283. [Google Scholar] [CrossRef] [PubMed] [Green Version]
  45. Zhong, R.Q.; Lee, C.H.; Zhou, J.L.; McCarthy, R.L.; Ye, Z.H. A Battery of Transcription Factors Involved in the Regulation of Secondary Cell Wall Biosynthesis in Arabidopsis. Plant Cell 2008, 20, 2763–2782. [Google Scholar] [CrossRef] [Green Version]
  46. Shu Huairui, Z.S. History and prospect of Chinese apple industry in 70 years. Deciduous Fruits 2021, 53, 3. [Google Scholar]
  47. Daccord, N.; Celton, J.M.; Linsmith, G.; Becker, C.; Choisne, N.; Schijlen, E.; van de Geest, H.; Bianco, L.; Micheletti, D.; Velasco, R.; et al. High-quality de novo assembly of the apple genome and methylome dynamics of early fruit development. Nat. Genet. 2017, 49, 1099. [Google Scholar] [CrossRef]
  48. Velasco, R.; Zharkikh, A.; Affourtit, J.; Dhingra, A.; Cestaro, A.; Kalyanaraman, A.; Fontana, P.; Bhatnagar, S.K.; Troggio, M.; Pruss, D.; et al. The genome of the domesticated apple (Malus × domestica Borkh.). Nat. Genet. 2010, 42, 833. [Google Scholar] [CrossRef] [Green Version]
  49. Fait, A.; Hanhineva, K.; Beleggia, R.; Dai, N.; Rogachev, I.; Nikiforova, V.J.; Fernie, A.R.; Aharoni, A. Reconfiguration of the achene and receptacle metabolic networks during strawberry fruit development. Plant Physiol. 2008, 148, 730–750. [Google Scholar] [CrossRef] [Green Version]
  50. Carrari, F.; Baxter, C.; Usadel, B.; Urbanczyk-Wochniak, E.; Zanor, M.-I.; Nunes-Nesi, A.; Nikiforova, V.; Centero, D.; Ratzka, A.; Pauly, M. Integrated analysis of metabolite and transcript levels reveals the metabolic shifts that underlie tomato fruit development and highlight regulatory aspects of metabolic network behavior. Plant Physiol. 2006, 142, 1380–1396. [Google Scholar] [CrossRef] [Green Version]
  51. Lu, K.J.; Pfister, B.; Jenny, C.; Eicke, S.; Zeeman, S.C. Distinct Functions of STARCH SYNTHASE 4 Domains in Starch Granule Formation. Plant Physiol. 2018, 176, 566–581. [Google Scholar] [CrossRef] [Green Version]
  52. Singh, V.; Weksler, A.; Friedman, H. Different Preclimacteric Events in Apple Cultivars with Modified Ripening Physiology. Front Plant Sci. 2017, 8, 1502. [Google Scholar] [CrossRef] [PubMed] [Green Version]
  53. Li, L.; Zhu, B.Z.; Fu, D.Q.; Luo, Y.B. RIN transcription factor plays an important role in ethylene biosynthesis of tomato fruit ripening. J. Sci. Food Agric. 2011, 91, 2308–2314. [Google Scholar] [CrossRef] [PubMed]
  54. Gao, S.; Gao, J.; Zhu, X.Y.; Song, Y.; Li, Z.P.; Ren, G.D.; Zhou, X.; Kuai, B.K. ABF2, ABF3, and ABF4 Promote ABA-Mediated Chlorophyll Degradation and Leaf Senescence by Transcriptional Activation of Chlorophyll Catabolic Genes and Senescence-Associated Genes in Arabidopsis. Mol. Plant 2016, 9, 1272–1285. [Google Scholar] [CrossRef] [PubMed] [Green Version]
  55. Lu, P.; Yu, S.; Zhu, N.; Chen, Y.R.; Zhou, B.; Pan, Y.; Tzeng, D.; Fabi, J.P.; Argyris, J.; Garcia-Mas, J.; et al. Genome encode analyses reveal the basis of convergent evolution of fleshy fruit ripening. Nat. Plants 2018, 4, 784–791. [Google Scholar] [CrossRef] [Green Version]
Figure 1. Apple Fruit Quality Characteristics: (a) Apple fruit at various stages of development. ‘Geneva Early’ apple fruit at 7 Days After Pollination (DAP), 24 DAP, 49 DAP, 69 DAP; ‘Hanfu’ apple fruit at 7 DAP, 24 DAP, 110 DAP, 140 DAP. The four sampling time points of early- and late-ripening varieties were based on showing the timing of major physiological events in fruit development, as referenced from [3,37,39]. (b) The length and (c) diameter of ‘Geneva Early’ and ‘Hanfu’ apple fruit in four different stages of development. (d) The TSS (Total Soluble Solids) and (e) TA (Titratable Acid) contents of ‘Geneva Early’ and ‘Hanfu’ at the stage of fruit ripening. Asterisks indicate significant differences (Student’s two-tailed t-test; * p < 0.05 and *** p < 0.001). Error bars indicate standard deviation (n = 10).
Horticulturae 09 00570 g001
Figure 2. The dynamic transcriptome of apple development and ripening: (a) Principal component analysis of transcriptome data from four developmental stages of the ‘Geneva Early’(GE) and ‘Hanfu’(HF) fruit. The transcriptome for each stage has three biological replicates. (b) Number of differentially expressed genes (DEGs) in GE and HF apple fruit in four different stages of development. G1 compared with G2 (G1-G2), G2 compared with G3 (G2-G3), G3 compared with G4 (G3-G4), H1 compared with H2 (H1-H2), H2 compared with H3 (H2-H3), H3 compared with H4 (H3-H4). Red color represents up-regulated genes, blue color represents down-regulated genes. (c) Heat map of Gene Ontology (GO) enrichment. G1 and H1 represent 7 DAP; G2 and H2 represent 24 DAP; G3 represents 49 DAP; H3 represents 110 DAP; G4 represents 69 DAP; H4 represents 140 DAP.
Horticulturae 09 00570 g002
Figure 3. Differentially expression genes among different fruit-development stages: (a) Venn diagram of differential expression genes among G1-G2 vs. H1-H2, G2-G3 vs. H2-H3, G3-G4 vs. H3-H4; (b) GO pathway assignment of differential repression among S (G1-G2) (specific DEGs of G1-G2), S (G2-G3) (specific DEGs of G2-G3), S (G3-G4) (specific DEGs of G3-G4), The dot color represents the p-value, and the dot size represents the number of differential expression genes; (c) Heat map of specific differential gene expression among S (G1-G2); (d) Venn diagram of differential expression among S (G1-G2), S (G2-G3), S (G3-G4). G1 and H1 represent 7 DAP; G2 and H2 represent 24 DAP; G3 represents 49 DAP; H3 represents 110 DAP; G4 represents 69 DAP; H4 represents 140 DAP.
Horticulturae 09 00570 g003
Figure 4. Difference analysis of ‘Geneva Early’ and ‘Hanfu’ apple fruit at the same developmental stage: (a) Volcano plots of differentially expressed genes among G1-H1 (G1 compared with H1), G2-H2 (G2 compared with H2), G3-H3 (G3 compared with H3), G4-H4 (G4 compared with H4), Up represent up-regulated genes, No sig represent no significance, and Down represent down-regulated genes; (b) Venn diagram of differentially expressed genes among G1-H1, G2-H2, G3-H3, G4-H4; (c) GO pathway assignment of differential repression among G1-H1, the dot color represents the p-value, and the dot size represents the number of differential expression genes; (d) Expression levels of differentially expressed genes of sugar metabolic pathways in ‘Geneva Early’ and ‘Hanfu’ apple fruit at different developmental stages. G1 and H1 represent 7 DAP; G2 and H2 represent 24 DAP; G3 represents 49 DAP; H3 represents 110 DAP; G4 represents 69 DAP; H4 represents 140 DAP.
Horticulturae 09 00570 g004
Figure 5. Expression profiles of sugar and ethylene biosynthesis genes in ‘Geneva Early’ and ‘Hanfu’ fruits at four different stages: (ad) The relative expression level of sugar biosynthesis related genes. (e,f) The relative expression level of ethylene biosynthesis related genes. G1 and H1 represent 7 DAP; G2 and H2 represent 24 DAP; G3 represents 49 DAP; H3 represents 110 DAP; G4 represents 69 DAP; H4 represents 140 DAP. Error bars indicate SD, n = 3, Statistical analyses were performed by Student’s two-tailed t-test. Asterisks indicate significant differences between the GE fruits and the HF in each group, and statistically significant differences are indicated by * p < 0.05 and *** p < 0.001, ns represents no significance.
Horticulturae 09 00570 g005
Disclaimer/Publisher’s Note: The statements, opinions and data contained in all publications are solely those of the individual author(s) and contributor(s) and not of MDPI and/or the editor(s). MDPI and/or the editor(s) disclaim responsibility for any injury to people or property resulting from any ideas, methods, instructions or products referred to in the content.

