Abstract
Chrysanthemum mongolicum and Chrysanthemum vestitum belong to the Asteraceae family, which occupy a wider range of ecological niches and represent extensive biotic resistance and abiotic tolerance. However, the genetic information about these two species is poorly known, which restricts their utilization. Here, the leaf transcriptomes of the two Chrysanthemum species were investigated and compared. In total, 21,856 differentially expressed genes (DEGs) were identified between C. vestitum and C. mongolicum, of which 12,076 DEGs were up-regulated and 9780 were down regulated in C. vestitum compared to C. mongolicum. Functional enrichment analysis revealed that stress resistance categories had significant proportions. The up-regulated DEGs related to “ABC transporters”, “Flavonoid biosynthesis” and “Monoterpenoid biosynthesis” were significantly enriched in C. vestitum compared with C. mongolicum. While the DEGs involved in “Biosynthesis of unsaturated fatty acids”, “Proteasome”, “Phenylpropanoid biosynthesis”, “Oxidative phosphorylation”, “Plant-pathogen interaction”, “Starch and sucrose metabolism”, “Glutathione metabolism”, as well as “MAPK signaling pathway” were mostly up-regulated in C. mongolicum compared with C. vestitum, suggesting their important roles in C. mongolicum. These results might explain the differences in morphology and provide potential molecular mechanisms for the ecological adaptation of the two Chrysanthemum species in extreme environments. Together, the results of this study provide a genetic resource that may greatly benefit the genetic improvement of cultivated chrysanthemums and will be helpful for plant conservation and sustainable utilization in the future.
1. Introduction
Chrysanthemum L. belongs to the Asteraceae family, which comprises about 37 species. More than 20 wild species of Chrysanthemum are native to China, distributed from the north to the south and occurring at elevations ranging from plain to high-alpine, even more than 3600 m, employing a broader diversity of morphological and physiological adaptations to environmental conditions [1,2], and harboring valuable gene resources. Chrysanthemums are one of the most famous floral plants in China and comprise the most abundant cultivars worldwide. However, in the long-term cultivation process, the ornamental characteristics, adaptability, and stress resistance of chrysanthemum gradually decline, which limits its garden application and commercial production. Therefore, the improvement of chrysanthemums with excellent environmental tolerance has always been a hot issue in modern chrysanthemum breeding [3]. Chrysanthemums have been suggested as a complex hybrid that originated from some wild relatives [4,5]. Thus, wild Chrysanthemum species are the primary gene pool of chrysanthemums. The genetic improvement of cultivated chrysanthemums will most benefit from the valuable genetic resources of wild species. However, to date, only a small number of wild Chrysanthemum species genomes have been explored [6,7,8].
Chrysanthemum mongolicum and Chrysanthemum vestitum are two Chrysanthemum wild species that are distributed in arid regions, and have notable tolerance to abiotic stress and barren soil [9,10]. In addition, C. vestitum is a wild hexaploid, which has been supported as wild progenitors that contributed to cultivated chrysanthemums [4,5]. However, the two species’ morphological traits are clearly distinguishable (Figure 1A,G). Previous studies on these two plants mainly focused on phylogenetic relationships [2,5,10] or on geographical distribution analysis [9,11]. Little is known about the morphophysiological and molecular biology of the overall plant or the plant’s resistance characteristics against stress.
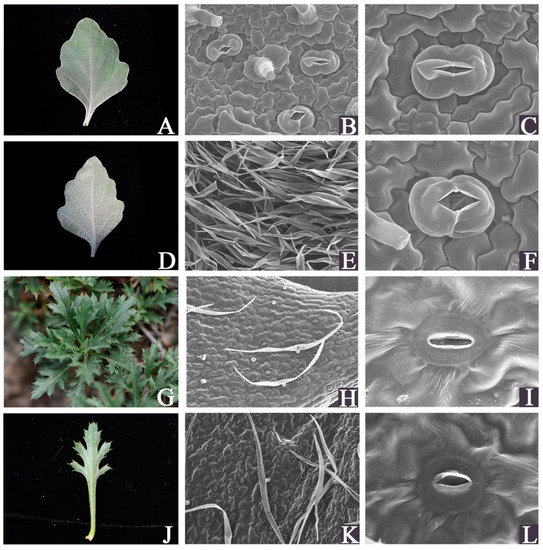
Figure 1.
Fresh and scanning electron microscopic images of the leaves of C. vestitum and C. mongolicum. (A–F): C. vestitum; (G–L): C. mongolicum; (A,D,G,J): fresh images; (B,C,H,I): Scanning electron microscopic images of the upper epidermis surface; (E,F,K,L): Scanning electron microscopic images of the lower epidermis surface.
The transcriptome is an efficient method for the specific characterization and quantification of different types of RNA molecules in a tissue of a given organism using high-throughput technologies [12]. It can generate abundant transcripts associated with trait evolution and diversification [13,14], which enable us to understand gene regulation mechanisms and networks and discover interesting genes. In addition, comparative transcriptome studies between closely related species are also important to discover genes related to particular biological functions and provide genus-specific genomic resources. The transcriptome has been extensively used in plants, especially for some non-model species and some species with large and complex genomes, greatly prompting the discovery of novel genes and understanding the complex regulation networks in higher plants [15,16,17].
Here, we characterized the C. mongolicum and C. vestitum transcriptomes using the Illumina paired-end sequencing platform and performed a comparative transcriptome analysis between these two species. Our aims are to find the genetic difference and detect the mechanisms contributing to the strategies they adapt to the environmental stress between C. mongolicum and C. vestitum. The transcriptomic data yielded in the present study provides new information about the adaptation of the two Chrysanthemum species in extreme environments and will be useful for further studies on the transcriptomics and metabolomics of Chrysanthemum and Asteraceae in general. It will also increase the genetic resources available for chrysanthemum breeding or evolutionary analysis.
2. Materials and Methods
2.1. Plant Materials
C. mongolicum (M) and C. vestitum (V) were collected from Baotou in Inner Mongolia, China, and Funiu Mountain in Henan province, China, respectively. The plants were planted in arid soil filled with stones and bricks in the nurse garden of Northeastern University in Shenyang, China. The voucher specimens were stored in the herbariums of Northeastern University and Northwest A&F University (WUK, Yangling, Shaanxi, China). Fresh leaves of two species were sampled from the transplants being cultivated for one year, immediately frozen in liquid nitrogen, and stored at −80 °C until further use. Three biological replications were created for each species.
2.2. Morphological Analysis
The mature leaves of C. mongolicum and C. vestitum were collected and fixed in FAA (formalin–acetic–ethanol–water = 10:5:50:35) for scanning electron microscopy (SEM) analysis. Firstly, the samples were dissected and dehydrated in an ethanol and isoamyl acetate series. Then, they were treated with critical-point drying in CO2 and sputter-coated with gold according to the description of Usma [18]. The micrographs were taken using a Hitachi S-3500 scanning electron microscope (Hitachi, Tokyo, Japan). The photographs of mature leaves were taken using a Nikon D7100 digital camera.
2.3. RNA Extraction, Library Construction, and Illumina Sequencing
Total RNA was extracted using the Omega Plant RNA Kit (Omega, Norcross, GA, USA) according to the manufacturer’s instructions and treated with RNase-free DNase I (Omega) to remove the genomic DNA. A NanoDrop 2000 spectrophotometer (NanoDrop Technologies, Wilmington, DE, USA) and an Agilent 2100 Bioanalyzer (Santa Clara, CA, USA) were used to check the quality of RNA. The mRNA purification, fragmentation, cDNA synthesis, adapter addition, fragment size selection, and PCR amplification were conducted according to the method described by Zhang et al. [7]. The cDNA libraries were sequenced on the Illumina sequencing platform (Illumina HiSeq™ 2500) by Novogene Co., Ltd. (Tianjin, China). The raw data were deposited in the Sequence Read Archive (SRA) of the National Center for Biotechnology Information (NCBI) under the accession number “Bioproject accession: BioProject ID: PRJNA843897 and PRJNA987857”.
2.4. Sequence Assemble and DEG Analysis
High-quality clean reads were generated after removing the reads having adaptors, containing an ‘N’ rate greater than 10%, and low-quality reads containing greater than 50% of low-quality (Q-value ≤ 20) bases using the Filterfq program (BGI, Shenzhen, China). The genome of Chrysanthemum nankingense [6] was used as a reference. The clean data were mapped to the C. nankingense genome using Hisat2 software [19]. The differentially expressed genes (DEGs) between the two species were screened using the DESeq R package (version 1.10.1) [20] with a threshold of |log2 (fold change)| ≥ 1 and a false discovery rate (FDR) < 0.05. The accumulation patterns of the DEGs were performed by the heatmap package of the R language. GO and KEGG pathway enrichment analyses of the DEGs were performed with the GOseq R package [21] and KOBAS software [22], respectively.
2.5. Validation of DEG Expression
Twelve DEGs were randomly selected to validate the accuracy of RNA-seq data by qRT-PCR. Total RNA was extracted using the E.Z.N.A. Plant RNA Kit (Omega Bio-Tek, Norcross, GA, USA) and digested using RNase-free DNase I (Omega Bio-Tek, Norcross, GA, USA) to remove genomic DNA contamination. Single-strand cDNA was synthesized using a Revert Aid First Strand cDNA Synthesis kit (Thermo Fisher Scientific Inc., Waltham, MA, USA) following the manufacturer’s instructions. Specific primers designed by Primer Express 3.0 are listed in Table S1. qRT-PCR was performed in triplicate, containing a template of 1: 5 dilution of the cDNA, 1.0 µL of each primer to a final concentration of 400 nM, 10 μL of SYBR Green Master Mix (Thermo Fisher Scientific, USA), and PCR-grade ddH2O to a final volume of 20 μL. The qPCR conditions were carried out as follows: denaturation at 55 °C for 2 min, 94 °C for 5 min, and 40 cycles consisting of 94 °C for 15 s and 60 °C for 1 min on an ABI QuantStudio 5 real-time PCR system thermocycler. Actin was used as an internal control for normalizing the relative expression levels of selected genes according to previously published studies [23,24]. The relative expression levels of DEGs were determined using the 2−ΔΔCt method [25].
3. Results and Discussion
3.1. SEM Analysis of Leaf Surface Micro-Morphology of C. mongolicum and C. vestitum
SEM was performed to examine the leaf epidermis micromorphology differences between C. mongolicum and C. vestitum (Figure 1). The leaf surfaces of the two species showed a distinct difference in appearance. The thick trichome layer is a significant feature of C. vestitum leaves. Both the abaxial and adaxial surfaces of the leaves were covered with densely and thickly appressed pubescence in C. vestitum (Figure 1A,D,E), in contrast, sparsely short trichomes were present on the leaf surface of C. mongolicum. The stomatal apparatuses and cell shapes were different between the two species. Anomocytic stomata were present in C. vestitum, while C. mongolicum showed actinocytic stomata. The stomata in C. vestitum were larger than those in C. mongolicum, while they were slightly sunken in C. mongolicum (Figure 1B,C,F,I,L). Leaf trichomes act as a physical barrier, which plays an important role in defending against biotic attack, reducing leaf transpiration, and resisting the harmful effects of UV-B radiation [26,27,28,29]. The stress-tolerant species always present dense trichomes on their leaves. In addition, wax has been suggested to increase the drought tolerance of plants [30,31]. The marked cuticular wax was distinct on the surface of the leaves of C. mongolicum. Thus, these leaf features provide C. vestitum and C. mongolicum with specific eco-physiological advantages to cope with stress. The difference in morphology between C. vestitum and C. mongolicum also revealed that they have evolved distinct adaptation strategies to the conditions of their habitats.
3.2. High-Throughput Transcriptome Sequencing and Read Assembly
The leaf transcriptomes of two Chrysanthemum species were characterized using the RNA sequencing method. Approximately 44.43 Gb of Illumina RNA-seq data were obtained from the leaves of C. mongolicum and C. vestitum after the terminal adaptor sequences, duplicated and ambiguous sequences, and low-quality reads were removed. In total, 23.07 Gb and 24.36 Gb of clean read data in the transcriptome were assemblies for C. mongolicum and C. vestitum, respectively. The Q20 scores were greater than 97.7%, and the GC content ranged from 42.69% to 43.1% for each sample (Table 1).

Table 1.
Summary of RNA-seq data in two Chrysanthemum species.
A total of 36,333 transcripts were obtained after clean reads of the two species were assembled to the C. nankingense genome sequence, of which 21,129 transcripts were shared between C. vestitum and C. mongolicum, and 8602 and 6602 were specially expressed in C. vestitum and C. mongolicum, respectively (Figure S1).
3.3. Differential Gene Expression Analysis
By filtering with FDR < 0.05 and fold change ≥ 1, 21,856 DEGs in C. vestitum had changed significantly compared with C. mongolicum. Hierarchical clustering analysis (HCA) showed a distinct difference in gene expression patterns between C. vestitum and C. mongolicum (Figure 2A). There were 12,076 DEGs that were up-regulated in C. vestitum and 9780 that were down-regulated (Figure 2B).
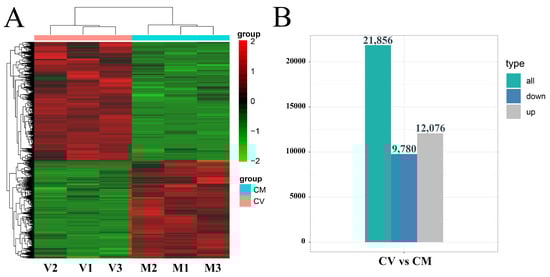
Figure 2.
Hierarchical clustering analysis of the differentially expressed genes (DEGs) for C. vestitum versus C. mongolicum and the numbers of DEGs. (A) A cluster graph for expression genes of all samples. Red represents a relatively high expression level of DEGs, while green segments represent a relatively low expression level of DEGs. (B) The number of DEGs identified in the comparisons of C. vestitum versus C. mongolicum.
3.4. Enrichment Analysis of DEG
Based on the Nr annotation, the DEGs were classified into 1201 GO categories and mainly assigned to molecular functions and biological processes. In the biological process category, the largest identified term was “response to stress” (GO: 0006950), which contains 216 genes, followed by the aminoglycan catabolic process, amino sugar metabolic process, chitin metabolic process, amino sugar catabolic process, and so on. ADP binding, oxidoreductase activity, acting on paired donors, with oxidation of a pair of donors resulting in the reduction of molecular oxygen to two molecules of water, hydrolase activity, hydrolyzing O-glycosyl compounds (GO: 0004553), and hydrolase activity, acting on glycosyl bonds (GO: 0016798), were the most prominent terms in molecular function. Only “nucleolus” was enrichment in the cellular component category (Figure 3A).
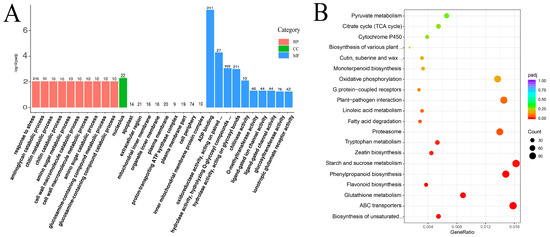
Figure 3.
GO classifications and KEGG pathway enrichment of different expression genes in the transcriptome of C.vestitum and C. mongolicum. (A): GO classifications. Enriched GO terms were shown on the X-axis, and the number of differentially expressed genes (DEGs) was shown on the Y-axis. (B): KEGG pathway enrichment of different expression genes (top 20). The dot size corresponds to the number of DEGs in a related pathway. The rich factor corresponds to the ratio of the DEG numbers assigned to a certain pathway to the total number of genes annotated in this pathway.
A total of 137 KEGG pathways were enriched among the DEGs between the two species. Among the top 20 enrichment pathways, “Starch and sucrose metabolism” (114), “ABC transporter” (111), “Phenylpropanoid biosynthesis” (104), “Plant-pathogen interaction” (102), “Proteasome” (98), “Oxidative phosphorylation” (92), “Flavonoid biosynthesis”, “Monoterpenoid biosynthesis”, “typtophan metabolism”, “Zeatin biosynthesis”, “Glutathione metabolism”, “Cutin suberine and wax biosynthesis”, and “Fatty acid metabolism” were most enriched, which were also well-known pathways related to abiotic stress in plants (Figure 3B). Of which, the up-regulated DEGs related to “ABC transporters”, “Flavonoid biosynthesis” and “Monoterpenoid biosynthesis” were significantly enriched in C. vestitum compared to C. mongolicum. While the down-regulated DEGs were significantly enriched in “Biosynthesis of unsaturated fatty acids”, “Proteasome”, “Phenylpropanoid biosynthesis”, “Plant-pathogen interaction, “Oxidative phosphorylation”, “MAPK signaling pathway”, as well as “Glutathione metabolism” (Figure S2), which indicate the important roles they played in C. mongolicum. These results indicated that different metabolites were synthesized in various Chrysanthemum wild species, which contribute to their morphology and adaptation strategies to their habitats.
3.5. Gene Validation and Expression Analysis
Twelve DEGs were randomly chosen for validation of the reliability of transcriptome data using qRT-PCR with gene-specific primers (Table S1). The results of qRT-PCR were significantly consistent with the FPKM value of the transcriptome data, which demonstrated the reliability of the RNA-seq data (Figure 4).
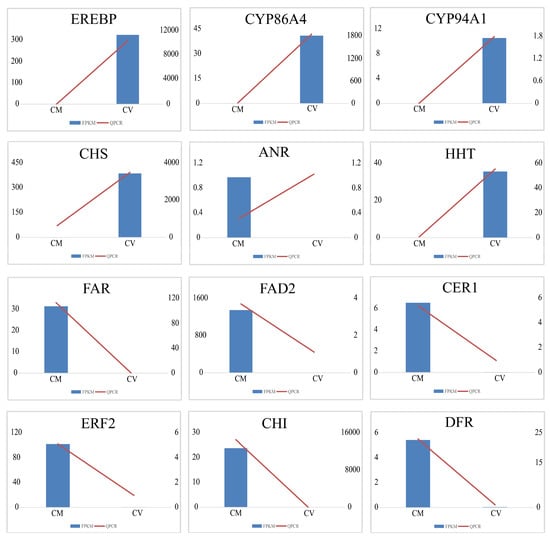
Figure 4.
Relative expression levels of 12 DEGs in C. vestitum and C. mongolicum by qRT-PCR. Bars were shown as means ± SD of three replicates. All values were shown with the Y axis being the relative expression level of DEGs with log2 (fold change), the X-axis being species, M representing C. mongolicum, and V representing C. vestitum. The blue column shows the results of FPKM of the transcriptome, and the red line shows the results of qRT-PCR.
3.6. DEGs Involved in Flavonoid Biosynthesis
Flavonoids are the major secondary metabolites that contribute to plant development, color, and biotic and abiotic stress resistance in plants [31,32,33,34,35]. In this study, a total of 25 DEGs encoding 8 enzymes were assigned to the flavonoid biosynthetic pathway based on a KEGG pathway enrichment analysis. Compared with C. mongolicum, 18 DEGs, including the genes encoding chalcone synthase (CHS), chalcone-flavonone isomerase (CHI), flavonoid 3’-monooxygenase (CYP75B1), and flavone synthase (CYP93B2), were significantly upregulated in C. vestitum. while naringenin 3-dioxygenase (F3H), dihydroflavonol 4-reductase (DFR), and flavonol synthase (FLS) were significantly upregulated in C. mongolicum (Figure 5, Table S2), which is consistent with the result of Duan et al. [36] that flavonoids were highly accumulated in the leaves of C. mongolicum by metabolism analysis. Flavonoid biosynthesis-associated genes have shown a differential expression pattern in other Chrysanthemum species in previous studies [37]. These results suggested the diversity of flavonoids in Chrysanthemum and that flavonoids might play an important role in the Chrysanthemum species’ ability to adapt to different environmental conditions.
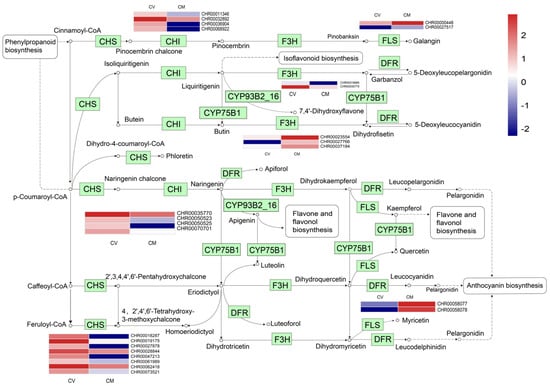
Figure 5.
Expression patterns of genes involved in the flavonoid biosynthesis pathway. The expression levels of DEGs in the heatmap obtained with Log2FC. Red represents up−regulated genes, and blue represents down−regulated genes. One the left was C. vestitum and on the right was C. mongolicum in heat map. KEGG Pathway was derived from https://www.kegg.jp/kegg/kegg1.html (accessed on 25 April 2023).
3.7. Candidate Genes Involved in Terpenoid Biosynthesis
Terpenoids are the most structurally and quantitatively abundant compounds produced by plants [38], which are the major compounds of aromatics and play an important role in plant defense against environmental stresses [39]. In the present study, the up-regulated DEGs related to “Monoterpenoid biosynthesis” were significantly enriched in C. vestitum compared to C. mongolicum. All of the DEGs assigned to encoding salutaridine reductase (SalR), neomenthol dehydrogenase (NDS), and 10-hydroxygeraniol dehydrogenase (10HGO), which were key genes related to monoterpene biosynthetic, were upregulated in C. vestitum (Table S3). Trichomes have been reported to be able to synthesize and accumulate terpene compounds [40,41,42]. The highly expressed genes related to monoterpene biosynthesis were consistent with the densely covered trichomes in the leaves of C. vestitum, suggesting large amounts of bioactive monoterpenes in its leaves. The DEGs related to terpenoid biosynthesis have been reported to be higher expressed in C. indicum var. aromaticum than in C. nankingense and C. indicum [37]. These results indicated that terpenoid content varies in Chrysanthemum species and that C. mongolicum might be a potential resource for the aromatic improvement of chrysanthemums.
3.8. Candidate Genes Involved in Starch and Sucrose Metabolism Pathway
Starch and sucrose metabolism provide fuel for plant growth and development [43,44]. The accumulation of soluble sugars is also an important stress signal for plants [45,46]. Here, the starch and sucrose metabolism pathways were significantly enriched, and 114 DEGs involved in these pathways were detected (Table S4), of which 61 DEGs, including the genes encoding granule-bound starch synthase I (WAXY), starch synthase (glgA), glucose-1-phosphate adenylyltransferase (glgC), Amylose (AMY), amylomaltase (malQ), and sucrose synthase (SUS), were upregulated in C. vestitum, while 58 were up-regulated in C. mongolicum, including the genes encoding trehalose-6-phosphate synthase (TPS), Sucrose Phosphatase (SPP), Trehalase (TREH), etc. The results indicated that the two species contain abundant but different soluble sugars that help them adapt to the harsh environment.
3.9. Biosynthesis of Unsaturated Fatty Acids
Unsaturated fatty acids (UFAs) as membrane ingredients and carbon and energy resources in triacylglycerols (TAGs) are indispensable compounds for higher organisms [47,48]. In addition, C18 UFAs function as antioxidants and barrier constituents and play crucial roles in plant defense against both abiotic and biotic stresses [49,50]. Fatty acid desaturase-2 (FAD2) is a key gene converting oleic acid (18:1) to linoleic acid (18:2) [51,52]. In our study, the biosynthesis of the unsaturated fatty acids pathway was significantly enriched, and 38 DEGs were detected, of which 32 DEGs encoding fatty acid desaturase-related genes were upregulated in C. mongolicum (Table S5), suggesting unsaturated fatty acids may be responsible for the resistance to abiotic stress in this species.
3.10. Candidate Genes Involved in ABC Transporters
The ATP-binding cassette (ABC) transporters, which served as exporters and importers, are involved in regulating plant development, nutrient uptake, osmotic homeostasis maintenance, pathogen resistance, metal tolerance, etc. [53,54,55]. The ABC transporter pathway was significantly enriched, and 111 DEGs were identified in our study, of which 70 DEGs were up-regulated in C. vestitum, including PDR5, ABCA, ABCB, ABCC, and ABCG (Table S6). The ABCG proteins have been suggested as candidates for heavy metal transporters, e.g., cadmium, lead, etc. [56,57], suggesting C. vestitum might be a potential plant for restoration of heavy metal-contamination.
3.11. DEGs Involved in Plant-Pathogen Interaction
A multi-layered innate immune system has been constructed in higher-land plants to reject or attenuate pathogen infection. PAMP-triggered immunity (PTI) and effector-triggered immunity (ETI) are two major innate immune systems in response to pathogen stress [58]. They can induce transcriptional reprogramming of different sets of defense-related genes to confer resistance. Calcium signaling has been reported to respond to various biotic and abiotic stresses in plants [59]. In the present study, 102 DEGs involved in the plant-pathogen interaction pathway were identified (Table S7). Thirty-nine DEGs, including PTI6, PTI1, and WRKY, showed higher expression in C. vestitum than in C. mongolicum, while 63 DEGs, including 22 genes encoding a calcium-binding protein (CML), 2 genes encoding cyclic nucleotide gated channel (CNGC), 18 DEGs encoding calcium-dependent protein kinase (CPK), two RPS2, and SGT1, were significantly upregulated in C. mongolicum. These results indicated that the PTI reaction and calcium channel played important roles in the plant-pathogen interactions of C. vestitum and C. mongolicum, respectively.
3.12. DEGs Involved in Phenylpropanoid Biosynthesis
Phenylpropane compounds are widely distributed in plants. They play an important role in plant development, flower pigments, and helping plants defend against various environmental stresses [34,60]. In the present study, 104 DEGs involved in the Phenylpropanoid biosynthesis pathway were detected (Figure 6; Table S8) between C. vestitum and C. mongolicum. Most of the DEGs (64) in the phenylpropanoid biosynthesis pathway were up-regulated in C. mongolicum, including the genes encoding cinnamyl-alcohol dehydrogenase (CAD), caffeoyl-CoA O-methyltransferase (CCOMT), Peroxidase (PER), shikimate O-hydroxycinnamoyl-transferase (HST), coniferyl-aldehyde dehydrogenase (REF), coniferyl-alcohol glucosyltransferase (UGT72E), ferulate-5-hydroxylase (CYP84A), caffeoyl shikimateesterase (CSE), and cinnamyl-alcohol dehydrogenase that related to ligin biosynthesis (Table S8). Lignin has important roles in plant resistance against various biotic and abiotic stresses [61]. This result indicated that high lignification occurred in the leaves of C. mongolicum to adapt to the adverse environmental conditions, which agrees with the appearance that the leaves at the branch bottom were withered and shrunk in this species.
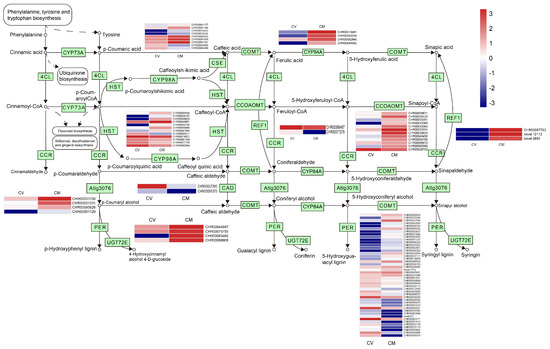
Figure 6.
Phenylpropanoid biosynthesis pathway and expression of DEGs involved. The expression levels of DEGs in the heatmap obtained using Log2FC are red for up−regulated and blue for down−regulated. On the left was C. vestitum and on the right was C. mongolicum in heat map. KEGG Pathway was derived from https://www.kegg.jp/kegg/kegg1.html (accessed on 1 May 2023).
3.13. Transcription Factors Analysis of C. vestitum and C. mongolicum
Transcription factors (TFs) play a crucial role in regulating plant development and environmental stress responses [62]. Numerous stress-related TFs have been identified in various plants. In this study, 802 differentially expressed TFs belonging to 78 TF families were identified. AP2/ERF is the most predominant category with 63 members identified, followed by MYB (57), bHLH (49), NAC (47), C2H2 (43), and WRKY (35) (Table S9). AP2/ERF, MYB, NAC, bHLH, and WRKY are notable TFs involved in the regulation of responses to abiotic stress in plants [63,64,65,66,67]. The special function of these TFs in these two species need to be further investigated with a functional genomics approach.
4. Conclusions
In the present study, the leaf transcriptomes of the two wild Chrysanthemum species were compared, and a large number of genomic resources for chrysanthemums were obtained. A distinctly differentiated gene expression pattern was found between C. vestitum and C. mongolicum, and the differences and complexities of secondary metabolic biosynthesis were discovered in the two Chrysanthemum species. The DEGs associated with “ABC transporters”, “Flavonoid biosynthesis” and “Monoterpenoid biosynthesis” might play a crucial role in adaption to environmental stresses for C. vestitum, while the genes related to “Biosynthesis of unsaturated fatty acids”, “Proteasome”, “Phenylpropanoid biosynthesis”, “Oxidative phosphorylation”, “Plant-pathogen interaction”, “Starch and sucrose metabolism”, “Glutathione metabolism”, as well as “MAPK signaling pathway” might be responsible for adaption of the adverse condition in C. mongolicum. Thus, C. mongolicum and C. vestitum have different stress resistance and positive adaptation mechanisms. The large EST sequences generated in this study help us better understand the genetic characteristics and resistance mechanisms of wild chrysanthemum plants. However, identifying conserved and divergent genes involved in ecological adaptation will be helpful to understand the evolutionary processes underlying the adaptation of C. vestitum and C. mongolicum. Moreover, with the increasing demand for chrysanthemums, there is an urgent need to develop attractive new varieties with extensive resistance to different environmental stresses. The key candidate genes involved in various pathways that respond to stress found here need to be further explored by transgenic or gene-editing techniques, which will accelerate the genetic improvement of cultivated chrysanthemums.
Supplementary Materials
The following supporting information can be downloaded at: https://www.mdpi.com/article/10.3390/horticulturae9080868/s1. Table S1: Primers of differential expressed genes used for qRT-PCR; Table S2: Genes involved in Flavonoid biosynthesis; Table S3: Genes involved in terpenoid biosynthesis; Table S4: DEGs related to starch and sucrose metabolism pathway; Table S5: Biosynthesis of unsaturated fatty acids; Table S6: Genes involved in ABC transporters; Table S7: DEGs involved in plant-pathogen interaction; Table S8: DEGs involved in phenylpropanoid biosynthesis; Table S9: DEGs encoding transcription factors analysis between C. vestitum and C. mongolicum; Figure S1: Venn diagram of special and common transcripts between C. vestitum and C. mongolicum. CV: C. vestitum; CM: C. mongolicum; Figure S2: KEGG enrichment analysis of top 20 differentially expressed genes between C. vestitum and C. mongolicum. A represents the enriched pathways of up-regulated genes and B is the enriched pathways of down-regulated genes. The dot size means the number of DEGs in a related pathway. The rich factor represents the ratio of the DEG numbers assigned to a certain pathway to all gene numbers annotated in this pathway.
Author Contributions
Y.M. (Yueping Ma) collected the plants and designed the experiments; Y.M. (Yuan Meng) and J.L. performed the experiments and analyzed the data: Y.M. (Yuan Meng); Y.M. (Yueping Ma) and Y.M. (Yuan Meng) wrote the paper. All authors have read and agreed to the published version of the manuscript.
Funding
This work was funded by the National Natural Science Foundation of China (No. 31872710) and the Construction Project of Liaoning Provincial Key Laboratory, China (2022JH13/10200026).
Data Availability Statement
The data that support the findings of this study are openly available in the GenBank of NCBI at https://www.ncbi.nlm.nih.gov/. The accession numbers can be found in the article.
Conflicts of Interest
There are no conflicts of interest exist in the submission of this manuscript.
References
- Shih, Z.; Christopher, J.H.; Michael, G.G. Chrysanthemum. In Flora of China; Wu, Z.Y., Raven, P.H., Hong, D.Y., Eds.; Science Press: Beijing, China; Missouri Botanical Garden Press: St. Louis, MO, USA, 2011; Volume 20, pp. 669–676. [Google Scholar]
- Li, J.; Wan, Q.; Guo, Y.P.; Abbott, R.J.; Rao, G.Y. Should I stay or should I go: Biogeographic and evolutionary history of a polyploid complex (Chrysanthemum indicum complex) in response to Pleistocene climate change in China. New Phytol. 2014, 201, 1031–1044. [Google Scholar] [CrossRef] [PubMed]
- Su, J.S.; Jiang, J.F.; Zhang, F.; Liu, Y.; Ding, L.; Chen, S.M.; Chen, F.D. Current achievements and future prospects in the genetic breeding of chrysanthemum: A review. Hortic. Res. 2019, 6, 109. [Google Scholar] [CrossRef] [PubMed]
- Ma, Y.P.; Chen, M.M.; Wei, J.X.; Zhao, L.; Liu, P.L.; Dai, S.L.; Wen, J. Origin of Chrysanthemum cultivars—Evidence from nuclear low-copy LFY gene sequences. Biochem. Syst. Ecol. 2016, 65, 129–136. [Google Scholar] [CrossRef]
- Ma, Y.P.; Zhao, L.; Zhang, W.J.; Zhang, Y.H.; Xing, X.; Duan, X.X.; Hu, J.; Harris, A.J.; Liu, P.L.; Dai, S.L.; et al. Origins of cultivars of Chrysanthemum—Evidence from the chloroplast genome and nuclear LFY gene. J. Syst. Evol. 2020, 58, 925–944. [Google Scholar] [CrossRef]
- Song, C.; Liu, Y.F.; Song, A.P.; Dong, G.Q.; Zhao, H.B.; Sun, W.; Ramakrishnan, S.; Wang, Y.; Wang, S.B.; Li, T.Z.; et al. The Chrysanthemum nankingense genome providesinsights into the evolution and diversification of Chrysanthemum flowers and medicinal traits. Mol. Plant 2018, 11, 1482–1491. [Google Scholar] [CrossRef]
- Zhang, W.J.; Xu, H.Y.; Duan, X.X.; Hu, J.; Li, J.J.; Zhao, L.; Ma, Y.P. Characterizing the leaf transcriptome of Chrysanthemum rhombifolium (Ling et C. Shih), a drought resistant, endemic plant from China. Front. Genet. 2021, 12, 625985. [Google Scholar] [CrossRef]
- Wen, X.H.; Li, J.Z.; Wang, L.L.; Lu, C.F.; Gao, Q.; Xu, P.; Pu, Y.; Zhang, Q.L.; Hong, Y.; Hong, L.; et al. The Chrysanthemum lavandulifolium genome and the molecular mechanism underlying diverse capitulum types. Hortic. Res. 2022, 9, uhab022. [Google Scholar] [CrossRef]
- Zhao, H.E.; Liu, Z.H.; Hu, X.; Yin, J.L.; Li, W.; Rao, G.Y.; Zhang, X.H.; Huang, C.L.; Anderson, N.; Zhang, Q.X.; et al. Chrysanthemum genetic resources and related genera of Chrysanthemum collected in China. Genet. Resour. Crop Evol. 2009, 56, 937–946. [Google Scholar] [CrossRef]
- Zhao, H.B.; Chen, F.D.; Chen, S.M.; Wu, G.S.; Guo, W.M. Molecular phylogeny of Chrysanthemum, Ajania and its allies (Anthemideae, Asteraceae) as inferred from nuclear ribosomal ITS and chloroplast trnL-F IGS sequences. Plant Syst. Evol. 2010, 284, 153–169. [Google Scholar] [CrossRef]
- Li, J.; Wan, Q.; Abbott, R.J.; Rao, G.Y. Geographical distribution of cytotypes in the Chrysanthemum indicum complex as evidenced by ploidy level and genome-size variation. J. Syst. Evol. 2013, 51, 196–204. [Google Scholar] [CrossRef]
- Parkinson, J.; Blaxter, M. Expressed sequence tags: An overview. Methods Mol. Biol. 2009, 533, 1–12. [Google Scholar]
- Wang, Z.; Gerstein, M.; Snyder, M. RNA-Seq: A revolutionary tool for transcriptomics. Nat. Rev. Genet. 2009, 10, 57–63. [Google Scholar] [CrossRef]
- Wu, Q.J.; Chen, Z.D.; Sun, W.J.; Deng, T.T.; Chen, M.J. De novo sequencing of the leaf transcriptome reveals complex light-responsive regulatory networks in Camellia sinensis cv. baijiguan. Front. Plant Sci. 2016, 7, 332. [Google Scholar] [CrossRef] [PubMed]
- Li, B.; Dewey, C.N. RSEM: Accurate transcript quantification from RNA-Seq data with or without a reference genome. BMC Bioinform. 2011, 12, 323. [Google Scholar] [CrossRef] [PubMed]
- Kashif, M.; Sang, Y.M.; Mo, S.M.; Rehman, S.U.; Khan, S.; Khan, M.R.; He, S.; Jiang, C.J. Deciphering the biodesulfurization pathway employing marine mangrove Bacillus aryabhattai strain NM1-A2 according to whole genome sequencing and transcriptome analyses. Genomics 2023, 115, 110635. [Google Scholar] [CrossRef] [PubMed]
- Liaquat, F.; Munis, M.F.H.; Arif, S.; Haroon, U.; Shi, J.; Saqib, S.; Zaman, W.; Che, S.; Liu, Q. PacBio single-molecule long-read sequencing reveals genes tolerating manganese stress in Schima superba saplings. Front. Genet. 2021, 12, 635043. [Google Scholar] [CrossRef]
- Usma, A.; Ahmad, M.; Zafar, M.; Sultana, S.; Ullah, F.; Saqib, S.; Ayaz, A.; Zaman, W. Palynological study of weed flora from Potohar plateau. Agronomy 2022, 12, 2500. [Google Scholar] [CrossRef]
- Anders, S.; Pyl, P.T.; Huber, W. HTSeq—A Python framework to work with high-throughput sequencing data. Bioinformatics 2015, 31, 166–169. [Google Scholar] [CrossRef]
- Wang, L.K.; Feng, Z.X.; Wang, X.; Wang, X.W.; Zhang, X.G. DEGseq: An R package for identifying differentially expressed genes from RNA-seq data. Bioinformatics 2010, 261, 136–138. [Google Scholar] [CrossRef]
- Young, M.D.; Wakefield, M.J.; Smyth, G.K.; Oshlack, A. Gene ontology analysis for RNA-seq: Accounting for selection bias. Genome Biol. 2010, 11, R14. [Google Scholar] [CrossRef]
- Mao, X.Z.; Cai, T.; Olyarchuk, J.G.; Wei, L.P. Automated genome annotation and pathway identification using the KEGG Orthology (KO) as a controlled vocabulary. Bioinformatics 2005, 21, 3787–3793. [Google Scholar] [CrossRef] [PubMed]
- Li, J.J.; Xu, H.Y.; Li, X.Y.; Wang, L.J.; Wang, X.; Liu, Y.Q.; Ma, Y.P. Molecular cloning and functional analysis of a Chrysanthemum vestitum GME homolog that enhances drought tolerance in transgenic tobacco. Sci. Rep. 2022, 12, 13551. [Google Scholar] [CrossRef]
- Xu, H.Y.; Li, J.J.; Wang, L.J.; Li, X.Y.; Liu, Y.Q.; Wang, X.; Gao, T.T.; Ma, Y.P. Integrated transcriptomic and metabolomics analysis reveals abscisic acid signal transduction and sugar metabolism pathways as defense responses to cold stress in Argyranthemum frutescens. Environ. Exp. Bot. 2023, 205, 105115. [Google Scholar] [CrossRef]
- Livak, K.J.; Schmittgen, T.D. Analysis of relative gene expression data using real-time quantitative PCR and the 2(-Delta Delta C(T)) Method. Methods 2001, 254, 402–408. [Google Scholar] [CrossRef] [PubMed]
- Světlíková, P.; Hájek, T.; Těšitel, J. Hydathode trichomes actively secreting water from leaves play a key role in the physiology and evolution of root-parasitic rhinanthoid Orobanchaceae. Ann. Bot. 2015, 116, 61–68. [Google Scholar] [CrossRef]
- Fich, E.A.; Fisher, J.; Zamir, D.; Rose, J.K.C. Transpiration from tomato fruit occurs primarily via trichome-associated transcuticular polar pores. Plant Physiol. 2020, 184, 1840–1852. [Google Scholar] [CrossRef] [PubMed]
- Fernández, V.; Sancho-Knapik, D.; Guzmán, P.; Peguero-Pina, J.J.; Gil, L.; Karabourniotis, G.; Khayet, M.; Fasseas, C.; Heredia-Guerrero, J.A.; Heredia, A.; et al. Wettability, polarity, and water absorption of Holm Oak leaves: Effect of leaf side and age. Plant Physiol. 2014, 166, 168–180. [Google Scholar] [CrossRef]
- Dhawan, S.S.; Shukla, P.; Gupta, P.; Lal, R.K. A cold-tolerant evergreen interspecific hybrid of Ocimum kilimandscharicum and Ocimum basilicum: Analyzing trichomes and molecular variations. Protoplasma 2016, 253, 845–855. [Google Scholar] [CrossRef]
- Lewandowska, M.; Keyl, A.; Feussner, I. Wax biosynthesis in response to danger: Its regulation upon abiotic and biotic stress. New Phytol. 2020, 227, 698–713. [Google Scholar] [CrossRef]
- Ahmad, H.M.; Wang, X.; Mahmood Ur, R.; Fiaz, S.; Azeem, F.; Shaheen, T. Morphological and physiological response of Helianthus annuus L. to drought stress and correlation of wax contents for drought tolerance traits. Arab. J. Sci. Eng. 2022, 47, 6747–6761. [Google Scholar] [CrossRef]
- Nichols, S.N.; Hofmann, R.W.; Williams, W.M. Physiological drought resistance and accumulation of leaf phenolics in white clover interspecific hybrids. Environ. Exp. Bot. 2015, 119, 40–47. [Google Scholar] [CrossRef]
- Murphy, K.M.; Zerbe, P. Specialized diterpenoid metabolism in monocot crops: Biosynthesis and chemical diversity. Phytochemistry 2020, 172, 112289. [Google Scholar] [CrossRef] [PubMed]
- Savoi, S.; Wong, D.C.J.; Arapitsas, P.; Miculan, M.; Bucchetti, B.; Peterlunger, E.; Fait, A.; Mattivi, F.; Castellarin, S.D. Transcriptome and metabolite profiling reveals that prolonged drought modulates the phenylpropanoid and terpenoid pathway in white grapes (Vitis vinifera L.). BMC Plant Biol. 2016, 16, 67. [Google Scholar] [CrossRef] [PubMed]
- Yang, S.; Bai, M.D.; Hao, G.W.; Guo, H.P.; Fu, B.C. Transcriptomics analysis of field-droughted pear (Pyrus spp.) reveals potential drought stress genes and metabolic pathways. PeerJ 2022, 10, e12921. [Google Scholar] [CrossRef]
- Duan, X.X.; Zhang, W.J.; Li, J.J.; Xu, H.Y.; Hu, J.; Zhao, L.; Ma, Y.P. Comparative metabolomics analysis revealed biomarkers and distinct flavonoid biosynthesis regulation in Chrysanthemum mongolicum and C. rhombifolium. Phytochem. Anal. 2022, 33, 373–385. [Google Scholar] [CrossRef]
- Wang, X.; Zhang, J.J.; Liu, Z.G.; Wang, S.B.; Huang, B.S.; Liu, Y.F. Comparative transcriptome analysis of three chrysanthemums provides insights into flavonoid and terpenoid biosynthesis. J. Plant Biol. 2021, 64, 389–401. [Google Scholar] [CrossRef]
- Thirumurugan, D.; Cholarajan, A.; Raja, S.S.; Vijayakumar, R. An introductory chapter: Secondary metabolites. In Secondary Metabolites: Sources and Applications; IntechOpen: London, UK, 2018; pp. 1–21. [Google Scholar]
- Pichersky, E.; Raguso, R.A. Why do plants produce so many terpenoid compounds? New Phytol. 2018, 220, 692–702. [Google Scholar] [CrossRef] [PubMed]
- Sun, M.Y.; Zhang, Y.N.; Zhu, L.; Liu, N.N.; Bai, H.T.; Sun, G.F.; Zhang, J.Z.; Shi, L. Chromosome-level assembly and analysis of the Thymus genome provide insights into glandular secretory trichome formation and monoterpenoid biosynthesis in thyme. Plant Commun. 2022, 3, 100413. [Google Scholar] [CrossRef] [PubMed]
- Luu, V.T.; Weinhold, A.; Ullah, C.; Dressel, S.; Schoettner, M.; Gase, K.; Gaquerel, E.; Xu, S.; Baldwin, I.T. O-Acyl Sugars protect a wild tobacco from both native fungal pathogens and a specialist herbivore. Plant Physiol. 2017, 174, 370–386. [Google Scholar] [CrossRef] [PubMed]
- Champagne, A.; Boutry, M. Proteomics of terpenoid biosynthesis and secretion in trichomes of higher plant species. Biochim. Biophys. Acta BBA Proteins Proteom. 2016, 1864, 1039–1049. [Google Scholar] [CrossRef]
- Thalmann, M.; Santelia, D. Starch as a determinant of plant fitness under abiotic stress. New Phytol. 2017, 214, 943–951. [Google Scholar] [CrossRef]
- Vriet, C.; Edwards, A.; Smith, A.M.; Trevor, L.; Wang, T.L. Sucrose and Starch Metabolism. In The Lotus Japonicus Genome, Compendium of Plant Genomes; Satoshi, T., Jens, S., Eds.; Springer: Berlin/Heidelberg, Germany, 2014; pp. 97–115. [Google Scholar]
- Zheng, Z.F.; Xu, X.P.; Crosley, R.A.; Greenwalt, S.A.; Sun, Y.J.; Blakeslee, B.; Wang, L.Z.; Ni, W.T.; Sopko, M.S.; Yao, C.L.; et al. The protein kinase SnRK2.6 mediates the regulation of sucrose metabolism and plant growth in Arabidopsis. Plant Physiol. 2010, 153, 99–113. [Google Scholar] [CrossRef] [PubMed]
- Ma, Q.J.; Sun, M.H.; Lu, J.; Liu, Y.J.; Hu, D.G.; Hao, Y.J. Transcription factor AREB2 is involved in soluble sugar accumulation by activating sugar transporter and amylase Genes. Plant Physiol. 2017, 174, 2348–2362. [Google Scholar] [CrossRef]
- Kazaz, S.; Miray, R.; Lepiniec, L.; Baud, S. Plant monounsaturated fatty acids: Diversity, biosynthesis, functions and uses. Prog. Lipid Res. 2022, 85, 101138. [Google Scholar] [CrossRef]
- Guo, Q.; Li, T.; Qu, Y.; Liang, M.Z.; Ha, Y.M.; Zhang, Y.; Wang, Q. New research development on trans fatty acids in food: Biological effects, analytical methods, formation mechanism, and mitigating measures. Prog. Lipid Res. 2023, 89, 101199. [Google Scholar] [CrossRef] [PubMed]
- Lim, G.H.; Singhal, R.; Kachroo, A.; Kachroo, P. Fatty acid- and lipid-mediated signaling in plant defense. Annu. Rev. Phytopathol. 2017, 55, 505–536. [Google Scholar] [CrossRef] [PubMed]
- He, M.; He, C.Q.; Ding, N.Z. Abiotic stresses: General defenses of land plants and chances for engineering multistress tolerance. Front. Plant Sci. 2018, 9, 1771. [Google Scholar] [CrossRef]
- Zhang, J.; Liu, H.; Sun, J.; Li, B.; Zhu, Q.; Chen, S.; Zhang, H. Arabidopsis fatty acid desaturase FAD2 is required for salt tolerance during seed germination and early seedling growth. PLoS ONE 2012, 7, e30355. [Google Scholar] [CrossRef]
- He, M.; Qin, C.X.; Wang, X.; Ding, N.Z. Plant unsaturated fatty acids: Biosynthesis and regulation. Front. Plant Sci. 2020, 11, 562785. [Google Scholar] [CrossRef]
- Dahuja, A.; Kumar, R.R.; Sakhare, A.; Watts, A.; Singh, B.; Goswami, S.; Sachdev, A.; Praveen, S. Role of ATP-binding cassette transporters in maintaining plant homeostasis under abiotic and biotic stresses. Physiol. Plant 2021, 171, 785–801. [Google Scholar] [CrossRef] [PubMed]
- Zeng, Y.; Charkowski, A. The role of ATP-binding Cassette (ABC) transporters in Bacterial phytopathogenesis. Phytopathology 2020, 111, 600–610. [Google Scholar] [CrossRef] [PubMed]
- Malik, W.A.; Wang, X.G.; Wang, X.L.; Shu, N.; Cui, R.F.; Chen, X.G.; Wang, D.L.; Lu, X.K.; Yin, Z.J.; Wang, J.J.; et al. Genome-wide expression analysis suggests glutaredoxin genes response to various stresses in cotton. Int. J. Biol. Macromol. 2020, 153, 470–491. [Google Scholar] [CrossRef] [PubMed]
- Lee, M.; Lee, K.; Lee, J.; Noh, E.W.; Lee, Y. AtPDR12 contributes to lead resistance in Arabidopsis. Plant Physiol. 2005, 138, 827–836. [Google Scholar] [CrossRef] [PubMed]
- Kim, D.Y.; Bovet, L.; Maeshima, M.; Martinoia, E.; Lee, Y. The ABC transporter AtPDR8 is a cadmium extrusion pump conferring heavy metal resistance. Plant J. 2007, 50, 207–218. [Google Scholar] [CrossRef] [PubMed]
- Nie, X.H.; Zhao, S.Q.; Hao, Y.Q.; Gu, S.; Zhang, Y.; Qi, B.X.; Xing, Y.; Qin, L. Transcriptome analysis reveals key genes involved in the resistance to Cryphonectria parasitica during early disease development in Chinese chestnut. BMC Plant Biol. 2023, 23, 79. [Google Scholar] [CrossRef] [PubMed]
- Ranty, B.; Aldon, D.; Cotelle, V.; Galaud, J.P.; Thuleau, P.; Mazars, C. Calcium sensors as key hubs in plant responses to biotic and abiotic stresses. Front. Plant Sci. 2016, 7, 327. [Google Scholar] [CrossRef]
- Shah, M.; Alharby, H.F.; Hakeem, K.R.; Ali, N.; Rahman, I.U.; Munawar, M.; Anwar, Y. De novo transcriptome analysis of Lantana camara L. revealed candidate genes involved in phenylpropanoid biosynthesis pathway. Sci. Rep. 2020, 10, 13726. [Google Scholar] [CrossRef]
- Chen, Y.F.; Yi, N.; Yao, S.B.; Zhuang, J.H.; Fu, Z.P.; Ma, J.; Yin, S.X.; Jiang, X.L.; Liu, Y.J.; Gao, L.P.; et al. CsHCT-mediated lignin synthesis pathway involved in the response of tea plants to biotic and abiotic stresses. J. Agric. Food Chem. 2021, 69, 10069–10081. [Google Scholar] [CrossRef]
- Aslam, M.; Fakher, B.; Ashraf, M.A.; Cheng, Y.; Wang, B.; Qin, Y. Plant low temperature stress: Signaling and response. Agronomy 2022, 12, 702. [Google Scholar] [CrossRef]
- Mizoi, J.; Shinozaki, K.; Yamaguchi-Shinozaki, K. AP2/ERF family transcription factors in plant abiotic stress responses. Biochim. Biophys. Acta 2012, 1819, 86–96. [Google Scholar] [CrossRef]
- Tweneboah, S.; Oh, S.K. Biological roles of NAC transcription factors in the regulation of biotic and abiotic stress responses in solanaceous crops. J. Plant Biotechnol. 2017, 44, 1–11. [Google Scholar] [CrossRef]
- Yao, P.F.; Sun, Z.X.; Li, C.L.; Zhao, X.R.; Li, M.F.; Deng, R.Y.; Huang, Y.J.; Zhao, H.X.; Chen, H.; Wu, Q. Overexpression of Fagopyrum tataricum FtbHLH2 enhances tolerance to cold stress in transgenic Arabidopsis. Plant Physiol. Biochem. 2018, 125, 85–94. [Google Scholar] [CrossRef] [PubMed]
- Feng, K.; Hou, X.L.; Xing, G.M.; Liu, J.X.; Duan, A.Q.; Xu, Z.S.; Li, M.Y.; Zhuang, J.; Xiong, A.S. Advances in AP2/ERF super-family transcription factors in plant. Crit. Rev. Biotechnol. 2020, 40, 750–776. [Google Scholar] [CrossRef] [PubMed]
- Wang, X.P.; Niu, Y.L.; Zheng, Y. Multiple functions of MYB transcription factors in abiotic stress responses. Int. J. Mol. Sci. 2021, 22, 6125. [Google Scholar] [CrossRef]


Disclaimer/Publisher’s Note: The statements, opinions and data contained in all publications are solely those of the individual author(s) and contributor(s) and not of MDPI and/or the editor(s). MDPI and/or the editor(s) disclaim responsibility for any injury to people or property resulting from any ideas, methods, instructions or products referred to in the content. |
© 2023 by the authors. Licensee MDPI, Basel, Switzerland. This article is an open access article distributed under the terms and conditions of the Creative Commons Attribution (CC BY) license (https://creativecommons.org/licenses/by/4.0/).