Article

Detection of Internal Browning Disorder in ‘Greensis’ Pears Using a Portable Non-Destructive Instrument

Pear Research Institute, National Institute of Horticultural & Herbal Science, Naju 58216, Republic of Korea
*
Author to whom correspondence should be addressed.
Horticulturae 2023, 9(8), 944; https://doi.org/10.3390/horticulturae9080944
Submission received: 15 July 2023 / Revised: 10 August 2023 / Accepted: 18 August 2023 / Published: 19 August 2023

Abstract

:
Internal browning caused by prolonged cold storage poses a significant challenge to the visual appearance and flavor of Asian pears, which are economically valuable and a primary fruit exported from Korea. To address this issue, we established a cost-effective portable non-destructive piece of testing instrument using visible and near-infrared spectroscopy, focusing on the detection and discrimination of internal browning in ‘Greensis’ pears. Our investigation underscores the challenge of visually confirming browning, necessitating alternative methods for accurate assessment. Through comprehensive analysis involving three to four segments of 32 ‘Greensis’ pears, a robust calibration equation was derived. By employing partial least square regression on the absorption spectra within a 650–950 nm range, we developed a predictive model for detecting and quantifying browning. Through principal component analysis, normal pears were distinctly segregated from those exhibiting browning symptoms (discrimination accuracy of 95%). Furthermore, we established that pears with a browning index of 25 ± 2.0 are highly susceptible to browning following extended cold storage. Consequently, our proposed portable non-destructive instrument serves as a pivotal tool for farmers and fruit distributors, enabling efficient and precise selection of high-quality pears in an instance. Overall, our study introduces a practical solution to a pressing issue in the Asian pear industry.

1. Introduction

Pears hold significant economical value as representatives of Korea. While the cultivation area of the Asian pear has decreased from its peak of 26,206 ha in 2000 to 9680 ha in 2022, the export volume has steadily increased from 15,677 tons in 2012 to 26,276 tons in 2022, making it the most exported fruit in Korea [1]. Among the Asian pear varieties in Korea, ‘Niitaka’ pears lead in exports because of their long-term storage properties and high commercial value; thus, they account for 80% of the total cultivation area for Asian pears in Korea. However, ‘Niitaka’ pears are a late-ripening cultivar with a late harvest season—from mid-October to early November—requiring considerable time before they can be exported [2,3]. Recently, the demand for early availability of high-quality Asian pears from Korean and foreign consumers has surged. In particular, Taiwan accounts for approximately 40% of the domestic exports of Asian pears; Taiwanese consumers plan to import high-quality pears by mid-September because they often gift Asian pears during the Mid-Autumn Festival.
Among the various Asian pear varieties, the ‘Greensis’ (Pyrus pyrifolia x Pyrus communis) cultivar is the most prominent variety. ‘Greensis’ is an interspecies hybrid resulting from a crossing between the ‘Whangkeumbae’ and ‘Bartlett’ cultivars. This cultivar is characterized by an average fruit weight of approximately 470 g, a sugar content of 12.4 °Bx, and a green peel with minimal russeting [4]. Notably, ‘Greensis’ exhibits resistance to pear scab, a damaging disease caused by the fungus Venturia nashicola, making it particularly suitable for organic cultivation. Consequently, producers, exporters, and distributors have expressed significant interest in boosting its production yield. Dedicated export networks for ‘Greensis’ pears have been established, facilitating exports to the United States, Hong Kong, and Vietnam. However, challenges arise from internal physiological defects, such as browning and water-soaked flesh, that become apparent during low-temperature post-harvest storage, consequently impacting profitability [5].
A prevalent consumer concern revolves around the phenomenon of internal browning in ‘Greensis’ and other Asian pears, as it profoundly affects the internal visual appearance, flavor, and texture of the fruit (yielding a spongy consistency). These apprehensions inevitably lead to economic losses. The occurrence of brown-to-dark-brown water-soaked areas within the core or flesh of Asian pears during cold storage is a common problem that is not exclusive to Korea but rather transcends to Taiwan, Japan, and China—countries renowned for their extensive cultivation of Asian pears [6,7,8,9,10,11,12].
Internal defects, such as browning or decay, are the prevalent issues encountered during the long-term storage or distribution of fruits such as pears. Nevertheless, fruits with internal physiological disorders are still sold in the market because of the inconspicuousness of the defects to the naked eye or to the current weight sorting method. These defects can only be detected by consumers after purchase, resulting in economic losses for producers, sellers, and consumers. Since not all fruits have internal defects, a non-destructive method that predicts internal browning should be developed. An inexpensive technology that accurately identifies these defects in fruits at the packaging or distribution stations after cold storage is required.
Several studies have been conducted to determine the quality and internal defects of agricultural products using non-destructive methods [13,14,15,16,17]. The non-destructive techniques utilize transmittance wavelengths ranging from 380 to 700 nm within the visible light spectrum and from 780 to 2500 nm within the near-infrared (NIR) spectrum to predict the internal characteristics of fruits, such as soluble solids concentration (SSC), acidity, and firmness [18,19]. Predictive models of internal fruit damage, especially in small fruits such as pears, apples, peaches, and oranges, are established with different data processing methods using transmittance spectral curves [20,21]. Mogollon et al. [22] referred to the 100–1100 nm semi-transmittance spectrum as early as 90 days after storage to predict the occurrence of internal browning in ‘Cripps Pink’ apples, which occurred approximately 150 days after low-temperature storage. Huang et al. [23] reported on nondestructive detection of internal defect in ‘Honeycrisp’ apples by using non-contact multichannel semi-transmittance mode for visible and near-infrared (Vis/NIR range of 550–1650 nm). They examined the effect of the orientation of three fruits on recognition and found that the model based on the average spectrum yielded better classification results. Kim et al. [24] developed principal component analysis (PCA) and partial least squares regression (PLSR) models using the NIR sorting system installed in a distribution center of agricultural products to detect internal damage in ‘Fuji’ apples. They distinguished healthy fruits from damaged fruits at the fruit sorting station with 91% accuracy using the wavelength range of 470–1150 nm. Furthermore, Vis–NIR spectroscopy was employed to detect brown cores in ‘Yali’ and ‘Xueqing’ pears (P. ussuriensis Maxim.) [25,26,27]. Cruz et al. [28] explored the possibility of predicting the presence of internal browning disorders in ‘Rocha’ pears (P. communis L.) using a single Vis–NIR spectroscopic measurement in semi-transmittance mode.
Most of the non-destructive methods described above require heavy machinery and are non-portable. In addition, these methods require a considerable time investment to yield results. To facilitate the screening of a large number of fruits for precise defect detection, developing a simple, inexpensive technology that accurately identifies the defects in fruits at the packaging or distribution stations after cold storage is crucial. Guided by these considerations, we developed a simple, rapid, inexpensive, time-saving, and portable non-destructive measurement instrument that utilizes Vis–NIR spectroscopy to predict the sugar content and occurrence of internal browning in pears. To our knowledge, no research has been published yet on the development of such a device. This study focuses on ‘Greensis’ pears, which were recently plagued by internal physiological disorders post-harvest. This study was conducted to develop a model that identifies the symptoms of post-harvest internal physiological disorders and distinguishes normal ‘Greensis’ pears from those with internal browning using a previously developed sugar meter reliant on Vis–NIR spectroscopy [29].

2. Materials and Methods

2.1. Plant Material and Treatment

The ‘Greensis’ pears used in this study were harvested at the optimal harvesting time on 15 September 2020 at the research orchard of the Pear Research Institute, National Institute of Horticultural and Herbal Science, Rural Development Administration in Naju, Jeollanam-do, Republic of Korea (35°01′27.70″ N, 126°44′53.50″ E, 6 m altitude). Ten pears were randomly selected and harvested per tree. A total of 80 pears (average weight: 460 g) with undamaged peels and flesh were collected and randomly assigned into four different groups, corresponding to the duration of cold storage. The 20 pears in each group were stored in the cold storage facility of the laboratory at 0.5 °C and 90% relative humidity for 0, 1, 3, or 6 months. The severity of the internal browning of fruit flesh (levels 0–4) was determined for the 20 pears in each storage period [11].

2.2. Designation of Browning Index Value

As it is impossible to distinguish normal pears from those with internal browning based on outer appearance, a sample (n = 32) consisting of normal pears prior to cold storage and those that developed pulp browning after 90 days of cold storage were utilized to formulate the calibration equation for internal browning. After obtaining the spectra of the sample pears, the samples were incised to visually inspect internal browning, and an index was assigned according to the degree of browning. The Browning index is predicated on the relative transmittance of light. If the transmittance value is 10, the transmittance due to browning is approximately 10. Conversely, an index of 100 indicates a light transmittance approximating 100. The browning index ranged from 0.0 to 100.0 and the samples with internal browning were assigned a browning index of 25.0 or lower, whereas the normal samples were assigned a browning index higher than 25.0. The samples with severe internal browning were assigned a browning index close to 0.0.

2.3. Spectrum Measurement

As the instrument may have different light penetration depths depending on the size and shape of the pears, the detection of partially formed browning or browning concentrated in the core (around the seeds) was limited. Therefore, the equatorial part of the fruit was divided and marked into three or four parts (sides A, B, C, and D); each part was scanned thrice (Figure 1).
Given that the temperature of the instrument or sample affects the spectrum of each wavelength band [30,31], and the laboratory temperature was maintained at 20 °C. The instrument and pear samples were stored in the laboratory until thermal equilibrium was reached.
The instrument (H-100F, Sunforest, Incheon, Republic of Korea) used in this study was a portable non-destructive sugar meter developed using Vis–NIR spectroscopy; it was employed in our previous study to determine the harvesting season of pears [29]. It consists of a compact spectrometer that detects the semi-transmittance spectrum of the light diffused from a fruit sample and a tungsten halogen lamp as the light source, and the wavelength range was 600–1100 nm (Table 1). The measured raw spectra were interpolated from 650 to 950 nm at 2 nm intervals using the instrument, and the absorbance spectra were calculated as Log (1/R), which is the logarithmic value of the reciprocal of the reflectance (R). R denotes the ratio of diffused and reflected light intensities measured from the standard reflector and the pear samples. After preprocessing the absorbance spectra obtained through the Savitzky–Golay smoothing (point 7) method, a calibration model that can determine internal browning in pears using the accumulated absorbance spectra was established.

2.4. Determination Model for Detecting Internal Browning Disorder in Pears

First, three to four parts per sample were scanned thrice (a total of 378 spectra) for calibration [31]. Afterward, the measured area was incised to determine the degree of browning, which corresponds to the browning index—a nominal scale. The browning index was utilized to devise a calibration equation for determining browning in pears; a browning index closer to 0 was assigned to pears with more severe browning, and a browning index closer to 100 was assigned to normal pears. The browning index was used as a variable for the PLSR analysis. PCA was performed by assigning “1” to samples with browning and “0” to samples without browning. Prediction accuracy was expressed as the standard error of calibration (SEC), and the results of full cross-validation were used for model verification.
For the predictive performance of the browning determination model, the standard error of prediction (SEP) and the correlation coefficient (r) were calculated using the following equation:
SEP = i = 1 n y i x i Bias 2 n 1
r = i = 1 n x i x ¯ y i y ¯ n 1 S x   S y
Bias = i = 1 n y i x i n
Browning   calibration = B o + a 1 x 1 + a 2 x 2 + a 3 x 3   a 3 x n
where n denotes the number of samples, y i denotes the prediction value, y ¯ denotes the mean of the prediction values, x i denotes the measurement value, x ¯ denotes the mean of the measurement values, and S x S y denotes the standard deviation of the prediction and measurement values. In the browning calibration equation, a1~an represents regression coefficients, and x1~xn represents wavelengths.

3. Results and Discussion

3.1. Effect of Storage Period on Internal Browning Disorder Incidence

Internal browning remained undetected among the ‘Greensis’ pear specimens upon harvest. However, internal browning began to emerge after 1 month of cold storage, intensifying until 3 months of cold storage. After that point, the progression of browning plateaued. This result indicates that physiological disorders causing internal browning in pears manifest within 1 month or 30 days, and that pears initially devoid of browning can be stored for an extended period without a significant increase in internal browning (Figure 2). These results were similar to the pattern of internal browning occurrence observed in ‘Taizhong No. 2′ pears [11]. Based on these findings, a model was developed to evaluate the occurrence and severity of internal browning in pears stored for 90 days. Figure 3 shows the degree of internal browning in ‘Greensis’ pears after 6 months of storage.

3.2. PCA Results

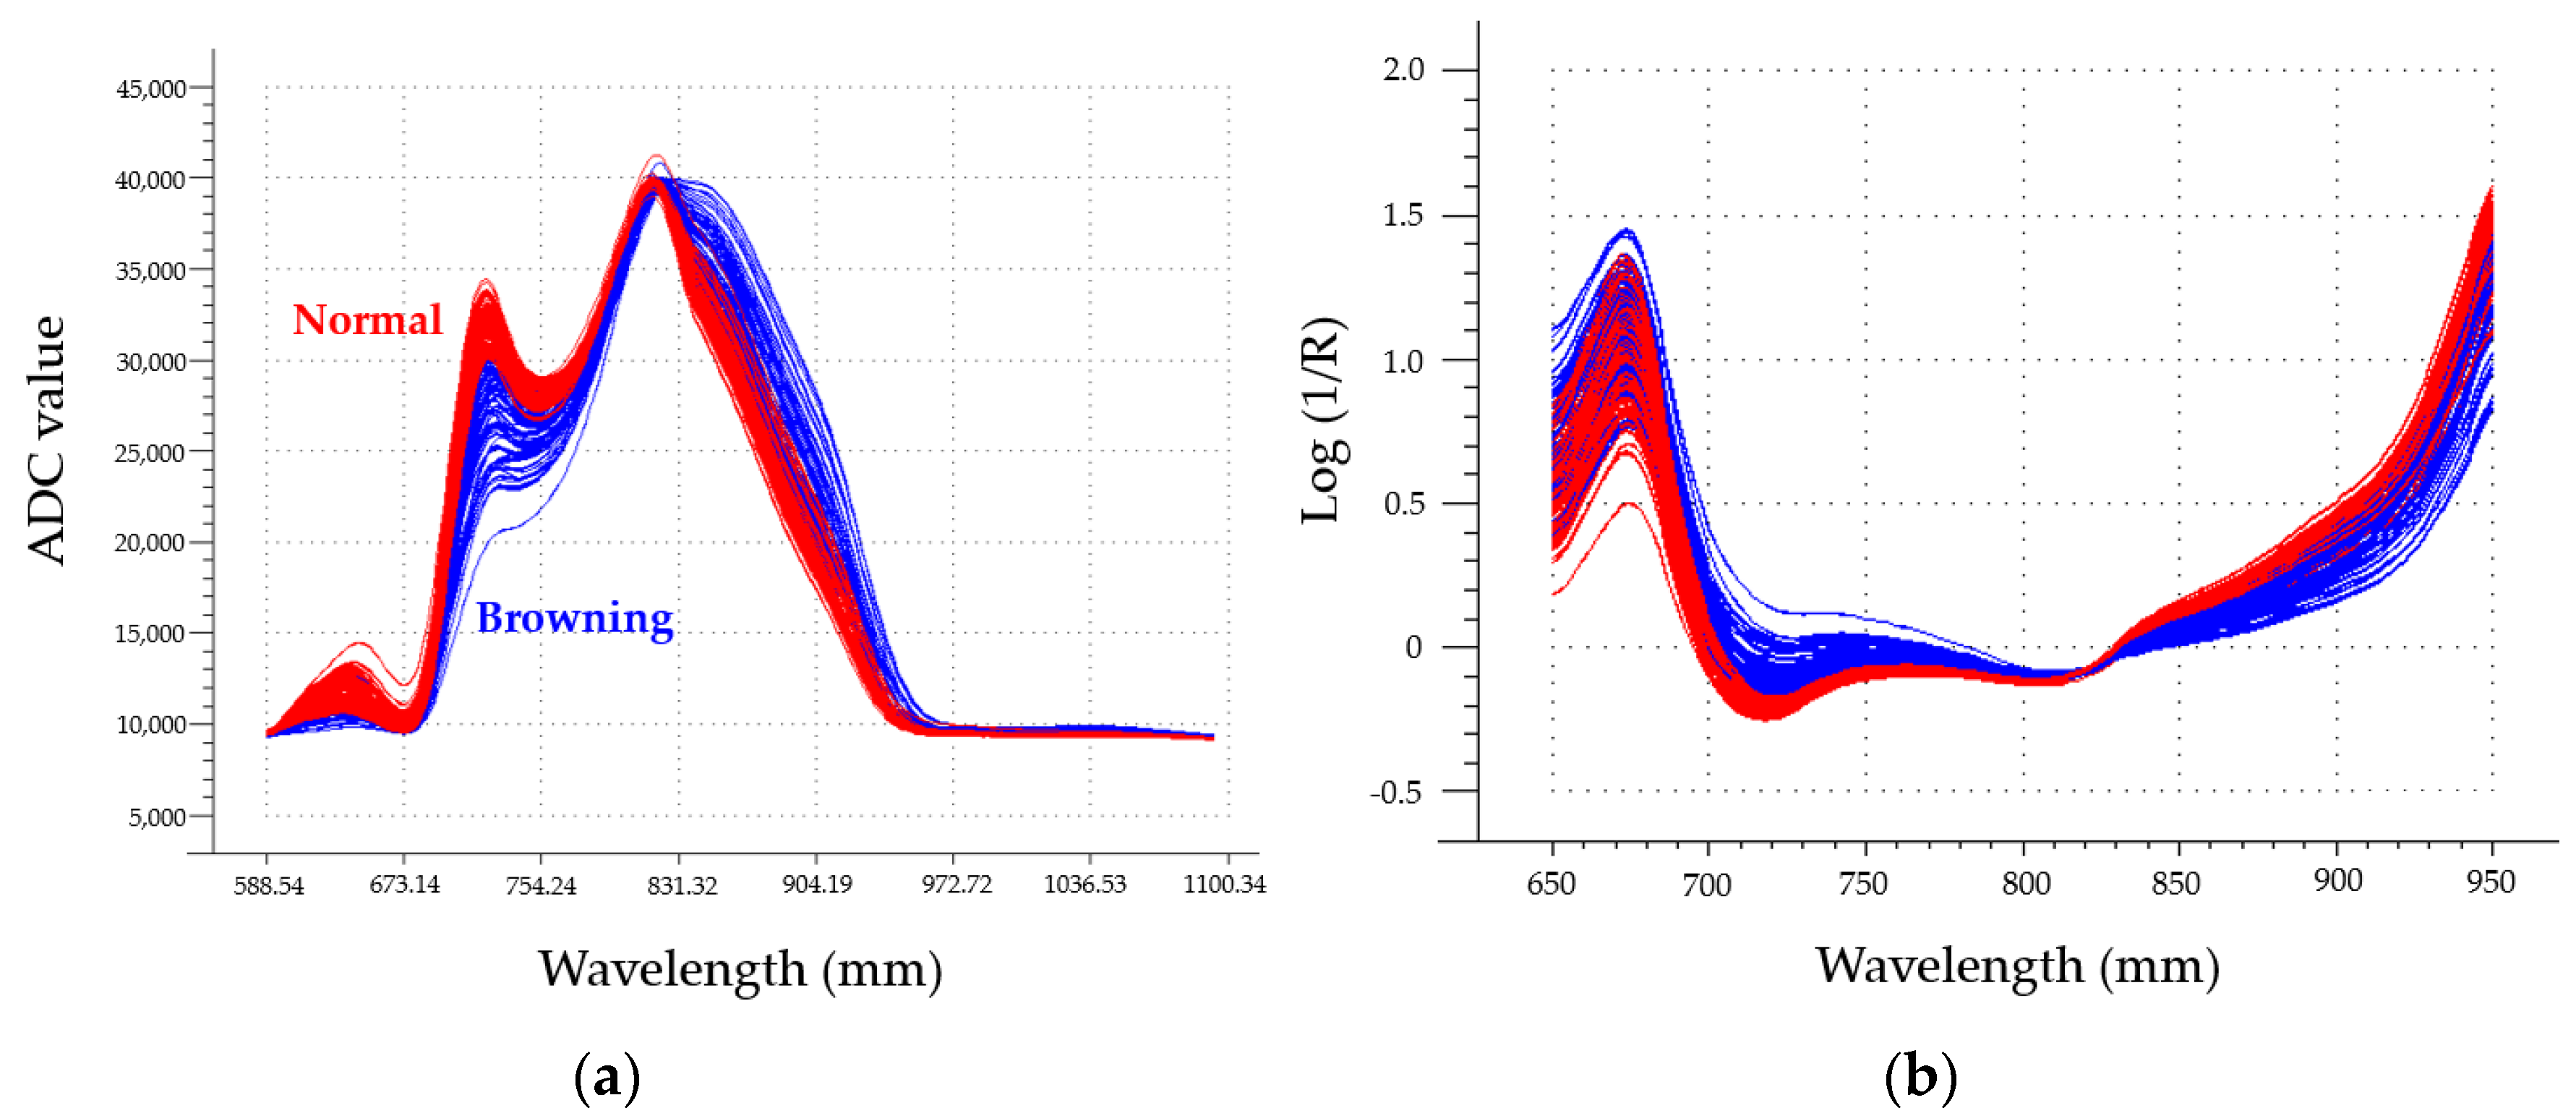
Figure 4 shows the raw and absorbance spectra measured for 32 pears. Raw spectra were obtained by electrically converting and quantifying the intensity of light diffused and reflected from the pears, and the analog-to-digital converter (ADC) value of the size of the electrical signal was displayed for each wavelength. The absorbance spectra were calculated as Log(1/R), which is the logarithmic value of the reciprocal of R. R denotes the ratio of diffused and reflected light intensities measured from the standard reflector and the pears. It is a method for analyzing materials with low light transmittance by measuring the diffuse reflection of light [29].
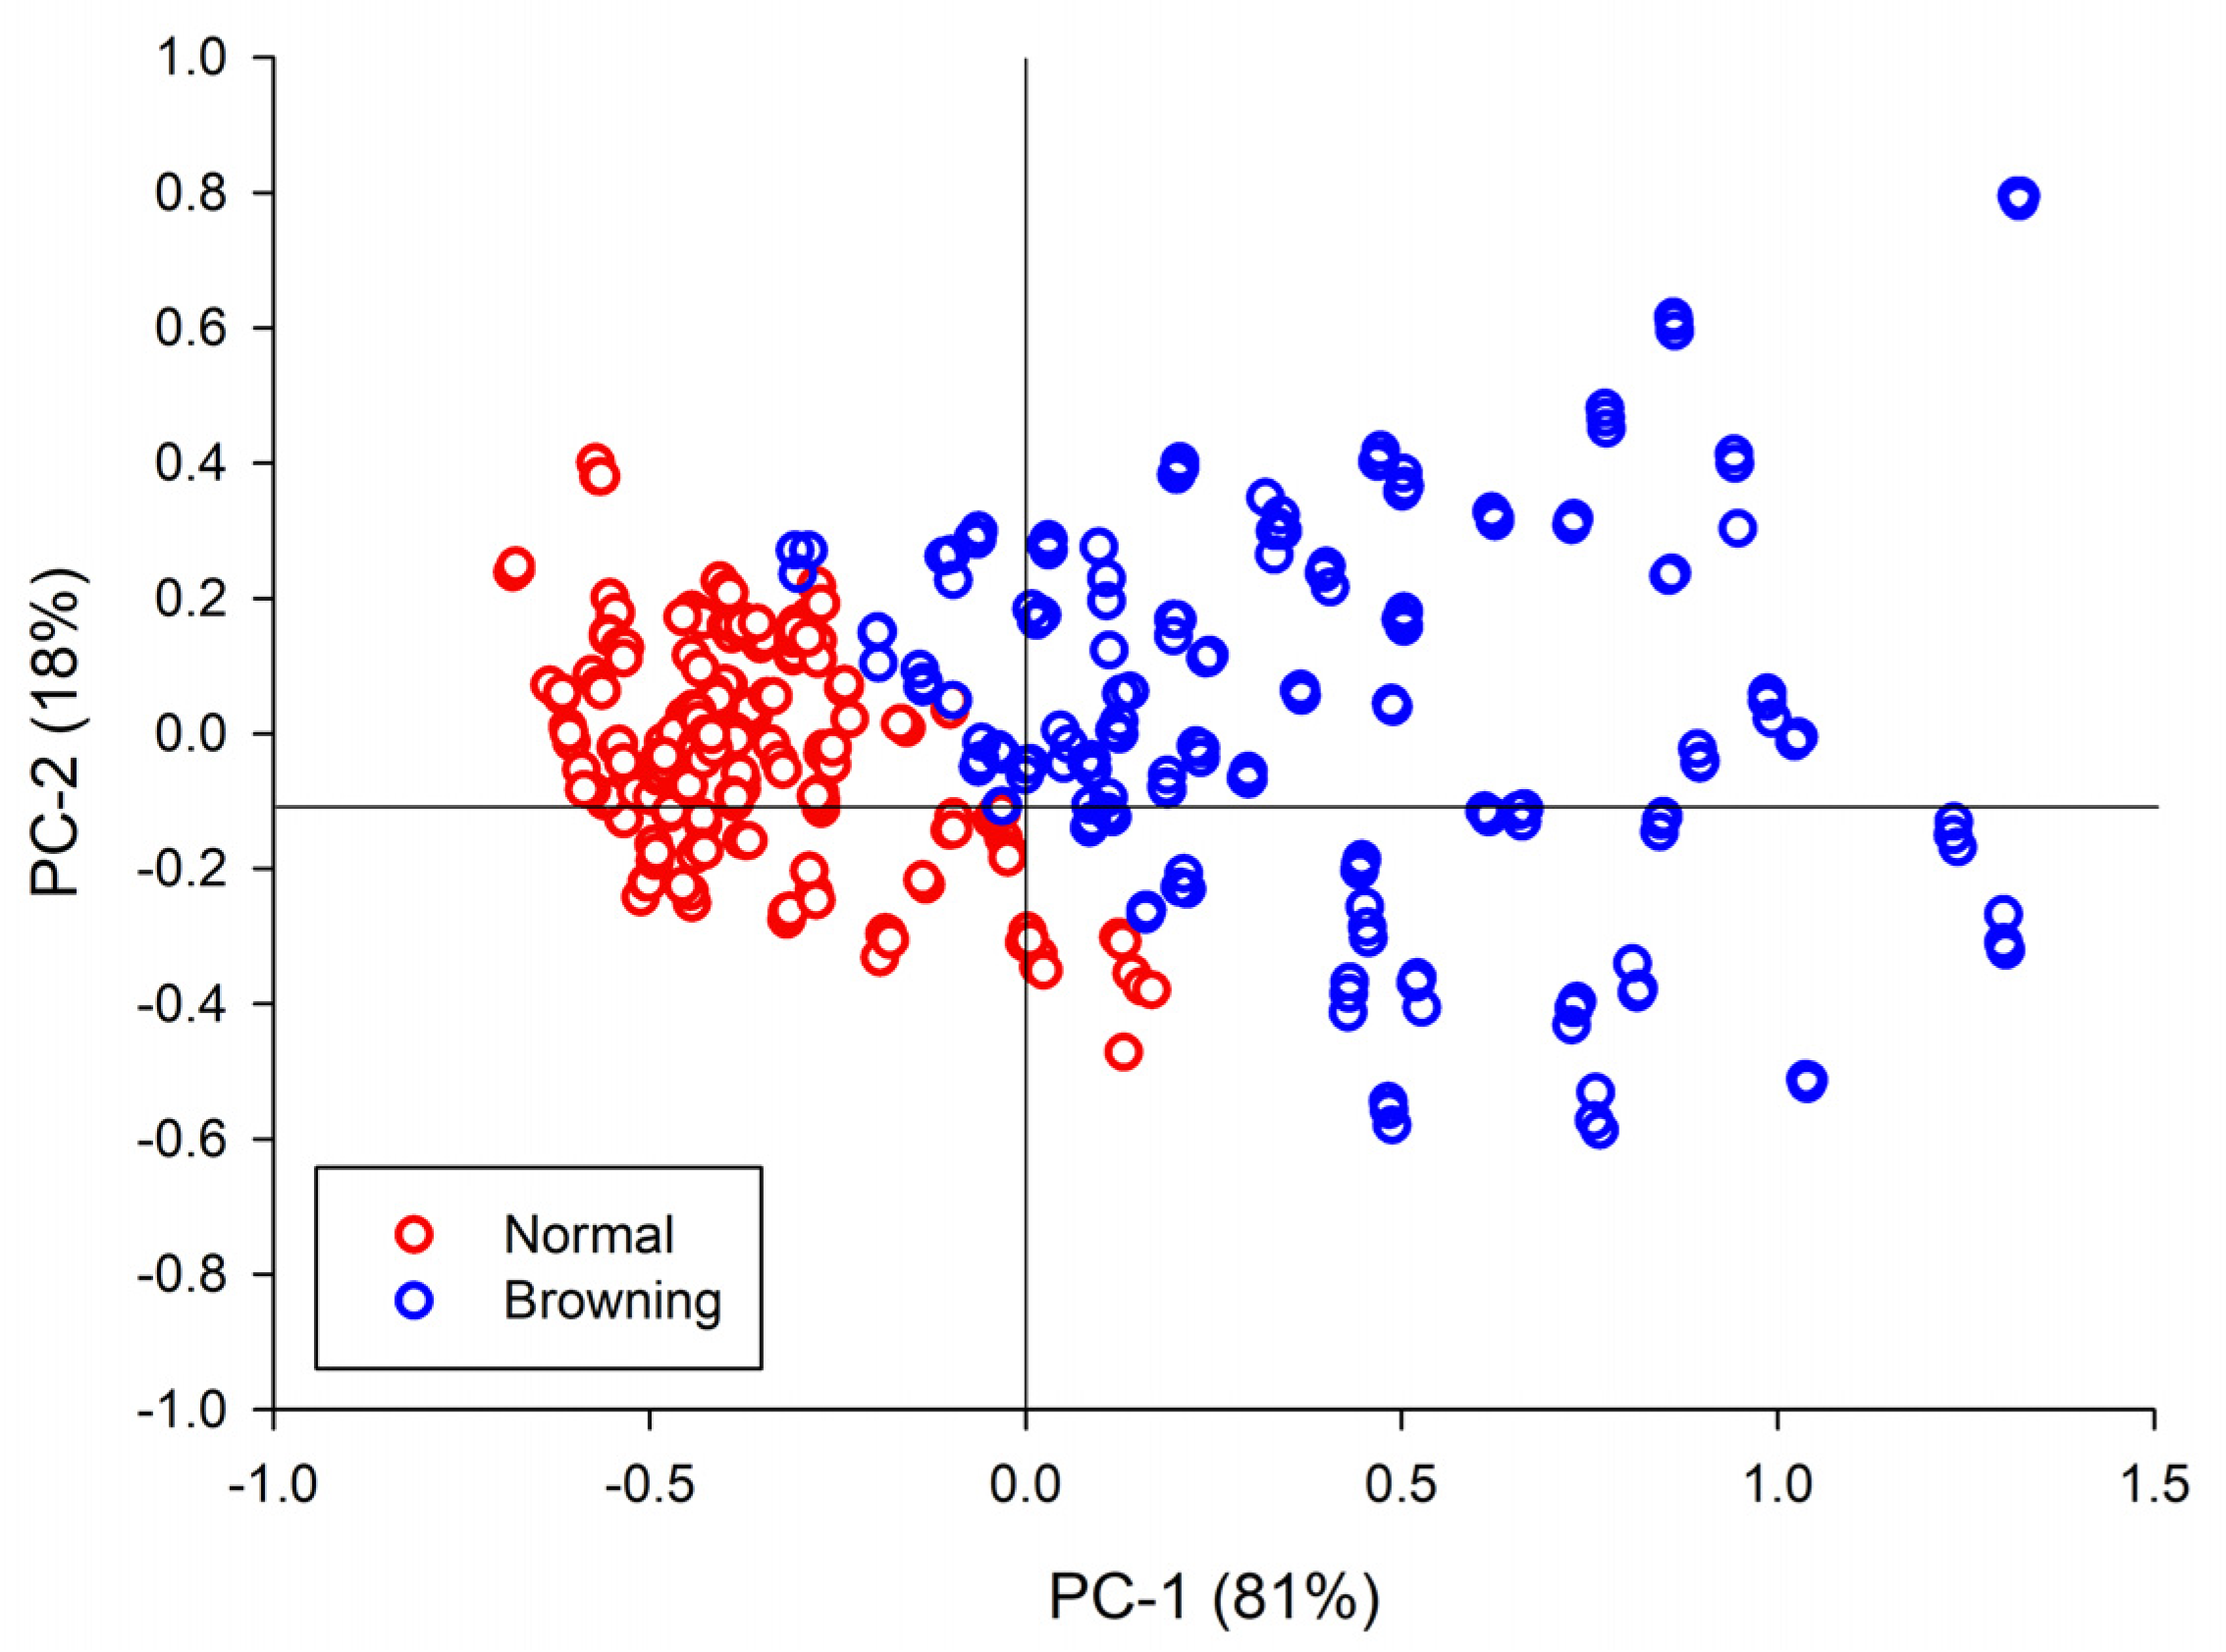
The spectra were characterized because the pears with severe browning absorbed more light (720–730 nm), whereas the normal pears absorbed less light (850–950 nm). Based on the characteristics of these spectra, the difference between the normal pears and those with browning can be predicted using the 650–950 nm wavelength. PCA was performed to identify the spectral characteristics; the axis located in the direction of the largest variance was set as principal component 1 (PC1), whereas the axis of the second largest variance was set as PC2. Through PCA, the axis located in the direction with the largest variance of the input data was set as PC1, and the vertical axis with the largest variance was set as the second principal component (PC2). PCA reveals latent structures and provides insights into how the measured variables engender similarities or differences among samples [32]. In this study, PCA was used to investigate the qualitative differences between the normal pears and those with internal browning. Typically, data within the new subspace defined by the principal components are amenable to interpretation [33]. Figure 5 shows a score plot from the PCA analysis. The relative distance between the two groups centered on the origin of the data was confirmed using PC1 and PC2. The pears near the browning boundary index of 25 ± 2.0—indicative of elusive detection of browning with the naked eye—were the samples with a high possibility of browning occurrence in the future.

3.3. PLSR Analysis

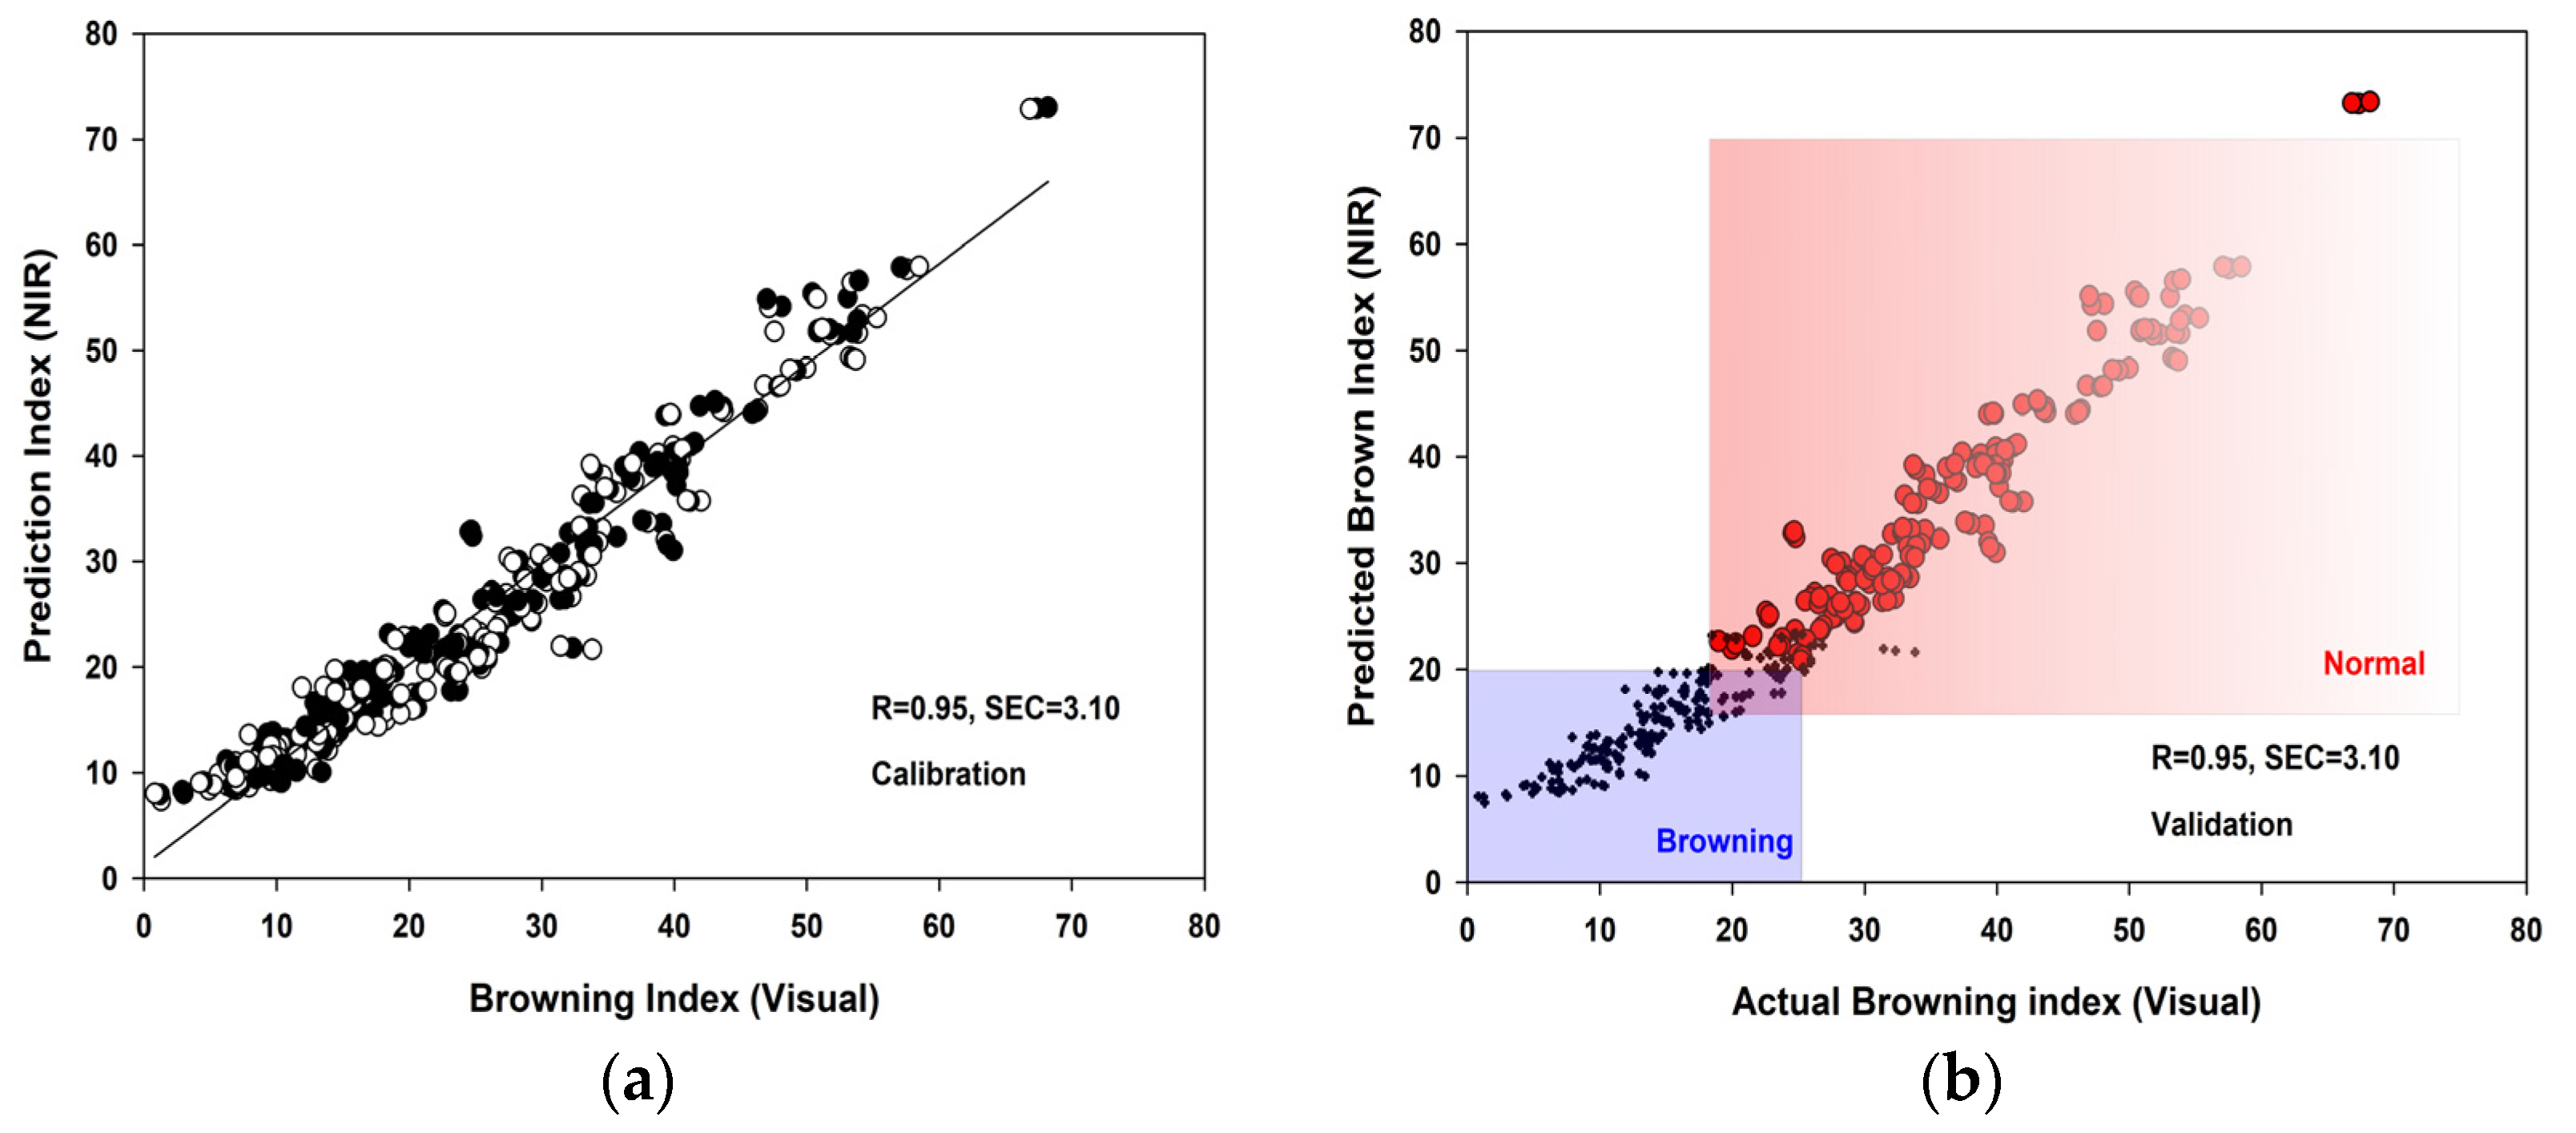
The PLSR model is a multivariate analysis method widely used in various fields; it orchestrates a synthesis of factor analysis on concentration data and spectral information obtained through spectroscopic analysis to obtain a more accurate model based on correlation and regression analyses [34]. Three preprocessing methods were selected for the absorption spectra obtained using ‘Greensis’ pears. Smoothing, standard normal variate (SNV), and second derivative_Savitzky–Golay derivatives were performed to compare the performance of browning models. Non-linear iterative partial least squares, a regression analysis algorithm, was used as the browning determination model, including the correlation between the absorption spectrum and the internal browning of the fruit observed visually by incising the measured equator. Figure 6 and Table 2 show the results obtained from the PLSR-constructed model, designed to determine the occurrence and extent of internal browning in ‘Greensis’ pears. The prediction accuracy of the browning determination model was expressed as slope, SEC, and R.
As a result of applying only smoothing (Point 7) to the raw and absorption spectra, the slope was 0.95, the R was 0.95, and the SEC was 3.10 for the browning determination model. The SNV had a slope of 0.92, an R of 0.92, and an SEC of 3.92. The second derivative_Savitzky–Golay derivatives exhibited a slope of 0.95, an R of 0.96, and an SEC of 2.64. The results were congruent with the predicted values of internal physiological disorders in ‘Niitaka’ pears in a study by Ryu et al. [35], where Vis–NIR spectroscopy with a wavelength of 500–700 nm was employed. Furthermore, Han et al. [26] distinguished between normal fruits and those with browning with 95.4% accuracy using a wavelength range of 651–1252 nm. Fu et al. [25] distinguished normal ‘Xueqing’ pears from those with browning with 91.2% accuracy using a wavelength range of 400–1028 nm. Sun et al. [27] used Vis–NIR transmission spectroscopy with a 600–904 nm wavelength range to determine the SSC and identify brown cores in pears; the results showed that the accuracy of Vis–NIR spectroscopy in classifying the brown cores of ‘Yali’ pears was 98.3% (R = 0.82).

4. Conclusions

This study was conducted to update our previously developed portable non-destructive sugar meter that leverages Vis–NIR spectroscopy and has a browning prediction function. Moreover, the accuracy of this instrument in determining the symptoms of internal browning in pears was assessed.
Using the absorption spectra obtained at 650–950 nm, discrimination prediction models were developed according to distinct preprocessing steps, and their performance was compared. Using 32 ‘Greensis’ pears characterized by imperceptible visual differentiation of internal browning, a browning discrimination and prediction model was developed using PLSR. PCA results revealed a robust clustering between normal pears and those with internal browning, indicating a high possibility of internal browning detection. The three preprocessing methods—smoothing, SNV, and second derivative_Savitzky–Golay derivatives—used to compare the accuracy of the models in the 700–900 nm wavelength range showed similar prediction performance. The browning determination model developed through PLSR demonstrated a statistically significant accuracy level of 95%. Furthermore, it was determined that pears with a browning index of 25 ± 2.0—indicative of elusive browning detection with the naked eye—have a high propensity for browning after the cold storage period.
The results of this study will be beneficial to farmers, small fruit vendors, and consumers in the concurrent selection of multiple fruits. In subsequent studies, an optimal browning determination model with an improved detection rate should be developed by improving light penetration depth and using various fruit samples with varying degrees of internal browning.

Author Contributions

Conceptualization, H.-J.S., and J.S.; methodology, H.-J.S. and J.S., software, H.-J.S.; validation, H.-J.S. and J.S.; formal analysis, H.-J.S.; investigation, H.-J.S.; resources, H.-J.S.; data curation, H.-J.S.; writing—original draft preparation, H.-J.S.; writing—review and editing, H.-J.S.; visualization, H.-J.S.; supervision, H.-J.S.; project administration, H.-J.S. and J.S.; funding acquisition, H.-J.S. All authors have read and agreed to the published version of the manuscript.

Funding

This research was supported by the National Institute of Horticultural and Herbal Science (grant number PJ01718104), funded by the Rural Development Administration of the Republic of Korea.

Data Availability Statement

The data presented in this study are contained within the article. Data will be made available on request.

Acknowledgments

We would like to thank Young-Seok Bae at Sunforest Company for his technical assistance and support. We are also grateful to Eu Ddeum Choi and Shailesh S. Sawant at the Pear Research Institute, National Institute of Horticultural and Herbal Science, RDA in Naju, Korea for their cooperation and technical support.

Conflicts of Interest

The authors declare no conflict of interest.

References

  1. Korean Statistical Information Service. Available online: http://kosis.kr/search/search.do (accessed on 1 May 2023).
  2. Lee, U.Y.; Oh, K.Y.; Shim, H.K.; Lee, H.J.; Hwang, Y.S.; Chen, J.P. Comparison of fruit quality among fruits set on various position within cluster in ‘Niitaka’ Pears. Korean J. Agric. Sci. 2010, 37, 13–18. [Google Scholar] [CrossRef]
  3. Lwin, H.P.; Lee, J. Preharvest 1-methylcyclopropene treatment effects on fruit quality attributes and targeted metabolites in ‘Wonhwang’ pears stored at room temperature after cold storage. Sci. Hortic. 2021, 289, 110480. [Google Scholar] [CrossRef]
  4. Kim, Y.K.; Kang, S.S.; Won, K.H.; Shin, I.S.; Cho, K.S.; Ma, K.B.; Kim, M.S.; Choi, J.J.; Choi, J.H. Breeding of the Scab-Resistant Pear Cultivar ‘Greensis’. Hortic. Sci. Technol. 2016, 34, 655–661. [Google Scholar] [CrossRef]
  5. Latt, T.T.; Lwin, H.P.; Seo, H.-J.; Lee, J. 1-Methylcyclopropene delays degradation of peel greenness but induces internal physiological disorders in cold-stored fruit of interspecific pears. Sci. Hortic. 2023, 312, 111852. [Google Scholar] [CrossRef]
  6. Arzani, K.; Khoshghalb, H.; Malakouti, M.J.; Barzegar, M. Polyphenoloxidase activity, polyphenol and ascorbic acid concentrations and internal browning in Asian pear (Pyrus serotina Rehd.) fruit during storage in relation to time of harvest. Eur. J. Hortic. Sci. 2009, 74, 61–65. [Google Scholar]
  7. Choi, J.H.; Lee, U.Y.; Lee, J.H.; Choi, J.J.; Chun, J.P. Effect of 1-methylcyclopropene on quality of new mid-season Asian pear ‘Changjo’ during simulated marketing. Korean J. Agric. Sci. 2017, 44, 332–338. [Google Scholar] [CrossRef]
  8. Kim, J.G.; Oh, K.Y.; Lee, U.Y.; Ma, K.B.; Hwang, Y.S.; Choi, J.M.; Chun, J.P. Changes of the fruit quality according to temperature environment and marketing period during simulated exportation in ‘Whasan’ pears. J. Bio-Environ. Control 2011, 20, 399–405. [Google Scholar]
  9. Hayama, H.; Mitani, N.; Yamane, T.; Kusaba, S. Alleviation of Vascular Bundle Browning in the Japanese Pear ‘Rinka’ by Preharvest Application of Ethephon. Hortic. J. 2022, 91, 329–336. [Google Scholar] [CrossRef]
  10. Oh, K.Y.; Lee, U.Y.; Moon, S.J.; Kim, Y.; Yook, H.; Hwang, Y.; Chun, J. Transportation and distribution temperatures affect fruit quality and physiological disorders in ‘Wonhwang’ pears. Korean J. Hortic. Sci. Technol. 2010, 28, 434–441. [Google Scholar]
  11. Seo, H.-J.; Chen, P.-A.; Lin, S.-Y.; Choi, J.-H.; Kim, W.-S.; Haung, T.-B.; Roan, S.-F.; Chen, I.-Z. The Potassium to Magnesium Ratio Enables the Prediction of Internal Browning Disorder during Cold Storage of Asian Pears. Korean J. Hortic. Sci. Technol. 2015, 33, 535–541. [Google Scholar] [CrossRef]
  12. Seo, H.-J.; Wang, Y.-S.; Lwin, H.P.; Choi, J.-H.; Chun, J.-P.; Roan, S.-F.; Chen, I.-Z.; Lee, J. Early season ‘Wonhwang’ pear fruit quality following international transport and storage is negatively impacted by fruitlet stage gibberellic acid4+7 (GA4+7) application but improved by postharvest 1-methylcyclopropene (1-MCP). Sci. Hortic. 2019, 256, 108549. [Google Scholar] [CrossRef]
  13. Hasanzadeh, B.; Abbaspour-Gilandeh, Y.; Soltani-Nazarloo, A.; De La Cruz-Gámez, E.; Hernández-Hernández, J.L.; Martínez-Arroyo, M. Non-Destructive Measurement of Quality Parameters of Apple Fruit by Using Visible/Near-Infrared Spectroscopy and Multivariate Regression Analysis. Sustainability 2022, 14, 14918. [Google Scholar] [CrossRef]
  14. Hao, Y.; Li, X.; Zhang, C.; Lei, Z. Online Inspection of Browning in Yali Pears Using Visible-Near Infrared Spectroscopy and Interpretable Spectrogram-Based CNN Modeling. Biosensors 2023, 13, 203. [Google Scholar] [CrossRef] [PubMed]
  15. Lee, A.; Shim, J.; Kim, B.; Lee, H.; Lim, J. Non-destructive prediction of soluble solid contents in Fuji apples using visible near-infrared spectroscopy and various statistical methods. J. Food Eng. 2022, 321, 110945. [Google Scholar] [CrossRef]
  16. Ma, T.; Zhao, J.; Inagaki, T.; Su, Y.; Tsuchikawa, S. Rapid and nondestructive prediction of firmness, soluble solids content, and pH in kiwifruit using Vis–NIR spatially resolved spectroscopy. Postharvest Biol. Technol. 2022, 186, 111841. [Google Scholar] [CrossRef]
  17. Torres, C.A.; Mogollon, R. Characterization of sun-injury and prediction of sunscald on ‘Packham’s Triumph’ pears using Vis-NIR spectroscopy. Postharvest Biol. Technol. 2022, 184, 111776. [Google Scholar] [CrossRef]
  18. Li, J.L.; Sun, D.W.; Cheng, J.H. Recent Advances in Nondestructive Analytical Techniques for Determining the Total Soluble Solids in Fruits: A Review. Compr. Rev. Food Sci. Food Saf. 2016, 15, 897–911. [Google Scholar] [CrossRef] [PubMed]
  19. Wang, H.; Peng, J.; Xie, C.; Bao, Y.; He, Y. Fruit Quality Evaluation Using Spectroscopy Technology: A Review. Sensors 2015, 15, 11889–11927. [Google Scholar] [CrossRef] [PubMed]
  20. Jang, K.E.; Kim, G.; Shin, M.H.; Cho, J.G.; Jeong, J.H.; Lee, S.K.; Kang, D.; Kim, J.G. Field Application of a Vis/NIR Hyperspectral Imaging System for Nondestructive Evaluation of Physicochemical Properties in ‘Madoka’ Peaches. Plants 2022, 11, 2327. [Google Scholar] [CrossRef] [PubMed]
  21. Zeb, A.; Qureshi, W.S.; Ghafoor, A.; Malik, A.; Imran, M.; Mirza, A.; Tiwana, M.I.; Alanazi, E. Towards sweetness classification of orange cultivars using short-wave NIR spectroscopy. Sci. Rep. 2023, 13, 325. [Google Scholar] [CrossRef] [PubMed]
  22. Mogollon, M.; Jara, A.; Contreras, C.; Zoffoli, J. Quantitative and qualitative VIS-NIR models for early determination of internal browning in ‘Cripps Pink’ apples during cold storage. Postharvest Biol. Technol. 2020, 161, 111060. [Google Scholar] [CrossRef]
  23. Huang, Y.; Lu, R.; Chen, K. Detection of internal defect of apples by a multichannel Vis/NIR spectroscopic system. Postharvest Biol. Technol. 2020, 161, 111065. [Google Scholar] [CrossRef]
  24. Kim, B.G.; Lim, J.G. Discrimination of internally browned apples utilizing near-infrared non-destructive fruit sorting system. J. Korea Acad. Ind. Coop. Soc. 2021, 22, 208–213. [Google Scholar] [CrossRef]
  25. Fu, X.; Ying, Y.; Lu, H.; Xu, H. Comparison of diffuse reflectance and transmission mode of visible-near infrared spectroscopy for detecting brown heart of pear. J. Food Eng. 2007, 83, 317–323. [Google Scholar] [CrossRef]
  26. Han, D.; Tu, R.; Lu, C.; Liu, X.; Wen, Z. Nondestructive detection of brown core in the Chinese pear ‘Yali’ by transmission visible–NIR spectroscopy. Food Control 2006, 17, 604–608. [Google Scholar] [CrossRef]
  27. Sun, X.; Liu, Y.; Li, Y.; Wu, M.; Zhu, D. Simultaneous measurement of brown core and soluble solids content in pear by on-line visible and near infrared spectroscopy. Postharvest Biol. Technol. 2016, 116, 80–87. [Google Scholar] [CrossRef]
  28. Cruz, S.; Guerra, R.; Brazio, A.; Cavaco, A.M.; Antunes, D.; Passos, D. Nondestructive simultaneous prediction of internal browning disorder and quality attributes in ‘Rocha’ pear (Pyrus communis L.) using VIS-NIR spectroscopy. Postharvest Biol. Technol. 2021, 179, 111562. [Google Scholar] [CrossRef]
  29. Choi, J.-H.; Chen, P.-A.; Lee, B.; Yim, S.-H.; Kim, M.-S.; Bae, Y.-S.; Lim, D.-C.; Seo, H.-J. Portable, non-destructive tester integrating VIS/NIR reflectance spectroscopy for the detection of sugar content in Asian pears. Sci. Hortic. 2017, 220, 147–153. [Google Scholar] [CrossRef]
  30. Kawano, S.; Abe, H.; Iwamoto, M. Development of a Calibration Equation with Temperature Compensation for Determining the Brix Value in Intact Peaches. J. Near Infrared Spectrosc. 1995, 3, 211–218. [Google Scholar] [CrossRef]
  31. Peinado, A.; van den Berg, F.; Blanco, M.; Bro, R. Temperature-induced variation for NIR tensor-based calibration. Chemom. Intell. Lab. Syst. 2006, 83, 75–82. [Google Scholar] [CrossRef]
  32. Li, X.; He, Y.; Fang, H. Non-destructive discrimination of Chinese bayberry varieties using Vis/NIR spectroscopy. J. Food Eng. 2007, 81, 357–363. [Google Scholar] [CrossRef]
  33. Jaillais, B.; Pinto, R.; Barros, A.; Rutledge, D. Outer-product analysis (OPA) using PCA to study the influence of temperature on NIR spectra of water. Vib. Spectrosc. 2005, 39, 50–58. [Google Scholar] [CrossRef]
  34. Suh, J.-Y.; Woo, Y.-A.; Lim, H.-R.; Kim, H.-J.; Moon, D.-G.; Choi, Y.-H. Determination of the water content in citrus leaves by portable near infrared (NIR) system. Anal. Sci. Technol. 2003, 16, 277–282. [Google Scholar]
  35. Ryu, D.S.; Noh, S.H.; Hwang, H. Nondestructive internal defects evaluation for pear using NIR/VIS Transmittance spectroscopy. Agric. Biosyst. Eng. 2003, 4, 1–7. [Google Scholar]
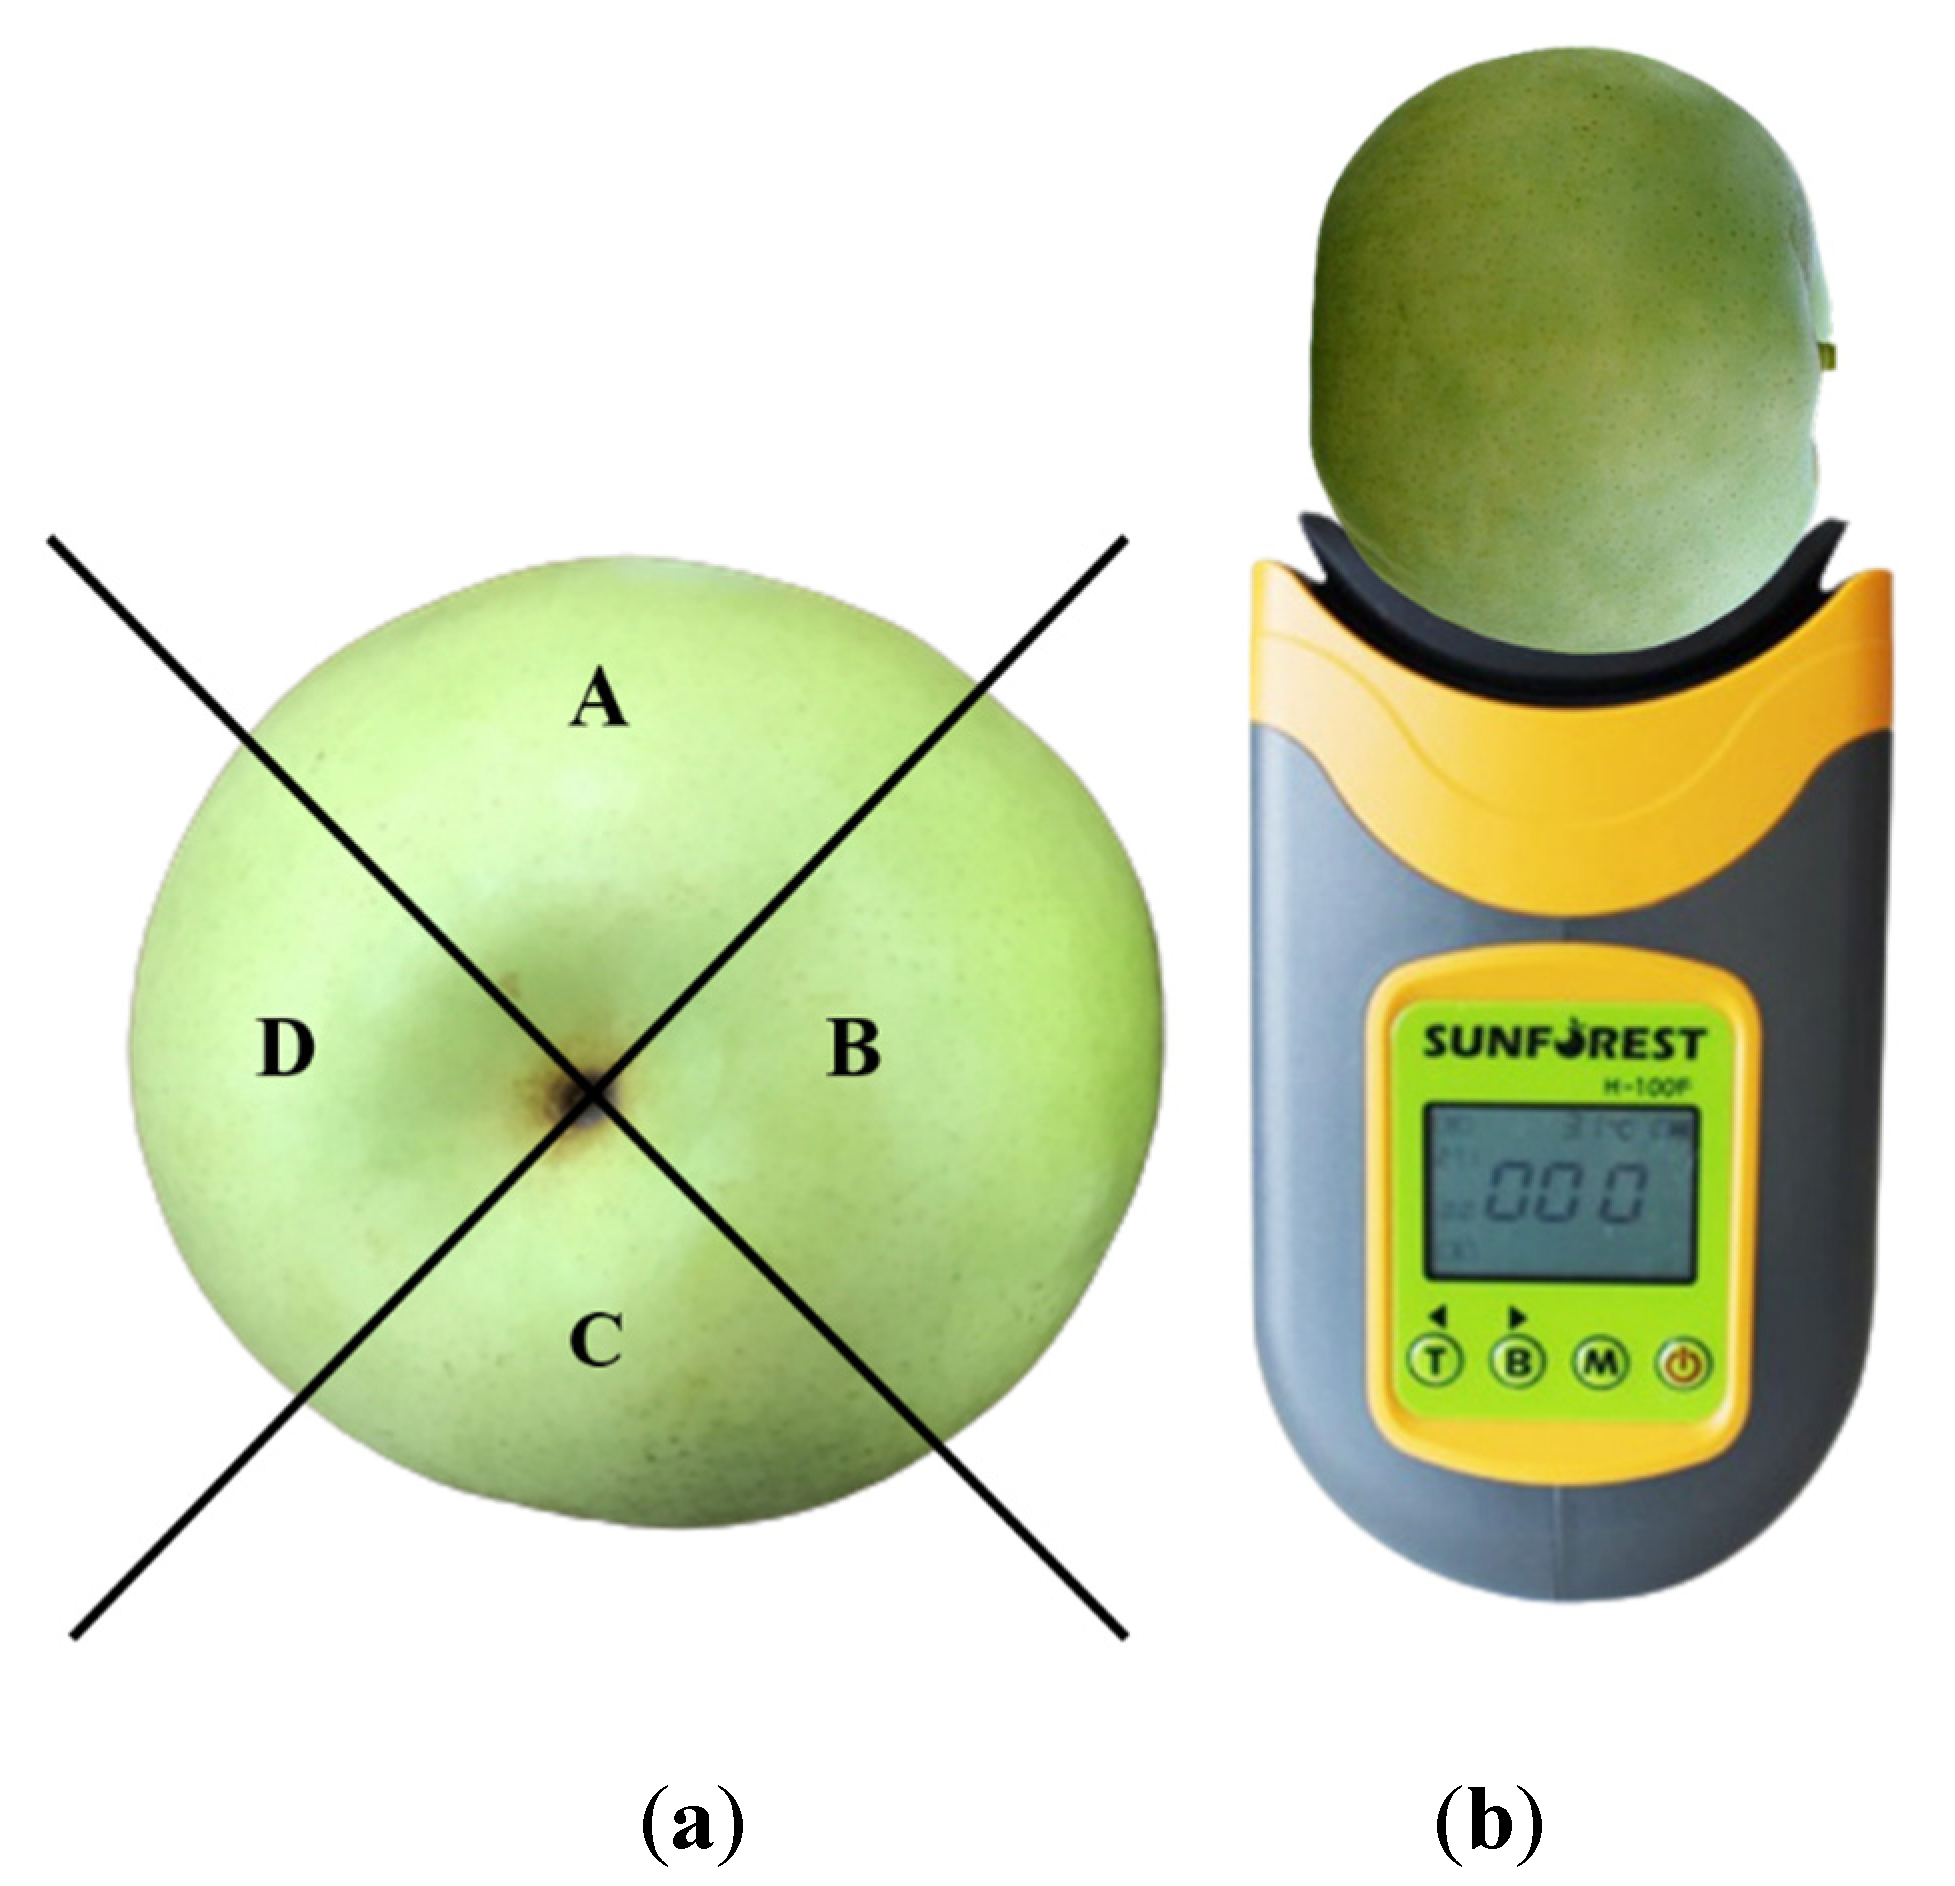
Figure 1. Measurement positions (a) and methods of measurement using the portable instrument (b).
Horticulturae 09 00944 g001
Figure 2. The effect of cold storage duration on the development of internal browning in ‘Greensis’ pears in 2020. Browning disorder severity levels 0, 1, 2, 3, and 4 represent browning incidence areas of 0%, 1–25%, 26–50%, 51–75%, and >75% of the sectional flesh area, respectively. Data are the average of 20 fruits. Bars represent mean ± standard error.
Horticulturae 09 00944 g002
Figure 3. Examples of flesh browning observed in ‘Greensis’ pears after 3 months of storage at 0.5 °C.
Horticulturae 09 00944 g003
Figure 4. Accumulated raw spectra (a) and absorbance spectra (b) of the pears from 580–1100 nm.
Horticulturae 09 00944 g004
Figure 5. Score plot for the principal component analysis results based on the near-infrared absorbance spectra of log(1/R) in the wavelength range of 700–920 nm.
Horticulturae 09 00944 g005
Figure 6. Plot of the browning index (a) and actual visual browning index (b). Browning index values were calculated using the partial least squares regression model with the absorbance spectra of log(1/R) in the wavelength range of 700–920 nm.
Horticulturae 09 00944 g006
Table 1. Specifications of the portable non-destructive instrument.
ParameterSpecification
Sensor typeEnhanced CMOS Spectrometer (600–1100 nm)
Light sourceT-Halogen Mini Lamp
Measuring time2.0 s max
Data interfaceUSB 2.0 (PC)
Operating temperature5 °C–35 °C
DisplayTN LCD (45 mm × 30 mm)
Dimension and weight (instrument only)110 mm × 60 mm ×169 mm (420–450 g)
Table 2. Regression statistics for the partial least squares regression model developed using the absorbance spectra for the visual browning in pears.
Preprocessing
Method
Number of
Factors
Slope
(Cal/Val)
CalibrationValidation
RSECRSEP
Smoothing y20.95/0.950.953.100.953.14
SNV x30.92/0.920.923.810.923.92
2nd Derivative w50.96/0.950.962.640.952.85
y SM: Smoothing (S. Golay, 3rd, points: 7) x SNV: Standard normal variate w 2D: 2nd derivative (Gap size: 7, segment size: 5) SEC, standard error of calibration; SEP, standard error of prediction; R, correlation coefficient.
Disclaimer/Publisher’s Note: The statements, opinions and data contained in all publications are solely those of the individual author(s) and contributor(s) and not of MDPI and/or the editor(s). MDPI and/or the editor(s) disclaim responsibility for any injury to people or property resulting from any ideas, methods, instructions or products referred to in the content.