Article

Assessment of Gene Action and Identification of Heterotic Hybrids for Enhancing Yield in Field Pea

1
Department of Genetics and Plant Breeding, Banda University of Agriculture and Technology, Banda 210001, India
2
ICAR-Central Horticultural Experiment Station, CIAH Regional Station, Godhra 389340, India
3
Department of Genetics and Plant Breeding, Chaudhary Sharvan Kumar Himachal Pradesh Agricultural University, Palampur 176062, India
4
Department of Biochemistry, Punjab Agricultural University, Ferozepur Road, Ludhiana 141027, India
5
Department of Botany, Indira Gandhi University, Rewari 122502, India
6
Instituto de Conservación y Mejora de la Agrodiversidad Valenciana, Universitat Politècnica de València, 46022 Valencia, Spain
7
Department of Crop Physiology, Banda University of Agriculture and Technology, Banda 210001, India
*
Authors to whom correspondence should be addressed.
Horticulturae 2023, 9(9), 997; https://doi.org/10.3390/horticulturae9090997
Submission received: 10 July 2023 / Revised: 23 August 2023 / Accepted: 1 September 2023 / Published: 4 September 2023
(This article belongs to the Special Issue Breeding by Design: Advances in Vegetables)

Abstract

:
Eight field pea parental lines and their twenty-eight F1s resulting from diallel design (excluding reciprocal) were analyzed for their combining ability and heterosis for yield and associated traits. ANOVA revealed significant variation among parents and among hybrids for days to 50% flowering, plant height, total number of pods, effective pods, seeds per pod, 100-seed weight, biological yield and seed yield; pod length also revealed significant differences among hybrids, suggesting the occurrence of considerable variability for studied traits. Crosses P-1541-16 × P-92-97-11 and P-1541-16 × P-1297-97 displayed significant heterosis over better-parent and control varieties for seed yield and associated traits. Combining ability analysis showedthat SCAvariance was considerably higher than corresponding GCAvariance for all traits. Genotype Aman and P-1297-97 were identified as good general combiners for seed yield, while cross P-1541-16 × P-1297-97, Aman × EC-564817, P-1541-16 × P-92-97-11 and P-1297-97 × P-92-97-11 were identified as specific cross-combiners for most of the studied traits. Consequently, these crosses might be exploited in future breeding programs to find desired segregants. PCA explained 81.68% and 83.34% variability in parents and crosses, respectively, for yield component. Furthermore, trait association between GCA effects and SCA effects demonstrates that biological yield, total number of pods, and effective pods exhibit additive gene action, but 100-seed weight exhibits non-additive gene action.

1. Introduction

Field pea (Pisum sativum var. arvense) is an annual, cool-season, true diploid (2n = 14 chromosomes) grain legume crop, belonging to the Fabaceae family. Globally, it is grown under a variety of climatic conditions, ranging from semi-arid to temperate [1]. Field pea is one of the world’s oldest domesticated crops cultivated before the 10th and 9th millennia BC [2]. Field pea is valued mainly for the nutrient content of its seeds. From a nutritional point of view, field pea is a rich source of protein, with a 21–25% content and a higher concentration of amino acids like lysine and tryptophan [3,4] and a low content of cysteine and methionine [5]. In addition, peas also contain 20–25% starch, 4–10% sugar, 0.6–1.5% fat and 2–4% minerals [6]. In addition to its nutritional value, field pea has the ability to improve soil fertility by forming a symbiotic relationship between the root nodules of plants and nitrogen-fixing bacteria. Therefore, field pea cultivation increases the nitrogen uptake of various succeeding crops by 23–59% [7]. Achieving a high yield is a primary objective in field pea breeding efforts. Field pea is cultivated on an area of 0.64 million hectares with an annual production of 0.88 million tonnes, and productivity was 1375 kg/ha in 2020–2021 in India [8].
Due to the low production of field pea and the increase in population growth, the per capita availability of field pea is low [9]. In order to meet the demands of the population and by considering the importance of the crop, a quantitative increase in the productivity of peas is needed to increase per capita availability and to meet the challenges of the growing population. Therefore, a variety of field pea with a high yield and good seed quality is needed. Among the methods available for boosting the productivity of self-pollinated crops like field pea, recombinant breeding stands out as the most successful approach. In the present study, diallel analysis was used to evaluate the breeding material. Using diallel analysis as suggested by Griffing [10], plant breeders may make decisions about the selection of parental genotypes to use for hybridization and the development of desired transgressive segregants. Previously, the diallel mating design has been employed to investigate the yield and agronomic characteristics of field pea [11,12,13,14].
Field pea is a self-pollinating crop, and the possibilities of using hybrid vigor depend on the type of gene action. Information about gene action assists in the selection of parents to be used in hybridization programs and in the selection of appropriate breeding strategies. Gene action is usually measured by the components of genetic variances or variances of combining ability and effects [15,16]. Sprague and Tatum [17] proposed combining ability in 1942, which is a powerful tool for discriminating between good and poor combiners and for choosing suitable parents for breeding programs. At the same time, it also provides information about types of gene effects involved in the inheritance of different traits. The resulting overall genetic variance is divided into variances due to general combining ability and specific combining ability. This assists breeders in determining the relative amount of additive and non-additive genetic variance in the inheritance of different traits and to determine appropriate breeding methods to effectively utilize the available genetic variation. The presence of non-additive genetic variance is the most important rationale for initiating a hybrid breeding program [18]. In field pea, recombination breeding has been widely used to develop reservoirs of variability for use in the breeding program. Because of the self-pollinating nature of field pea, GCA effects are more vital because they are due to additive effect and additive × additive interaction, whereas SCA effects are only useful if they are due to additive × additive gene effects, i.e., crosses with high specific combining ability effects with good per se performance and involving at least one good general combining parent; such crosses can produce the desired transgressive segregants. Heterosis may be defined as the superiority of a hybrid compared with the parent with respect to one or more traits [19]. The study of heterosis helps the plant breeder in eliminating the less productive crosses in early generations. The pursuit of hybrid selection within plant breeding strategies necessitates a defined degree of heterosis and specific combining ability [20]. Thus, to implement a field pea breeding program, it is necessary to have a proper understanding of genetic parameters like heterosis and combining ability. Previous researchers, such as Rebika [21], demonstrated the expression of heterosis in field pea concerning seed yield, as evidenced by the superiority of hybrids compared to both the better-parent plants and the standard control variety. In another study, Joshi et al. [22] investigated heterosis and combining ability for yield and yield-related traits in field pea through diallel analysis, excluding reciprocal, and they observed exploitable heterosis over better-parent and standard control varieties. They observed a reflection of heterosis for seed yield per plant through the number of seeds per pod, and number of pods per plant for harvest index. With the considerations mentioned above, the current study was conducted to assess the combining ability effects, gene action, and heterosis through crosses involving eight field pea genotypes using a diallel mating design (excluding reciprocals). The insights gained from this investigation will prove invaluable in the development of high-seed-yield field pea varieties.

2. Materials and Methods

2.1. Experimental Site

The present study was carried out at the research farm of Banda University of Agriculture and Technology, Banda, India, during the winter season of 2021–2022 (November 2021 to March 2022). Banda is located at 25.56° N and 80.3° E. The altitude is 113 m above mean sea level. The climatic conditions of the Banda region can be described as semi-arid with hot summers and cold winters. The average rainfall is between 800–910 mm. The average temperature at the experimental site during the experiment was 21.2 °C. The highest relative humidity of about 85% is in August; the lowest is about 25% in April.

2.2. Plant Materials and Experimental Design

The plant material comprised eight genotypes (including breeding lines and cultivars) of field pea and the standard varieties IPFD 10–12 and Ambika as controls (Table 1). The genotypes were selected on the basis of their adaptability, diversity and morphological traits such as earliness and high yield potential. The 28 F1s were obtained by crossing 8 genotypes in diallel fashion (excluding reciprocals) during the winter season of 2020–2021. Hand emasculation and pollination were used to produce seeds of twenty-eight crosses (Table 2). The thirty-eight genotypes (eight parental genotypes + twenty-eight F1s + two control varieties) were planted in a randomized block design with two replications during the winter season of 2021–2022. Each experimental plot had a single row of 4m in length. Row-to-row distance was 30 cm and plant-to-plant distance was 15 cm. Recommended crop production and protection practices were followed to raise a good and healthy crop [23].

2.3. Data Collections

The data were noted on five randomly selected plants in each genotype on ten quantitative traits of field pea, with the exceptions of days to 50% flowering and days to maturity, which were noted on a row basis. For various statistical analyses, averages of data from the selected plant of each plot were used with respect to different traits. Observations were noted for the following traits: days to 50% flowering (DF), days to maturity (DM), plant height in centimeters (PH), total number of pods per plant (TNP), number of effective pods per plant (NEP), number of seeds per pod (NSP), pod length in centimeters (PL), 100-seed weight in grams (SW), biological yield per plant expressed in grams (BY) and seed yield per plant in grams (SY) at different growth stages as reported by Pratap et al. [24] and Sharma et al. [25].

2.4. Statistical Analysis

The replication-wise average of each genotype for different traits was used for analysis. The program R studio (version 2023.03.1-446) package DialllelAnalysisR was used for analysis [26].

2.4.1. Analysis of Variance for Experimental Design

The observations recorded on each trait were subjected to analysis of variance as per the standard method of Panse and Sukhatme [27]. Analysis of variance was performed to check the significant variation among parents and their offspring for different traits.

2.4.2. Estimation of Heterosis

Heterobeltiosis and economic heterosis are expressed as percentage deviation over the better-parent and control varieties, respectively, in the desirable direction. Heterobeltiosis and economic heterosis were estimated using the methods of Fonseca and Patterson [28] and Meredith and Bridge [29], respectively.
H e t e r o b e l t i o s i s = F 1 ¯ B P ¯ B P ¯
E c o n o m i c   h e t e r o s i s = F 1 ¯ C V ¯ C V ¯
where
F 1 ¯ = mean value of F1
B P ¯ = mean value of better parent.
C V ¯ = mean value of control variety.
The significance of heterobeltiosis and economic heterosis was tested using Student’s t-test. To calculate heterobeltiosis and economic heterosis, the parents with higher mean values for all traits were considered desirable, except for DF, DM and PH, where lower mean values were considered desirable.

2.4.3. Combining Ability Analysis

The analysis of combining ability was performed using Griffing’s method II, model I [10], to determine general and specific combining ability effects. The following model was employed to assess the general and specific combining ability effects of the ijth observations:
Yijk = µ + Gi + Gj + Sij + Rk + Σeijk
where Yijk stands for phenotypic expression of the ijth genotype in kth replication, µ stands for the population mean, and Gi and Gj stand for the GCA effects of the ith line and jth tester, respectively. Sij stands for the SCA effects of a cross between the ith line and jth tester, Rk stands for the effect of kth replication and Σeijk stands for uncontrolled variation/error associated with ij cross in the kth replication. The significance of estimates of combining ability effects (GCA and SCA) was tested using t-test.

2.4.4. Correlation and Principal Component Analysis

The correlation coefficient, principal component analysis (PCA) and biplot analysis were carried out using the statistical program R studio (version 2023.03.1-446) by using mean values of different traits.

3. Results and Discussion

3.1. Analysis of Variance for Experimental Design

The analysis of variance for diallel mating design (Table 3) revealed that the mean square due to genotypes was found to be significant at p ≤ 0.05 for all studied traits, indicating the existence of plenty of genetic variations across genotypes and justifying the inclusion of genotypes for study. A wide range of variability was also stated in different field pea genotypes by Tampha et al. [30], Pratap et al. [31] and Bardisi and Zyada [14] in field pea. Further, partitioning of mean square by genotype into parents and hybrids showed that the differences among parents were significant for all investigated traits except DM and PL, whereas significant differences were also observed among the hybrids for all traits except DM. Significant differences among parents and among hybrids for the concerned traits suggested the presence of significant genetic variability in experimental material. However, mean square of parents versus hybrids (P vs. F1) revealed significant differences only for PH, SW, BY and SY, indicating the presence of substantial genetic variability between parents and their hybrids that could promote genetic enhancement by exploiting this genetic pool of field pea. It also reflects the existence of a sufficient level of heterosis for the investigated traits. Pratap et al. [31] and Bardisi and Zyada [14] also observed similar findings for one or more traits.

3.2. Per se Performance of Parents and Their Crosses

The per se performance of parents and their crosses for all studied traits are summarized in Table 4 and Supplementary Figure S1. In Figure S1, the average performance of all the 8 parental genotypes for different traits is indicated as ‘P’, while ‘H’ represents the average performance of all 28 cross combinations. All the genotypes demonstrated better mean performance across all the assessed traits. Among parents, the minimum number of DF was observed for genotypes P-92-97-11(56.00 days) and P-1297-97 (56.00 days), while the genotype Aman took the maximum duration of 85.00 days. For the crosses, the earliest days to 50% flowering were observed for P-92-97-11 × P-1426 (55.50 days), while the cross Aman × Vikas (79.50 days) took a longer period to flower. In the case of DM, the genotype P-1426 (113.00 days) exhibited early maturity, whereas genotype P-1541-16 (120.50 days) took the longest time to mature. The cross P-1297-97 × P-92-97-11(100.50 days) had the least DM, while the cross HFP 1314 × Vikas (119.00 days) showed the maximum days to mature. The minimum PH was recorded for the parent P-1426 (62.75 cm) and the maximum for HFP 1314 (159.95 cm), whereas, among the crosses, Vikas × P-1426 (68.10 cm) had dwarf stature while the cross HFP 1314 × P-92-97-11 (168.30 cm) exhibited long stature. For the TNP and NEP, the highest value was observed for the parent P-92-97-11 (70.75 and 68.55) and the cross P-1541-16 × Aman (91.74 and 89.94), whereas the parent P-1426 (27.96 and 25.38) and the cross EC-564817 × P-92-97-11 (23.65 and 21.59) had the maximum value, respectively. The smallest PL was observed for the genotype P-1426 (4.32 cm), while the genotype Aman had long pods of 5.94 cm length, whereas for the crosses, long pods were observed for EC-564817 × Vikas (6.29 cm) while the cross EC-564817 × P-92-97-11 (2.37 cm) had the smallest PL. In the case of NSP, the highest value was observed for the parent P-1426 (6.12) but lowest for the parent Vikas (4.25). The cross EC-564817 × Vikas (6.75) had the highest and the cross P-1541-16 × Vikas (3.89) had the lowest NSP. The parent P-92-97-11 (11.75 g) and the cross EC 564817 × P-92-97-11 (13.25 g) showed the lowest SW, whilethe parent HFP 1314 (18.50 g) and the cross P-1297-97 × HFP 1314 (21.90 g) scored the highest seed weight. The lowest BY was recorded for the parent P-1426 (56.75 g) and the highest was recorded for P-1297-97 (105.95 g), whereas among the crosses, EC 564817 × P-92-97-11 (58.72 g) had the lowest BY while the cross P-1541-16 × P-92-97-11 (125.00 g) exhibited the highest biological yield. The highest SY was found for the parent HFP 1314 (46.25 g) and the cross P-1541-16 × P-1297-97 (59.60 g), whereas the lowest values of SY were exhibited by the parent P-1541-16 (15.23 g) and the cross EC 564817 × P-92-97-11 (15.14 g). The critical analysis of the per se performance of parents and crosses suggests the existence of a wide spectrum of genetic variations in evaluated material. As evident from the results, considerable variation was observed among genotypes for all traits under analysis. It was determined that promising parents for early flowering were P-92-97-11 and P-1297-97; similarly, P-1426 showed promise for early maturity, short stature and more seeds per pod; P-92-97-11 showed promise for highest TNP and NEP and high BY; Aman showed promise for long pod length; and HFP 1314 showed promise for increased SY and SW. Genotypes showing very high performance for the different traits may serve as acceptable donors to improve the traits for which they show high mean performance. The present findings indicate that the hybrid combinations displayed superior performance in seed yield traits when compared to the parental genotypes, providing evidence of heterosis (Supplementary Figure S1). Per se performance of crosses for the various traits under investigation revealed that the cross P-92-97-11 × P-1426 was promising for early flowering; P-1297-97 × P-92-97-11 was promising for early maturity; Vikas × P-1426 was promising for dwarf plant stature; P-1541-16 × Aman was promising for the highest TNP and NEP; EC-564817 × Vikas was promising for long pods and more seeds per pod of field pea; P-1297-97 × HFP 1314 was promising for highest seed weight; P-1541-16 × P-92-97-11 was promising for more BY; and P-1541-16 × P-1297-97 was promising for the highest SY. The cross P-1541-16 × P-1297-97 could be utilized for new hybrids to achieve elevated seed yield along with favorable agronomic traits. These findings provide validation for the feasibility of trait enhancement through hybridization involving specific parents. Furthermore, they propose that plant breeders should strategically plan forthcoming breeding work to achieve high yields in field pea cultivation. Similar observations and recommendations have been supported by Ceyhan et al. [32], Kumar et al. [33] and Kumar et al. [34] for field pea. Certain findings might support the possibility of determining these traits through the hybridization of particular parents. Furthermore, these results suggest that plant breeders should gather future breeding efforts for high yields in field pea.

3.3. Heterosis

The per se performance of parents involved in crosses may not be a reliable indicator of genetic potential, whereas the heterotic response of the crosses is more reliable. The extent of heterosis provides information on the level of genetic diversity in the parents of a cross and helps in the selection of parents to obtain superior F1s, so as to exploit hybrid vigor. Exploiting heterosis in crops is one of the greatest breakthroughs in plant breeding. Heterobeltiosis and economic heterosis, expressed as the percentage superiority of the cross over the better parent and control variety for the trait being tested, determine whether an experimental cross is worth exploiting or not. In general, the extent of heterosis for different traits varied in degree and direction from cross to cross. In the current study, considerable positive heterosis compared with better parent and control variety estimates would be more interesting for SY, BY, TNP, NEP, PL, NSP and SW, whereas considerable negative heterosis relative to the better parent and control varieties would be useful for DF, DM and PH.
The results of the extent of heterobeltiosis and economic heterosis obtained for each trait are presented in Supplementary Tables S1 and S2. A perusal of Supplementary Tables S1 and S2 reveals that the scales of heterobeltiosis and economic heterosis for DF were−29.41% (Aman × EC 564817) to 19.08% (P-1541-16 × P-92-97-11), and −23.45% (P-92-97-11 × P-1426) to 9.66% (Aman × Vikas). In the case of DM, significant negative heterosis over better-parent and standard variety varied from −14.47% (P-1297-97 × P-92-97-11) to 0.85% (P-1297-97 × P-1426), and −17.96% (P-1297-97 × P-92-97-11) to −2.86% (HFP 1314 × Vikas), respectively. The cross P-1541-16 × Aman exhibited the highest significant heterobeltiosis and economic heterosis for TNP (51.75% and 88.76%) and NEP (70.35% and 93.20%), while the cross P-1297-97 × EC 564817 had the lowest significant heterobeltiosis and economic heterosis for TNP (−54.85% and −38.27%), and NEP (−55.82% and −39.39%). Heterobeltiosis and economic heterosis ranged from −48.13% to 35.74% and −17.96% to −2.86% for PH, respectively. Significant negative economic heterosis could not be seen for PH. The cross EC 564817 × Vikas exhibited the highest heterobeltiosis and economic heterosis for PL (24.55% and −8.58%), while the cross P-1541-16 × Vikas possessed the lowest value (−32.86% and −41.35%). Significant positive economic heterosis was not observed for PL. In the case of NSP, heterobeltiosis and economic heterosis ranged from −30.56% to 42.11% and −22.30% to −35.00%, respectively. For SW, the scale of heterobeltiosis and economic heterosis varied from −12.97% (HFP 1314 × EC 564817) to 31.00% (Aman × EC 564817), and −19.70% (EC 564817 × P-92-97-11) to 32.73% (P-1297-97 × HFP 1314). The scales of heterobeltiosis and economic heterosis for BY were−40.77% (P-1297-97 × EC 564817) to 45.60% (P-1541-16 × P-92-97-11), and −10.77% (EC 564817 × P-92-97-11) to 89.97% (P-1541-16 × P-92-97-11). For SY, heterobeltiosis ranged from −43.94 (P-1297-97 × EC 564817) to 49.59% (P-1541-16 × P-92-97-11), while economic heterosis ranged from 35.07% (P-1297-97 × EC 564817) to 169.68% (P-1541-16 × P-1297-97). Seed yield is a trait of economic importance in pea, for which 11 crosses over better-parent and 27 crosses over standard control variety showed significant and positive heterosis. Among the twenty-eight cross combinations, some showed a significant and desirable direction of heterobeltiosis along with economic heterosis for various traits such as DF (9 and 11); DM (5 and 6); PH (6 and 0); TNP (7 and 16); NEP (7 and 15), PL (3 and 0); NSP (2 and 7); SW (12 and 12); and BY (11 and 22), respectively, expected to have a predominance of additive gene effects. The crosses P-1541-16 × P-9297-11 for SY; P-1541-16 × Aman for TNP and NEP; EC-564817 × Vikas for PL and NSP; Aman × EC-564817 for SW; P-1541-16 × P-92- 97-11 for BY; Aman × EC 564817 for DF; P-1297-97 × P-92-97-11 for DM; and Vikas × P-1426 for dwarf stature plants showed significant heterosis over the better parents in a desirable direction. Significant heterosis over standard controls in adesirable direction was observed in P-1541-16 × P-1297-97 for SY; P-92-97-11 × P-1426 for DF; P-1297-97 × P-92-97-11 for DM; P-1541-16 × Aman for TNP and NEP; EC-564817 × Vikas for NSP; P-1297-97 × HFP-1314 for SW; and P-1541-16 × P-92-97-11 for BY.
The present investigation demonstrated that negative heterosis was found across all traits in both the better-parent and standard control varieties, with the exception of SY for economic heterosis. The heterosis approach is useful when developing and identifying the most heterotic and useful cross combinations to enable commercial cultivation of crosses. Subsequently, the cross P-1541-16 × P-1297-97 showed a high positive heterotic effect for SY along with TNP, NEP, SW and BY, and a high negative heterotic effect for PH and DF. Another cross, P-1297-97 × P-92-97-11, in addition to seed yield, also showed a positive heterotic effect for TNP, NEP, SW and BY, and a high negative heterotic effect for DF and DM. The cross P-1541-16 × P-92-97-11 showed a positive heterotic effect for TNP, NEP, SW and BY. These crosses may be exploited for the above traits to grow high-yielding field pea cultivars. A similar consonance of results was obtained from the studies of Hasan et al. [35], Brar et al. [36] and Galal et al. [37] in pea. Overall, in the current study, the crosses P-1541-16 × P-1297-97 exhibited a high manifestation of economic heterosis for seed yield and its related attributes, followed by P-1297-97 × P-92-97-11 and P-1541-16 × P-92-97-11. These combinations hold the potential for integration into crop improvement programs to generate transgressive segregants in subsequent generations. In a similar vein, Tampha et al. [30] identified the cross KPMR 939 × Makhvatmubi as demonstrating the highest heterosis over the standard control variety. Correspondingly, Rebika’s study [21] highlighted DDR 23 × HUDP 15 as the most favorable cross for achieving enhanced seed yield and related traits.

3.4. Combining Ability Analysis

Assessing both general and specific combining abilities plays a crucial role in determining the breeding potential of genotypes. The current study employed combining ability analysis to offer insights for selecting the best parents based on their GCA effects and per se performance, as well as identifying superior crosses through SCA effects and per se performance. This information can greatly inform hybrid breeding programs. Given the autogamous nature of field peas, while pure line breeding remains essential, hybrids exhibiting high per se performance and notable SCA effects are more likely to display transgressive segregation and contribute to the advancement of superior pure lines. In this particular investigation, diallel analysis, excluding reciprocals, was executed to assess eight genotypes across multiple traits.

3.4.1. Analysis of Variance for Combining Ability

Analysis of variance for combining ability (Table 5) showed that the mean square due to GCA was significant for all traits except DM, indicating the existence of additive gene actions for all traits except DM, whereas the mean square due to SCA was significant for all traits, reflecting the presence of non-additive gene actions for all studied traits. This indicates that predominant non-additive gene action is involved in the inheritance of these traits. Thus, the significant assessment of GCA and SCA variances indicated the involvement of both additive and non-additive gene actions in governing the traits within the studied field pea genotypes. Both general and specific combining abilities were important, but the former played a greater part in trait expression. However, the proportion of variance due to GCA and SCA (σ2GCA/σ2SCA) remained notably below unity across all traits, indicating that non-additive gene action was more significant to the inheritance of these traits compared to additive types. These results align with the conclusions drawn from the SCA analysis. The predominance of non-additive effects in the expression of various traits in pea was also reported by Joshi et al. [22], Suman et al. [12], Hama-amin [38] and Towfiq et al. [39]. A comprehensive evaluation of findings across these investigations revealed that both yield and its associated traits are governed by a combination of additive and non-additive genes. Leveraging the potential of both types of gene actions, a breeding strategy incorporating controlled intermating within segregated generations could prove beneficial. This approach would facilitate the introduction of diverse genes into the population, potentially leading to the overcoming of yield limitations in this crop.

3.4.2. Combining Ability Effects

The estimates of GCA effects of the parents for various traits are shown in Table 6. The GCA reveals the additive type of gene action. In the present investigation, the significant and positive magnitude of GCA for SY, BY, TNP, NEP, PL, NSP and SW was desirable, whereas deeply significant and negative values for DF, DM and PH were appropriate. The GCA effect or different traits varied significantly among different parents. A perusal of Table 6 revealed noteworthy favorable (positive/negative) GCA effects across all parental lines for a minimum of one of the analyzed traits. The presence of these significant GCA effects suggests the potential for ongoing advancements in yield and its associated traits through targeted breeding efforts within the field pea. These outcomes are consistent with the conclusions drawn by Yadav et al. [13], Kumar et al. [40], Manjunath et al. [41] and Kumar et al. [42].The parents Aman and P-1297-97 displayed significant positive GCA effects for SY, indicating that these genotypes could be used as good general combiners for higher seed yield in the breeding program. In addition, GCA effects showed that genotypes P-1426, P-92-97-11, HFP-1314 and P-12-97-97 were good general combiners for early flowering; P-1426, P-1297-97 and Vikas were good general combiners for dwarf plant stature; Aman, P-1541-16 and P-92-97-11 were good general combiners for TNP and NEP; and P-1426 and Aman were good general combiners for long PL and NSP. In addition, the genotype EC-564817 was also observed as a good general combiner for NSP. Genotypes P-1297-97, P-1426, HFP-1314 and P-1541-16 were good general combiners for more SW. Three genotypes, Aman, P-15451-16 and P-1297-97, were good general combiners for BY. None of the genotypes were good general combiners for DM. Aman, the best genotype in the study, was a good general combiner for TNP, NEP, PL, NSP, BY and SY. These findings of good combining parents for the traits concerned suggest the predominance of additive effect and additive × additive gene action [10,26]. These findings presented an improvement over earlier studies, wherein no individual parental line was identified as a strong general combiner for some yield-related traits, as indicated by Yadav et al. [13], Kumar et al. [40] and Manjunath et al. [41]. A good combining parent leads to a higher frequency of heterotic crosses than a poor combining parent [43]. Genotypes such as Aman and P-1297-97 with high GCA effects in desirable directions for yield and associated traits suggest that such genotypes may combine well with other genotypes to produce superior progeny.
The estimates of SCA effects of the crosses for various traits are shown in Table 7. Sprague and Tatum [17] reported that the SCA effect is due to a non-additive genetic component, which shows the role of non-additive gene action in the expression of traits. The SCA effect is reflected as the dependable index for identifying promising hybrids. A perusal of estimates of SCA effects revealed that among the twenty-eight crosses, thirteen combinations, EC-564817 × Vikas, EC-564817 × P-1426, P-1541-16 × P-92-97-11, Aman × Vikas, P-1297-97 × Vikas, P-1297-97 × P-92-97-11, P-92-97-11 × P-1426, Vikas × P-92-97-11, P-1541-16 × EC-564817, HFP-1314 × P-1426, P-1541-16 × P-1297-97, HFP-1314 × Aman and Aman × EC-564817, showed the highest significant SCA effects for SY. The highest negative SCA effect for DF was exhibited by Aman × EC-564817, followed by P-1541-16 × Aman, P-92-97-11 × P-1426 and HFP-1314 × EC-564817. Only two crosses, P-1297-97 × P-92-97-11 and P-1541-16 × HFP-1314, showed negative and significant SCA effects for DM. For PL, negatively significant SCA effects were displayed by the crosses P-1297-97 × EC-564817, Vikas × P-1426, P-1541-16 × P-92-97-11 and HFP-1314 × Aman. The crosses EC-564817 × P-1426, followed by P-1541-16 × Aman, Aman × Vikas and P-1541-16 × P-1297-97, showed the maximum specific combining ability for TNP. The crosses P-1541-16 × Aman, followed by EC-564817 × P-1426, Aman × Vikas and Aman × P-1426, showed the highest specific combining ability for NEP. The maximum SCA effect for PL was recorded for the crosses EC-564817 × Vikas, followed by P-1297-97 × EC-564817, P-1297-97 × Vikas and Aman × EC-564817. The highest positive SCA effect for NSP was demonstrated by the crosses EC-564817 × Vikas followed by P-1297-97 × EC-564817, Vikas × P-1426 and Aman × EC-564817. The crosses P-92-97-11 × P-1426, followed by Aman × EC-564817, P-1541-16 × EC-464817 and P-1297-97 × P-92-97-11, showed the highest specific combining ability for SW. The maximum SCA for BY was recorded for the crosses P-1541-96 × P-92-97-11, followed by EC-564817 × Vikas, P-92-97-11 × P-1426 and Aman × Vikas. The SCA effect estimates showed that none of the crosses were consistently promising for all traits. These crosses could be used in breeding programs to improve the studied traits. It was noteworthy that virtually all of the best crosses for each trait also had a desirable mean performance for each trait. On the basis of mean performance, high significant positive economic heterosis and high positive SCA effect, the best crosses for seed yield were P-1541-16 × P-1297-97, P-1297-97 × P-92-97-11, P-1541-16 × P-92-97-11, HFP 1314 × Aman, and Aman × EC 564817. Among these crosses, only Aman × EC -564817 showed the desirable level of SCA effects for the seven major traits such as DF, PH, NEP, NSP, SW, BY and SY. In addition, crosses such as P-1541-16 × P-1297-97, P-1297-97 × P-92-97-11, P-1541-16 × P-92-97-11 and HFP 1314 × Aman also displayed desirable SCA effects for four different yield attributing traits. Thus, these crosses could be exploited to obtain desirable recombinants from the distinct population and utilized for improving heterosis and achieving high-yielding genotypes. Similar findings for the identification crosses based on SCA effects for yield and its components in pea were also reported by Enrique et al. [44], Kosev et al. [45], Sharma et al. [46], Manjunath et al. [41], Katoch et al. [47] and Yadav et al. [13]. Our results illustrated that some specific cross combinations exhibiting highly positive SCA for various traits were characterized by both parents possessing good GCA. These results underscore the significance of cumulative effects arising from additive × additive interactions involving positive alleles, as observed in studies by Sharma et al. [48] and Khan et al. [16]. Conversely, some hybrid combinations displaying high positive SCA for a specific trait typically involved at least one parent with poor GCA effects. This occurrence might be linked to one parent functioning as a good combiner with favorable additive effects, while the other parent, with less favorable GCA, contributed to epistatic effects, consistent with insights from Sharma et al. [48] and Khan et al. [16]. Notably, the presence of parents with strong general combining ability did not always translate into hybrid combinations displaying notably high positive SCA. For instance, crosses such as HFP 1314 × P-1426, EC 564817 × Vikas, EC 564817 × P-1426, Vikas × P-92-97-11 and P-92-97-11 × P-1426 demonstrated significant SCA for seed yield and its attributing traits, despite their parents displaying negative GCA for those same traits (as indicated in Table 6 and Table 7). This phenomenon may be due to intricate interactions between the positive and negative alleles present in the parents. Comparable findings have been documented in prior research, as seen in Khandagale et al. [49] and Sharma et al. [48].

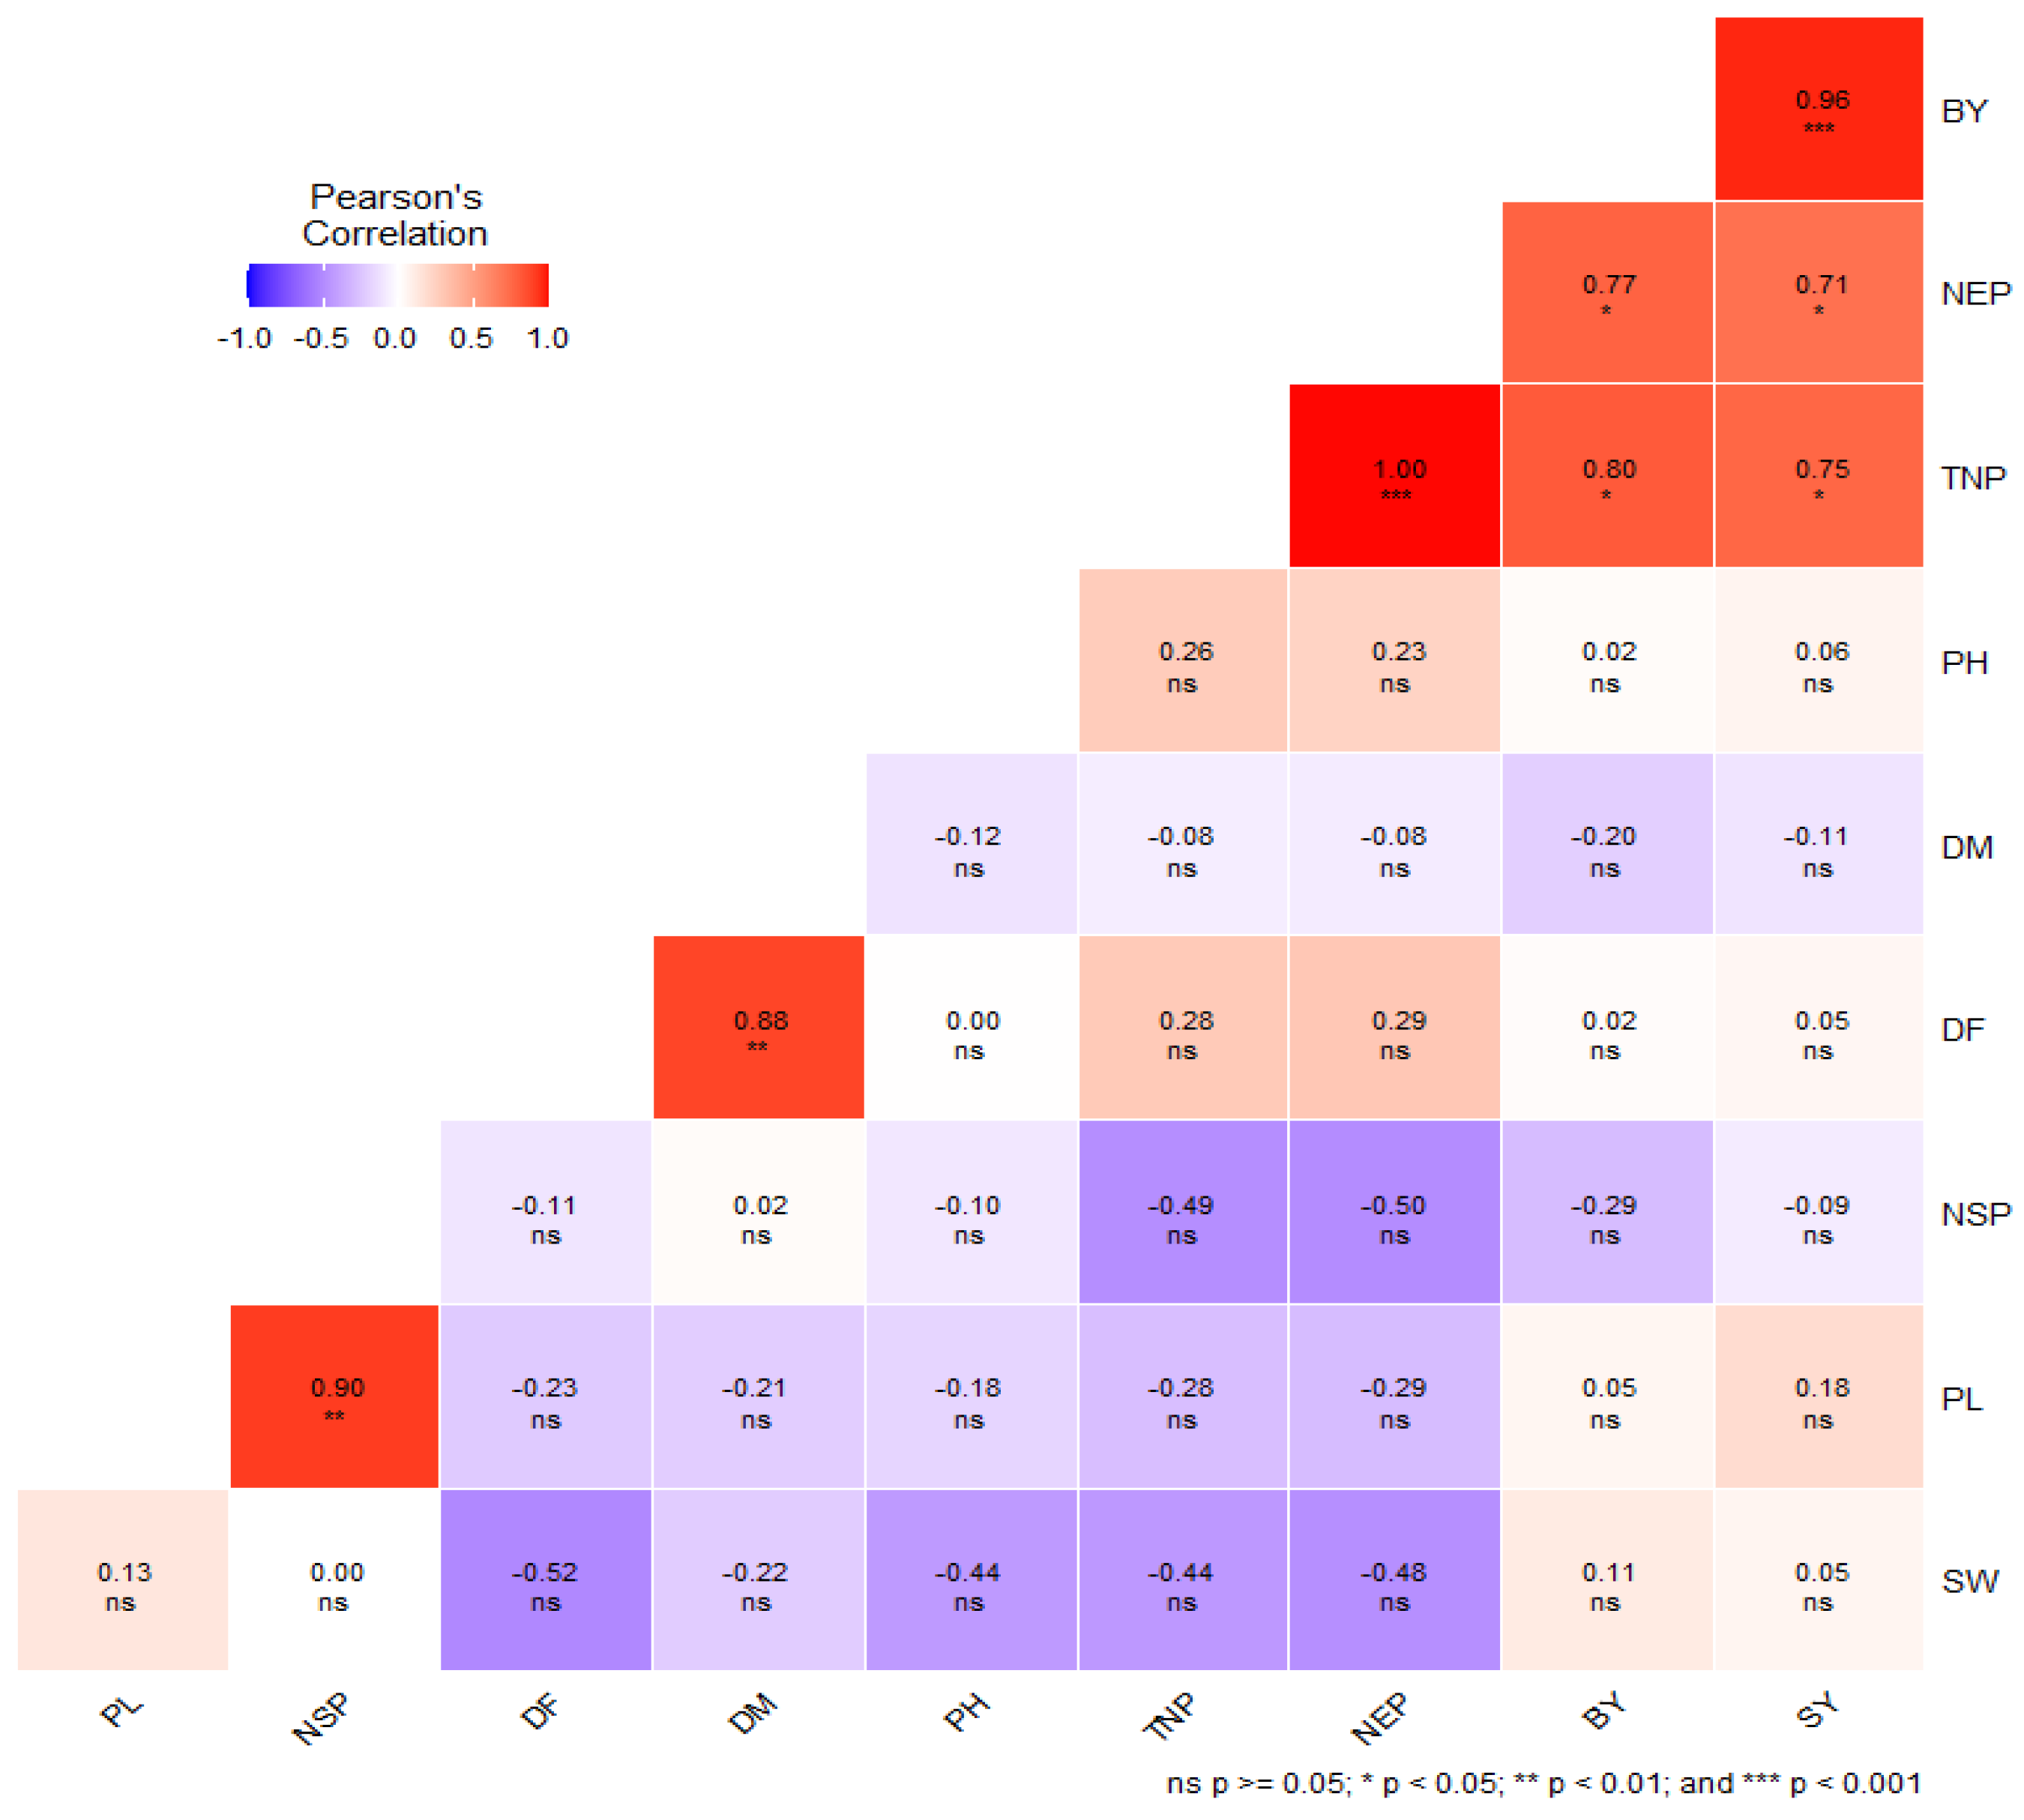
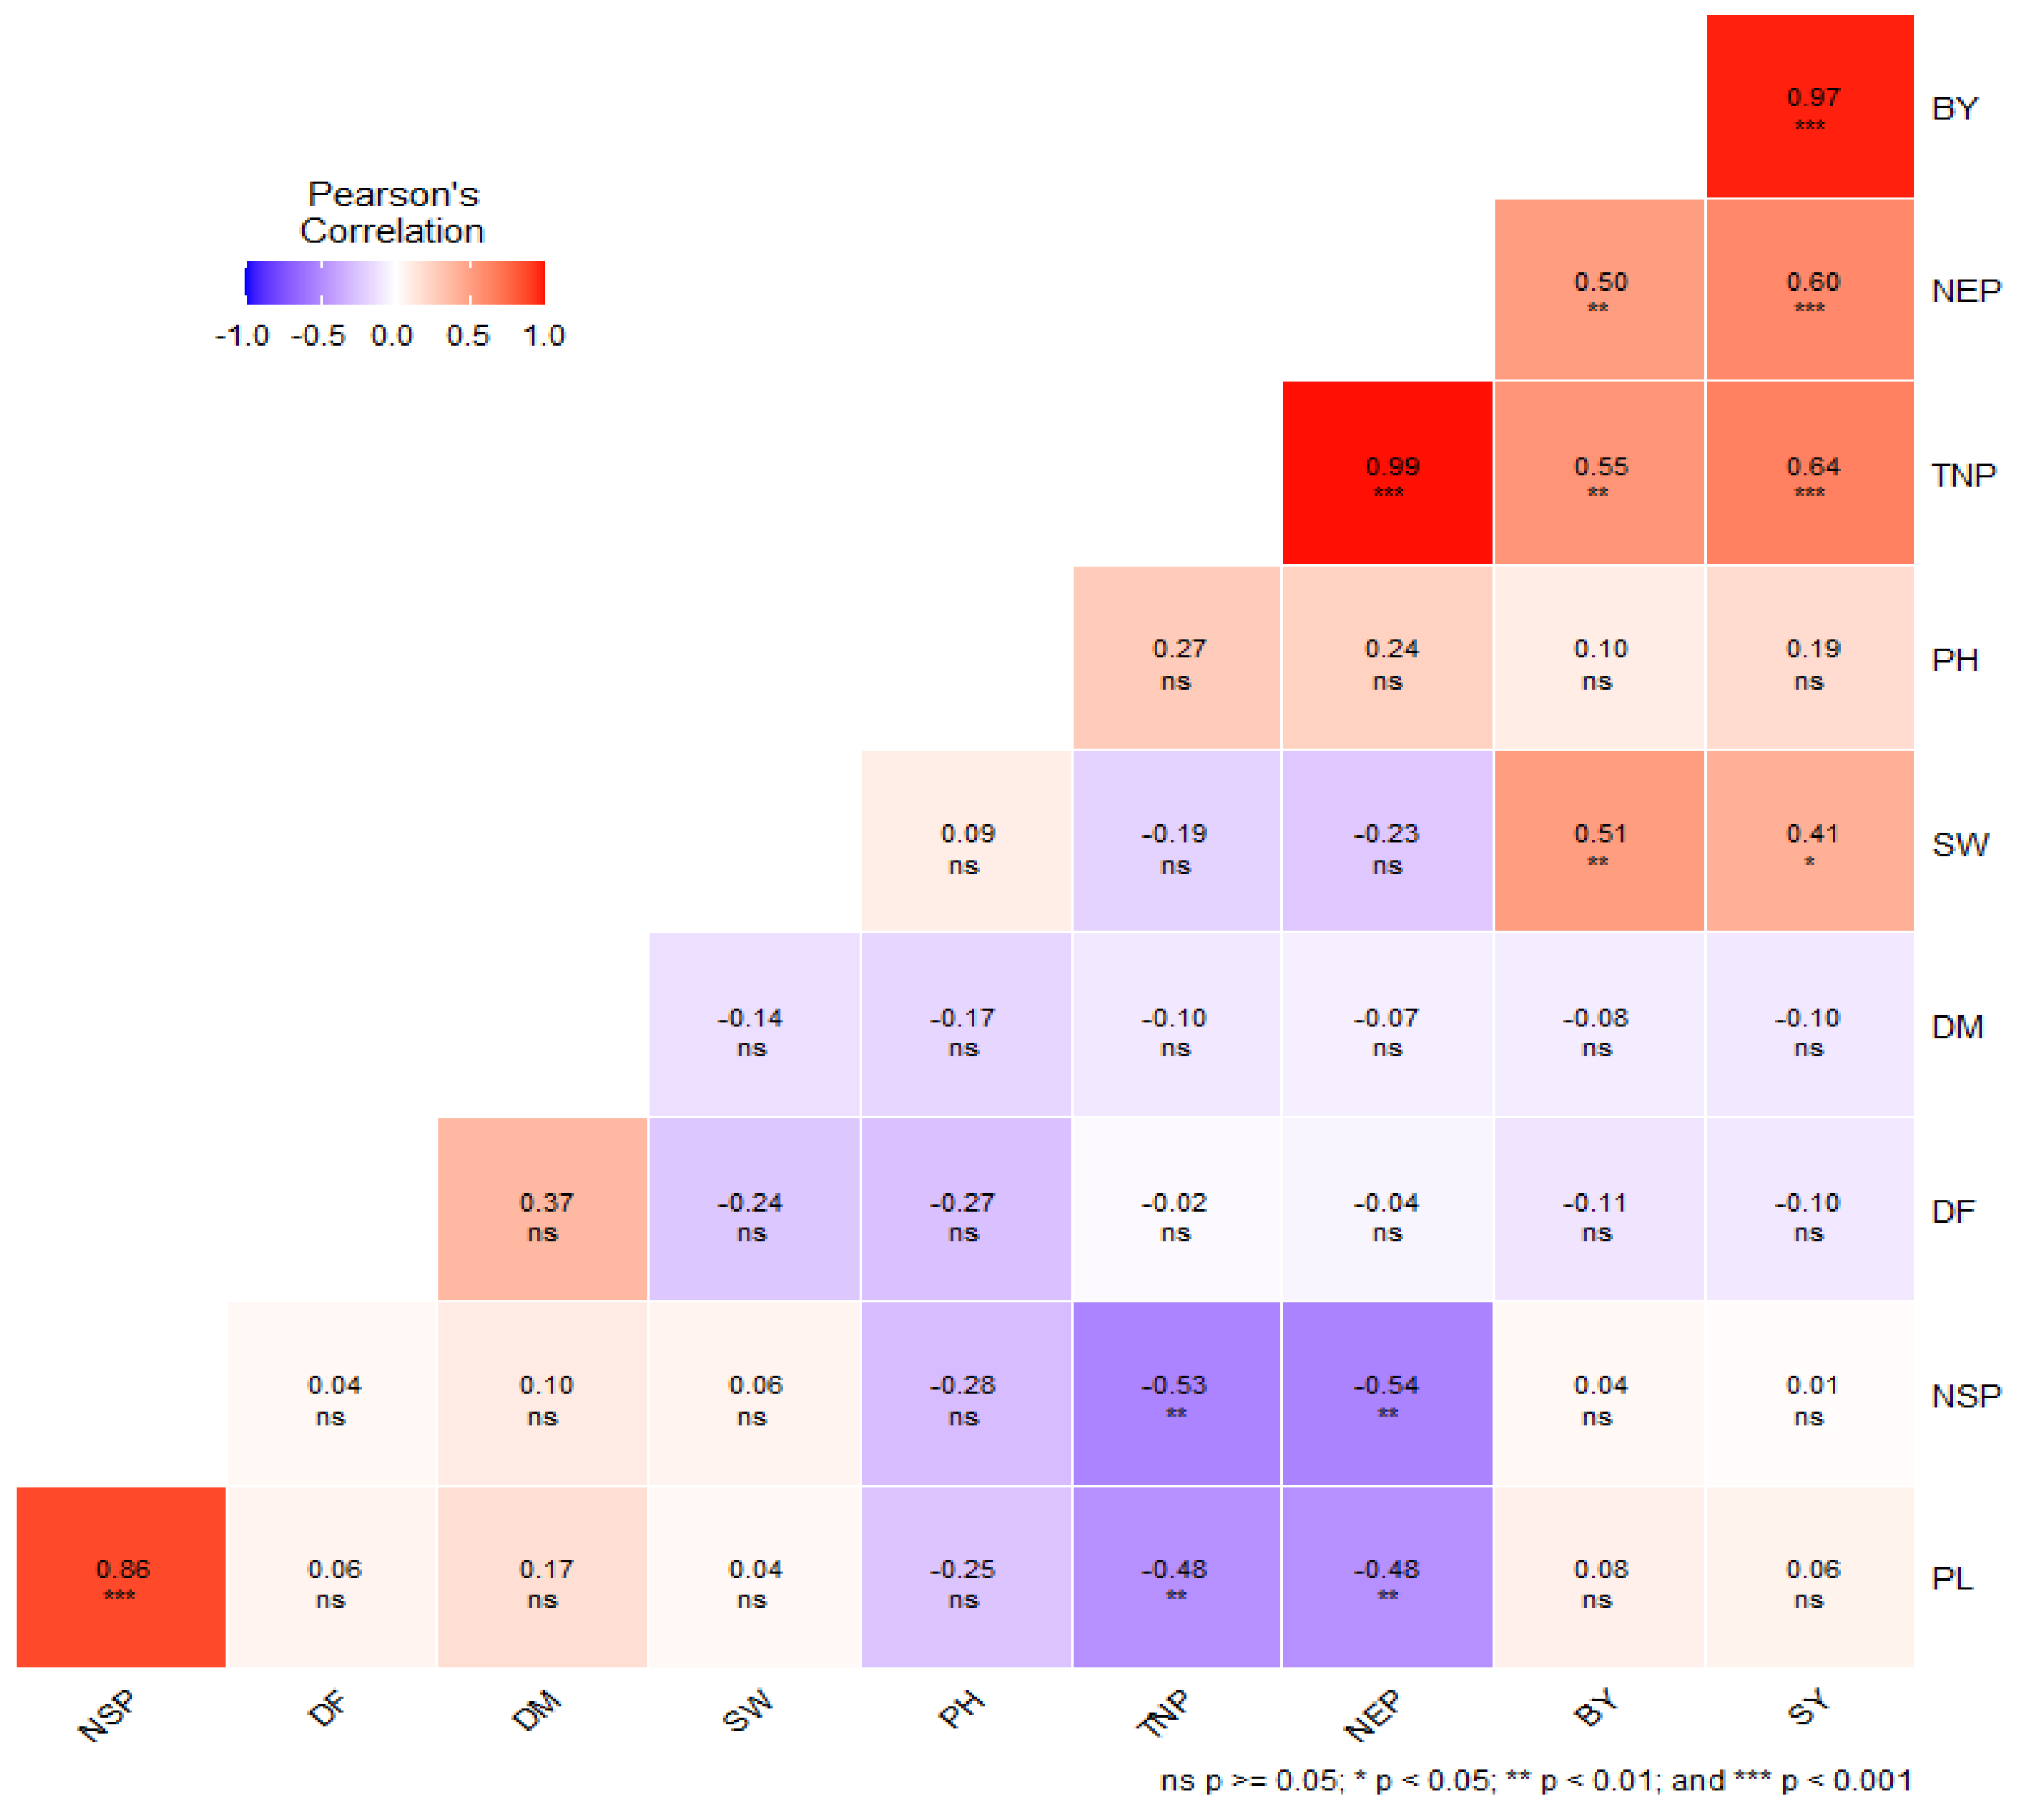
3.5. Correlation Analysis among Combining Abilities of Studied Traits

The evidence on the correlation of the GCA effect and SCA effect for different traits in field pea helps in understanding the genetic relationships between yield traits. The influence of additive and non-additive gene actions in traits is linked to the correlation existing between the general combining abilities (GCAs) or specific combining abilities (SCAs) of those particular traits. Estimates of GCA or SCA correlation between all possible pairs of traits are depicted in Figure 1 and Figure 2, respectively. For GCA, SY exhibited a significant positive correlation with BY (r = 0.96 ***), TNP (r = 0.75 *) and NEP (r = 0.71 *), but in the case of SCA, BY (r = 0.97 ***), TNP (r = 0.64 ***), NEP (r = 0.60 ***) and SW (r = 0.41 *) had a significant positive correlation with SY. The correlation analysis indicated that the relationship between the GCAs of the two traits could either align or diverge from the correlation observed between the SCAs, as depicted in Figure 1 and Figure 2. These findings suggest that there is an additive gene action for BY, TNP and NEP, whereas a non-additive gene action predominates for SW. The correlation matrix shows the relationship among various traits. These findings are in agreement with Pratap et al. [24], Singh et al. [50], Kumawat et al. [51] and Prasad et al. [52]. Based on these findings, we can understand the key contributions of GCA and SCA in elucidating the genetic association within yield traits. Consequently, it is strongly advised that crop breeders take into account both GCA and SCA, along with their correlations, when selecting parental lines with the goal of developing heterotic hybrid genotypes.

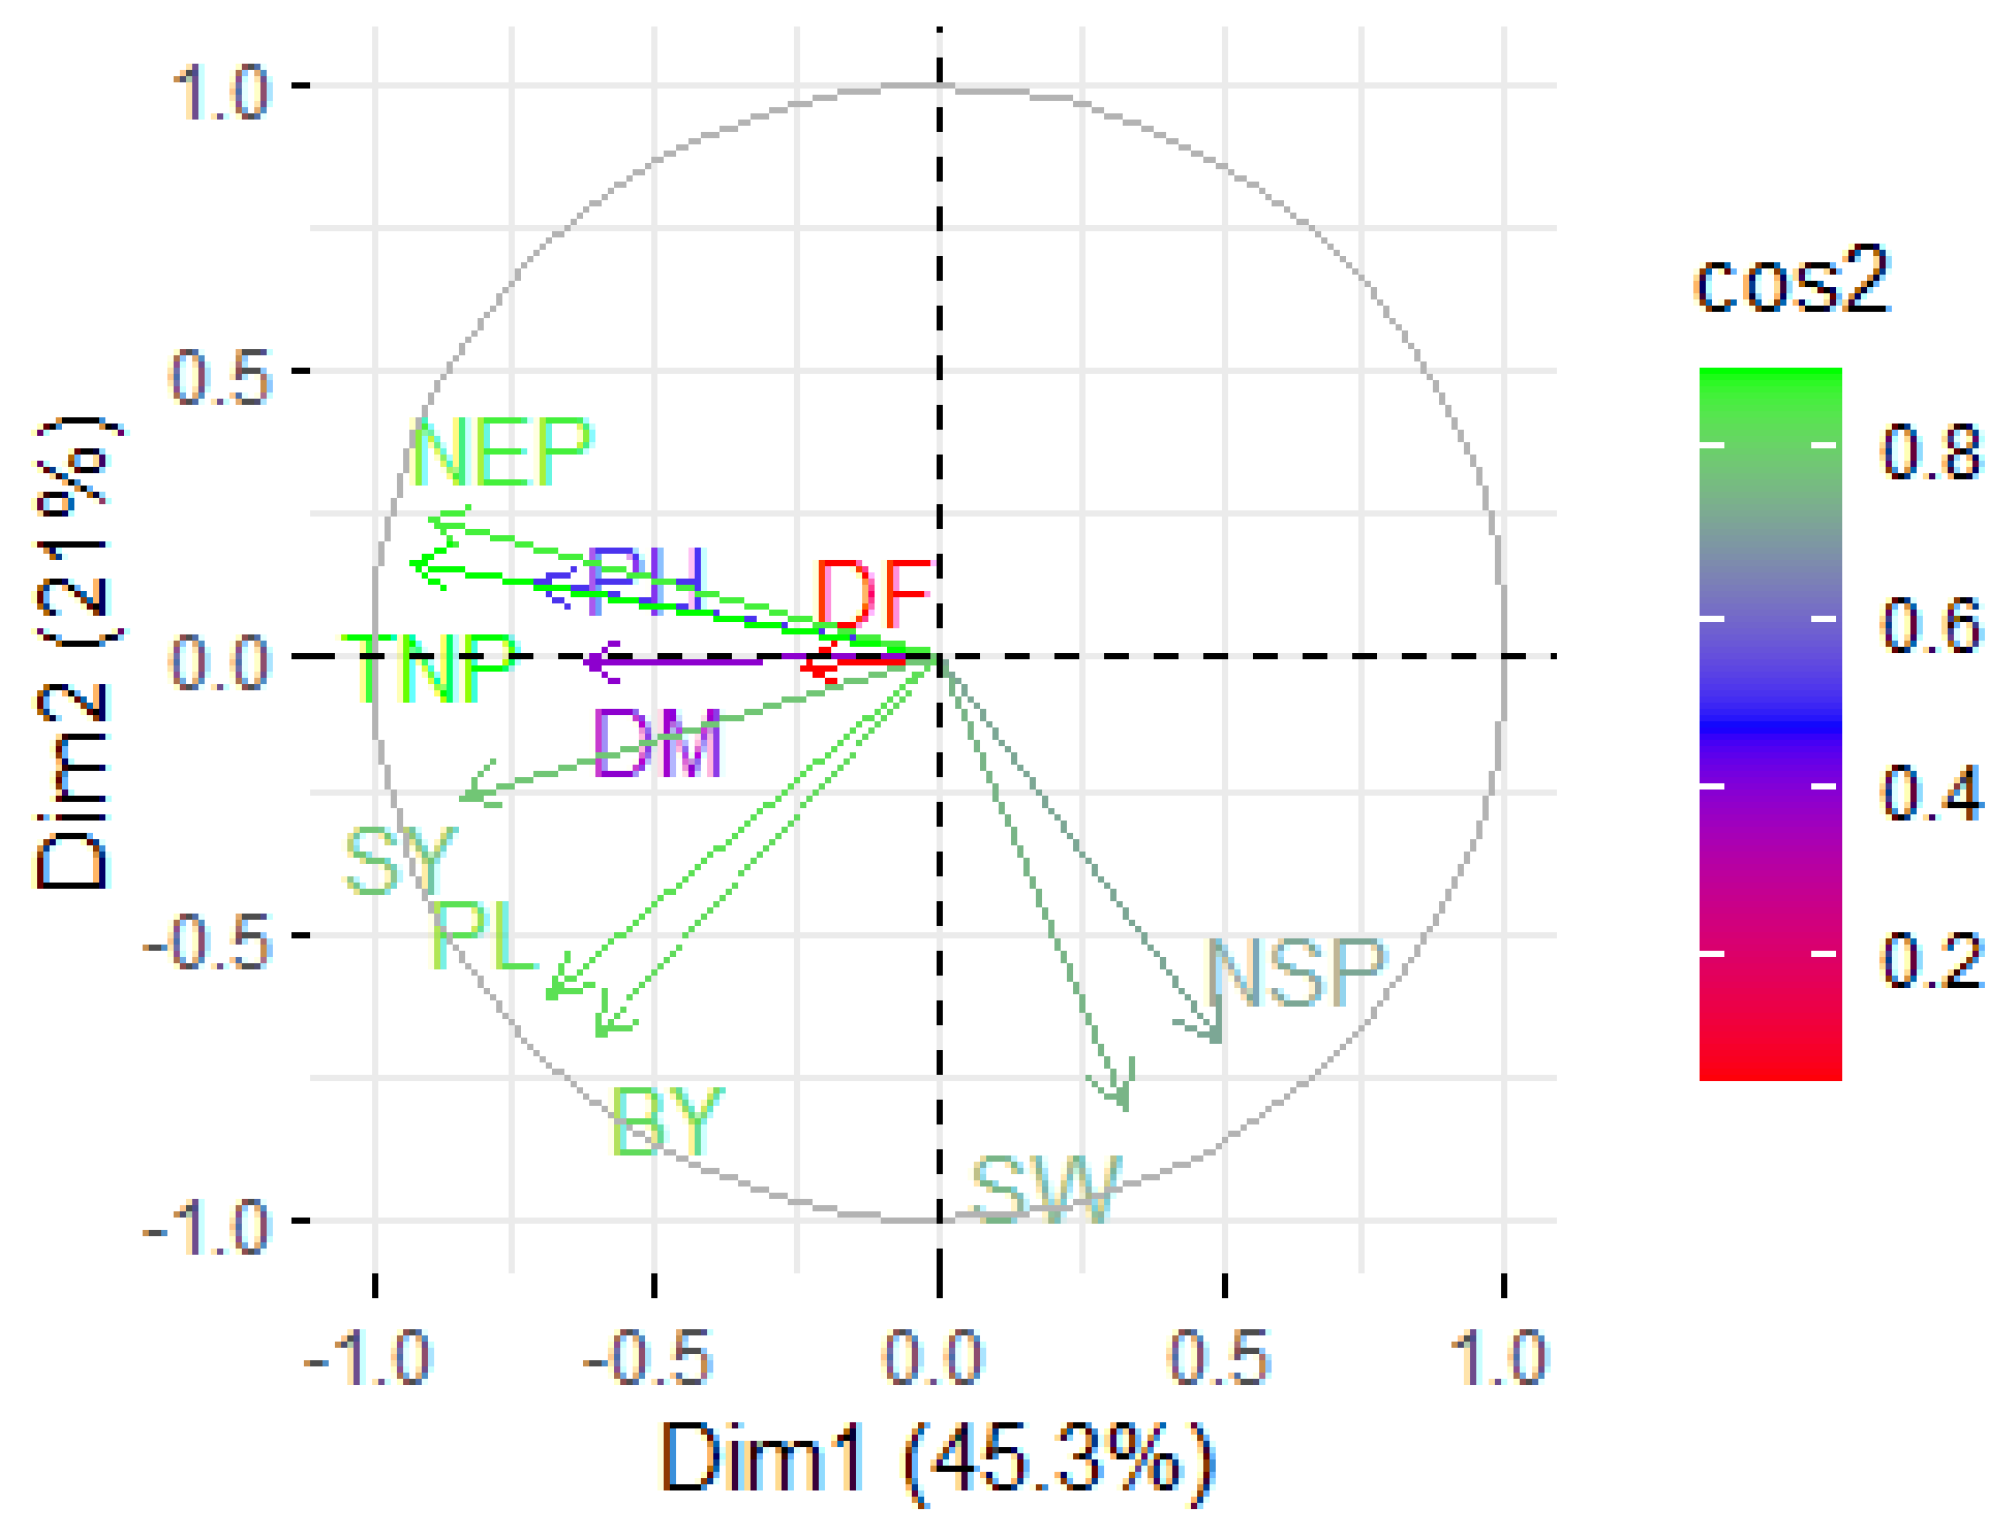
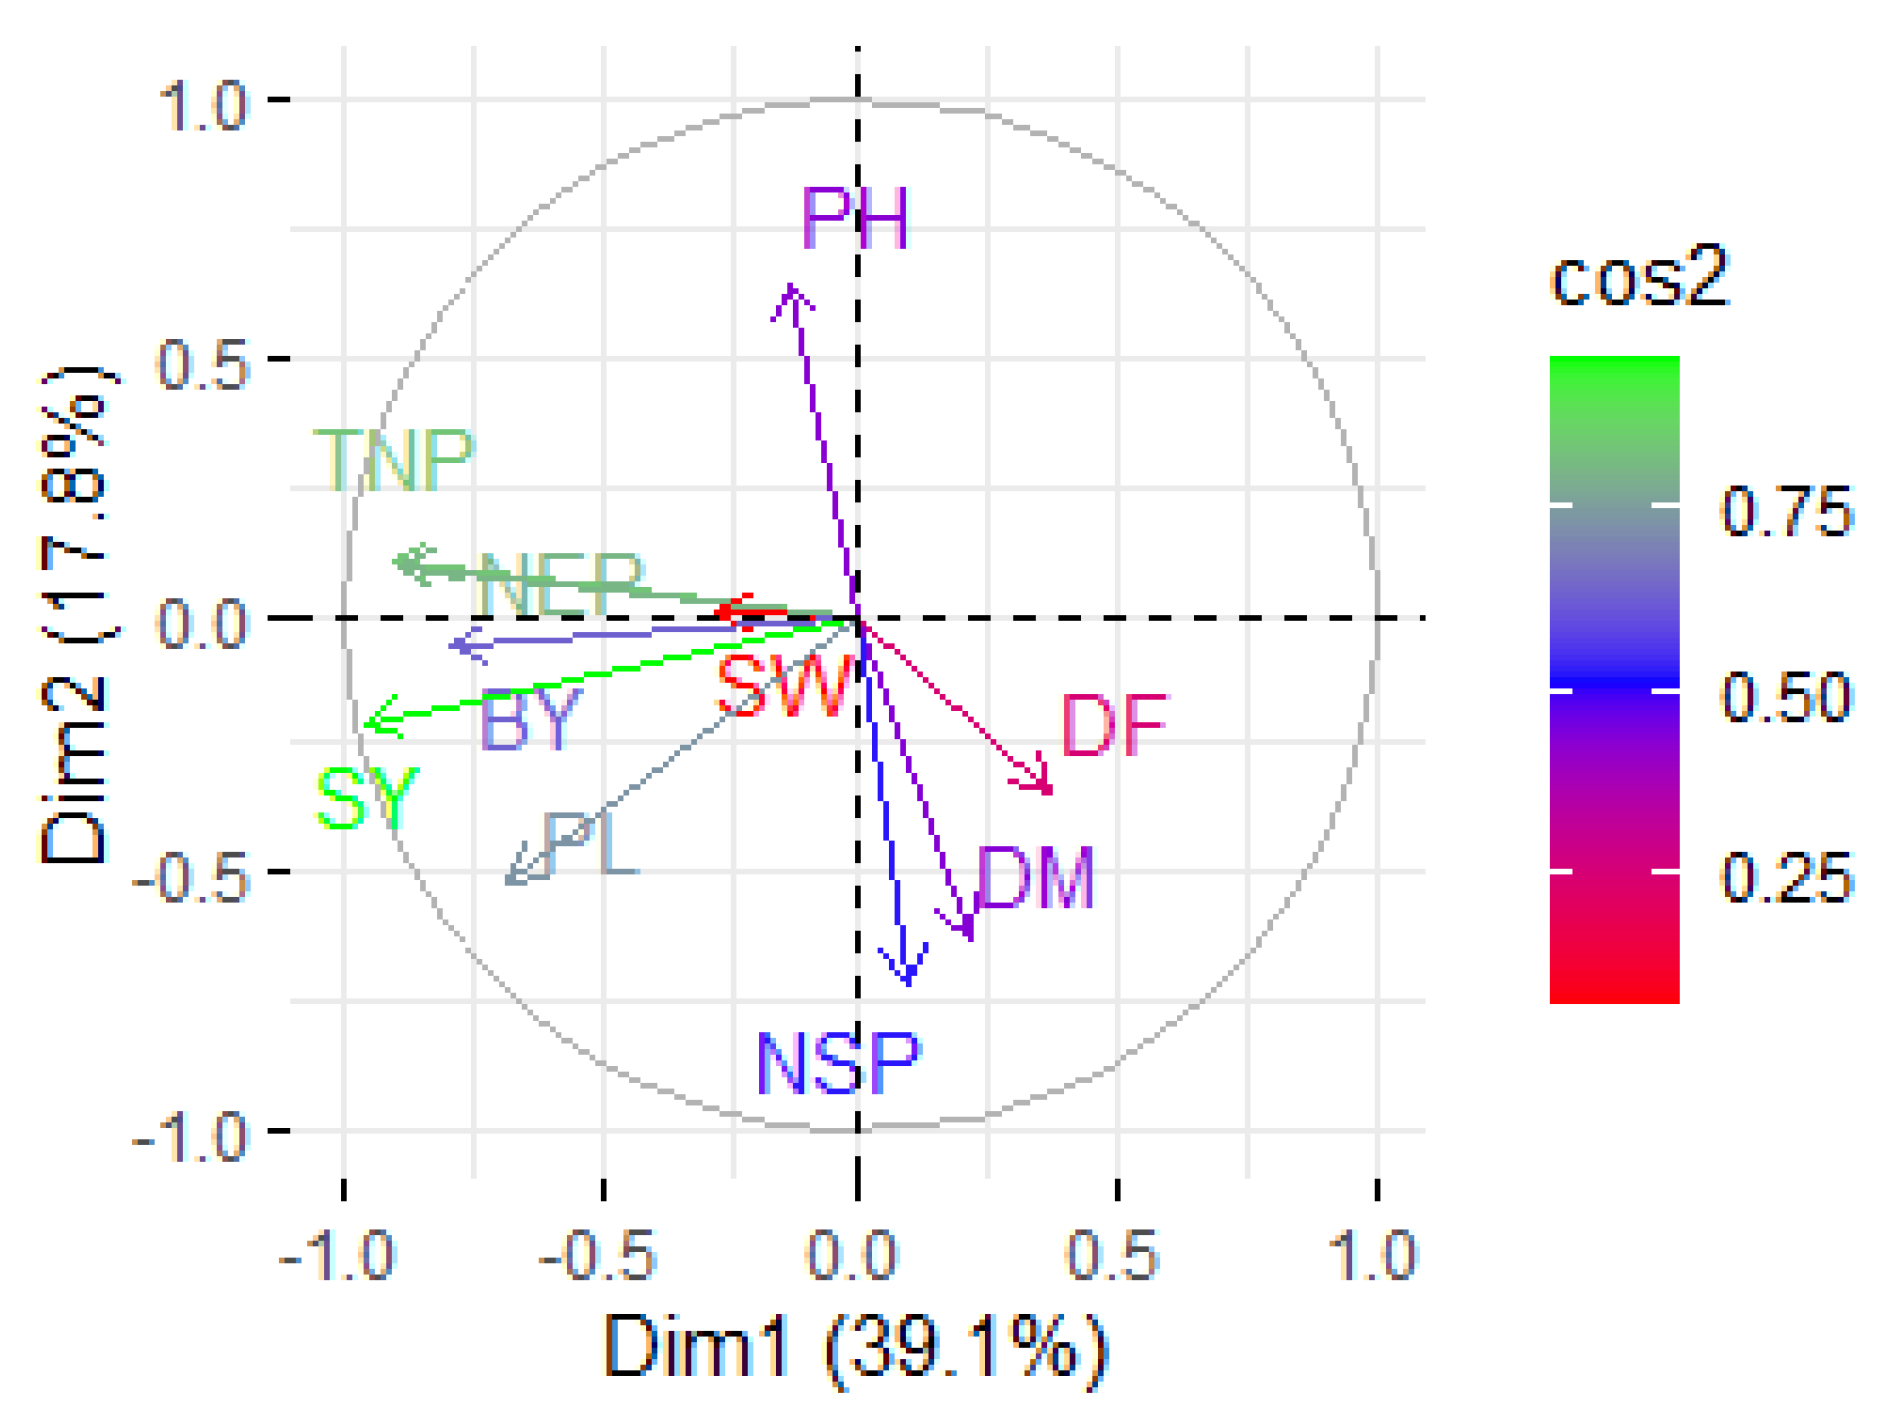
3.6. Principal Component Analysis

Selection that is dependent on the grouping of attributes may result in more effective criteria for improving the yield potential of field pea. A perusal of Table 8 shows that for parents, the first three principal components (PCs) with eigenvalue > 1 account for 81.68% variability existing in the parental genotypes for yield component traits, whereas 83.34% of the total variance is explained by the first four PCs in the principal component analysis of cross combinations with eigenvalue > 1 (Table 8). The PCA of parents and crosses revealed considerable variability among the traits. The first PC elucidates 45.31% and the second PC describes 21.01% of the overall variation for parents, whereas the first PC and second PC explain 39.14% and 17.84% of the variance for crosses, respectively. These findings demonstrated that traits that contribute significantly to the first two PCs are the principal discriminating traits. To determine the association between studied traits and appropriate high yield, the biplots of the examined traits of field pea for parents and crosses are shown in Figure 3 and Figure 4, respectively. As there was a very small angle between the corresponding vectors of the above traits, the biplot for both parents and crosses reveals a significant association of SY with TNP, NEP and BY. This suggests that positive selection of TNP, NEP and BY may indirectly help in the selection of suitable high-yielding genotype(s). These consequences are in agreement with Pratap et al. [24], Parihar et al. [53], Mohapatra et al. [54], Hanci and Cebaci [55] and Umar et al. [56].

4. Conclusions

The results of the current investigation revealed that almost all studied traits were determined by both additive and non-additive gene action. The utilization of combining ability analysis has effectively pinpointed promising parents and crosses that can serve as foundational elements for developing a well-defined strategy aimed at enhancing field pea cultivation. The genotypes Aman and P-1297-97 might be used as good combiners for higher seed yield inbreeding programs. These genotypes may combine well with other genotypes to produce superior progeny. In addition to seed yield, Aman, the best genotype in the study, was also a good general combiner for TNP, NEP, PL, NSP and BY, while the parent P-1297-97 also had good GCA for DF, PH, SW and BY. The best specific combining crosses for seed yield were P-1541-16 × P-1297-97, P-1297-97 × P-92-97-11, P-1541-16 × P-92-97-11, HFP 1314 × Aman and Aman × EC 564817, as these crosses had high significant SCA and high significant positive economic heterosis for SY. These crosses alsostood out as specific cross combinations for most traits. Moreover, the correlation between GCA effects or SCA effects for different traits suggested the additive gene action for BY, TNP and NEP, whereas a non-additive gene action predominated for SW. The crosses P-1541-16 × P-92-97-11 and P-1541-16 × P-1297-97 displayed significant heterosis toward the better-parent and control variety in the desired direction for seed yield and associated traits. As evident from the results, the PCA of parents and crosses revealed considerable variability among the traits. The inheritance patterns of yield and its attributing traits primarily exhibited non-additive gene effects, implying that harnessing heterosis breeding would be the more favorable approach for achieving rapid advancements in field pea cultivation. Consequently, the crossesP-1541-16 × P-1297-97, P-1297-97 × P-92-97-11, P-1541-16 × P-92-97-11, HFP 1314 × Aman and Aman × EC 564817 might be used in further breeding programs to obtain desirable segregants in later generations.

Supplementary Materials

The following supporting information can be downloaded at: https://www.mdpi.com/article/10.3390/horticulturae9090997/s1, Figure S1: Box plots for comparison of average performance of all the 8 parents (P) and 28 crosses (H) to different traits (A to J) under study. The upper and lower line outside box represents the maximum and minimum adjacent values, respectively. The dark black line within the box represents median value. The upper and lower hinge represent 75% and 25% percentile, respectively. Outliers are represented by circle ‘o’.; Table S1: Estimates of heterobeltiosis and economic heterosis for days to 50% flowering, maturity, plant height, total number of pods per plant, effective pods per plant and pod length of field pea crosses; Table S2: Estimates of heterobeltiosis and economic heterosis for number of seeds per pod, 100-seed weight, biological yield per plant and seed yield per plant of field pea crosses; Table S3: Parents and crosses possess good CGA and SCA effects for different traits in field pea.

Author Contributions

Conceptualization: V.S. (Vijay Sharma), M.K. and I.Y.; methodology: V.S. (Vijay Sharma), S.K.S. and I.Y.; formal analysis: P.K.P., P.S.D. and A.Y.; data curation: I.Y. and K.; writing—original draft preparation: I.Y., A.M., V.S. (Vijay Sharma) and P.K.P.; writing—review and editing: P.K., P.S.D., A.Y., L.P.Y. and M.Y.; visualization: P.K. and V.G.; investigation: I.Y.; resources: M.K.; supervision: V.S., S.K.S. and K.; validation: I.Y., P.K.P. and V.S. (Vijay Sharma); software: V.S. (Vivek Singh) and A.M. All authors have read and agreed to the published version of the manuscript.

Funding

This research received no external funding.

Data Availability Statement

Not applicable.

Conflicts of Interest

The authors declare no conflict of interest.

References

  1. Olle, M.; Williams, I.H.; Rosa, E.; Tamm, S. Finding best field pea (Pisum sativum L.) cultivars for breeding in Northern climatic conditions. Acta Agric. Scand. B Soil Plant Sci. 2020, 70, 1–7. [Google Scholar] [CrossRef]
  2. Zohary, D.; Hopf, M. Domestication of Plants in the Old World, 3rd ed.; Oxford University Press: Oxford, UK, 2000; p. 316. [Google Scholar]
  3. Bhat, T.A.; Gupta, M.; Ganai, M.A.; Ahanger, R.A.; Bhat, H.A. Yield, soil health and nutrient utilization of field pea (Pisum sativum L.) as affected by phosphorus and Biofertilizers under subtropical conditions of Jammu. Int. J. Plant Animal Sci. 2013, 1, 1–8. [Google Scholar]
  4. Gregory, E.; Shana, F.; Hans, K.; Julie, P.; Michael, W.; Janet, K.; Kenneth, H. Field Pea Production A1166 (Revised); Extension Service; North Dakota State University: Fargo, ND, USA, 2016. [Google Scholar]
  5. Stone, A.K.; Karalash, A.; Tyler, R.T.; Warkentin, T.D.; Nickerson, M.T. Functional attributes of pea protein isolates prepared using different extraction methods and cultivars. Food Res. Int. 2015, 76, 31–38. [Google Scholar] [CrossRef]
  6. Makasheva, R.K. The Pea. Russian Translations Series, 16; A. A. Balkema: Rotterdam, The Netherlands, 1984. [Google Scholar]
  7. Stagnari, F.; Maggio, A.; Galieni, A.; Pisante, M. Multiple benefits of legumes for agriculture sustainability: An overview. Chem. Biol. Technol. Agric. 2017, 4, 2. [Google Scholar] [CrossRef]
  8. AICRP on MuLLaRP. Project Coordinator’s Report of AICRP-MULLaRP; Indian Institute of Pulse Research: Kanpur, India, 2022. [Google Scholar]
  9. DES. Annual Report 2021–2022, Directorate of Economics and Statics; Department of Agriculture Cooperation and Farmers Welfare: New Delhi, India, 2022.
  10. Griffing, B. Concepts of general and specific combining ability in relation to diallel crossing system. Aust. J. Biol. Sci. 1956, 9, 463–493. [Google Scholar] [CrossRef]
  11. Kumar, M.; Jeberson, M.S.; Singh, N.B.; Sharma, R. Genetic analysis of seed yield and its contributing traits and pattern of their inheritance in field pea (Pisum sativum L.). Int. J. Curr. Microbiol. Appl. Sci. 2017, 6, 172–181. [Google Scholar] [CrossRef]
  12. Suman, H.; Kumar, B.; Nageshwar; Rathi, M.; Tamatam, D. Heterosis and combining ability for grain yield and yield associated traits in 10 × 10 diallel analysis in pea (Pisum sativum L.). Int. J. Curr. Microbiol. Appl. Sci. 2017, 6, 1574–1585. [Google Scholar] [CrossRef]
  13. Yadav, V.; Sao, A.; Gauraha, D. Combining ability analysis for yield and attributing traits in field pea (Pisum sativum L.). Int. J. Curr. Microbiol. Appl. Sci. 2019, 8, 1976–1981. [Google Scholar] [CrossRef]
  14. Bardisi, S.A.; Zyada, H.G. Combining ability and heterosis for yield and quality traits in pea (Pisum sativum L.). Sci. J. Agric. Sci. 2021, 3, 78–86. [Google Scholar] [CrossRef]
  15. Sharma, V.; Dodiya, N.S.; Dubey, R.B.; Khandagale, S.G.; Khan, R. Combining ability analysis over environments in bread wheat. Electron. J. Plant Breed. 2019, 10, 1397–1404. [Google Scholar] [CrossRef]
  16. Khan, R.; Ranwah, B.R.; Sharma, V.; Khandagale, S. Combining ability analysis for grain and fodder traits in sorghum [Sorghum bicolor (L.) Moench]. Bangladesh J. Bot. 2020, 49, 487–497. [Google Scholar] [CrossRef]
  17. Sprague, G.F.; Tatum, L.A. General vs specific combining ability in single crosses of corn. Agronomy 1942, 34, 923–932. [Google Scholar] [CrossRef]
  18. Cockerham, C.C. Implication of genetic hybrids breeding programme. Crop Sci. 1961, 1, 47–52. [Google Scholar] [CrossRef]
  19. Shull, G.H. A pure line method of com breeding. Am. Breed. Assoc. Rep. 1909, 5, 51–59. [Google Scholar]
  20. Gupta, D.K.; Acharya, S.; Patel, J.B. Combining ability and heterosis studies in pigeon pea using A2 cytoplasm from Cajanus scarabaeoides as source of male sterility. J. Food Legumes 2011, 24, 58–64. [Google Scholar]
  21. Rebika, T. Heterosis Study for Yield and Yield Components in Pea (Pisum sativum L.). Int. J. Curr. Microbiol. Appl. Sci. 2017, 6, 45–50. [Google Scholar] [CrossRef]
  22. Joshi, D.J.; Ravindrababu, Y.; Patel, A.M. Diallel analysis in field pea [Pisum sativum (L.) var. arvense]. Electron. J. Plant Breed. 2016, 7, 611–619. [Google Scholar] [CrossRef]
  23. Directorate of Pulse Development (DPD). Department of Agriculture Cooperation and Farmers Wlefare; Government of India: New Delhi, India, 2017.
  24. Pratap, V.; Sharma, V.; Kumar, H.; Kamaluddin; Shukla, G.; Kumar, M. Multivariate Analysis of Quantitative Traits in Field Pea (Pisum sativum var. arvense). Legume Res. 2021, 1, 6. [Google Scholar] [CrossRef]
  25. Sharma, V.; Singh, C.M.; Chugh, V.K.; Prajapati, P.K.; Mishra, A.; Kaushik, P.; Dhanda, P.S.; Yadav, A.; Satyendra. Morpho-Physiological and Biochemical Responses of Field Pea Genotypes under Terminal Heat Stress. Plants 2023, 12, 256. [Google Scholar] [CrossRef]
  26. Software, R. The R Studio for Statistical Computing. 2023. Available online: https://posit.co/download/rstudio-desktop/ (accessed on 25 June 2023).
  27. Panse, V.C.; Sukhatme, P.V. Statistical Methods for Agricultural Workers; Indian Council of Agricultural Research: New Delhi, India, 1985. [Google Scholar]
  28. Fonseca, S.; Patterson, F.L. Hybrid vigour in seven-parental diallel crosses in common winter wheat (Triticum aestivum L.). Crop Sci. 1968, 8, 85–88. [Google Scholar] [CrossRef]
  29. Meredith, W.R.; Bridge, R.R. Heterosis and gene action in cotton (Gossypium hirsutam). Crop Sci. 1972, 12, 304–310. [Google Scholar] [CrossRef]
  30. Tampha, S.; Jeberson, M.S.; Sastry, E.V.D.; Shashidhar, K.S.; Sharma, R.P. Line × tester analysis for yield and its contributing traits in field pea (Pisum sativum L.). Pharma Innov. J. 2018, 7, 104–109. [Google Scholar]
  31. Pratap, V.; Sharma, V.; Kamaluddin; Shukla, G. Assessment of genetic variability and relationship between different quantitative traits in field pea (Pisum sativum var. arvense) Germplasm. Legume Res. 2021, 1, 6. [Google Scholar] [CrossRef]
  32. Ceyhan, E.; Avci, M.A.; Karadas, S. Line x Tester analysis in pea (Pisum sativum L.): Identification of superior parents for seed yield and its components. Afr. J. Biotechnol. 2008, 7, 2810–2817. [Google Scholar]
  33. Kumar, C.S.; Sreelakshami, C.H.; Verma, P.K. Studies on combining ability and heterosis in pigeon pea (Cajanus cajan L.). Legume Res. 2009, 32, 92–97. [Google Scholar]
  34. Kumar, D.; Malik, S.; Kumar, A.; Singh, S.K.; Kumar, S. Studies on combining ability through line x tester analysis in garden pea (Pisum sativum L.). Ann. Hortic. 2016, 9, 64–72. [Google Scholar] [CrossRef]
  35. Hasan, M.N.M.; Abd El-Aty, Y.Y.; Zayed, G.A.; Abd El Lah, H.S. Heterosis, correlation and gene action in some genotypes of pea (Pisum sativum L.). Minia 2nd Conf. Agri. Environ. Sci. 2010, 3, 151–160. [Google Scholar]
  36. Brar, P.S.; Dhall, R.K.; Dinesh. Heterosis and combining ability in garden pea (Pisum sativum L.) for yield and its contributing traits. Veg. Sci. 2012, 39, 51–54. [Google Scholar]
  37. Galal, R.M.; Mohamed, A.G.; Ismail, E.E.M. Genetic analysis of some crosses for yield and its components and earliness in pea (Pisum sativum L.). Egypt. J. Hortic. 2019, 46, 1–11. [Google Scholar] [CrossRef]
  38. Hama-Amin, T.N. Half diallel analysis of seven pea cultivars for seed yield and its components for F4 generation under Sulaimani condition. Iraqi J. Agric. Sci. 2020, 51, 600–610. [Google Scholar] [CrossRef]
  39. Towfiq, S.I.; Hama-Amin, T.N.; Ahmed, D.A.; Aziz, O.K. Half diallel analysis for F3 generation of pea (Pisum sativum L.) under Sulaimani condition, Iraq Kurdistan region. Iraqi J. Agric. Sci. 2020, 51, 848–855. [Google Scholar] [CrossRef]
  40. Kumar, M.; Gupta, R.K.; Kumar, S.; Samnotra, R.K.; Bhushan, A.; Dey, T. Combining ability studies for various horticultural traits in garden pea (Pisum sativum L.). Int. J. Curr. Microbiol. Appl. Sci. 2020, 9, 841–853. [Google Scholar] [CrossRef]
  41. Manjunath, B.; Devaraju, V.; Srinivasa, M.; Hanumantappa, D.; Lakshmana; Aghora, T.S. Combining Ability Studies for Yield and Yield Contributing Traits in Garden Pea (Pisum sativum L.). Int. J. Curr. Microbiol. App. Sci. 2020, 9, 3261–3268. [Google Scholar] [CrossRef]
  42. Kumar, S.; Katoch, V.; Bharti, A.; Sharma, S.; Sharma, A.; Kumari, V. Heterosis, inbreeding depression and combining ability studies in garden pea (Pisum sativum L.). Legume Res. 2021, 44, 268–274. [Google Scholar] [CrossRef]
  43. Boraiah, K.M.; Byregowda, M.; Keerthi, C.M.; Vijayakumar, H.P.; Ramesh, S.; Reena, M. Frequency of heterotic hybrids in relation to parental genetic divergence and general combining ability in blackgram [Vigna mungo (L.) Hepper]. Legume Res. 2019, 42, 595–602. [Google Scholar] [CrossRef]
  44. Enrique, L.C.; María, A.E.; Lenna, G.; Fernando, S.L.A. Combining abilities and heterotic groups in Pisum sativum L. Aust. J. Crop Sci. 2013, 7, 1634–1641. [Google Scholar]
  45. Kosev, V. A brief study on the combining abilities of quantitative traits in field pea (Pisum sativum L.). Pinnacle Biol. Sci. 2013, 1, 5. [Google Scholar]
  46. Sharma, B.B.; Sharma, V.K.; Dhar, S. Combining ability studies for yield and other horticultural traits in garden pea (Pisum sativum var. hortense L.). Indian J. Hortic. 2015, 72, 500–505. [Google Scholar] [CrossRef]
  47. Katoch, V.; Bharti, A.; Sharma, A.; Rathore, N.; Kumari, V. Heterosis and combining ability studies for economic traits in garden pea (Pisum sativum L.). Legume Res. 2019, 42, 153–161. [Google Scholar] [CrossRef]
  48. Sharma, V.; Dodiya, N.S.; Dubey, R.B.; Khan, R. Combining ability analysis in bread wheat (Triticum aestivum (L.) Em. Thell) under different environmental conditions. Bangladesh J. Bot. 2019, 48, 85–93. [Google Scholar] [CrossRef]
  49. Khandagale, S.G.; Sharma, V.; Lone, R.P.; Khandagale, V.G.; Kumara-Swamy, R.V. Combining ability analysis and gene action in pearl millet [Pennisetum glaucum (L.) R. Br.]. Electron. J. Plant Breed. 2014, 5, 445–450. [Google Scholar]
  50. Singh, S.K.; Mazeed, A.; Singh, V.P.; Srivastava, S.; Dwivedi, A.K.; Yadav, S.K.; Srivastava, R.K. Evaluation of Seed Yield and Genetic Divergence in the Germplasms of field pea. J. Pharmacogn. Phytochem. 2017, 1, 1016–1021. [Google Scholar]
  51. Kumawat, P.K.; Singh, P.; Singh, D.; Mukherjee, S.; Kumawat, M. Study of correlation and path analysis for green pod yield and its contributing traits in vegetable pea (Pisum sativum L.). Int. J. Curr. Microbiol. Appl. Sci. 2018, 7, 3497–3502. [Google Scholar] [CrossRef]
  52. Prasad, D.; Verma, O.P.; Lal, K.; Verma, H.; Jaiswal, A.; Yadav, M.K. Identification of elite genotypes for certain quantitative traits in field pea (Pisum sativum L. var. arvense). J. Pharmacogn. Phytochem. 2019, 8, 498–505. [Google Scholar]
  53. Parihar, A.K.; Dixit, G.P.; Pathak, V.; Singh, D. Assessment of the genetic components and trait associations in diverse set of Field pea (Pisum sativum L.) genotypes. Bangladesh J. Bot. 2014, 43, 323–330. [Google Scholar] [CrossRef]
  54. Mohapatra, C.; Chand, R.; Tiwari, J.K.; Singh, A.K. Effect of heat stress during flowering and pod formation in pea (Pisum sativum L.). Physiol. Mol. Biol. Plants 2019, 26, 1119–1125. [Google Scholar] [CrossRef]
  55. Hanci, F.; Cebeci, E. Determination of morphological variability of different Pisum genotypes using principal component analysis. Legume Res. 2018, 42, 162–167. [Google Scholar] [CrossRef]
  56. Umar, H.M.I.; Rehman, S.U.; Bilal, M.; Naqvi, A.H.; Manzoor, S.A.; Ghafoor, A.; Khalid, M.; Iqbal, M.T.; Qayyum, A.; Ahmad, F.; et al. Evaluation of genetic diversity in pea (Pisum sativum L.) based on morpho-agronomic characteristics for yield and yield associated traits. J. Biodiver. Environ. Sci. 2014, 4, 321–328. [Google Scholar]
Figure 1. Estimates of Pearson correlation between GCA effect of different traits in field pea.
Horticulturae 09 00997 g001
Figure 2. Estimates of Pearson correlation between SCA effect of different traits in field pea.
Horticulturae 09 00997 g002
Figure 3. Biplot for different traits of parental genotypes of field pea created using PC1 and PC2.
Horticulturae 09 00997 g003
Figure 4. Biplot for different traits of crosses of field pea created using PC1 and PC2.
Horticulturae 09 00997 g004
Table 1. Parental genotypes of field pea were utilized in the experiment.
S.N.GenotypeSource
1.P-1541-16IIPR, India
2.P-1297-97IIPR, India
3.HFP-1314IIPR, India
4.AmanIIPR, India
5.EC-564817IIPR, India
6.VikasIIPR, India
7.P-92-97-11IIPR, India
8.P-1426IIPR, India
Table 2. Cross combinations of field pea obtained from diallel (excluding reciprocal).
S.N.Cross Combination
1.P-1541-16 × P-1297-97
2.P-1541-16 × HFP-1314
3.P-1541-16 × Aman
4.P-1541-16 × EC-564817
5.P-1541-16 × Vikas
6.P-1541-16 × P-92-97-11
7.P-1541-16 × P-1426
8.P-1297-97 × HFP-1314
9.P-1297-97 × Aman
10.P-1297-97 × EC-564817
11.P-1297-97 × Vikas
12.P-1297-97 × P-92-97-11
13.P-1297-97 × P-1426
14.HFP-1314 × Aman
15.HFP-1314 × EC-564817
16.HFP-1314 × Vikas
17.HFP-1314 × P-92-97-11
18.HFP-1314 × P-1426
19.Aman × EC-564817
20.Aman × Vikas
21.Aman × P-92-97-11
22.Aman × P-1426
23.EC-564817 × Vikas
24.EC-564817 × P-92-97-11
25.EC-564817 × P-1426
26.Vikas × P-92-97-11
27.Vikas × P-1426
28.P-92-97-11 × P-1426
Table 3. Mean sum of square for different agro-morphological traits in field pea.
S.N.TraitsSource
RepGenotypeParentF1P vs. F1Error
df = 1df = 35df = 7df = 27df = 1df = 35
1DF0.4 ns112.2 *48.6 *23.4 *11.2 ns10.9
2DM6.1 ns28.3 *2.5 ns7.1 ns37.3 ns25.2
3PH329.8 *1623.4 *583.4 *356.5 *494.2 *87.4
4TNP153.1 *370.0 *114.0 *133.4 *100.126.5
5NEP 181.3 *358.7 *113.1 *131.9 *79.2 ns23.1
6PL0.2 *0.7 *0.2 ns0.6 *0.1 ns0.1
7NSP0.1 ns0.9 *0.2 *0.2 *0.1 ns0.1
8SW15.2 *11.0 *2.3 *2.3 *16.4 *0.8
9BY117.1 *655.4 *157.6 *144.2 *738.0 *60.3
10SY10.8 ns185.6 *80.9 *94.0 *195.2 *23.5
* Significant at p ≤ 0.05, ns—non-significant at p ≤ 0.05, df—degree of freedom.
Table 4. Average value and range of variation for different traits of field pea genotypes.
S.N.TraitsParents (n = 8)Cross (n = 28)
MeanRangeMeanRange
1DF65.956.0–85.067.855.5–79.5
2DM117.9113.0–120.5114.4109.0–119.0
3PH116.362.7–159.9128.968.1–168.3
4TNP54.627.9–70.756.623.6–91.7
5NEP51.125.4–68.553.021.6–89.8
6PL5.14.3–5.94.92.4–6.3
7NSP5.14.2–6.15.03.9–6.7
8SW15.711.7–18.517.913.2–21.9
9BY82.456.7–105.997.858.7–125.0
10SY35.315.2–46.244.415.1–59.6
Table 5. Combining ability mean square for different traits of field pea.
S. N-.TraitsSource σ 2 G C A σ 2 S C A
GCASCAError
[7][28][35]
1DF133.1 *36.8 *5.40.41
2DM7.3 ns15.9 *12.60.16
3PH1720.8 *584.4 *43.70.31
4TNP301.3 *155.9 *13.20.20
5NEP 282.4 *153.6 *12.00.19
6PL0.7 *0.3 *0.10.27
7NSP0.7 *0.4 *0.10.17
8SW9.2 *4.6 *0.40.21
9BY290.4 *337.1 *30.20.09
10SY74.0 *97.5 *11.80.07
* Significant at p ≤ 0.05, ns—Non-significant at p ≤ 0.05.
Table 6. Estimates of GCA effects of parents for different traits of field pea.
S.N.ParentsDFDMPHTNPNEPPLNSPSWBYSY
1.P-1541-161.84 *−0.01 ns−1.05 ns5.86 **5.65 **−0.29 **−0.47 **0.50 *6.88 **1.91 ns
2.P-1297-97−4.71 **−0.66 ns−14.95 **0.71 ns0.43 ns0.05 ns−0.00 ns1.25 **4.72 *2.86 *
3.HFP-1314−3.21 **−0.36 ns20.53 **−3.35 *−4.14 **−0.06 ns0.00 ns0.67 **−2.01 ns−0.82 ns
4.Aman4.44 **0.59 ns5.17 *8.15 **7.60 **0.21 *0.17 *−1.12 **6.91 **4.27 **
5.EC-5648173.49 **1.19 ns1.94 ns−5.02 **−4.89 **0.09 ns0.23 **−0.18 ns−4.35 *−1.29 ns
6.Vikas3.39 **0.99 ns−8.23 **−1.71 ns−1.12 ns−0.39 **−0.23 **−0.62 **−6.71 **−3.58 **
7.P-92-97-11−3.01 **−1.26 ns13.36 **3.15 *3.69 **−0.02 ns−0.03 ns−1.34 **−1.47 ns−0.98 ns
8.P-1426−2.21 *−0.46 ns−16.78 **−7.78 **−7.21 **0.40 **0.34 **0.83 **−3.97 *−2.37 ns
* Significant at p ≤ 0.05, ** significant at p ≤ 0.01, ns—non-significant at p ≤ 0.05.
Table 7. Estimates of SCA effects of 28 crosses for different traits of field pea.
S.N.CrossesDFDMPHTNPNEPPLNSPSWBYSY
1.P-1541-16 × P-1297-970.03 ns3.49 ns25.90 **12.68 **11.51 **−0.26 ns−0.29 *1.15 *2.64 ns7.40 *
2.P-1541-16 × HFP-13145.03 *−5.81 *−19.83 **12.15 **10.75 **−0.53 **−0.4 **−1.77 **−1.99 ns1.55 ns
3.P-1541-16 × Aman−7.62 **−3.76 ns13.49 *17.27 **19.71 **−0.70 **−0.48 **−0.22 ns3.64 ns1.67 ns
4.P-1541-16 × EC-5648174.83 *−0.86 ns16.77 **0.26 ns−0.6 ns−0.02 ns−0.26 ns2.88 **19.10 **8.35 **
5.P-1541-16 × Vikas−1.07 ns−5.16 ns6.54 ns1.59 ns−0.25 ns−0.73 **−0.42 **−0.23 ns−10.09 *−6.82 *
6.P-1541-16 × P-92-97-1111.83 **3.09 ns−31.26 **1.81 ns−0.42 ns−0.1 ns0.20 ns2.40 **25.22 **10.05 **
7.P-1541-16 × P-1426−1.97 ns−1.71 ns31.09 **8.06 **7.16 *0.06 ns−0.63 **−0.33 ns5.98 ns2.21 ns
8.P-1297-97 × HFP-1314−2.42 ns−5.16 ns36.07 **−9.27 **−10.44 **−0.15 ns−0.18 ns2.53 **−8.27 ns−4.50 ns
9.P-1297-97 × Aman−1.57 ns1.39 ns48.24 **0.54 ns−0.93 ns0.07 ns−0.08 ns−0.77 ns−3.34 ns−1.58 ns
10.P-1297-97 × EC-5648173.88 *0.79 ns−36.43 **−26.14 ns−24.23 **0.61 **0.91 **−0.01 ns−32.00 **−19.14 **
11.P-1297-97 × Vikas−1.52 ns1.99 ns−17.26 **9.19 **10.8 **0.48 *0.31 *−1.68 **16.22 **9.26 **
12.P-1297-97 × P-92-97-11−3.12 ns−12.76 **12.19 *2.29 ns1.01 ns−0.03 ns−0.07 ns2.45 **15.86 **9.25 **
13.P-1297-97 × P-14268.58 **3.94 ns−22.61 **1.56 ns0.15 ns0.14 ns−0.20 ns1.22 *4.58 ns−0.41 ns
14.HFP-1314 × Aman−1.57 ns0.06 ns−29.04 **0.31 ns0.93 ns0.27 ns−0.08 ns1.03 *11.83 *5.93 *
15.HFP-1314 × EC-564817−5.62 **−0.51 ns−7.71 ns0.12 ns−1.66 ns−0.48 *−0.41 **−1.84 **−14.51 **−10.45 **
16.HFP-1314 × Vikas1.98 ns3.19 ns3.56 ns−11.7 **−10.57 **−0.57 **−0.71 **1.60 **−14.80 **−10.47 **
17.HFP-1314 × P-92-97-110.88 ns2.44 ns8.26 ns−8.55 **−6.63 *0.12 ns0.37 *−0.17 ns−9.14 *−3.87 ns
18.HFP-1314 × P-1426−0.42 ns−2.36 ns23.21 **8.24 **7.65 **0.21 ns0.22 ns−0.80 ns12.17 **7.87 *
19.Aman × EC-564817−15.27 **−2.96 ns−12.45 *−9.93 ns−9.26 **0.46 *0.45 **3.51 **12.56 **5.67 *
20.Aman × Vikas4.33 *−1.76 ns−4.28 ns14.65 **14.9 **−0.24 ns−0.63 **1.30 *19.13 **10.04 **
21.Aman × P-92-97-112.23 ns−0.51 ns−1.37 ns−0.70 ns1.58 ns−0.03 ns0.02 ns−1.68 **−5.22 ns−1.96 ns
22.Aman × P-14261.93 ns2.19 ns14.47 **10.47 **11.75 **−0.00 ns0.09 ns−1.75 **6.75 ns4.40 ns
23.EC-564817 × Vikas4.28 *−0.36 ns4.00 ns−4.08 ns−6.72 *1.14 **1.74 **1.25 *24.42 **13.20 **
24.EC-564817 × P-92-97-1110.18 **−0.11 ns6.16 ns−7.56 *−7.03 *0.35 ns−0.00 ns−2.67 **−29.84 **−11.71 **
25.EC-564817 × P-14263.38 ns1.09 ns18.00 **17.78 **18.30 **−0.90 **−1.01 **1.05 *18.42 **12.24 **
26.Vikas × P-92-97-11−4.72 *−0.91 ns−2.77 ns8.9 **8.5 **0.12 ns−0.15 ns1.02 *15.01 **8.69 **
27.Vikas × P-14261.98 ns0.29 ns−33.03 **−10.47 **−8.95 **0.34 ns0.47 **0.14 ns−8.21 ns−6.27 ns
28.P-92-97-11 × P-1426−6.62 **−0.96 ns28.53 **−4.18 ns−5.60 *−0.01 ns0.21 ns4.67 **19.67 **9.19 **
* Significant at p ≤ 0.05, ** significant at p ≤ 0.01, ns—non-significant at p ≤ 0.05.
Table 8. Eigen value and variability percentage of parents and crosses of field pea for different traits.
Principal ComponentsParentsCrosses
Eigen ValueVariability (%)Cumulative Variability (%)Eigen ValueVariability (%)Cumulative Variability (%)
PC12.1345.3145.311.9839.1439.14
PC21.4521.0166.321.3417.8456.99
PC31.2415.3681.681.2615.9372.91
PC40.948.8390.521.0210.4383.34
PC50.755.6396.140.816.6289.96
Disclaimer/Publisher’s Note: The statements, opinions and data contained in all publications are solely those of the individual author(s) and contributor(s) and not of MDPI and/or the editor(s). MDPI and/or the editor(s) disclaim responsibility for any injury to people or property resulting from any ideas, methods, instructions or products referred to in the content.

