Article

Effects of Vanadium/Nickel Contents in Laves Phase-Related Body-Centered-Cubic Solid Solution Metal Hydride Alloys

1
BASF/Battery Materials-Ovonic, 2983 Waterview Drive, Rochester Hills, MI 48309, USA
2
Department of Chemical Engineering and Materials Science, Wayne State University, Detroit, MI 48202, USA
*
Author to whom correspondence should be addressed.
These authors contributed equally to this work.
Batteries 2015, 1(1), 34-53; https://doi.org/10.3390/batteries1010034
Submission received: 5 October 2015 / Accepted: 16 November 2015 / Published: 20 November 2015
(This article belongs to the Special Issue Nickel Metal Hydride Batteries)

Abstract

:
Structural, gaseous phase hydrogen storage, and electrochemical properties of a series of annealed (900 °C for 12 h) Laves phase-related body-centered-cubic (BCC) solid solution metal hydride (MH) alloys with vanadium/nickel (V/Ni) contents ranging from 44/18.5 to 28/34.5 were studied. As the average Ni-content increases, C14 phase evolves into the C15 phase and a new σ-VNi phase emerges; lattice constants in BCC, C14, and TiNi phase all decrease; the main plateau pressure increases; both gaseous phase and electrochemical hydrogen storage capacities decrease; the pressure-concentration-temperature (PCT) absorption/desorption hysteresis decreases; both high-rate dischargeability (HRD) and bulk hydrogen diffusivity increase and then decrease; and the surface reaction current decreases. There is a capacity-rate tradeoff with the change in V/Ni content. Alloys with relatively lower Ni-content show higher capacities but inferior high-rate performance compared to commercially available AB5 MH alloy. Increasing the Ni-content in this BCC-based multi-phase alloy can improve the high-rate capability over AB5 alloy but with lower discharge capacities. The inferior surface reaction current in these alloys, compared to AB5, may be due to the smaller surface area, not the total volume, of the Ni clusters embedded in the surface oxide layer of the activated alloys.

Graphical Abstract

1. Introduction

“Laves phase-related body-centered-cubic (BCC) solid solution” is a family of metal hydride (MH) alloys composed mainly of a BCC phase and a Laves phase (mostly C14), which can be used as the negative electrode active material for nickel/metal hydride (Ni/MH) batteries [1,2]. Other minor phases, such as C15, TiNi, Ti2Ni, and VNi can also be included. Both V and TiCr intermetallic alloys have the same BCC crystal structure, which enable a wide composition solubility range for BCC phase in the Ti-V-Cr ternary phase diagram [3]. Alloys with sole BCC structure can have a hydrogen storage capacity higher than 3.5 wt% [4,5], but the electrochemical performance is poor because of severe cracking and passivation on the surface [5]. Adding Ni into the alloy formula promotes the formation of a C14 phase [6]. The introduction of Laves phases promotes good absorption kinetics [7], easy formation due to its brittleness [8,9,10], and high surface catalytic activity through a synergetic effect [11]. Many works have been reported in this family of alloys that partially replace Ti, V, and Cr with other transition metals for improvements in both hydrogen storage [9,12,13,14,15,16,17,18,19] and electrochemical applications [20,21,22,23]. Our contributions to the field include the introduction of a high hydrogen pressure activation process [24], an optimization of annealing conditions (900 °C for 12 h) [25], and a study examining the contributions of the constituent elements in Laves phase-related BCC solid solutions. The contributions of the elements are summarized as: removal of Fe and decrease in V-content in exchange for higher Ni-content to improve both the electrochemical capacity and high-rate dischargeability (HRD); elimination of the C14 phase by removal of Zr contributing to a reduced discharge capacity, a prolonged activation period, and a less catalytic surface for electrochemical reaction; and the TiNi phase was also found to contribute positively to the bulk diffusion of hydrogen while hindering the surface electrochemical reaction. In the same study, an alloy (P17) achieved a full capacity of 390.8 mAh·g−1 at a small discharge rate of 4 mA·g−1; however, the capacity decreases to 365.4 mAh·g−1 when the discharge rate was increased to 50 mAh·g−1 [26]. The capacity degradation with increased rate in P17 is worse than that in the conventional AB5 MH alloys (from 336 mAh·g−1 to 329 mAh·g−1) under the same test condition [27]. The HRD is very important for the high-power applications for Ni/MH battery, such as in hybrid electrical vehicles and power tools. Previously, Ni has been known to increase the HRD of the MH alloys [22,28,29,30,31,32]. In order to further improve the HRD performance, the vanadium/nickel content in alloy P17 was adjusted and the results are presented here.

2. Experimental Section

Ingot sample was prepared by an arc-melting, which includes a non-consumable tungsten electrode, a water-cooled copper tray and a continuous argon flow. A piece of sacrificial titanium underwent a few melting-cooling cycles to reduce the residual oxygen concentration in the system before each run. Each 12 g ingot was re-melted and turned over several times to ensure uniformity in chemical composition. Following previously developed annealing conditions, each ingot was annealed in vacuum at 900 °C for 12-h [25]. Chemical compositions for each ingot was analyzed using a Varian Liberty 100 inductively coupled plasma-optical emission spectrometer (ICP-OES, Agilent Technologies, Santa Clara, CA, USA). A Philips X’Pert Pro X-ray diffractometer (XRD, Philips, Amsterdam, Netherlands) was used to study the microstructure, and a JEOL-JSM6320F scanning electron microscope (SEM, JEOL, Tokyo, Japan) with energy dispersive spectroscopy (EDS) capability was used to study the phase distribution and composition. Gaseous phase hydrogen storage characteristics for each sample were measured using a Suzuki-Shokan multi-channel pressure-concentration-temperature (PCT, Suzuki Shokan, Tokyo, Japan) system. In the PCT analysis, each sample (a single piece of ingot with a newly cleaved surface and a weight of about 2 g) was first activated by a 2-h thermal cycle (between 300 °C and 30 °C) at 5 MPa H2 pressure. PCT isotherms at 30 and 60 °C were then measured. Magnetic susceptibility was measured using a Digital Measurement Systems Model 880 vibrating sample magnetometer (MicroSense, Lowell, MA, USA).

3. Results and Discussion

3.1. Alloy Composition

Eight alloys with a general formula of Ti15.6Zr2.1V44−xCr11.2Mn6.9Co1.4Ni18.5+xAl0.3, x = 0, 4, 6, 8, 10, 12, 14, and 16, were prepared by arc melting for this study. Design compositions of these alloys are listed in Table 1. Alloys P17 (x = 0) and P22 (x = 4) have been previously studied. P17 shows good balance between capacities and HRD [26], and P22 was the subject of the annealing condition matrix study [25]. The new compositions extend the study of V-content versus Ni-content. ICP results from the ingot samples are listed in Table 1. Other than a small but consistent deficiency in Zr (due to formation of ZrO2 as oxygen scavenger), the ICP results are very close to the target compositions. The measured B/A ratios are slightly higher than the designed values due to the loss in Zr.
Table 1. Design compositions and inductively coupled plasma (ICP) results for alloys in this study. All numbers are in at%.
AlloyTiZrVCrMnCoNiAlB/A
P17Design15.62.144.011.26.91.418.50.34.65
ICP15.6244.111.36.41.418.90.34.68
P22Design15.62.140.011.26.91.422.50.34.65
ICP15.51.841.011.26.51.422.20.44.78
P23Design15.62.138.011.26.91.424.50.34.65
ICP15.21.738.711.46.81.424.30.44.91
P24Design15.62.136.011.26.91.426.50.34.65
ICP15.51.836.011.36.41.527.10.44.78
P25Design15.62.134.011.26.91.428.50.34.65
ICP15.51.834.411.46.61.428.40.44.77
P26Design15.62.132.011.26.91.430.50.34.65
ICP15.51.733.510.86.81.529.80.44.81
P27Design15.62.130.011.26.91.432.50.34.65
ICP15.21.830.611.76.61.432.20.44.88
P28Design15.62.128.011.26.91.434.50.34.65
ICP15.31.928.111.46.61.434.90.44.81

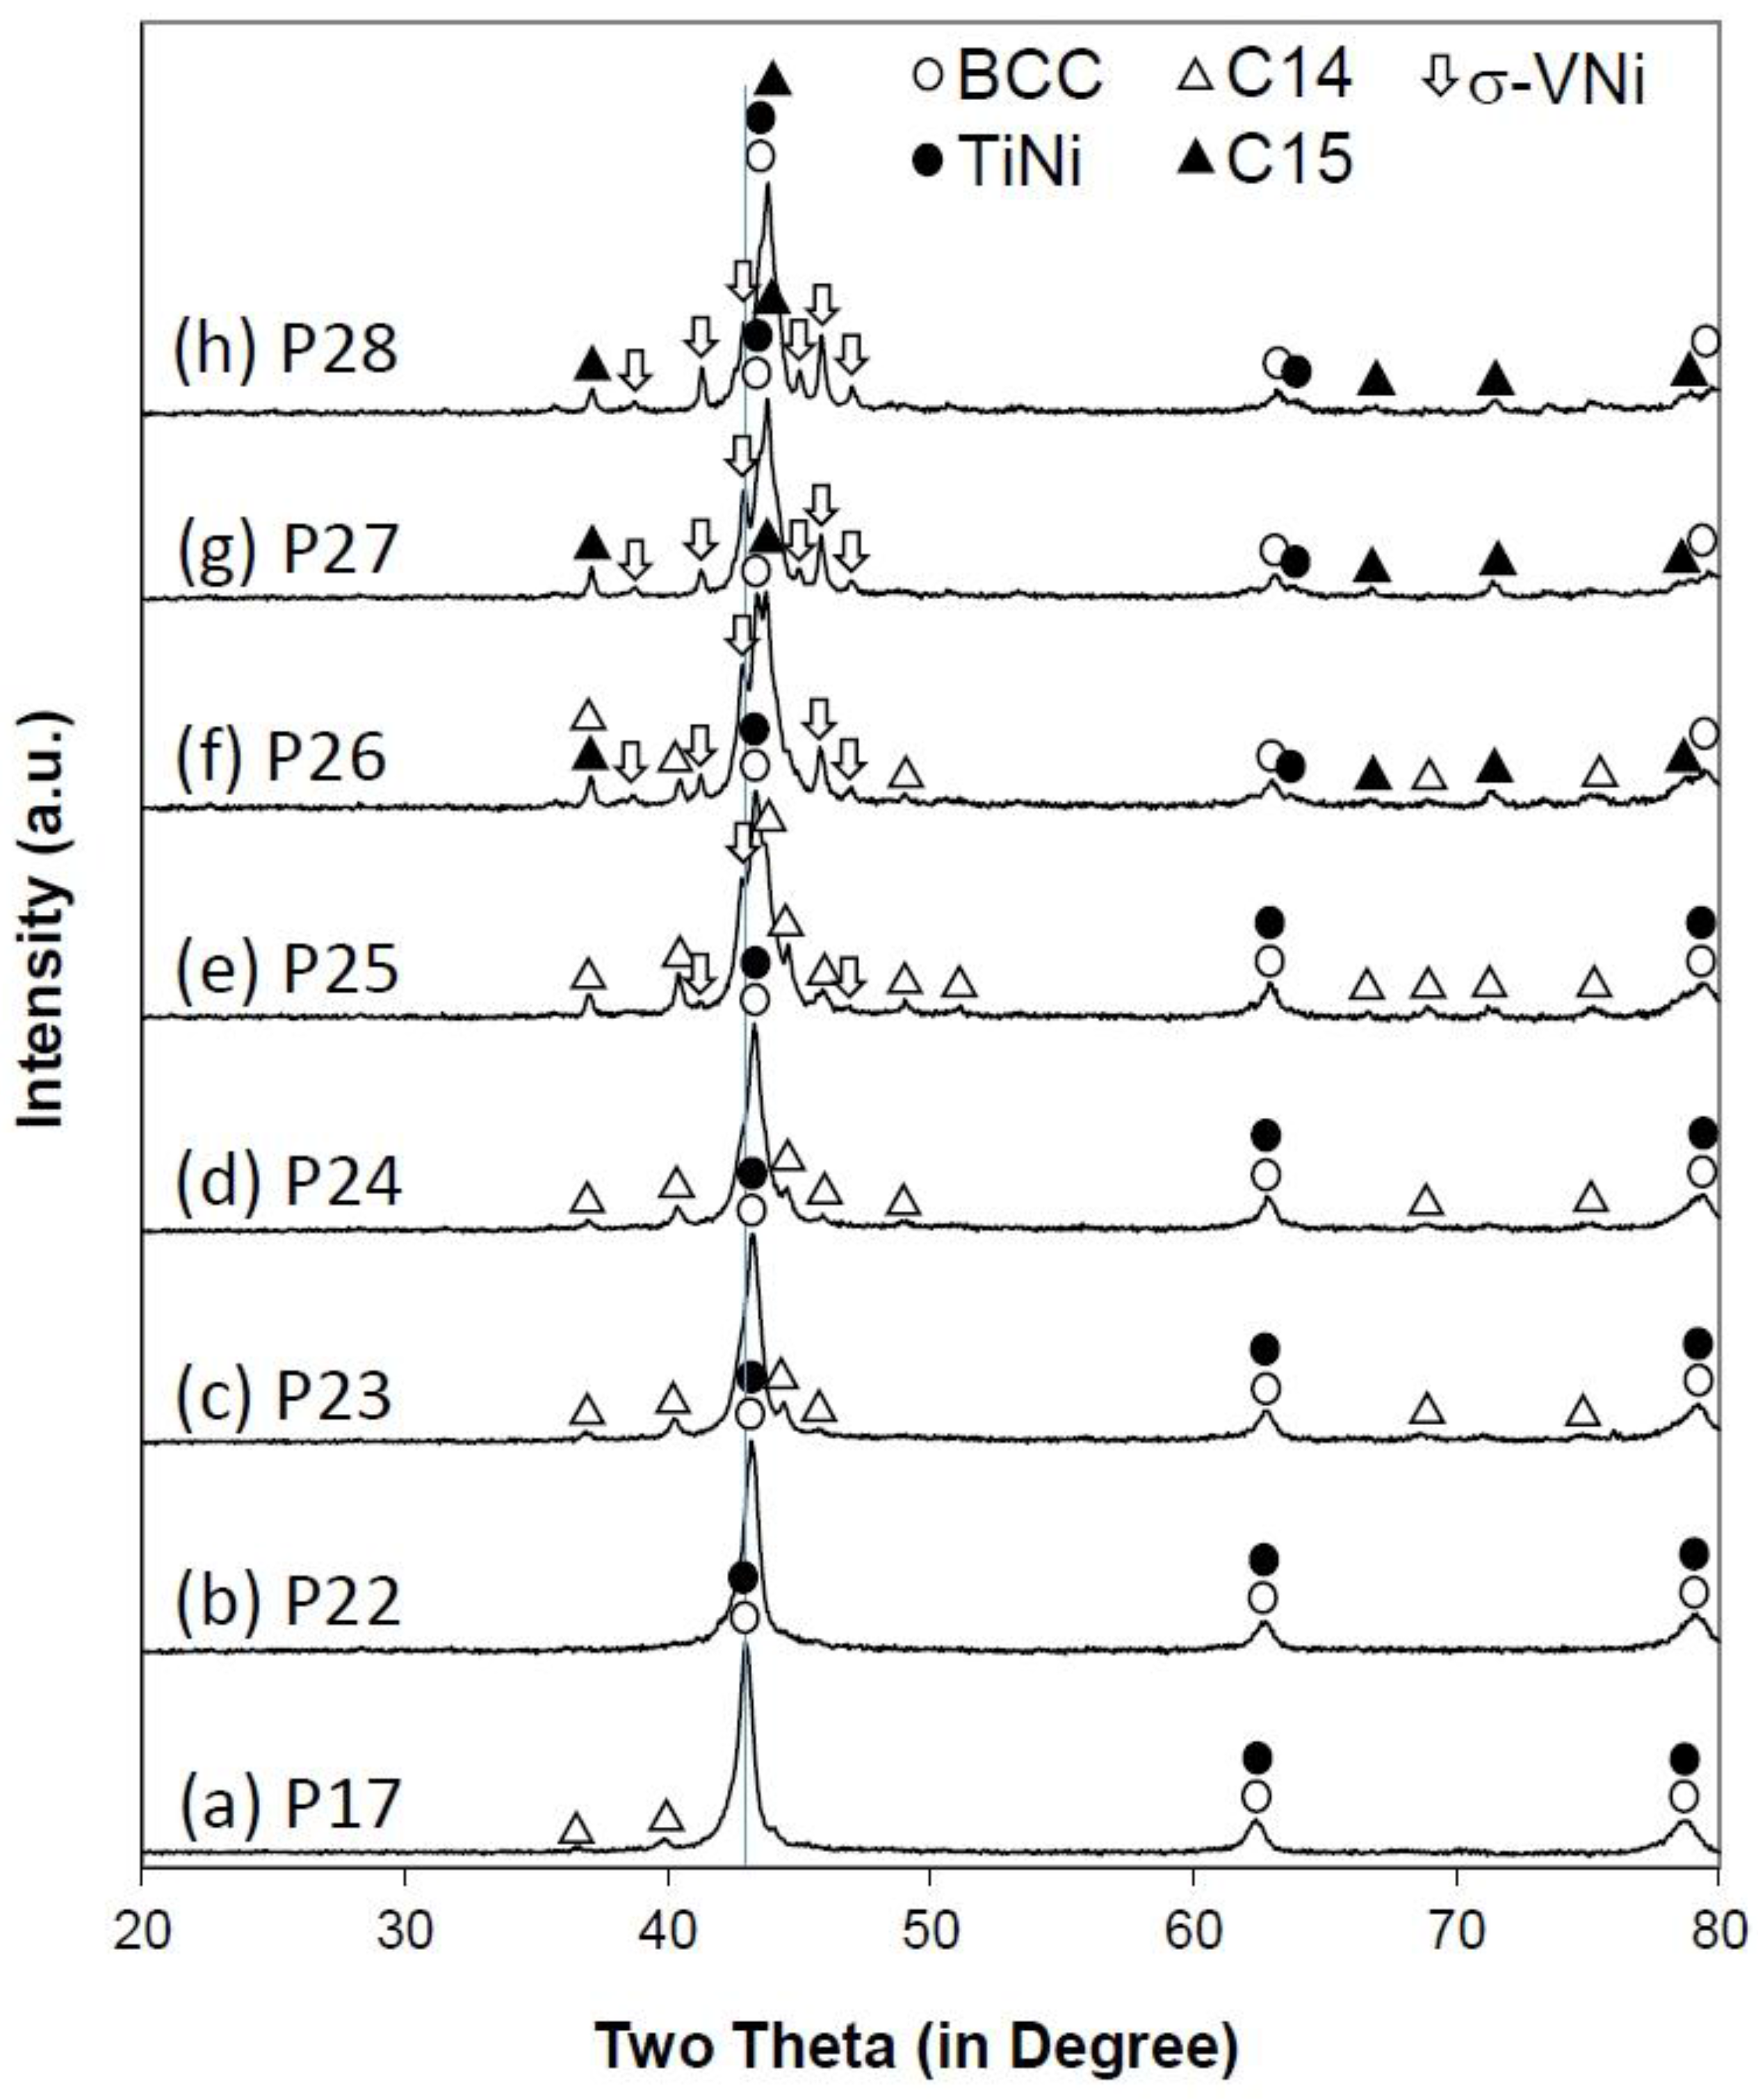
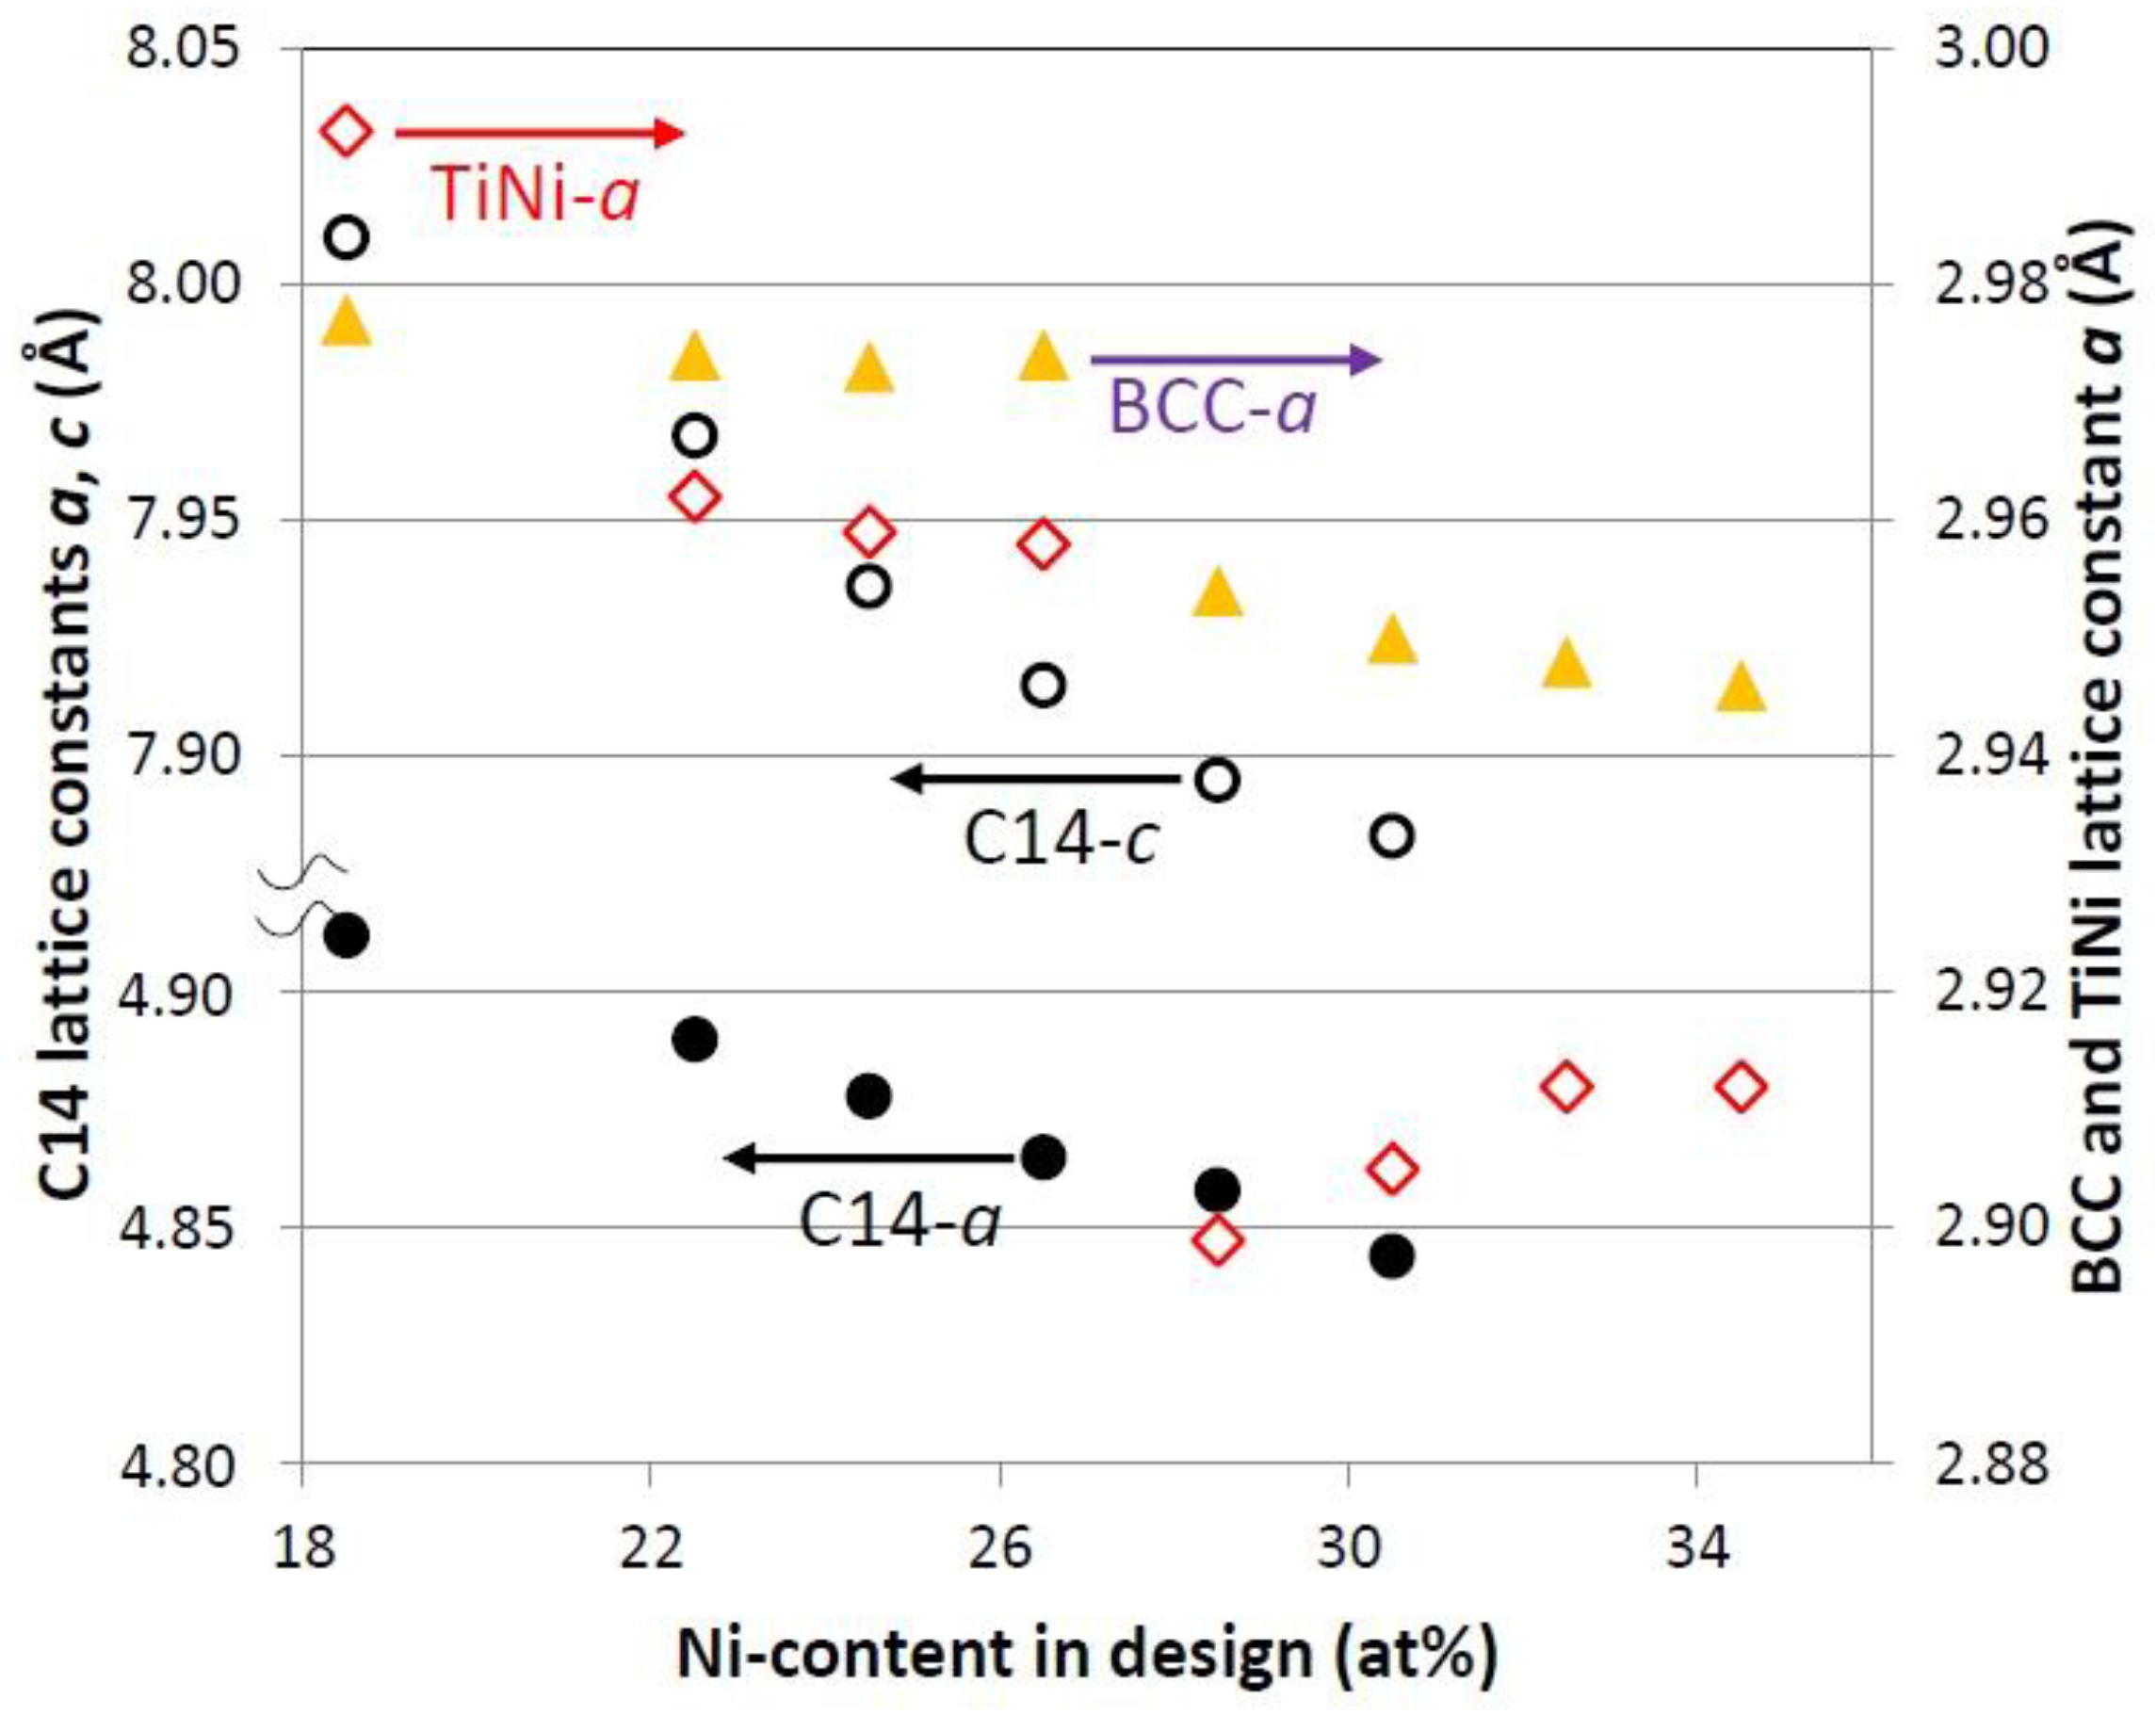
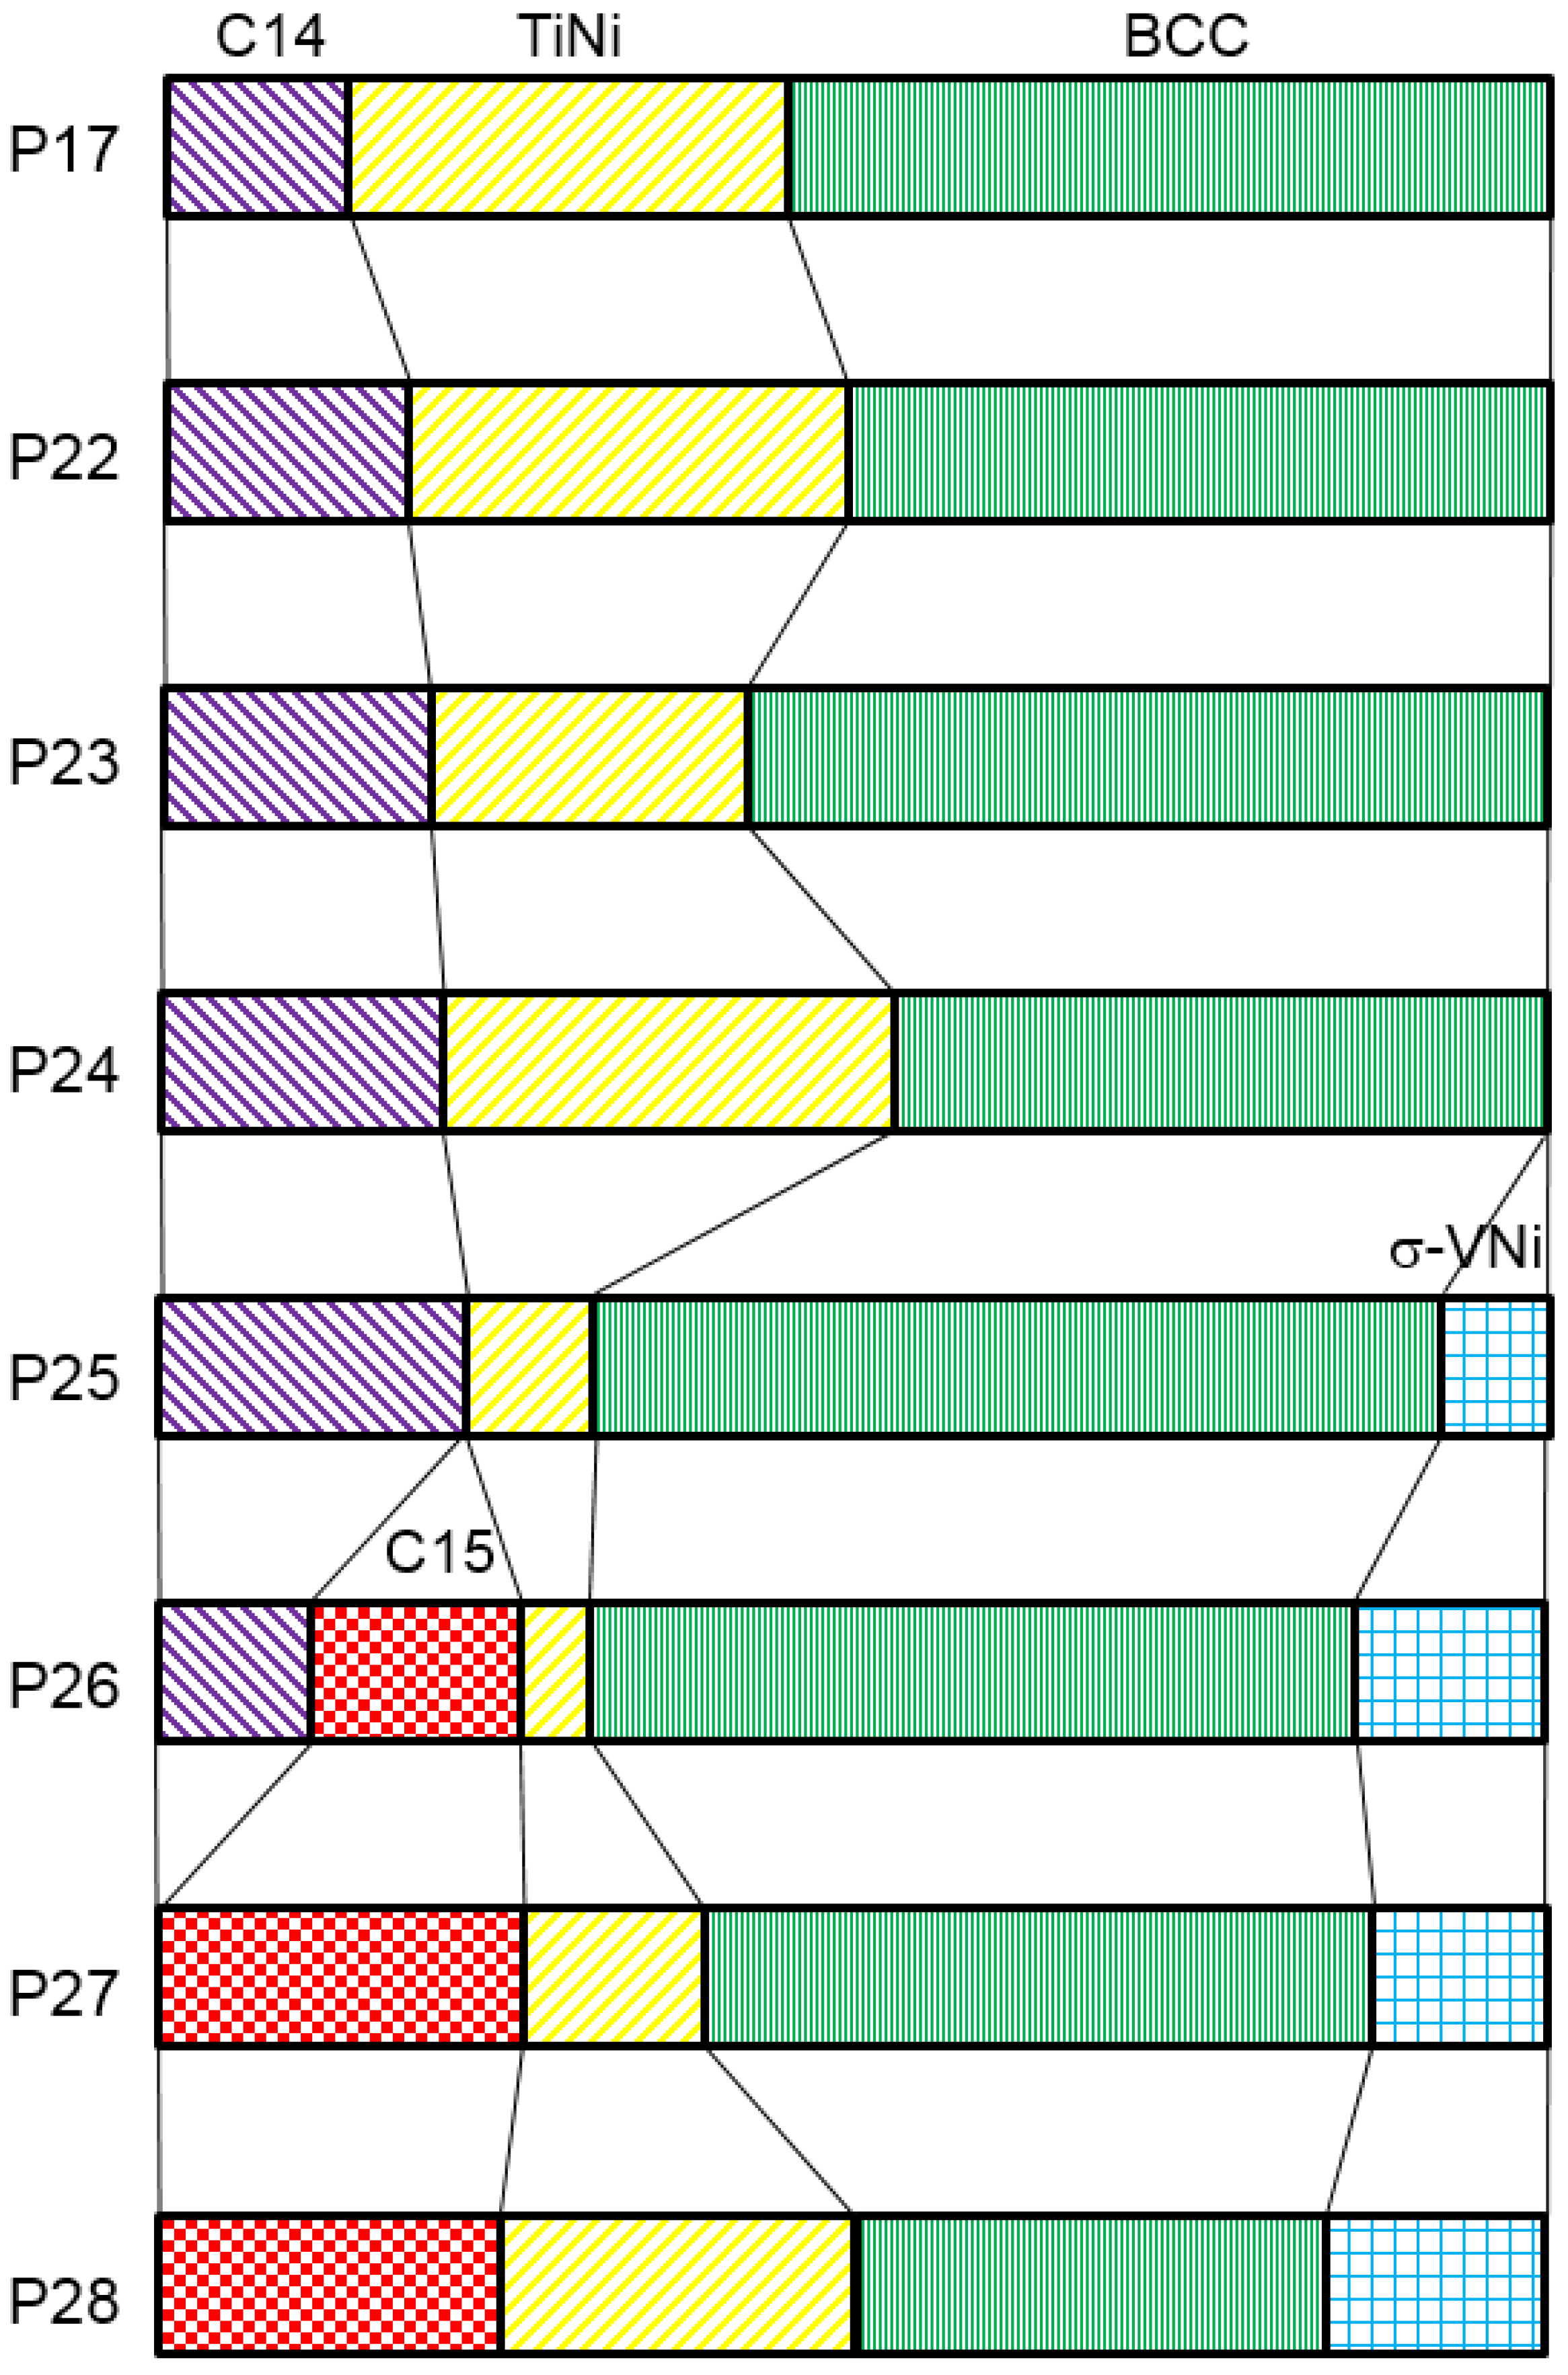
3.2. X-Ray Diffractometer Structure Analysis

XRD patterns of the eight alloys are shown in Figure 1. Five sets of diffraction peaks are observed: a BCC, two Laves phases (C14 and C15), a TiNi and a σ-VNi. As the Ni-content in the alloy increases, the BCC peaks shift to higher angles, C14 phase is replaced by C15 phase, and σ-VNi phase starts to appear. σ-VNi phase is in a tetragonal structure, and the lattice constants are a = 8.966 Å and c = 4.641 Å with a composition at V0.6Ni0.4 [33]. It has wide solubility in V from 57.5 at% to 75 at% [34]. The V-Ni-Cr ternary phase diagram indicates an extension of σ-VNi phase from 0% to about 40% Cr [35].
Figure 1. X-ray diffractometer (XRD) patterns using Cu-Kα as the radiation source for alloys: (a) P17; (b) P22; (c) P23; (d) P24; (e) P25; (f) P26; (g) P27; and (h) P28. A vertical line is used to indicate the shift in body-centered-cubic (BCC) peaks.
Batteries 01 00034 g001
Lattice constants, crystallite sizes, and phase abundances of all five constituent phases calculated from the XRD patterns are listed in Table 2. The variations in lattice constants from BCC, C14, and TiNi phases are plotted in Figure 2. As the amount of Ni increases, the lattice constant a in BCC first remains constant and then decreases, both a and c in C14 phase decrease at about the same rate yielding a slight decrease in c/a ratio, while a in TiNi sees a discontinuous two-segment decrease. The changes in lattice constants for C15 and VNi are less prominent. Lattice parameter a in BCC phase decreases from 2.977 Å to 2.946 Å as the Ni-content in the alloy increases, which is further away from the optimized value of 3.042 Å corresponding to a maximized hydrogen storage capacity [36].
Table 2. Lattice parameters, unit cell volumes, phase abundances, and crystallite sizes of phases derived from XRD analysis. XS denotes crystallite size.
AlloyBCCC14
a (Å)XS (Å)Abundance (wt%)a (Å)c (Å)c/aUnit cell volume (Å3)XS (Å)Abundance (wt%)
P172.97717152.84.9128.0101.631167.321513.2
P222.9745750.74.8907.9681.629165.027517.1
P232.9738657.54.8787.9361.627163.531119.4
P242.9747247.04.8657.9151.627162.225520.3
P252.9548661.24.8587.8951.625161.428722.1
P262.9507155.24.8447.8831.627160.227211.1
P272.9486847.8------
P282.9467334.2------
AlloyC15TiNiVNi
a (Å)XS (Å)Abundance (wt%)a (Å)XS (Å)Abundance (wt%)a (Å)c (Å)XS (Å)Abundance (wt%)
P17---2.99317034.0----
P22---2.96217532.4----
P23---2.95927323.0----
P24---2.95820432.6----
P25---2.8991058.99.0094.6861847.7
P266.85963715.12.9052284.59.0104.69221914.1
P276.86040526.62.91212713.09.0174.64425012.6
P286.85834724.72.91211525.59.0124.64234415.7
Figure 2. Lattice constants a and c from C14 phase, and lattice constants a from BCC and TiNi phases as functions of Ni-content in design.
Batteries 01 00034 g002
Phase abundance and crystallite sizes of each phase are listed in Table 2. These values were obtained from full pattern fitting of the XRD data using the Rietveld method and Jade 9 Software (KS Analytical System, Aubrey, TX, USA).
The evolution of phase abundance is plotted in Figure 3. C14 Laves phase abundance first increases and then decreases as it is replaced by another Laves phase—C15 phase. The total Laves phase abundance generally increases, but begins to taper and decrease as it is changed to C15 phase. TiNi phase abundance varies widely as it first decreases, then increases, decreases, and finally increases again. BCC phase constitutes about 50–60 wt% and then drops to below 40 wt%. σ-VNi-phase appears in alloys with higher Ni-content, and the abundance further increases. The crystallite sizes (XS) of all five constituent phases have different trends. As the Ni-content in the alloy increases at the expense of V, the XS of BCC and C15 phases decrease, the XS of C14 and TiNi phases first increase and then decrease, and in VNi phase, the XS increases.
Figure 3. Evolution in the phase abundances of constituent phases from the full-pattern analysis of XRD data.
Batteries 01 00034 g003

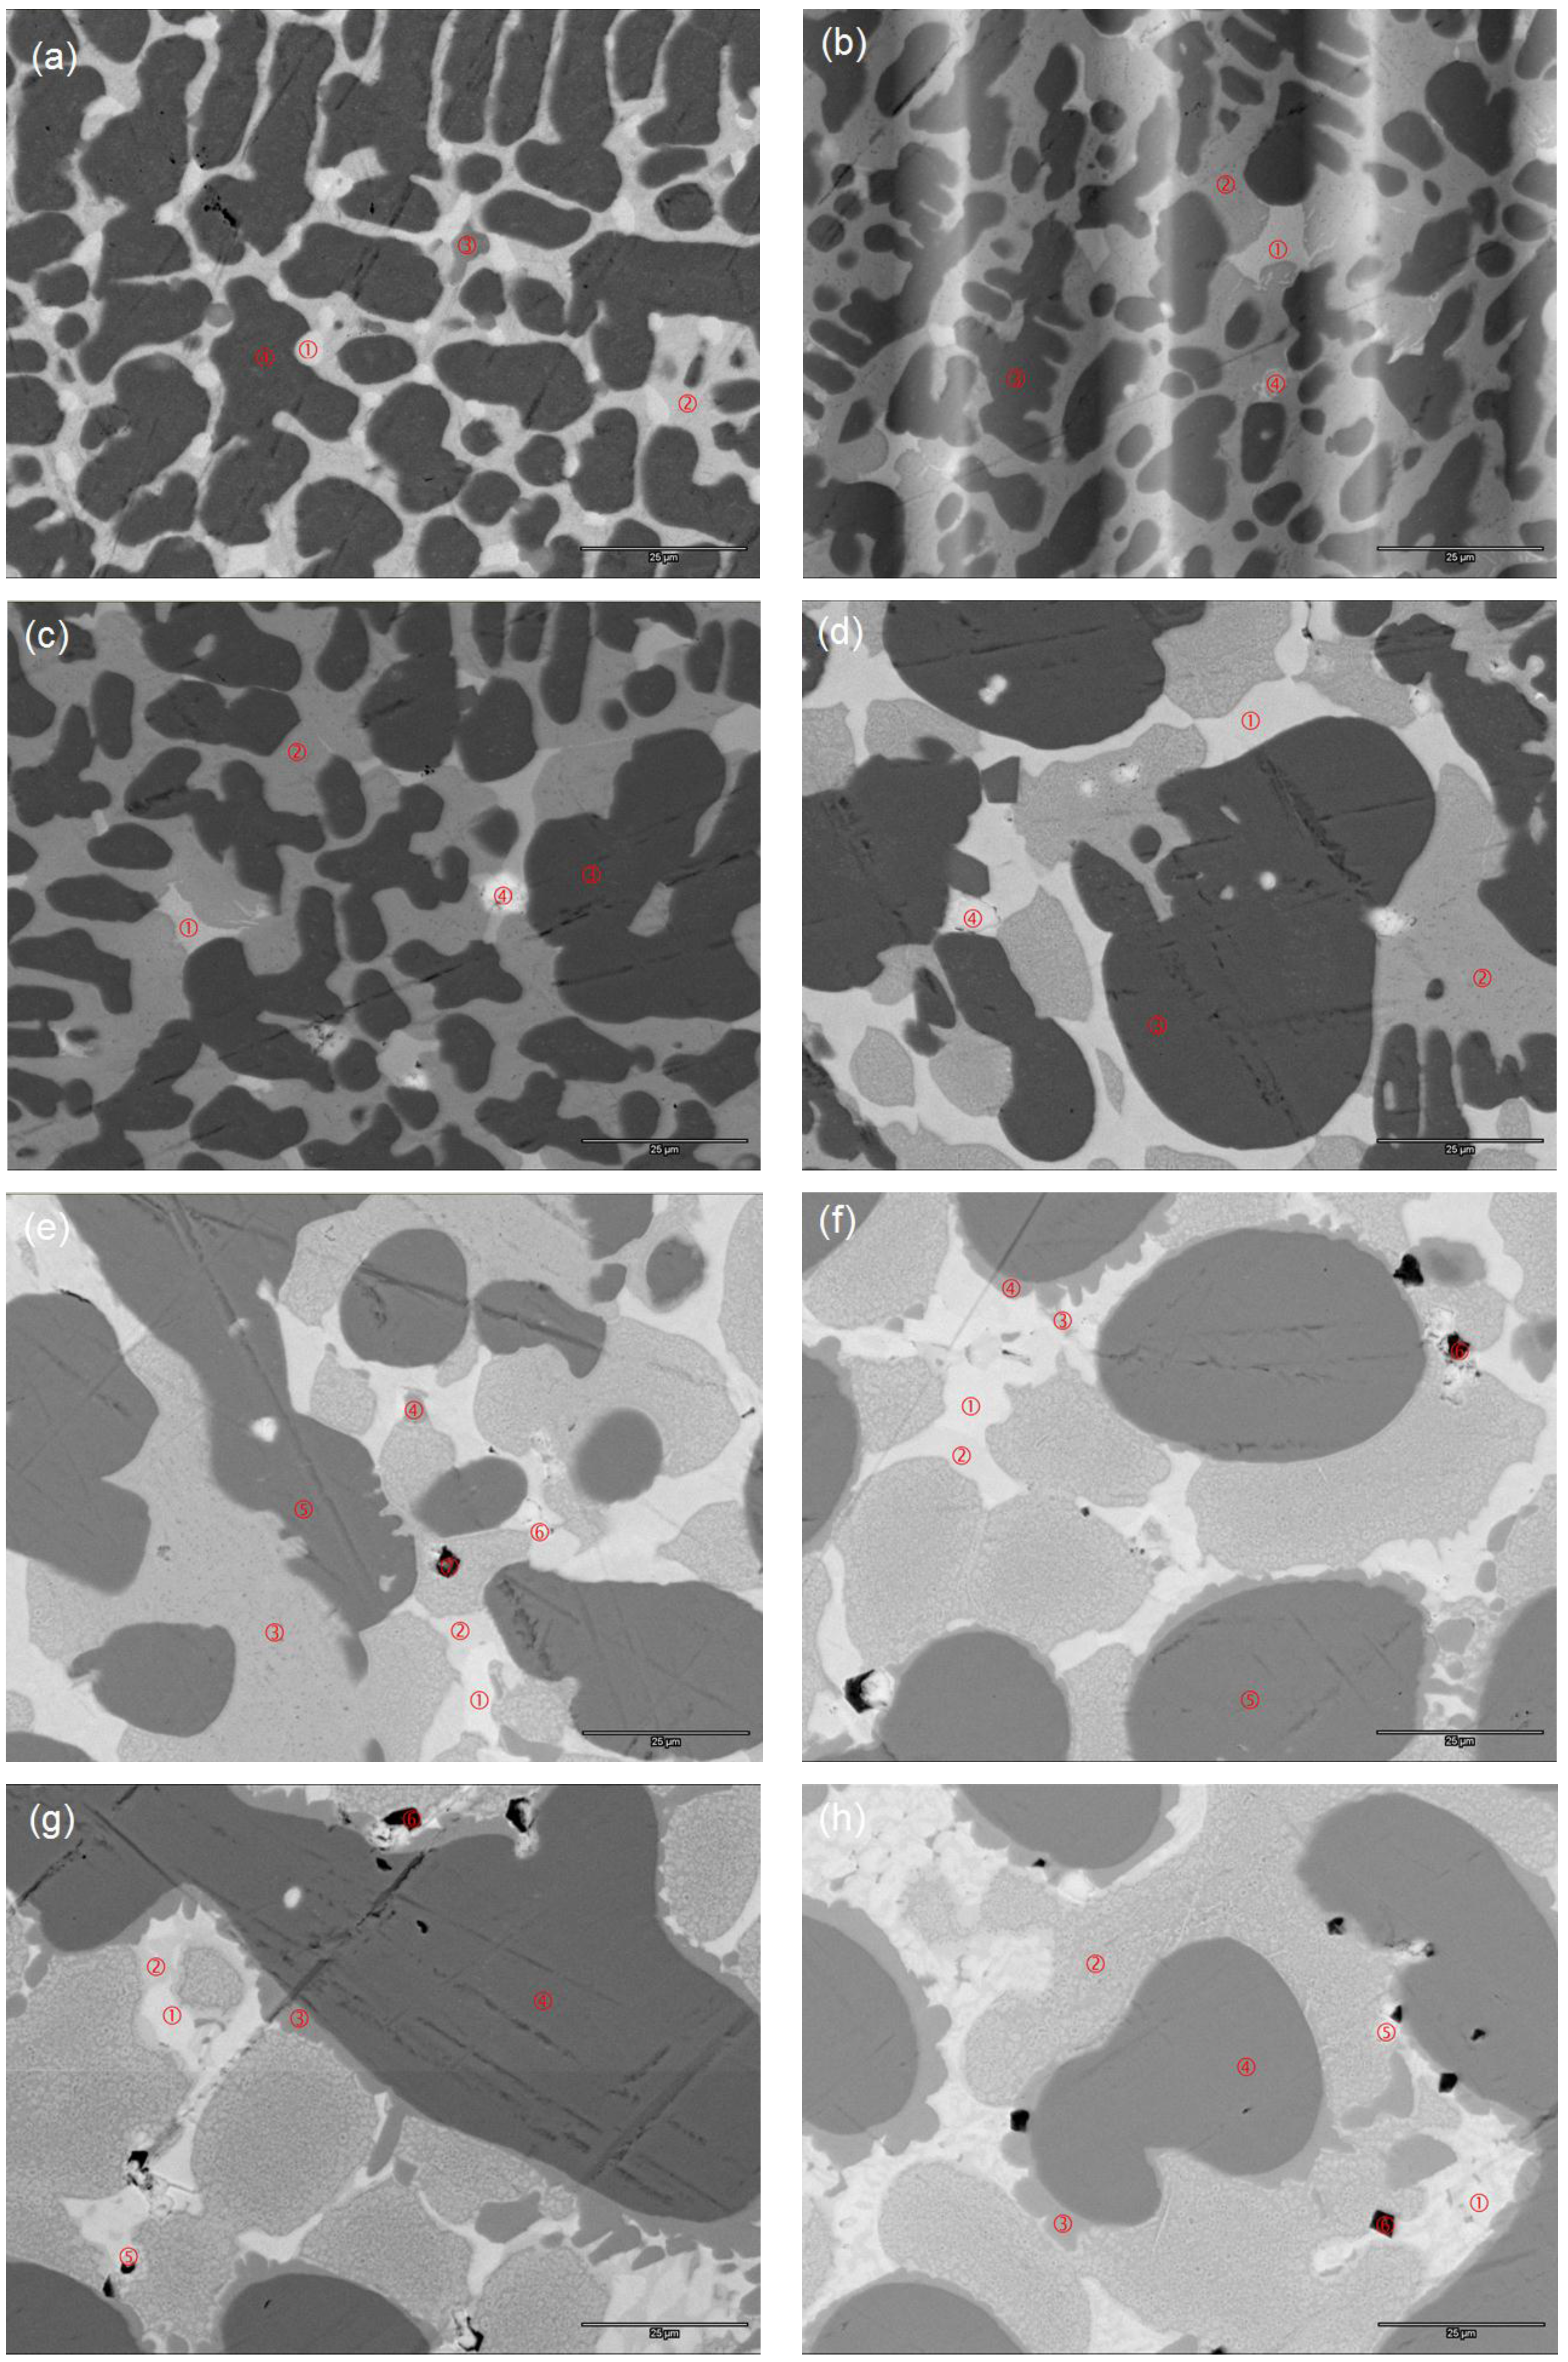
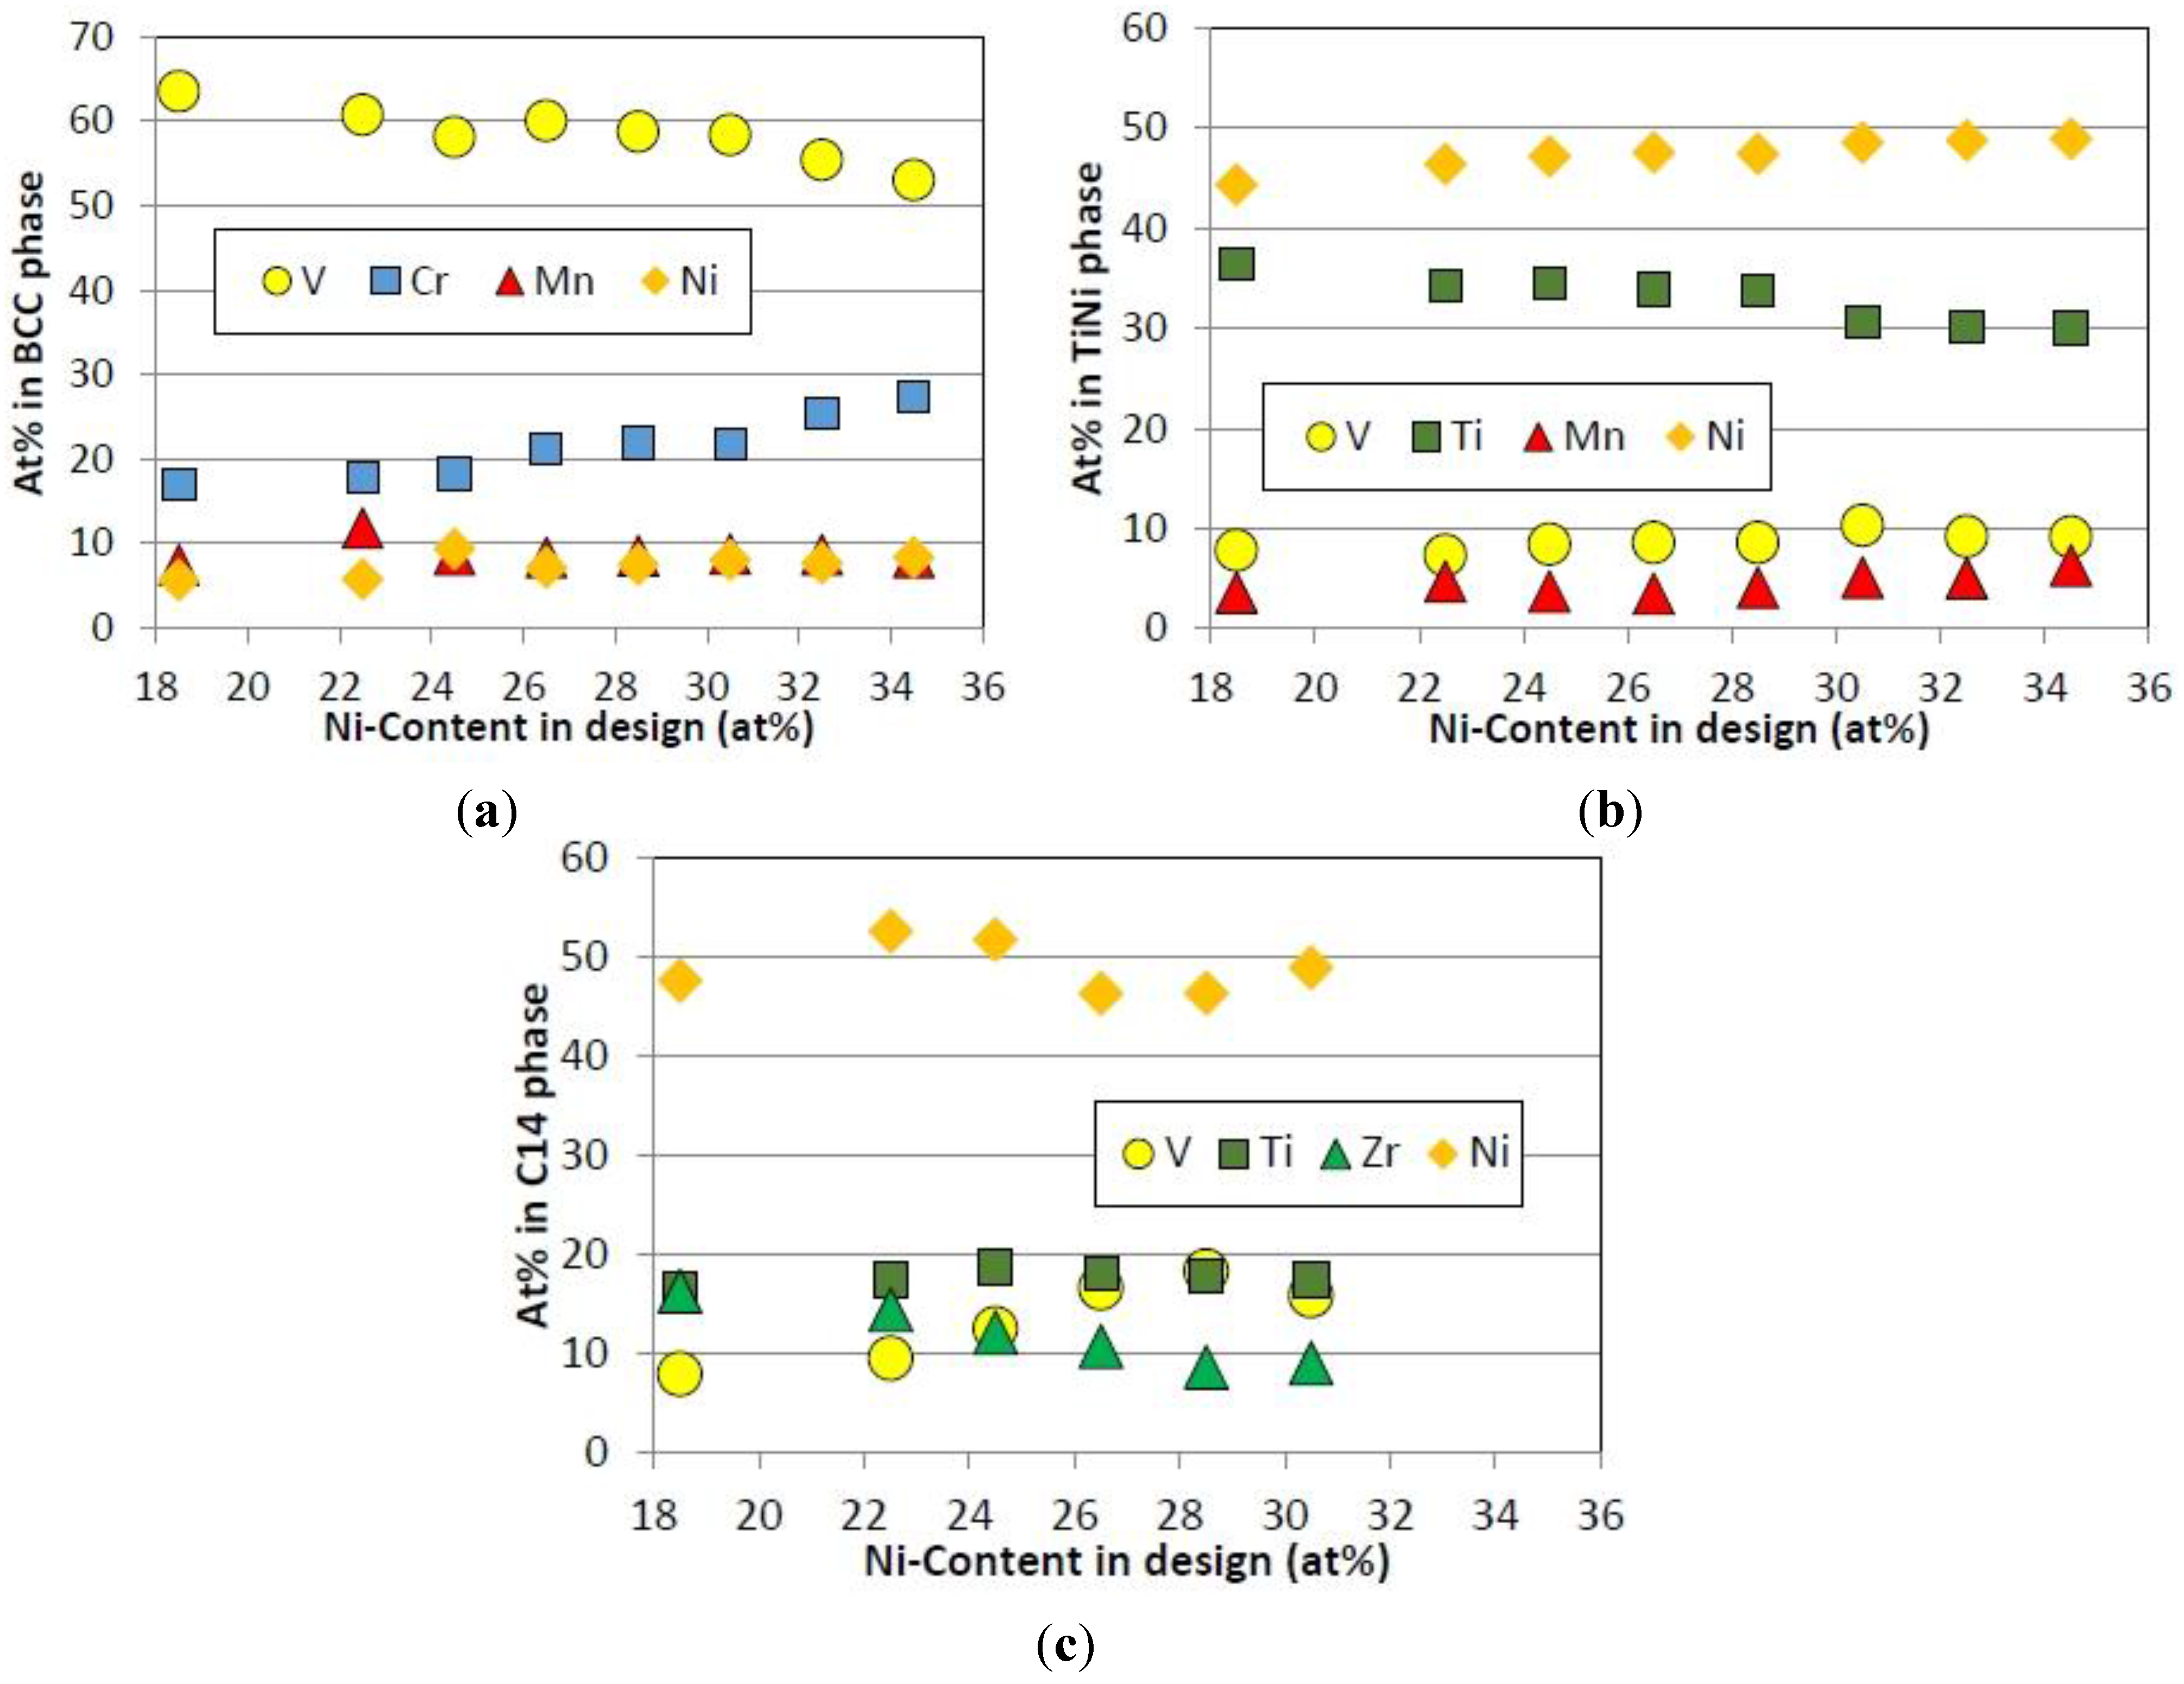
3.3. Scanning Electron Microscope/Energy Dispersive Spectroscopy Microstructure Analysis

Microstructures for this series of alloys were studied using SEM, and the resulting back-scattering electron images (BEI) are presented in Figure 4.
Figure 4. Scanning electron microscope (SEM) back-scattering electron images (BEI) for alloys: (a) P17; (b) P22; (c) P23; (d) P24; (e) P25; (f) P26; (g) P27; and (h) P28. Chemical compositions in the numbered areas measured by EDS are listed in Table 3.
Batteries 01 00034 g004
Table 3. Energy dispersive spectroscopy (EDS) composition data from select spots in Figure 3. All numbers are in at%. B/A ratios for C14 and C15 phases were calculated assuming V is in the B-site while those in TiNi and VNi phases were calculated assuming V in the A-site. Compositions in the main BCC phase are highlighted in bold.
LocationZrTiVCrMnFeCoNiAlB/Ae/aPhase
Figure 4a-116.216.37.84.45.90.01.847.50.12.087.28C14
Figure 4a-24.736.47.80.83.60.02.044.40.31.04-TiNi
Figure 4a-36.248.511.71.22.30.01.828.30.10.51-Ti2Ni
Figure 4a-40.15.563.516.97.40.00.85.60.2--BCC
Figure 4b-114.317.39.40.64.80.00.852.50.32.167.44C14
Figure 4b-22.834.37.30.94.70.12.746.40.81.25-TiNi
Figure 4b-30.13.060.717.711.80.00.95.70.1--BCC
Figure 4b-487.23.03.10.50.80.10.44.80.1--Zr
Figure 4c-112.018.612.40.73.50.00.951.60.32.277.38C14
Figure 4c-22.434.58.41.03.70.02.347.20.51.21-TiNi
Figure 4c-30.14.558.118.28.60.01.19.30.1--BCC
Figure 4c-493.91.12.50.40.30.10.11.50.1--Zr
Figure 4d-110.617.916.52.54.70.01.446.20.22.517.20C14
Figure 4d-21.933.98.61.13.50.02.447.61.01.25-TiNi
Figure 4d-30.02.360.021.18.30.01.07.10.2--BCC
Figure 4d-494.70.71.80.40.10.00.21.90.2--Zr
Figure 4e-110.816.014.21.84.20.01.051.70.32.737.45C15
Figure 4e-28.517.718.22.55.00.01.546.20.32.817.22C14
Figure 4e-31.633.88.61.14.10.12.547.50.81.28-TiNi
Figure 4e-40.27.048.26.65.20.11.331.30.10.81-VNi
Figure 4e-50.02.458.721.88.50.01.07.40.1--BCC
Figure 4e-689.03.22.40.40.20.00.24.50.1--Zr
Figure 4e-74.769.57.81.31.60.00.614.10.3--TiO2
Figure 4f-110.516.213.31.94.40.01.052.50.22.757.50C15
Figure 4f-28.917.315.72.55.10.01.448.80.22.817.35C14
Figure 4f-31.430.710.31.15.10.02.048.60.81.36-TiNi
Figure 4f-40.26.848.47.16.80.01.529.00.10.80-VNi
Figure 4f-50.02.158.321.68.70.01.18.00.1--BCC
Figure 4f-66.079.08.30.10.50.00.26.00.0--TiO2
Figure 4g-110.416.511.92.15.20.11.252.40.32.727.53C15
Figure 4g-24.530.29.21.05.00.01.048.80.21.28-TiNi
Figure 4g-30.16.646.29.46.60.01.829.30.10.89-VNi
Figure 4g-40.01.855.425.38.60.01.17.60.1--BCC
Figure 4g-585.55.12.10.50.60.20.15.80.1--Zr
Figure 4g-63.582.87.60.10.60.00.15.20.1--TiO2
Figure 4h-110.216.211.82.45.50.01.152.50.32.797.53C15
Figure 4h-21.330.19.11.06.30.02.349.00.91.47-TiNi
Figure 4h-30.16.643.511.66.80.21.829.20.20.99-VNi
Figure 4h-40.01.753.027.48.30.01.28.30.1--BCC
Figure 4h-586.13.92.20.40.70.00.26.20.2--Zr
Figure 4h-62.090.63.30.10.50.00.23.30.1--TiO2
EDS analysis was used to study the chemical compositions of several areas showing different contrasts and the results are summarized in Table 3. In the case of BCC-C14 dual-phase alloy, during cooling of the melt, BCC phase with high V-content solidifies first to form a three-dimensional framework while the rest of the liquid solidifies into Laves phase as the alloy cools further. The Laves phase itself is also a three-dimensional framework (Figure 4 in [37]). This interlacing dual-framework can be seen in the alloys in the current study, but the framework has less alignment. The main BCC phase is shown in a darker contrast due to its low Zr- and Ni-contents (lower average atomic weight). The grain size of the main BCC phase increases but the crystallite size decreases (as seen from the XRD analysis) as the Ni-content in the alloy increases. The majority of the secondary phases is in the BCC phase grain boundary, and it evolves from TiNi + C14 + Ti2Ni (P17, very small amount and not detectable by XRD) to TiNi + C14 + Zr (P22 − P24), TiNi + C14 + C15 + VNi + Zr + TiO2 (P25, P26), and TiNi + C15 + VNi + Zr + TiO2 (P27, P28). The average electron density (e/a) calculated from the measured composition was used to distinguish the C14 and C15 Laves phases. The e/a values are listed in Table 3, and in this case, the C14/C15 threshold falls at a value of 7.45 [38,39]. The VNi phase starts at the center of the secondary phase region (Figure 4e-4) and moves to the boundary between BCC main phase and other secondary phases (TiNi and Laves). It is clear from the V-Ni phase diagram that the cooling sequence is first BCC phase, followed by σ-VNi phase and finally ending with a VNi2 (oI6 structure) + σ-VNi mixture [34]. In our multi-element case, the final VNi2 is replaced by a combination of TiNi and Laves phases.
The atomic percentages of a few key elements in BCC, TiNi, and C14 phases examined by SEM/EDS are plotted in Figure 5 as functions of Ni-content in the overall alloy design. Since the sampling volume of one spot in the EDS analysis is very limited (up to a few microns in diameter), the results may not be very representative and should be interpreted with caution. In the main BCC phase, as the Ni-content increases at the expense of V, the V-content decreases, the Cr-content increases, and the Mn- and Ni-contents remain at about the same values (Figure 5a). Because Cr is smaller than V, this decreases the lattice constant in BCC phase. V is a hydride former, and a smaller unit cell with less V-content has direct impacts on several properties: the metal-hydrogen bond strength will be weaker (better HRD), the plateau pressure will be higher, and the storage capacity will be lower. In the TiNi phase, as the Ni-content in design increases, the Ni-content increases, the Ti-content decreases, and the V- and Mn-contents remain relatively unchanged (Figure 5b). Because Ni is smaller than Ti, this results in a smaller unit cell, which is also beneficial in the TiNi catalytic phase for easier hydrogen diffusion. In the C14 phase, as the Ni-content in design increases, the Zr-content decreases, the V-content increases, and Ti and Ni remain unchanged. The decrease in Zr is due to the fact that Laves phase contains most of the Zr and its abundance in Laves phase increases with the increase in Ni. The overall Zr-content is fixed; therefore, the Zr-content in Laves phase is diluted and the heavily over-stoichiometry (B/A > 2.0) invites more V into the Laves phase. Both the lattice constants a and c decrease as more Zr (larger) is replaced by V (smaller). The relatively constant c/a indicates that most of the V sits in the A-site since a relatively large substitution in the B-site will cause an anisotropic enlargement in the unit cell [40,41]. The shrinkage in catalytic C14 phase unit cell also facilitates hydrogen diffusion in the alloy bulk.
Figure 5. Atomic percentages of key elements in: (a) BCC; (b) TiNi; and (c) C14 phases as functions of Ni-content in design.
Batteries 01 00034 g005

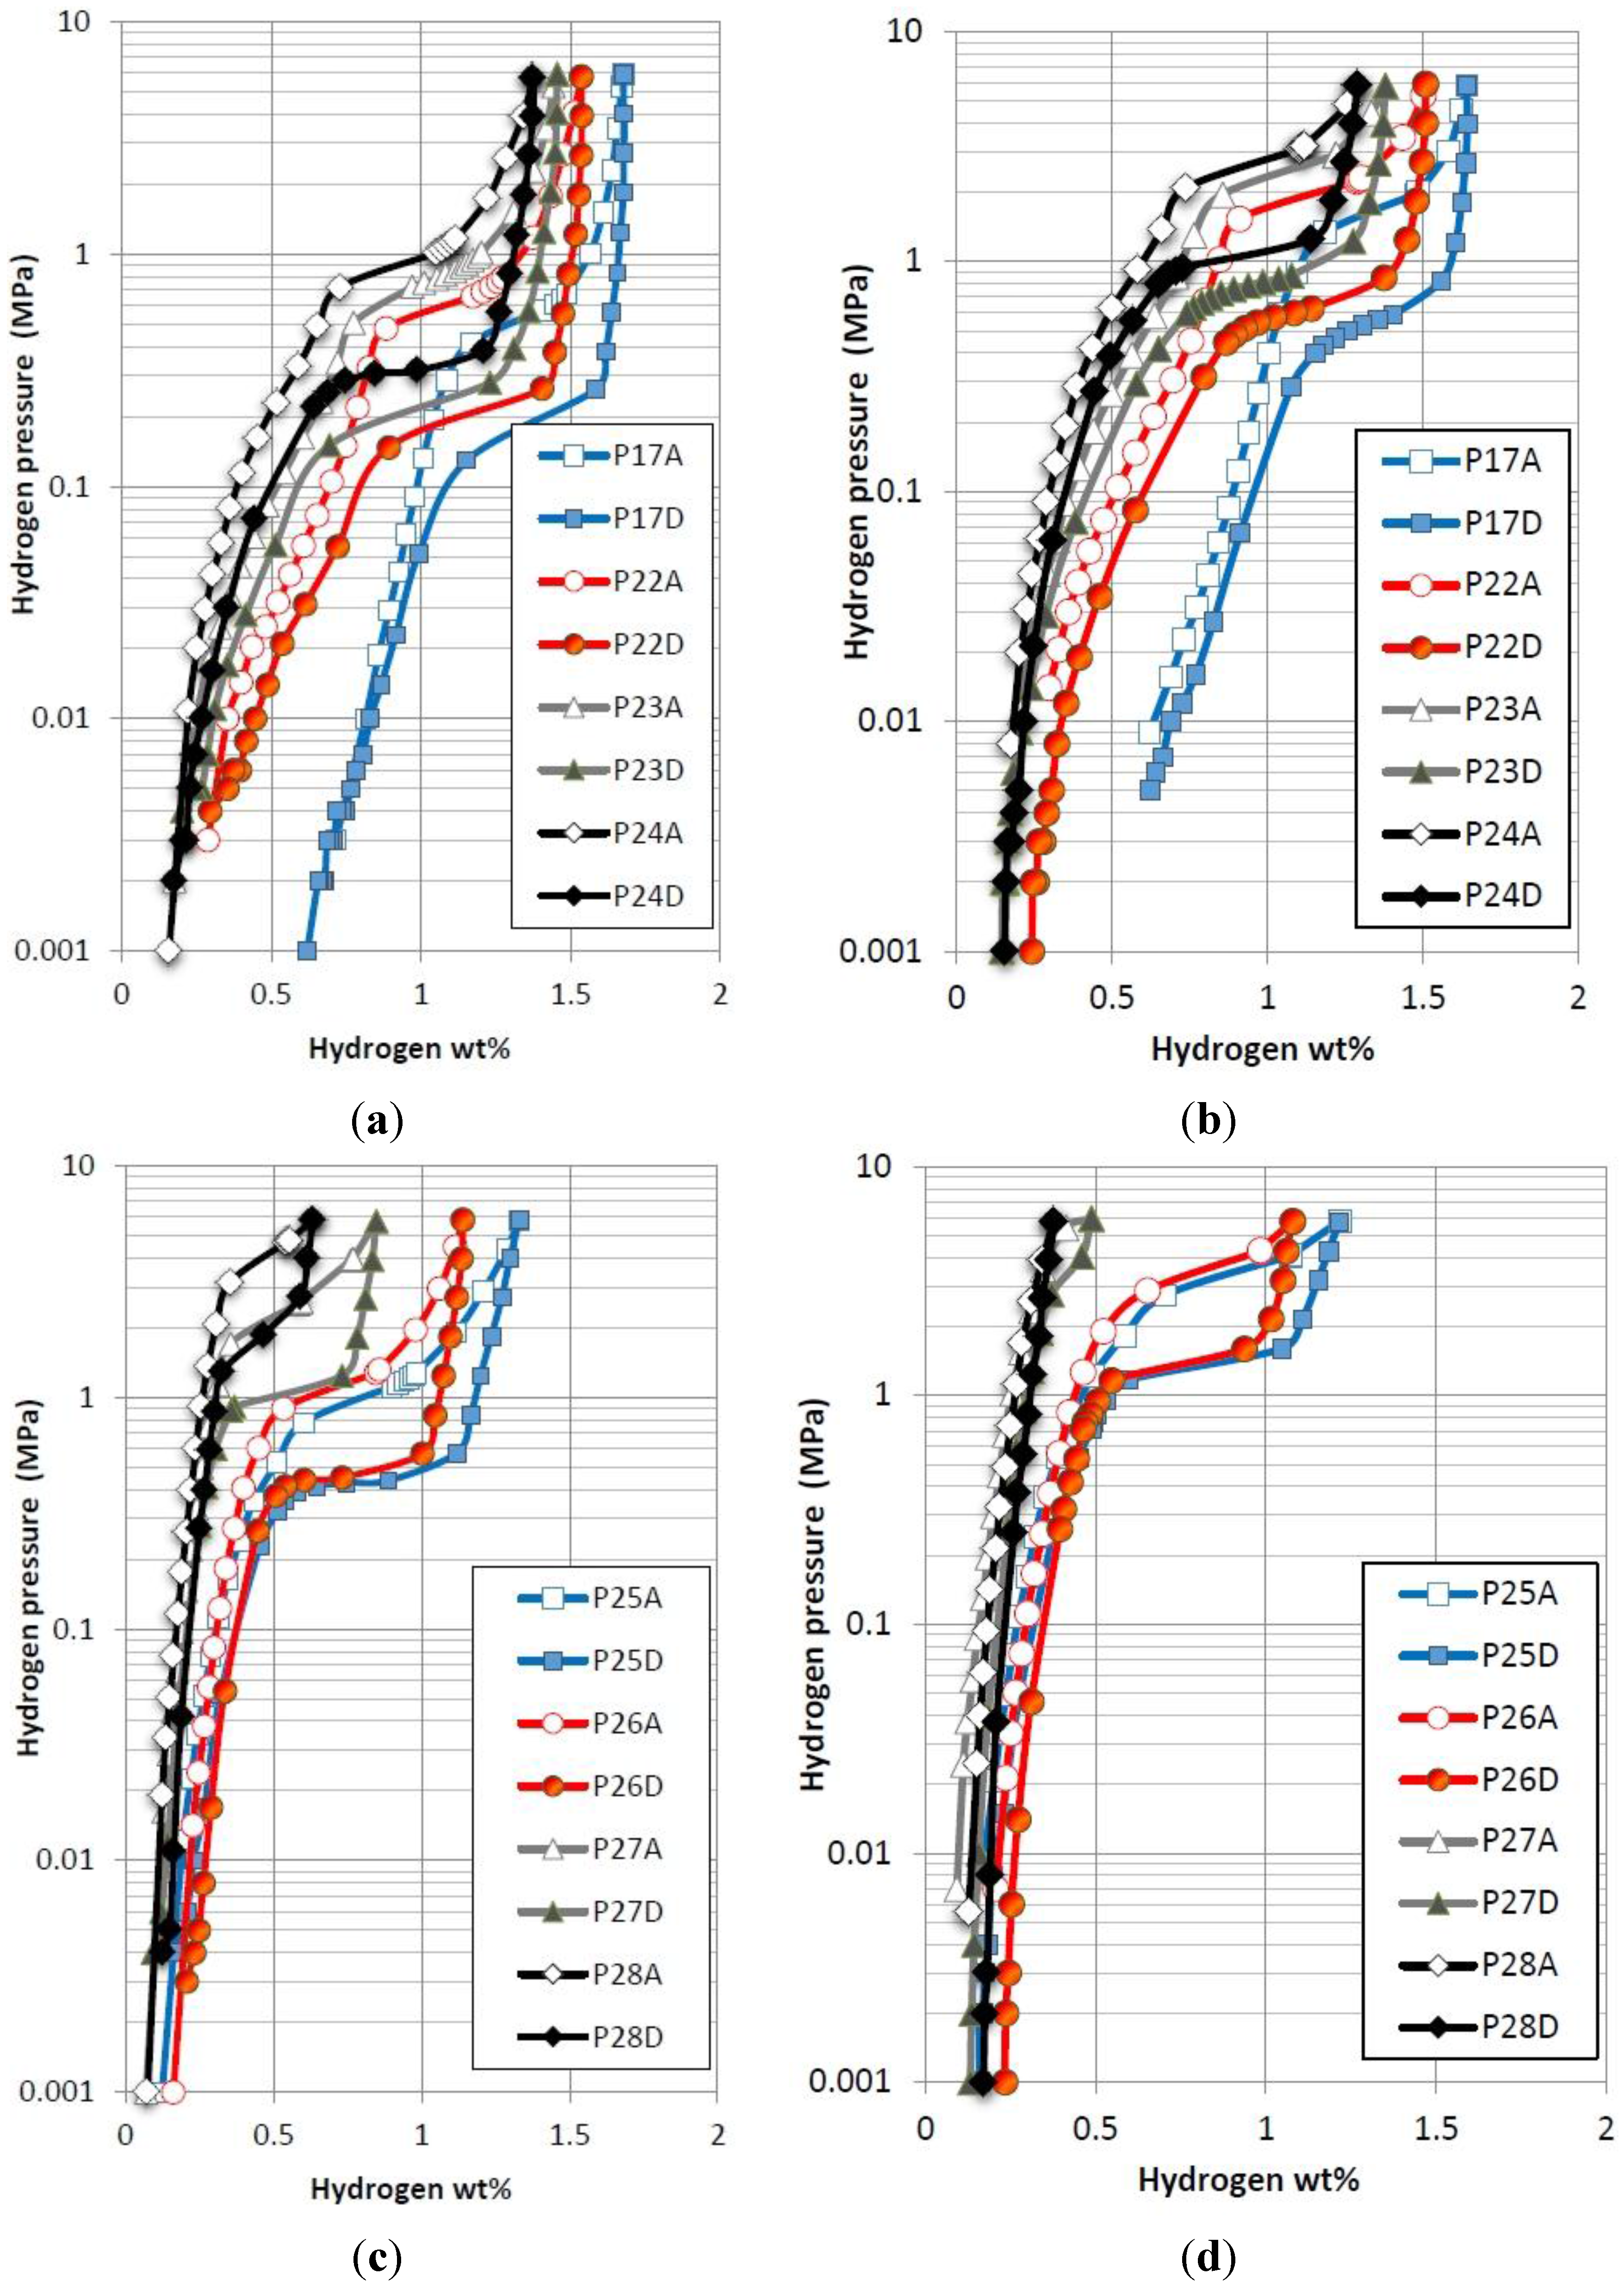
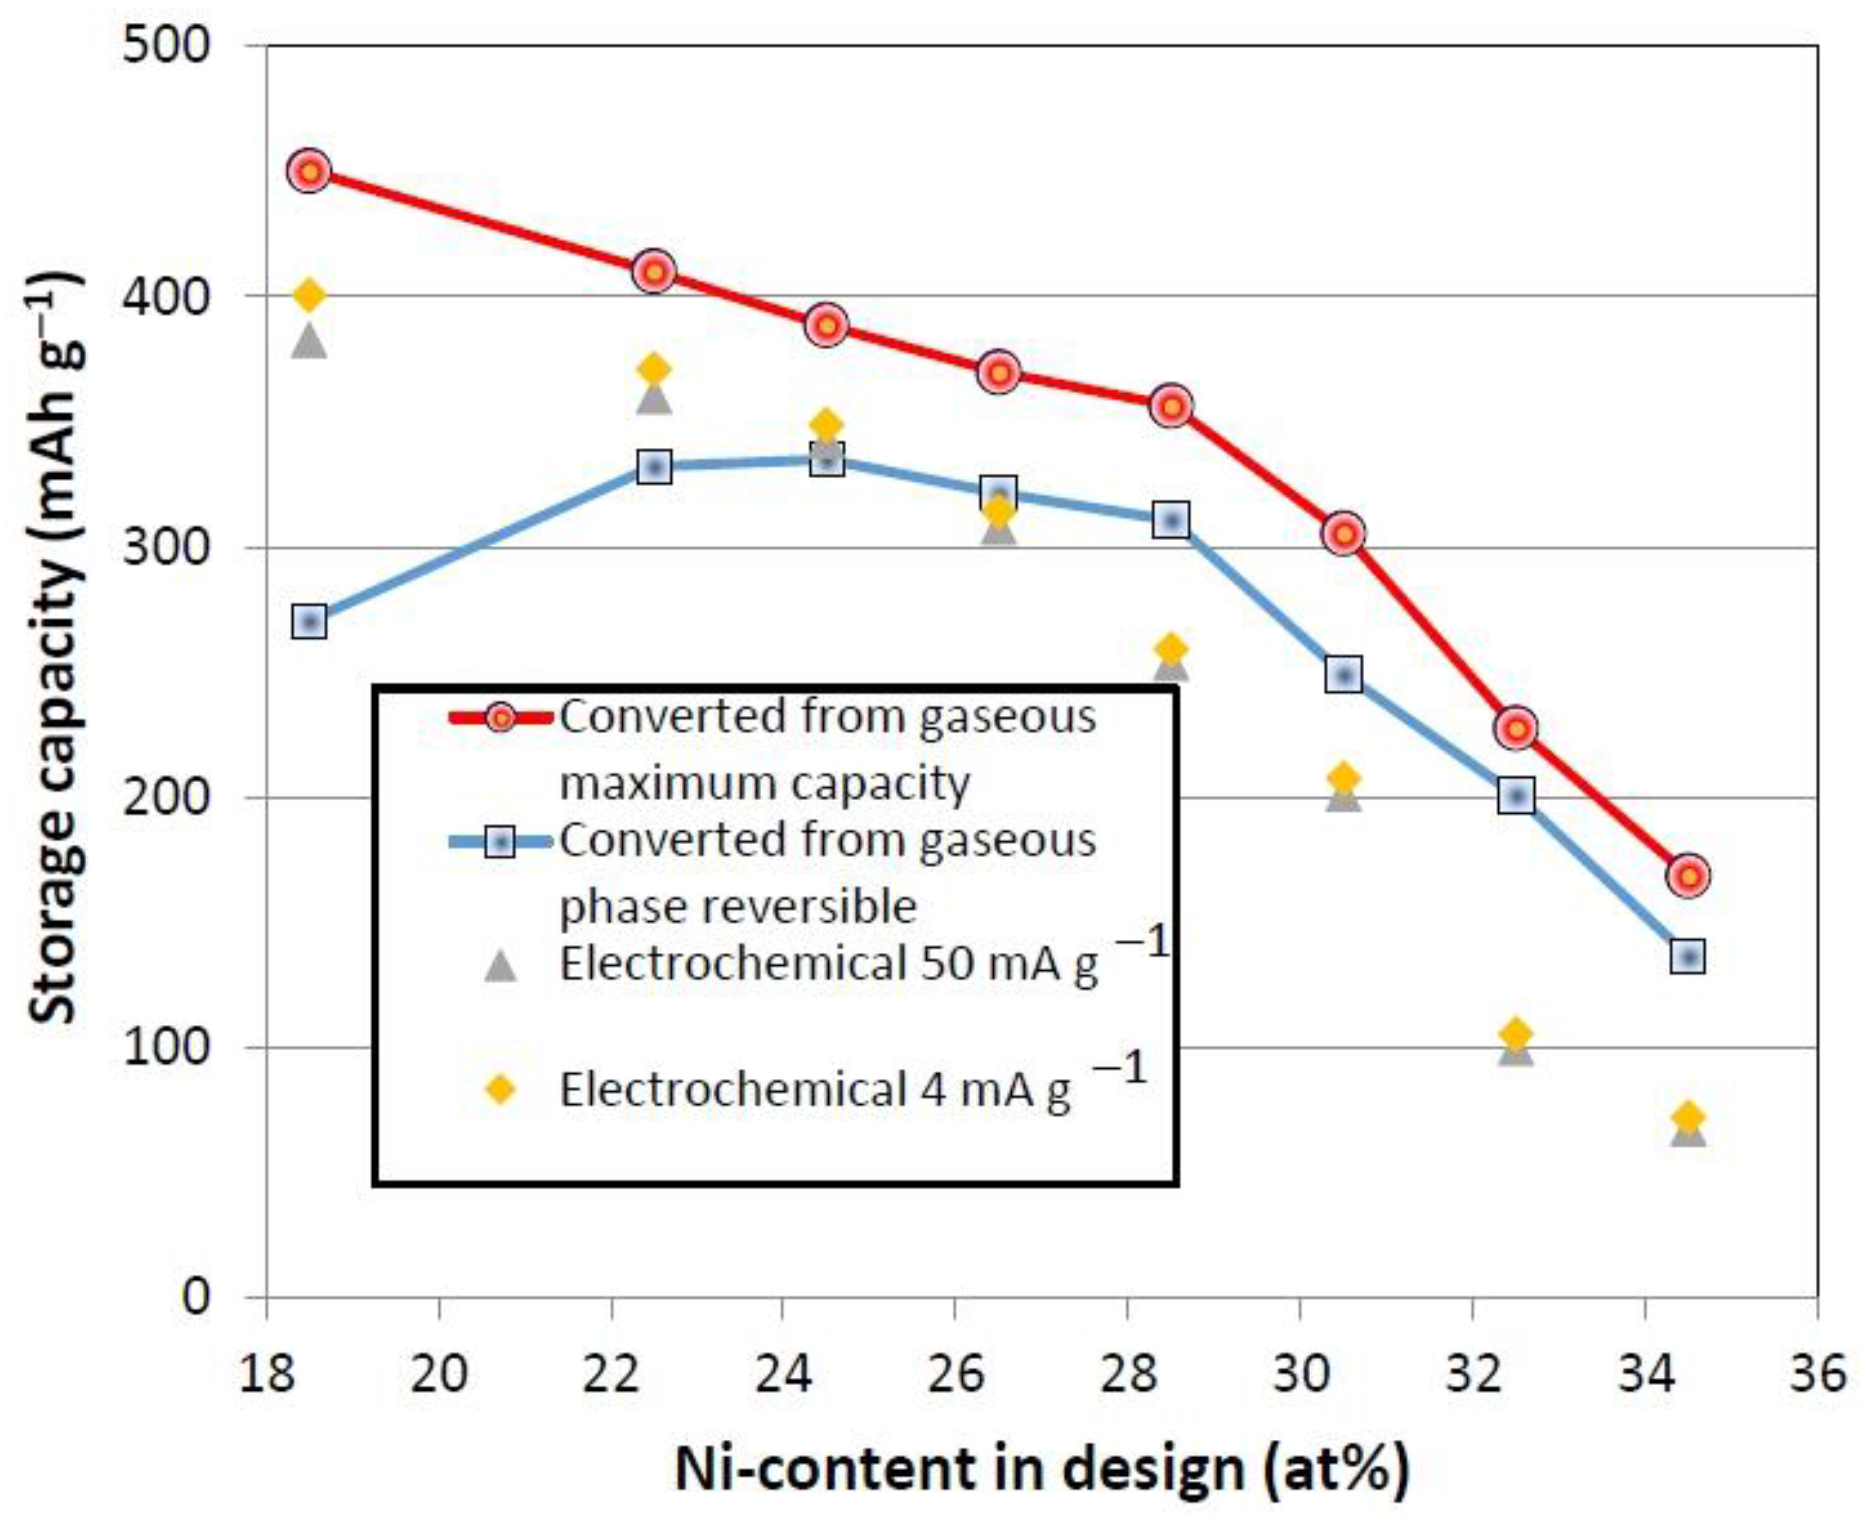
3.4. Gaseous Phase Study

Gaseous phase hydrogen storage properties of the alloys were studied by PCT. All samples are activated with one thermal cycle in the presence of hydrogen. Consequent measurements did not change the PCT characteristic significantly. The resulting absorption and desorption isotherms measured at 30 °C and 60 °C are shown in Figure 6. Information obtained from the PCT study is summarized in Table 4. A two-phase characteristic can be observed in alloys P22–P24. The heat of hydride formation of each of the phases can be estimated from the atomic percentages and the heats of hydride formation (ΔHh) for the three main hydride-former atoms, i.e., Zr (ΔHh = −163 kJ·mol H2−1 for ZrH2), Ti (ΔHh = −124 kJ·mol H2−1 for TiH2), and V (ΔHh = −34 kJ·mol H2−1 for VH2) [42]. For example, the calculated ΔHh for TiNi will be −62 kJ·mol H2−1, which is close to the experimental result of −60 kJ·mol H2−1 [43]. The such-obtained ΔHh for the constituent phases for P22 are −25.5 (BCC), −49.6 (TiNi), and −46.8 kJ·mol H2−1 (C14). Therefore, the main plateau at higher equilibrium pressure in the PCT isotherm for P22 alloy is attributed to the main BCC phase, and the second plateau, which occurs at lower hydrogen concentration and lower equilibrium pressure, is attributed to the combination of TiNi and C14 secondary phases. The same estimation is performed on alloy P26, and the results are −22.4 (BCC), −25.2 (VNi), −43.8 (TiNi), −41.3 (C14), and −41.7 kJ·mol H2−1 (C15). The first two phases (BCC and VNi) are considered to be storage phases, which are responsible for the plateau in the PCT isotherm, and the other three phases with higher Ni-content are the catalytic phases that do not contribute directly to the hydrogen storage capacity.
Figure 6. (a) 30 °C and (b) 60 °C pressure-concentration-temperature (PCT) isotherms of alloys P17, P22, P23, P24; and (c) 30 °C and (d) 60 °C of alloys P25, P26, P27, and P28. Open and solid symbols are for absorption and desorption curves, respectively.
Batteries 01 00034 g006
Table 4. Summary of gaseous phase and thermodynamic properties. The ΔH and ΔS were calculated from the equilibrium pressure plateaus measured at 30, 60, and 90 °C with the error bars of about ±2%.
Alloy No.Desorption pressure @ 30 °CDesorption pressure @ 60 °CMaximum capacity @ 30 °CReversible capacity @ 30 °CPCT hysteresis @ 30 °CPCT hysteresis @ 60 °C−ΔH−ΔS
(MPa)(MPa)(wt%)(wt%)(kJ·mol−1)(J·mol−1·K−1)
P170.170.531.68 1.011.061.10 30.9 107
P220.210.601.531.241.141.1329.9105
P230.220.791.451.251.201.0635.3123
P240.32 1.071.381.201.100.8634.2122
P250.451.421.331.160.770.8232.1119
P260.43 1.361.140.930.790.8432.4119
P271.063.200.850.750.790.4631.0122
P281.90-0.630.510.76---
As the Ni-content in the alloy increases, the plateau pressure in the BCC phase increases monotonically (due to the decrease in the BCC unit cell volume), the maximum storage capacity decreases, and the reversible storage first increases (due to the increase in abundance of catalytic C14 phase and the shrinkage in unit cell volumes for BCC, TiNi, and C14 phases) and then decreases (due to the reduction in the maximum capacity). Hysteresis of the PCT isotherm is defined as ln(Pa/Pd), where Pa and Pd are the absorption and desorption equilibrium pressures at the main plateau (BCC phase), respectively. In general, the hysteresis measured at 30 °C divides the alloys into two groups: alloys with relatively low Ni-content (P17, P22–P24) that show higher hysteresis than those in the other group (P25–P28). PCT hysteresis represents the energy required to elastically distort the lattice at the metal/hydride interface [44]. The first alloys (P17, P22–P24) also have distinctively larger unit cells (Figure 2) and also are free of C15 and σ-VNi phases. The connection between PCT hysteresis and structural properties of these alloys requires further investigation.
In order to study the thermodynamic properties of these alloys, equilibrium pressure in the BCC plateau at 30 °C and 60 °C were used to estimate the ΔHh and entropy (ΔS) by the equation:
ΔG = ΔHhTΔS = RTln P
where R is the ideal gas constant and T is the absolute temperature. Results of these calculations are listed in Table 4. The values may not be accurate and can only be used for comparison among these alloys. As the Ni-content in the design increases, both ΔHh and ΔS decrease first and then increase. The decrease in ΔHh of the first three alloys (P17, P22 and P23) is due to the reduction in the TiNi phase abundance reducing the proximity effects from the catalytic phases [45]. Further increase in ΔHh is due to the shrinking unit cell volume in BCC phase [46]. ΔS is an indication of how far the MH system is from a perfect, ordered state. The theoretical value of ΔS is the entropy of hydrogen gas, which is close to –135 J mol−1 K−1. Alloy P23 shows the lowest ΔHh and ΔS, and this indicates that it has the least interaction between the main storage phase and the catalytic phase, acting as a single BCC phase MH alloy.

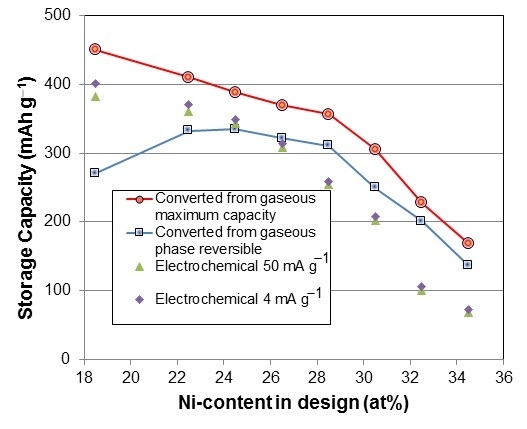
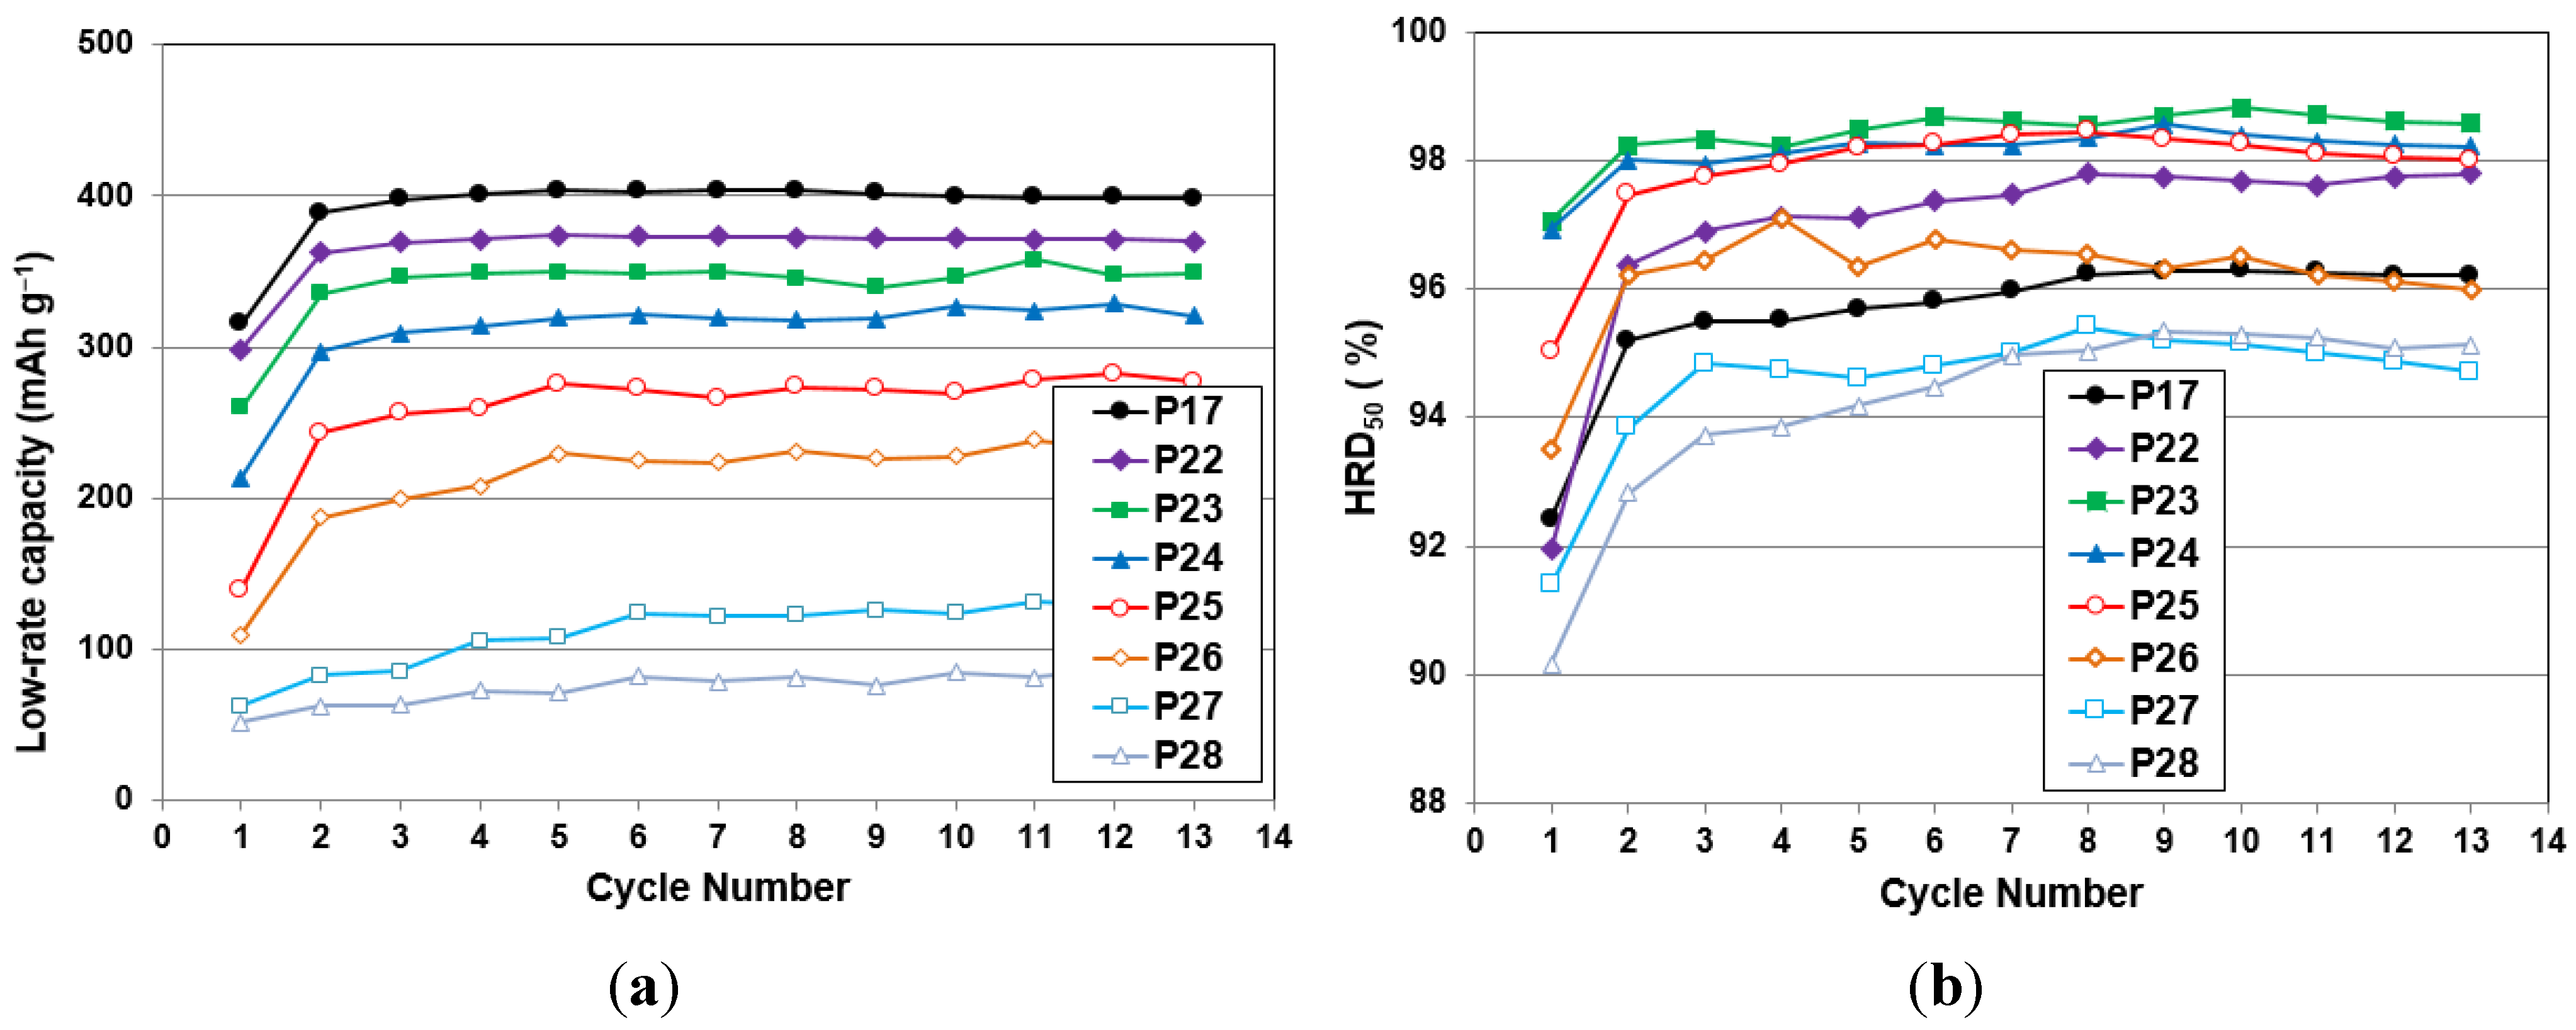
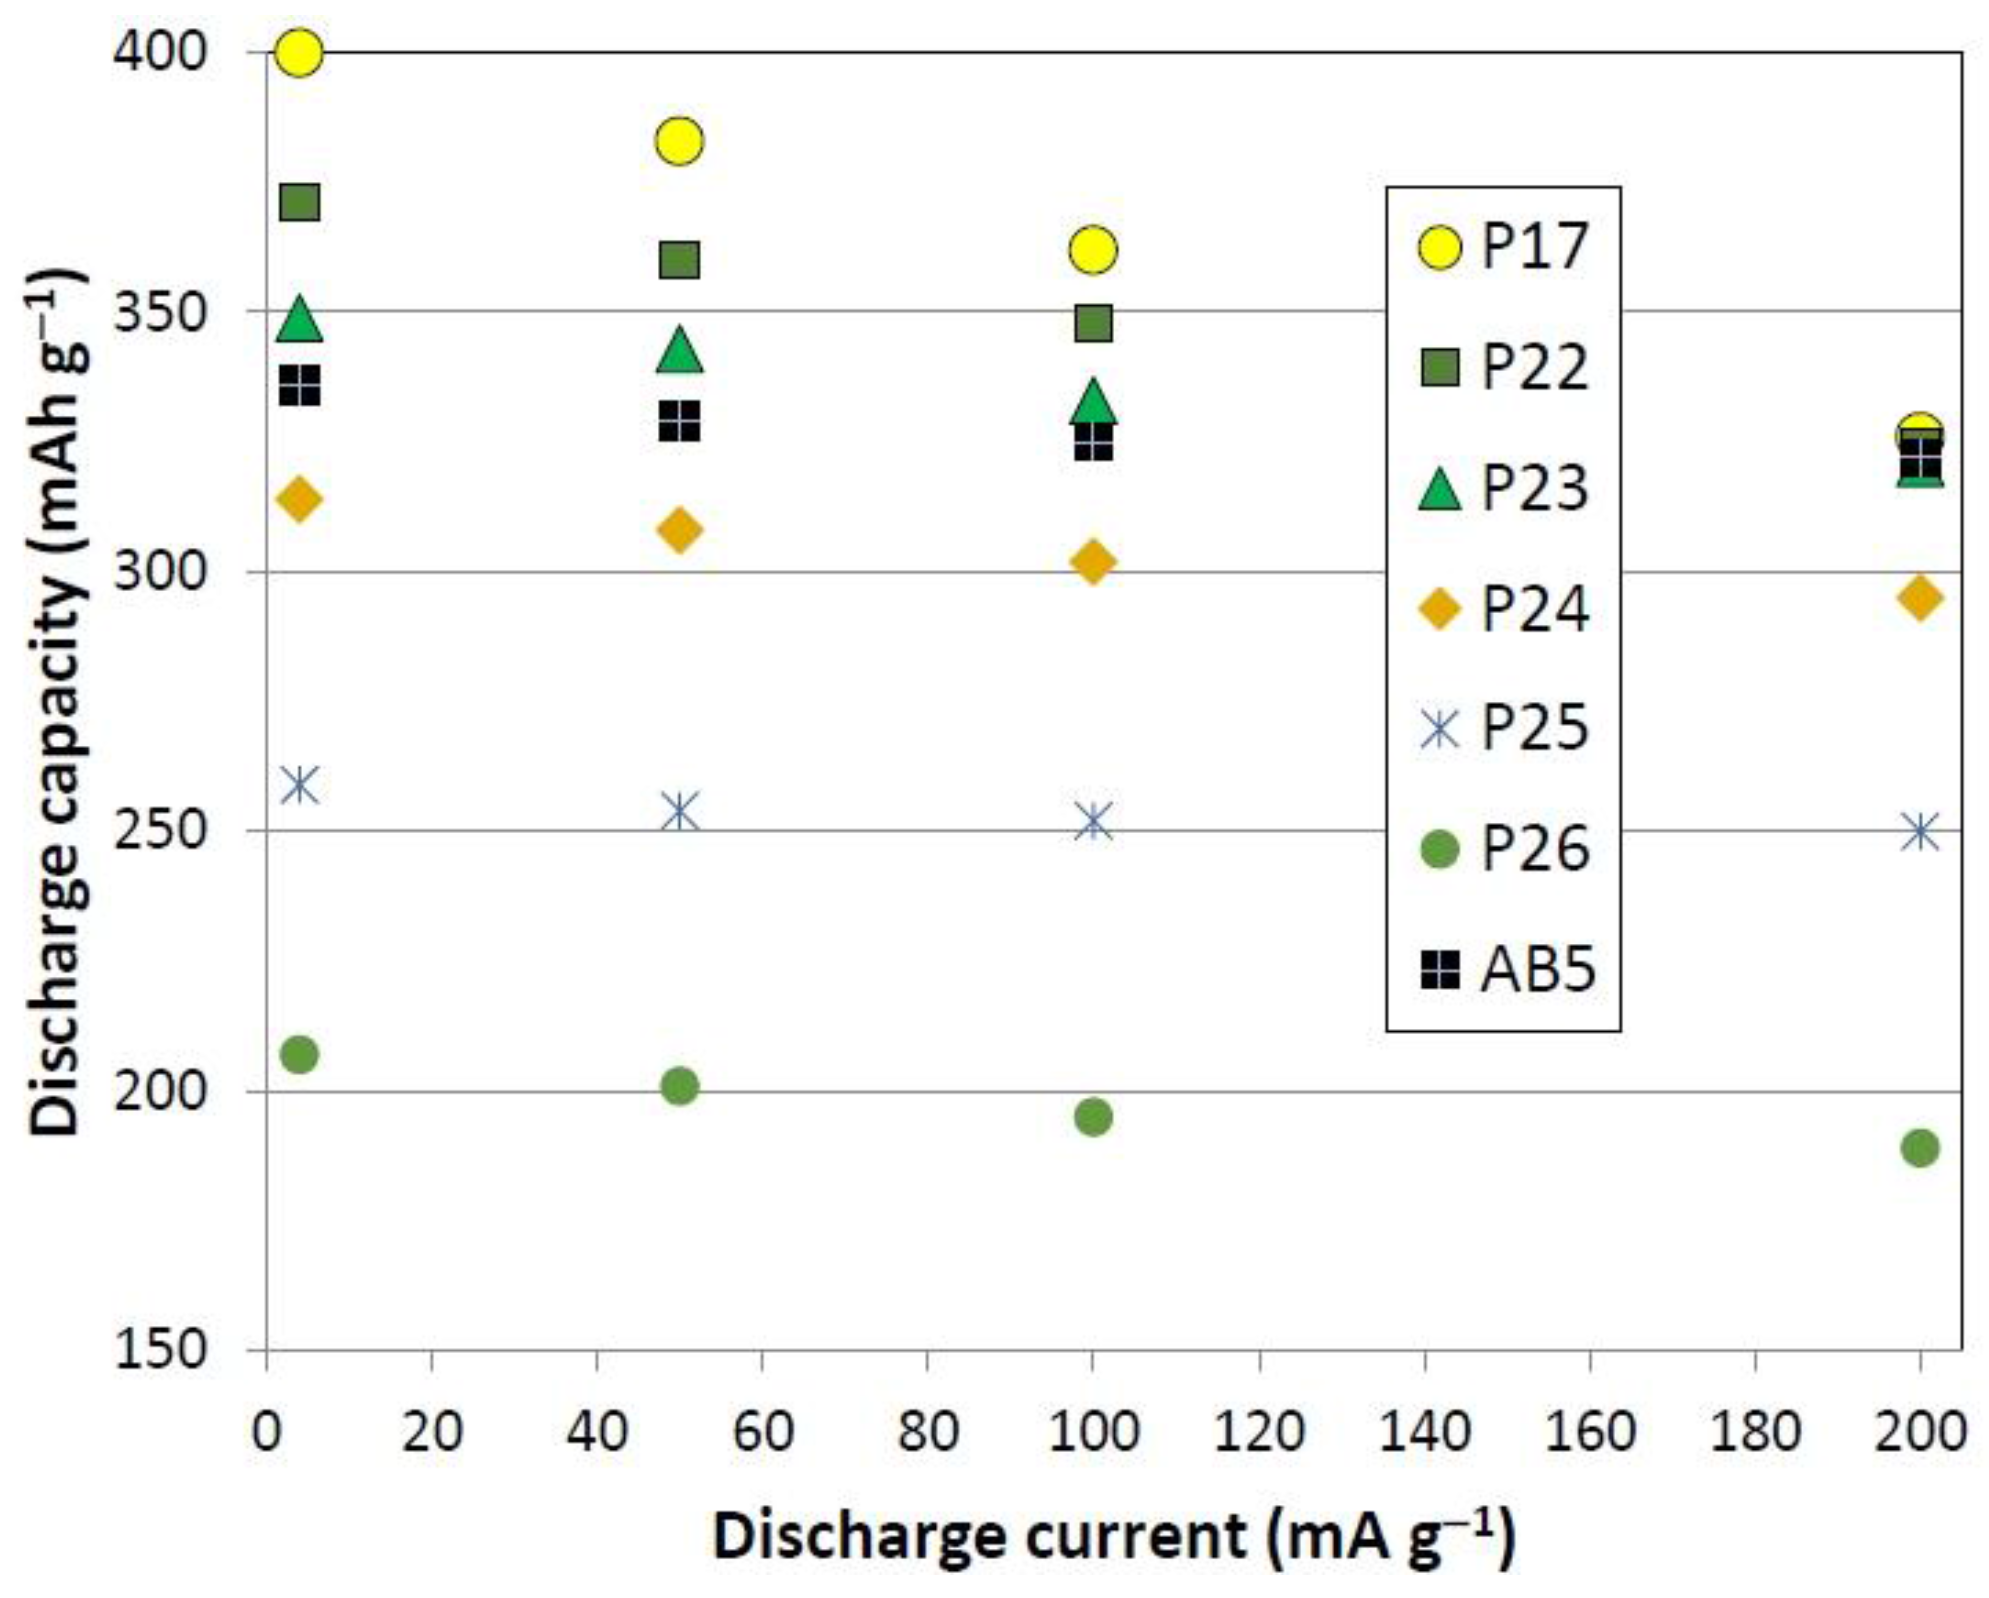
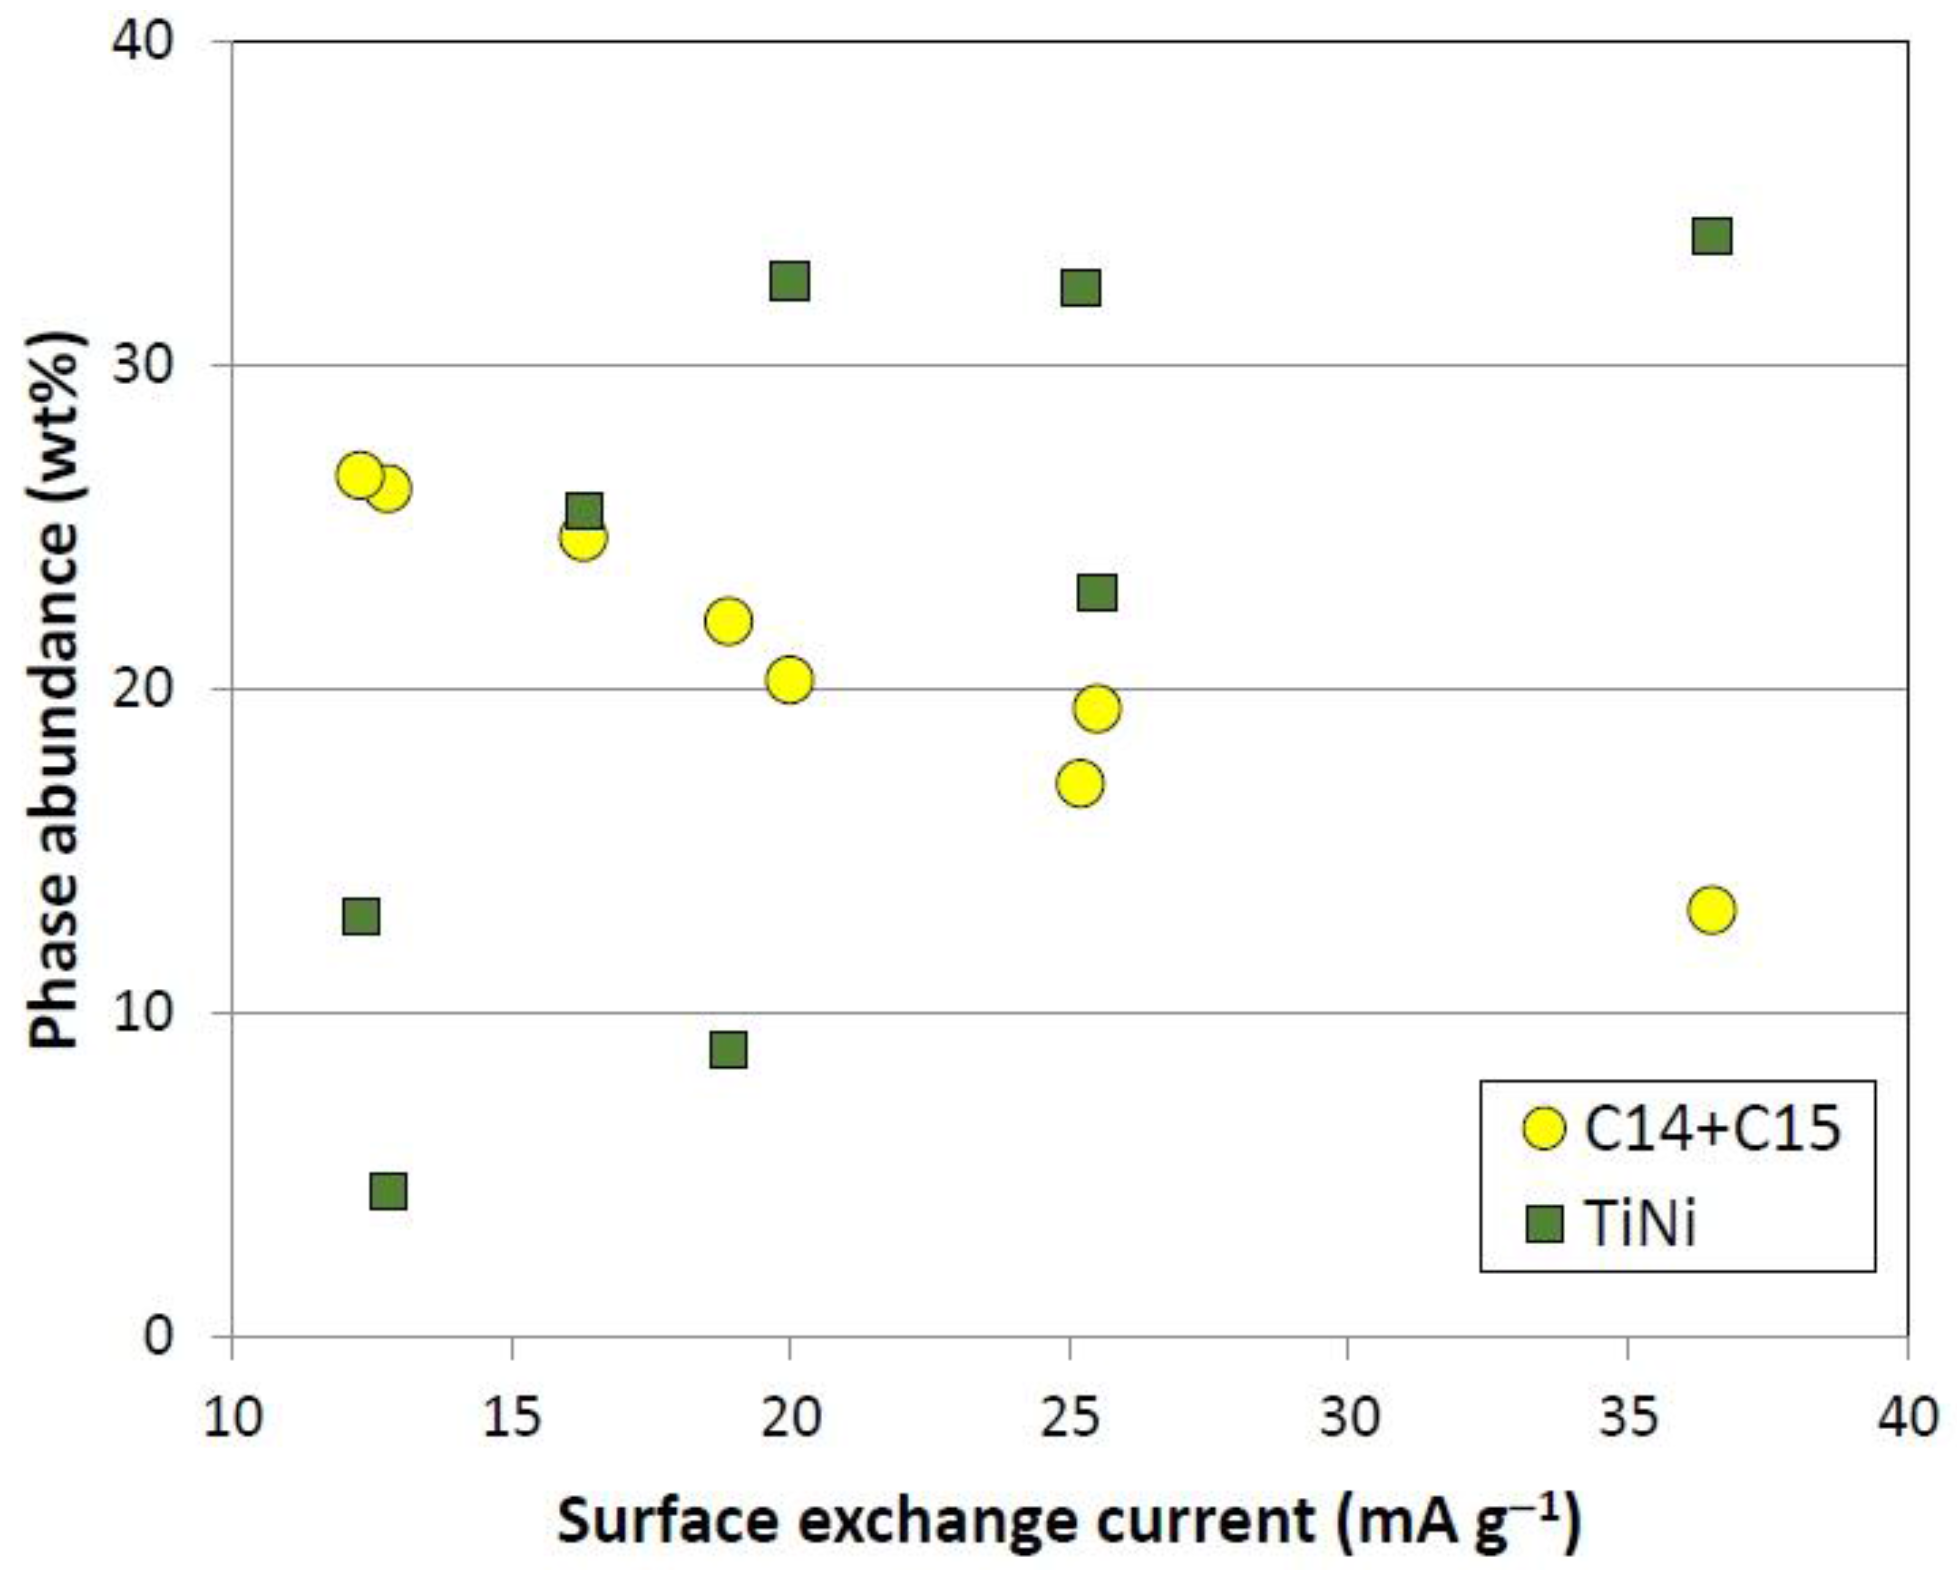
3.5. Electrochemical Measurement

The electrochemical discharge capacity of each alloy was measured in a flooded-cell configuration against a partially pre-charged Ni(OH)2 positive electrode. No alkaline pretreatment was applied before the half-cell measurement. For the activation behavior study, each sample electrode was charged at a constant current density of 50 mA·g−1 for 10 h and then discharged at a current density of 50 mA·g−1 followed by two pulls at 12 mA·g−1 and 4 mA·g−1. The results of the low-rate (full) capacity and the HRD50 (defined as the ratio in capacities obtained between 50 mA·g−1 and 4 mA·g−1) for the first thirteen cycles are plotted in Figure 7. From the comparison, it is easy to see that the activation in low-rate capacity is similar for all alloys (Figure 7a), but the activation in HRD (more related to surface oxidation and pulverization) is easier in alloys with lower Ni-content and becomes more difficult with the increase in Ni-content (Figure 7b). Capacities measured at the 4th cycle are listed in Table 5 together with other important electrochemical and magnetic properties of the alloys in this study. The capacities measured at the 4th cycle are also plotted in Figure 8 with the gaseous phase capacity converted to a theoretical electrochemical capacity by
1 wt% of H2 = 268 mAh·g−1
As the Ni-content in the design increases, both capacities measured at 50 mA·g−1 and 4 mA·g−1 rates decrease monotonically, which is similar to the decrease in the maximum storage capacities measured in the gaseous phase. In a conventional MH alloy, the electrochemical capacities measured at different rates fall between the boundaries set by the equivalent maximum and reversible hydrogen storage capacities [29,47,48,49,50]. In the current study, the electrochemical capacities drop below the lower bound set by the gaseous phase reversible capacity for alloys P24–P28. It is due to the relatively high equilibrium pressure at room temperature (RT) of these alloys (>0.6 MPa) preventing a full charge under the open flooded half-cell configuration. The electrochemical discharge capacities of these alloys should be higher in a sealed cell where the cell pressure can be kept as high as 2.8 MPa.
Figure 7. Activation behavior for the first 13 cycles of (a) low-rate capacity and (b) HRD50 (ratio of capacities at 50 mA·g−1 and 4 mA·g−1 discharge rates).
Batteries 01 00034 g007
Table 5. Summary of electrochemical and magnetic properties. High-rate dischargeability (HRD)200 is the ratio of capacities measured at 200 mA·g−1 and 4 mA·g−1. RT: room temperature.
Alloy No.4th cycle capacity @ 50 mA·g−14th cycle capacity @ 4 mA·g−1HRD200Activation cycle to reach maximum capacityDiffusion coefficient, D @RTExchange current Io @RTMsH1/2Open circuit voltage
(mAh·g−1)(mAh·g−1)(1010·cm2·s−1)(mA·g−1)(emu·g−1)(kOe)(V)
P17382.7400.70.815 6 1.6936.5 0.390.111.302
P22360.4371.00.87351.6725.21.400.111.306
P23342.6348.80.92052.9525.50.620.111.326
P24308.1314.10.93962.8520.00.920.101.330
P25253.9259.20.96551.5818.91.030.101.312
P26201.6207.70.91351.2212.81.810.111.288
P27100.1105.6-61.3912.31.420.141.264
P2868.072.4-61.4616.31.400.121.332
Figure 8. Plot of gaseous phase and electrochemical storage capacities as functions of Ni-content in design.
Batteries 01 00034 g008
Half-cell HRD200 of each alloy, defined as the ratio of discharge capacities measured at 200 mA·g−1 and 4 mA·g−1, is listed in Table 5. As the Ni-content in the alloy increases, HRD200 increases in the beginning, maximizes at alloy P25 and then decreases. When the discharge capacities at different discharge rates are compared against a commercially available standard AB5 MH alloy with a HRD200 of 0.958 (Figure 9), only alloy P25 shows better rate-capability, but its capacities are too low. We find that although BCC-TiNi-Laves MH alloys have higher discharge capacities at a lower rate (<200 mA·g−1), their high-rate capacities are not as good as in conventional AB5 MH alloys.
In order to further study the inferior HRD capability in BCC-TiNi-Laves MH alloys compared to AB5 MH alloys, both the bulk diffusion coefficient (D) and the surface exchange current (Io) of the alloys under the current study were measured electrochemically. The details of both parameters’ measurements were previously reported [51], and the values are listed in Table 5. As the Ni-content in design increases, the D value increases and then decreases, while Io decreases. The evolution of the HRD is more similar to the trend in D than in Io, and therefore we conclude that the high-rate performance in this series of alloys is more related to the bulk diffusion than to the surface reaction. The increase in D initially is due to the shrinking unit cells for BCC, TiNi, and C14 phases (Table 2). In a comparison study, C15 phase shows faster hydrogen bulk diffusion than C14 phase [52]; therefore, the subsequent decrease in D with higher Ni-content is most likely related to the formation of σ-VNi phase. CALPHAD thermodynamic calculations show that hydrogen permeability is reduced with higher Ni-content in V-Ni alloys [53]. Compared to the D value from a typical AB5 MH alloy (2.55 × 10⁻¹⁰ cm2·s−1 [54]), alloys P23 and P24 have faster bulk hydrogen diffusion. The reason the BCC-TiNi-Laves alloys have lower HRDs despite better bulk diffusion is because of their relatively low Io values (Table 5) compared to AB5 MH alloy (43.2 mA·g−1, [54]). When the abundances of the catalytic secondary phases (Laves and TiNi) are plotted against the Io values as shown in Figure 10, it is clear that while Laves phases (C14 and C15) appear beneficial, TiNi phase appears detrimental to the surface electrochemical reaction. Similar findings regarding TiNi phase hindering the HRD performance of Laves phase based AB2 MH alloys were reported before [55].
Figure 9. Rate-dependent discharge capacity for alloys P17, P22–P26 and a commercially available AB5 MH alloy.
Batteries 01 00034 g009
Figure 10. Plots of Laves (C14 + C15) and TiNi phase abundances vs. the surface exchange current.
Batteries 01 00034 g010
The lower surface reaction currents measured in the current series of alloys were further investigated by magnetic susceptibility measurement. Details of the background and the experimental method are published in [56]. Metallic Ni is an active catalyst for the water splitting and recombination reactions that contribute to the Io in this electrochemical system, and this technique allows us to obtain the saturated magnetic susceptibility (MS), a quantification of the amount of surface metallic Ni (the product of preferential oxidation), and the magnetic field strength at one-half of the MS value (H1/2), a measure of the average reciprocal number of Ni atoms in a metallic cluster. MS and H1/2 values for the alloys in this study are listed in Table 5. While the H1/2 values of these alloys are very similar, the trend of MS values with the increase in Ni-content is not obvious. When these values are compared to values from an AB5 MH alloy (MS = 0.434 emu·g−1 and H1/2= 0.17 kOe [54]), we find that all alloys except P17 have higher MS values. These BCC-TiNi-Laves alloys have higher weight percentage of metallic Ni in their activated surfaces and should have better HRD [57]. The reason for the lower Io values in this current series of alloys may be due to their relatively larger Ni cluster sizes, resulting in less surface area, which is indicated by smaller H1/2 values. Systematic transmission electron microscope work is necessary here to continue the investigation of the metallic inclusions, particularly their size and shape, embedded in the activated surface oxide layer of these alloys.
The open circuit voltage (OCV) of the electrochemical cells comprising a negative electrode from each alloy and a Ni(OH)2/NiOOH positive electrode is listed in Table 5. OCV is important for the power density of the cell and is usually proportional to the logarithm of equilibrium pressure, typical of most MH alloys. In the previous study in a series of BCC-C14 alloys, the OCV is inversely proportional to the desorption equilibrium pressure [26]. In the current series of alloys, the plateau pressure increases with the increase in Ni-content, but the OCV first increases and then decreases except for the last alloy P28, which shows very small discharge capacity due to insufficient charging in the open-air configuration. The evolution of OCV in this study is similar to the trends in HRD and maximizes with alloy P24.

4. Conclusions

The Ni-content in a base alloy, P17, was increased with the intention to improve the electrochemical high-rate performance in the negative electrode active material for (Ni/MH) batteries. Although the HRD improved with the increase in Ni-content at the expense of V, the discharge capacity was deteriorated. An alloy, P23, with a composition of Ti15.6Zr2.1V36Cr11.2Mn6.9Co1.4Ni26.5Al0.3 shows a good balance between capacity and high-rate capability. The increase in Ni-content shifts the Laves phase from C14 into C15 because of the increase in the average electron density in the phase. The increase in Ni-content also promotes a new σ-VNi phase, which has a similar hydrogen-metal bond strength as the main BCC phase. The new phase is associated with reduced bulk diffusion of hydrogen. Further improvement in high-rate capability in this family of alloys should maintain the Ni-level at 22.5 at% to 26.5 at% and increase the content of other C14-promoters, such as Zr and Hf.

Acknowledgments

This work is financially supported by Advanced Research Projects Agency-Energy (ARPA-E) under the robust affordable next generation EV-storage (RANGE) program (DE-AR0000386). The authors thank these colleagues for technical assistance: Simon Ng, Shuli Yan, Shiuan Chang (Wayne State University), Michael A. Fetcenko, Baoquan Huang, Tiejun Meng, David Pawlik, Allen Chan, Ryan J. Blankenship and Su Cronogue (BASF-Ovonic).

Conflicts of Interest

The authors declare no conflict of interest.

References

  1. Iba, H.; Akiba, E. Hydrogen absorption and microstructure in BCC alloys with C14-type Lave phase. J. Jpn. Inst. Met. Mater. 1994, 58, 1225–1232. [Google Scholar]
  2. Akiba, E.; Iba, H. Hydrogen absorption by Laves phase related BCC solid solution. Intermetallics 1998, 6, 461–470. [Google Scholar] [CrossRef]
  3. Enomoto, M. The Cr-Ti-V system. J. Phase Equilibria 1992, 13, 195–200. [Google Scholar] [CrossRef]
  4. Inoue, H.; Arai, S.; Iwakura, C. Crystallographic and electrochemical characterization of TiV4−xNix alloys for nickel-metal hydride batteries. Electrochim. Acta 1996, 41, 937–939. [Google Scholar] [CrossRef]
  5. Yu, X.; Wu, Z.; Xia, B.; Xu, N. A Ti-V-based bcc phase alloy for use as metal hydride electrode with high discharge capacity. J. Chem. Phys. 2004, 121, 987–990. [Google Scholar] [CrossRef] [PubMed]
  6. Young, K.-H.; Ouchi, T.; Huang, B.; Nei, J. Structure, hydrogen storage, and electrochemical properties of body-centered-cubic Ti40V30Cr15Mn13X2 alloys (X = B, Si, Mn, Ni, Zr, Nb, Mo, and La). Batteries 2015, 1, 74–90. [Google Scholar] [CrossRef]
  7. Chen, N.; Li, R.; Zhu, Y.; Liu, Y.; Pan, H. Electrochemical hydrogenation and dehydrogenation mechanisms of the Ti-V base multiphase hydrogen storage electrode alloy. Acta Metall. Sin. 2004, 40, 1200–1204. [Google Scholar]
  8. Iba, H.; Akiba, E. The relation between microstructure and hydrogen absorbing property in Laves phase-solid solution multiphase alloys. J. Alloy. Compd. 1995, 231, 508–512. [Google Scholar] [CrossRef]
  9. Rönnebro, E.; Noréus, D.; Sakai, T.; Tsukahara, M. Structural studies of a new Laves phase alloy (Hf,Ti)(Ni,V)2 and its very stable hydride. J. Alloy. Compd. 1995, 231, 90–94. [Google Scholar] [CrossRef]
  10. Tsukahara, M.; Takahashi, K.; Mishima, T.; Isomura, A.; Sakai, T. V-based solid solution alloys with Laves phase network: Hydrogen absorption properties and microstructure. J. Alloy. Compd. 1996, 236, 151–155. [Google Scholar] [CrossRef]
  11. Qiu, S.; Chu, H.; Zhang, Y.; Sun, D.; Song, X.; Sun, L.; Fen, X. Electrochemical kinetics and its temperature dependence behaviors of Ti0.17Zr0.08V0.35Cr0.10Ni0.30 alloy electrode. J. Alloy. Compd. 2009, 471, 453–456. [Google Scholar] [CrossRef]
  12. Iba, H.; Akiba, E. Hydrogen absorption and modulated structure in Ti–V–Mn alloys. J. Alloy. Compd. 1997, 253–254, 21–24. [Google Scholar] [CrossRef]
  13. Shashikala, K.; Banerjee, S.; Kumar, A.; Pai, M.R.; Pillai, C.G.S. Improvement of hydrogen storage properties of TiCrV alloy by Zr substitution for Ti. Int. J. Hydrog. Energy 2009, 34, 6684–6689. [Google Scholar] [CrossRef]
  14. Yang, X.; Li, J.; Zhang, T.; Hu, R.; Xue, X.; Fu, H. Role of defect structure on hydrogenation properties of Zr0.9Ti0.1V2 alloy. Int. J. Hydrog. Energy 2011, 36, 9318–9323. [Google Scholar] [CrossRef]
  15. Huot, J.; Akiba, E.; Ogura, T.; Ishido, Y. Crystal structure, phase abundance and electrode performance of Laves phase compounds (Zr, A)V0.5Ni1.1Mn0.2Fe0.2 (A ≡ Ti, Nb or Hf). J. Alloy. Compd. 1995, 218, 101–109. [Google Scholar] [CrossRef]
  16. Qiu, S.-J.; Chu, H.-L.; Zhang, J.; Zhang, Y.; Sun, L.-X.; Xu, F.; Sun, D.-L.; Ouyang, L.-Z.; Zhu, M.; Grolier, J.-P.E.; et al. Effect of La partial substitution for Zr on the structural and electrochemical properties of Ti0.17Zr0.08−xLaxV0.35Cr0.1Ni0.3 (x = 0–0.04) electrode alloys. Int. J. Hydrog. Energy 2009, 34, 7246–7252. [Google Scholar] [CrossRef]
  17. Huang, Z.; Cuevas, F.; Liu, X.; Jiang, L.; Wang, S.; Latroche, M.; Du, J. Effects of Si addition on the microstructure and the hydrogen storage properties of Ti26.5V45Fe8.5Cr20Ce0.5 BCC solid solution alloys. Int. J. Hydrog. Energy 2009, 34, 9385–9392. [Google Scholar] [CrossRef]
  18. Kamegawa, A.; Shirasaki, K.; Tamura, T.; Kuriiwa, T.; Takamura, H.; Okada, M. Crystal structure and protium absorption properties of Ti–Cr–X alloys. Mater. Trans. 2002, 43, 470–473. [Google Scholar] [CrossRef]
  19. Liu, Y.; Zhang, S.; Li, R.; Gao, M.; Zhong, K.; Miao, H.; Pen, H. Electrochemical performances of the Pd-added Ti-V-based hydrogen storage alloys. Int. J. Hydrog. Energy 2008, 33, 728–734. [Google Scholar] [CrossRef]
  20. Kuriiwa, T.; Tamura, T.; Amemiya, T.; Fuda, T.; Kamegawa, A.; Takamura, H.; Okada, M. New V-based alloys with high protium absorption and desorption capacity. J. Alloy. Compd. 1999, 293–295, 433–436. [Google Scholar] [CrossRef]
  21. Yu, J.; Liu, B.; Cho, K.; Lee, J. The effects of partial substitution of Mn by Cr on the electrochemical cycle life of Ti-Zr-V-Mn-Ni alloy electrodes of a Ni/MH battery. J. Alloy. Compd. 1998, 278, 283–290. [Google Scholar] [CrossRef]
  22. Lee, H.-H.; Lee, K.-Y.; Lee, J.-Y. The Ti-based metal hydride electrode for Ni–MH rechargeable batteries. J. Alloy. Compd. 1996, 239, 63–70. [Google Scholar] [CrossRef]
  23. Kim, J.; Paik, C.; Cho, W.; Cho, B.; Yun, K.; Kim, S. Corrosion behaviour of Zr1−xTixV0.6Ni1.2M0.2 (M = Ni, Cr, Mn) AB2-type metal hydride alloys in alkaline solution. J. Power Sources 1998, 75, 1–8. [Google Scholar] [CrossRef]
  24. Young, K.; Wong, D.; Wang, L. Effect of Ti/Cr content on the microstructures and hydrogen storage properties of Laves phase-related body-centered-cubic solid solution alloys. J. Alloy. Compd. 2015, 622, 885–893. [Google Scholar] [CrossRef]
  25. Young, K.; Ouchi, T.; Nei, J.; Wang, L. Annealing effects on Laves phase-related body-centered-cubic solid solution metal hydride alloys. J. Alloy. Compd. 2016, 654, 216–225. [Google Scholar] [CrossRef]
  26. Young, K.; Ouchi, T.; Nei, J.; Meng, T. Effects of Cr, Zr, V, Mn, Fe, and Co to the hydride properties of Laves phase-related body-centered-cubic solid solution alloys. J. Power Sources 2015, 281, 164–172. [Google Scholar] [CrossRef]
  27. Young, K.; Ouchi, T.; Reichman, B.; Koch, J.; Fetcenko, M.A. Effects of Mo additive on the structure and electrochemical properties of low-temperature AB5 metal hydride alloys. J. Alloy. Compd. 2011, 509, 3995–4001. [Google Scholar] [CrossRef]
  28. Chai, Y.; Zhao, M. Structure and electrochemical properties of Ti0.25V0.35Cr0.40−xNix (x = 0.05–0.40) solid solution alloys. Int. J. Hydrog. Energy 2005, 30, 279–283. [Google Scholar] [CrossRef]
  29. Young, K.; Fetcenko, M.A.; Li, F.; Ouchi, T. Structural, thermodynamic, and electrochemical properties of TixZr1−x(VNiCrMnCoAl)2 C14 Laves phase alloys. J. Alloy. Compd. 2008, 464, 238–247. [Google Scholar] [CrossRef]
  30. Young, K.; Ouchi, T.; Fetcenko, M.A. Roles of Ni, Cr, Mn, Sn, Co, and Al in C14 Laves phase alloys for NiMH battery application. J. Alloy. Compd. 2009, 476, 774–781. [Google Scholar] [CrossRef]
  31. Li, R.; Pan, H.; Gao, M.; Zhu, Y.; Liu, Y.; Jin, Q.; Lei, Y. Structural and electrochemical properties of hydrogen storage alloys Ti0.8Zr0.2V2.7Mn0.5Cr0.8Nix (x = 1.50–2.25). J. Alloy. Compd. 2004, 373, 223–230. [Google Scholar] [CrossRef]
  32. Pan, H.; Li, R.; Gao, M.; Liu, Y.; Lei, Y.; Wang, Q. Effects of Ni on the structural and electrochemical properties of Ti-V-based hydrogen storage alloys. Int. J. Hydrog. Energy 2006, 31, 1188–1195. [Google Scholar] [CrossRef]
  33. Pearson, W.; Christian, J. The structure of the σ phase in vanadium-nickel alloys. Acta Crystallogr. 1952, 5, 157–162. [Google Scholar] [CrossRef]
  34. Massalski, T.; Okamoto, H.; Subramanian, P.; Kacprzak, L. Binary Alloy Phase Diagram, 2nd ed.; ASM International: Materials Park: Ohio, USA, 1990; p. 2880. [Google Scholar]
  35. Kodentzov, A.A.; Dunaev, S.F.; Slusarenko, E.M. Determination of the phase diagram of the V-Ni-Cr system using diffusion couples and equilibrated alloys. J. Less Common Met. 1987, 135, 15–24. [Google Scholar] [CrossRef]
  36. Yan, Y.; Chen, Y.; Liang, H.; Zhou, X.; Wu, C.; Tao, M.; Pang, L. Hydrogen storage properties of V–Ti–Cr–Fe alloys. J. Alloy. Compd. 2008, 454, 427–431. [Google Scholar] [CrossRef]
  37. Young, K.; Nei, J.; Wong, D.; Wang, L. Structural, hydrogen storage, and electrochemical properties of Laves-phase related body-centered-cubic solid solution metal hydride alloys. Int. J. Hydrog. Energy 2014, 39, 21489–21499. [Google Scholar] [CrossRef]
  38. Johnston, R.L.; Hoffmann, R. Structure-bonding relationships in the Laves phases. Z. Anorg. Allg. Chem. 1992, 616, 105–120. [Google Scholar] [CrossRef]
  39. Nei, J.; Young, K.; Salley, S.O.; Ng, K. Determination of C14/C15 phase abundance in Laves phase alloys. Mater. Chem. Phys. 2012, 136, 520–527. [Google Scholar] [CrossRef]
  40. Young, K.; Fetcenko, M.A.; Li, F.; Ouchi, T.; Koch, J. Effect of vanadium substitution in C14 Laves phase alloys for NiMH battery application. J. Alloy. Compd. 2009, 468, 482–492. [Google Scholar] [CrossRef]
  41. Young, K.; Ouchi, T.; Huang, B.; Reichman, B.; Fetcenko, M.A. Effect of molybdenum content on structure, gaseous storage, and electrochemical properties of C14-predominant AB2 metal hydride alloys. J. Power Sources 2011, 196, 8815–8821. [Google Scholar] [CrossRef]
  42. Young, K. Metal Hydrides. In Elsevier Reference Module in Chemistry, Molecular Sciences and Chemical Engineering; Elsevier B.V.: Waltham, MA, USA, 2013. [Google Scholar]
  43. Griessen, R.; Riesterer, T. Heat of Formation Models. In Hydrogen in Intermetallic Compounds I; Schlapbach, L., Ed.; Springer-Verlag: Berlin, Germany, 1988; p. 273. [Google Scholar]
  44. Balasubramaniam, R. Hysteresis in metal-hydrogen systems. J. Alloy. Compd. 1997, 253–254, 203–206. [Google Scholar] [CrossRef]
  45. Wong, D.; Young, K.; Nei, J.; Wang, L.; Ng, K. Effects of Nd-addition on the structural, hydrogen storage, and electrochemical properties of C14 metal hydride alloys. J. Alloy. Compd. 2015, 647, 507–518. [Google Scholar] [CrossRef]
  46. Nakano, H.; Wakao, S. Substitution effect of elements in Zr-based alloys with Laves phase for nickel-hydride battery. J. Alloy. Compd. 1995, 231, 587–593. [Google Scholar] [CrossRef]
  47. Nei, J.; Young, K.; Sally, S.O.; Ng, K. Effects of annealing on Zr8Ni19X2 (X = Ni, Mg, Al, Sc, V, Mn, Co, Sn, La, and Hf): Hydrogen storage and electrochemical properties. Int. J. Hydrog. Energy 2012, 37, 8418–8427. [Google Scholar] [CrossRef]
  48. Sun, D.; Jiang, J.; Lei, Y.; Liu, W.; Wu, J.; Wang, Q.; Yang, G. Effects of measurement factor on electrochemical capacity of some hydrogen storage alloys. Mater. Sci. Eng. B 1995, 30, 19–22. [Google Scholar] [CrossRef]
  49. Young, K.; Nei, J.; Huang, B.; Ouchi, T.; Fetcenko, M.A. Studies of Ti1.5Zr5.5V0.5(MxNi1−x)9.5 (M = Cr, Mn, Fe, Co, Cu, Al): Part 2. Hydrogen storage and electrochemical properties. J. Alloy. Compd. 2010, 501, 245–254. [Google Scholar] [CrossRef]
  50. Young, K.; Chao, B.; Huang, B.; Nei, J. Studies on the hydrogen storage characteristic of La1−xCex(NiCoMnAlCuSiZr)5.7 with a B2 secondary phase. J. Alloy. Compd. 2014, 585, 760–770. [Google Scholar] [CrossRef]
  51. Li, F.; Young, K.; Ouchi, T.; Fetcenko, M.A. Annealing effects on structural and electrochemical properties of (LaPrNdZr)0.83Mg0.17(NiCoAlMn)3.3 alloy. J. Alloy. Compd. 2009, 471, 371–377. [Google Scholar] [CrossRef]
  52. Young, K.; Ouchi, T.; Huang, B.; Chao, B.; Fetcenko, M.A.; Bendersky, L.A.; Wang, K.; Chiu, C. The correlation of C14/C15 phase abundance and electrochemical properties in the AB2 alloys. J. Alloy. Compd. 2010, 506, 841–848. [Google Scholar] [CrossRef]
  53. Shim, J.H.; Ko, W.S.; Kim, K.H.; Lee, H.S.; Lee, Y.S.; Suh, J.Y.; Choa, Y.W.; Lee, B.-J. Prediction of hydrogen permeability in V-Al and V-Ni alloys. J. Membr. Sci. 2014, 430, 234–241. [Google Scholar] [CrossRef]
  54. Young, K.; Nei, J. The current status of hydrogen storage alloy development for electrochemical applications. Materials 2013, 6, 4574–4608. [Google Scholar] [CrossRef]
  55. Young, K.; Nei, J.; Ouchi, T.; Fetcenko, M.A. Phase abundances in AB2 metal hydride alloys and their correlations to various properties. J. Alloy. Compd. 2011, 509, 2277–2284. [Google Scholar] [CrossRef]
  56. Young, K.; Wong, D.; Wang, L.; Nei, J.; Ouchi, T.; Yasuoka, S. Mn in misch-metal based superlattice metal hydride alloy—Part 1 structural, hydrogen storage and electrochemical properties. J. Power Sources 2015, 277, 426–432. [Google Scholar] [CrossRef]
  57. Young, K.; Huang, B.; Regmi, R.K.; Lawes, G.; Liu, Y. Comparisons of metallic clusters imbedded in the surface oxide of AB2, AB5, and A2B7 alloys. J. Alloy. Compd. 2010, 506, 831–840. [Google Scholar] [CrossRef]

