Article

All-Solid-State Li-Metal Cell Using Nanocomposite TiO2/Polymer Electrolyte and Self-Standing LiFePO4 Cathode

by
Asia Patriarchi
1,
Hamideh Darjazi
2,3,
Luca Minnetti
1,
Leonardo Sbrascini
1,
Giuseppe Antonio Elia
2,3,
Vincenzo Castorani
4,
Miguel Ángel Muñoz-Márquez
1,3 and
Francesco Nobili
1,3,*
1
Chemistry Division, School of Science and Technology, University of Camerino, Via Madonna delle Carceri-ChIP, 62032 Camerino, MC, Italy
2
GAME Lab, Department of Applied Science and Technology (DISAT), Politecnico di Torino, Corso Duca degli Abruzzi 24, 10129 Torino, TO, Italy
3
National Reference Center for Electochemical Energy Storage (GISEL)—INSTM, Via Giusti 9, 50121 Firenze, FI, Italy
4
HP Composites S.p.A., Via del Lampo, sn, Zona Ind.le Campolungo, 63100 Ascoli Piceno, AP, Italy
*
Author to whom correspondence should be addressed.
Batteries 2024, 10(1), 11; https://doi.org/10.3390/batteries10010011
Submission received: 29 November 2023 / Revised: 21 December 2023 / Accepted: 27 December 2023 / Published: 29 December 2023

Abstract

:
Li-ion batteries (LIBs) represent the most sophisticated electrochemical energy storage technology. Nevertheless, they still suffer from safety issues and practical drawbacks related to the use of toxic and flammable liquid electrolytes. Thus, polymer-based solid electrolytes may be a suitable option to fulfill the safety and energy density requirements, even though the lack of high ionic conductivity at 25 °C (10−8–10−7 S cm−1) hinders their performance. To overcome these drawbacks, herein, we present an all-solid-state Li-metal full cell based on a three-component solid poly(ethylene oxide)/lithium bis(trifluoromethanesulfonyl) imide/titanium dioxide composite electrolyte that outclasses the conventional poly(ethylene oxide)-based solid electrolytes. Moreover, the cell features are enhanced by the combination of the solid electrolyte with a self-standing LiFePO4 catholyte fabricated through an innovative, simple and easily scalable approach. The structural, morphological and compositional properties of this system are characterized, and the results show that the electrochemical performance of the solid composite electrolyte can be considerably improved by tuning the concentration and morphology of TiO2. Additionally, tests performed with the self-standing LiFePO4 catholyte underline a good cyclability of the system, thus confirming the beneficial effects provided by the novel manufacturing path used for the preparation of self-standing electrodes.

Graphical Abstract

1. Introduction

One of the most important challenges worldwide has been identified as the development of a new green technology to replace non-renewable energy sources and drastically reduce the consumption of finite fossil fuels [1]. For this purpose, Li-ion batteries (LIBs) are a key player in the integration of renewable energy sources and the decarbonization process. The importance of LIBs relies on their outstanding features such as high energy density, good cycling stability, long cycle life and low self-discharge [2,3,4].
However, one of the main drawbacks affecting Li-ion batteries concerns the use of liquid electrolytes based on highly flammable organic solvents that has raised serious safety concerns. Moreover, liquid electrolytes represent a limit for this type of technology due to their poor thermal stability, low electrochemical voltage window, tendency toward Li dendrite growth, insufficient structural strength and electrolyte leakage risk [5,6,7].
Thus, to meet the requirements of a safe and energy-dense device, solid polymer electrolytes (SPEs) have been demonstrated to be a cheap, easily scalable and safe alternative [8,9,10,11,12,13]; in particular, poly(ethylene oxide) (PEO) has attracted considerable attention thanks to its low cost, high safety, thermal stability, high flexibility and good mechanical properties [5,14]. Nevertheless, SPEs present some crucial issues mainly associated with their poor ionic conductivity at 25 °C which is currently limiting their practical applications [15,16,17,18,19].
Up to date, some promising approaches that address the insufficient ionic conductivity have already been reported, but they often hinder other properties of the membrane [18]. For example, the introduction of small molecules or low amounts of organic solvent as plasticizers could increase the ionic conductivity but it could also compromise the robustness of the membrane [20,21].
Among all, the addition of nanosized inorganic fillers or salts has proven to be an encouraging solution, especially because they can improve the ionic conductivity of the electrolyte and, at the same time, enhance the mechanical properties of the membrane bringing several beneficial effects [22,23]. In particular, metal oxides such as SiO2 [24,25,26,27], Al2O3 [26,27,28,29], MgO2 [30,31] and others have been reported in the literature as efficient passive fillers; among all, TiO2-based fillers have been rather successful owing to their non-toxicity, low cost and excellent mechanic and thermal properties. Herein, the role of the shape, which is related to the surface area, and the role of the filler’s concentration on the electrochemical properties of the membranes were investigated. The membrane was fully characterized by means of scanning electron microscopy, X-ray diffraction, Fourier-transform infrared spectroscopy, Raman spectroscopy, differential scanning calorimetry, thermogravimetric analysis, electrochemical impedance spectroscopy, linear sweep and cyclic voltammetry, galvanostatic cycling with potential limitation and chronoamperometry. Moreover, the most promising electrolyte, among those here obtained, was selected for testing with an energy-dense self-standing LiFePO4 catholyte prepared using an innovative solvent casting technique.

2. Materials and Methods

2.1. Reagents

Lithium bis(trifluoromethansulfonyl) imide (LiTFSI), acetonitrile, conductive carbon (Super P45), hydrochloric acid (37% volume), sodium hydroxide, Poly(ethylene oxide) (PEO, average Mv ~ 4,000,000 nominal) and lithium iron phosphate (LiFePO4) were purchased from Sigma-Aldrich (Saint Louis, MO, USA). Titanium dioxide nanoparticles (Titandioxid P25) were supplied by Degussa-Huls AG (Frankfurt, Germany). All these compounds were used without being further purified.

2.2. Synthesis of Titanium Dioxide Nanotubes

TiO2 nanotubes were synthesized using a hydrothermal procedure as previously reported in the literature [32,33]. In a polytetrafluoroethylene vessel, 70 mL of a 10 M NaOH solution was combined with 1.4 g of P25 nanoparticle powder, and the suspension was kept under vigorous stirring for one hour. Then, the vessel was closed and heated at 120 °C for 36 h. The so-obtained white solution was removed from the vessel with the help of distilled water, and it was filtered and washed with HCl 0.1 M until the washing water reached neutral pH in order to slowly neutralize and ion-exchange the material. When pH 7 was reached, the nanotubes were washed again 3 times with ethanol and then dried overnight under vacuum at 70 °C. In the end, anatase phase nanotubes were obtained through thermal treatment in a furnace at 500 °C for 30 min.

2.3. Preparation of Self-Standing LFP Catholyte

In order to obtain a fairly conductive self-standing cathode, 100 mg of conductive carbon was added to 335 mg of LFP, the two powders were finely homogenized for several minutes through the use of a mortar and then placed in a ball mill for 30 min together with 2 mL of ethanol (using a 50 mL steel jar and 10 steel balls of 10 mm diameter each, with a ball/powder ratio of 30:1). The powder was then collected and dried. A viscous solution made of high-molecular-weight PEO and LiTFSI (weight ratio 21:1) in 15 mL of acetonitrile was stirred for 3 h. It should be noted that the molecular weight of the polymer generally does play a role in the electrolyte properties; for this reason, the molecular weight was deliberately chosen to provide enhanced mechanical strength and ionic conductivity to the whole system. After that, the LFP/C mixture was slowly added to the polymer slurry, and the solution was further stirred for 5 more hours before being cast onto a Teflon disk. The resulting slurry composition was calculated as 56:22:17:5 (active material:PEO:conductive carbon:LiTFSI).
The cast slurry was dried overnight. Finally, a black thick film was carefully dethatched from the Teflon. The so-obtained self-standing catholyte (SS-LFP) was hot-pressed, cut into 9 mm disk electrodes (0.636 cm2 electrode surface) and dried in a Buchi oven at 50 °C overnight before being transferred into an argon-filled glovebox in order to evaporate all the residual solvent. All the tested electrodes have an active material mass loading of approximately 9 mg cm−2.

2.4. Preparation of PEO/LiTFSI/TiO2 Electrolytes

TiO2 solid polymer electrolytes were obtained using a conventional solution casting technique. Dry lithium bis(trifluoromethansulfonyl)imide salt (0.379 mmol) was first dissolved in acetonitrile, and a chosen amount of filler (3%, 10% or 15%) was added. The mixture was stirred for 30 min in order to ensure a homogeneous dispersion of titanium dioxide, then 350 mg of PEO was dissolved in acetonitrile, and the first solution was slowly poured into the second one. The mixture was kept under magnetic stirring for 24 h at room temperature until a viscous white slurry was obtained. The slurry was cast onto a Teflon disk, and, in order to remove all of the solvent, it was left overnight at 60 °C in the oven. The resulting self-standing membrane was peeled off, cut and transferred into a Buchi oven at 50 °C for 15 h before being transferred into an argon-filled glovebox.
Six membranes were synthesized, three using different concentrations of nanoparticles (3%, 10% and 15%) and three with different concentrations of nanotubes (3%, 10% and 15%), and they were called, respectively, NP3, NP10, NP15, NT3, NT10 and NT15.

2.5. Characterization and Measurements

In order to confirm the morphology of the fillers and to ensure the purity of LFP, the X-ray diffraction (XRD) technique was used in a Philips diffractometer, with Bragg–Brentano geometry with a Cu-Kα X-ray source (λ = 1.54059 Å).
The morphology of the fillers and the electrolytes was investigated by means of scanning electron microscopy (Zeiss Sigma 300 FM-SEM, Munich, Germany). In addition, to prove the uniform distribution of LiTFSI salt and TiO2 into the membrane, a mapping measurement was performed. The same procedure was applied for SS-LFP.
Fourier-transform infrared spectroscopy (PerkinElmer Frontier-FTIR, Waltham, MA, USA) was employed to examine the functional groups present in the electrolytes and their interactions within the chemical environment. Complementary, further investigations by means of Raman spectroscopy (Horiba HR 320, Kyoto, Kyoto) were carried out in order to detect the stretching of titanium dioxide which is FTIR-inactive.
Thermal gravimetric analysis (TGA) was performed in the 30–500 °C temperature range under nitrogen flow and with a heating rate of 10 °C/min (PerkinElmer STA6000 TGA-DTA).
Differential scanning calorimetry (TA 250-DSC, New Castle, DE, USA) was used in order to better understand the effect that different amounts of filler could cause on the glass transition temperature of the electrolyte.
All the electrochemical tests were carried out using 9 mm electrodes in CR2032 coin-type cells assembled in an Ar-filled glovebox (Jacomex (Dagneux, France) GP Campus with O2 and H2O level < 0.8 ppm). Potentio electrochemical impedance spectroscopy (PEIS) and galvanostatic cycling with potential limitation (GCPL) at 65 °C were used in order to determine which membrane could be the most promising.
The ionic conductivity was determined by impedance spectroscopy in potentiostatic mode within the 101 kHz–5 mHz frequency range, using a custom Teflon o-ring (16 mm external diameter, 4 mm internal diameter) and stainless steel (SS) blocking electrode. The impendence spectra were recorded every 5 °C between 25 and 75 °C in coin cells assembled in an SS/electrolyte/SS configuration. The conductivity ( σ ) was obtained from the following expression: σ = L R A where L is the thickness of the membrane, R is the bulk resistance obtained from the impedance measurements, and A is contact surface area.
Symmetrical Li/electrolyte/Li cells were assembled and tested at 45 °C, 55 °C and 65 °C in order to calculate the Li+ transference number ( τ + ) at different temperatures, so the Bruce–Vincent–Evans method could be applied: [34]
τ + = i s s i 0 × ( V R 0 i 0 ) ( V R s s i s s )
where i 0 and i s s are the initial and steady-state currents, R 0 and R s s are the initial and steady-state resistances of the passivating layer, and V is the potential applied across the cell. Chronoamperometric measurements were performed by applying a voltage of 30 mV for 90 min, while potentiostatic impedance spectra at the initial and steady-state cell polarization were recorded.
The electrochemical stability window of the best electrolyte was assessed through cyclic voltammetry (CV) at low potential and linear sweep voltammetry (LSV) at high potential. All the experiments were performed at 65 °C in a Li/membrane/WE configuration, where the working electrode (WE) was made by conductive carbon cast on copper or aluminum foil.
Eventually, the best electrolyte was tested in a full Li-metal cell with a novel self-standing lithium iron phosphate catholyte in an all-solid-state configuration made by LFP/NT10/Li. Rate capability was evaluated in the 2.5–4.3 voltage range applying different currents, then, in order to enlarge the working stability window, a cyclovoltammetry from 2.5 V to 4.5 V was performed, and, since no degradation peaks of the membrane were detected, the galvanostatic cycling was carried out in the 2.5–4.5 voltage range at C/5 and 65 °C in order to optimize the capacity.

3. Results and Discussion

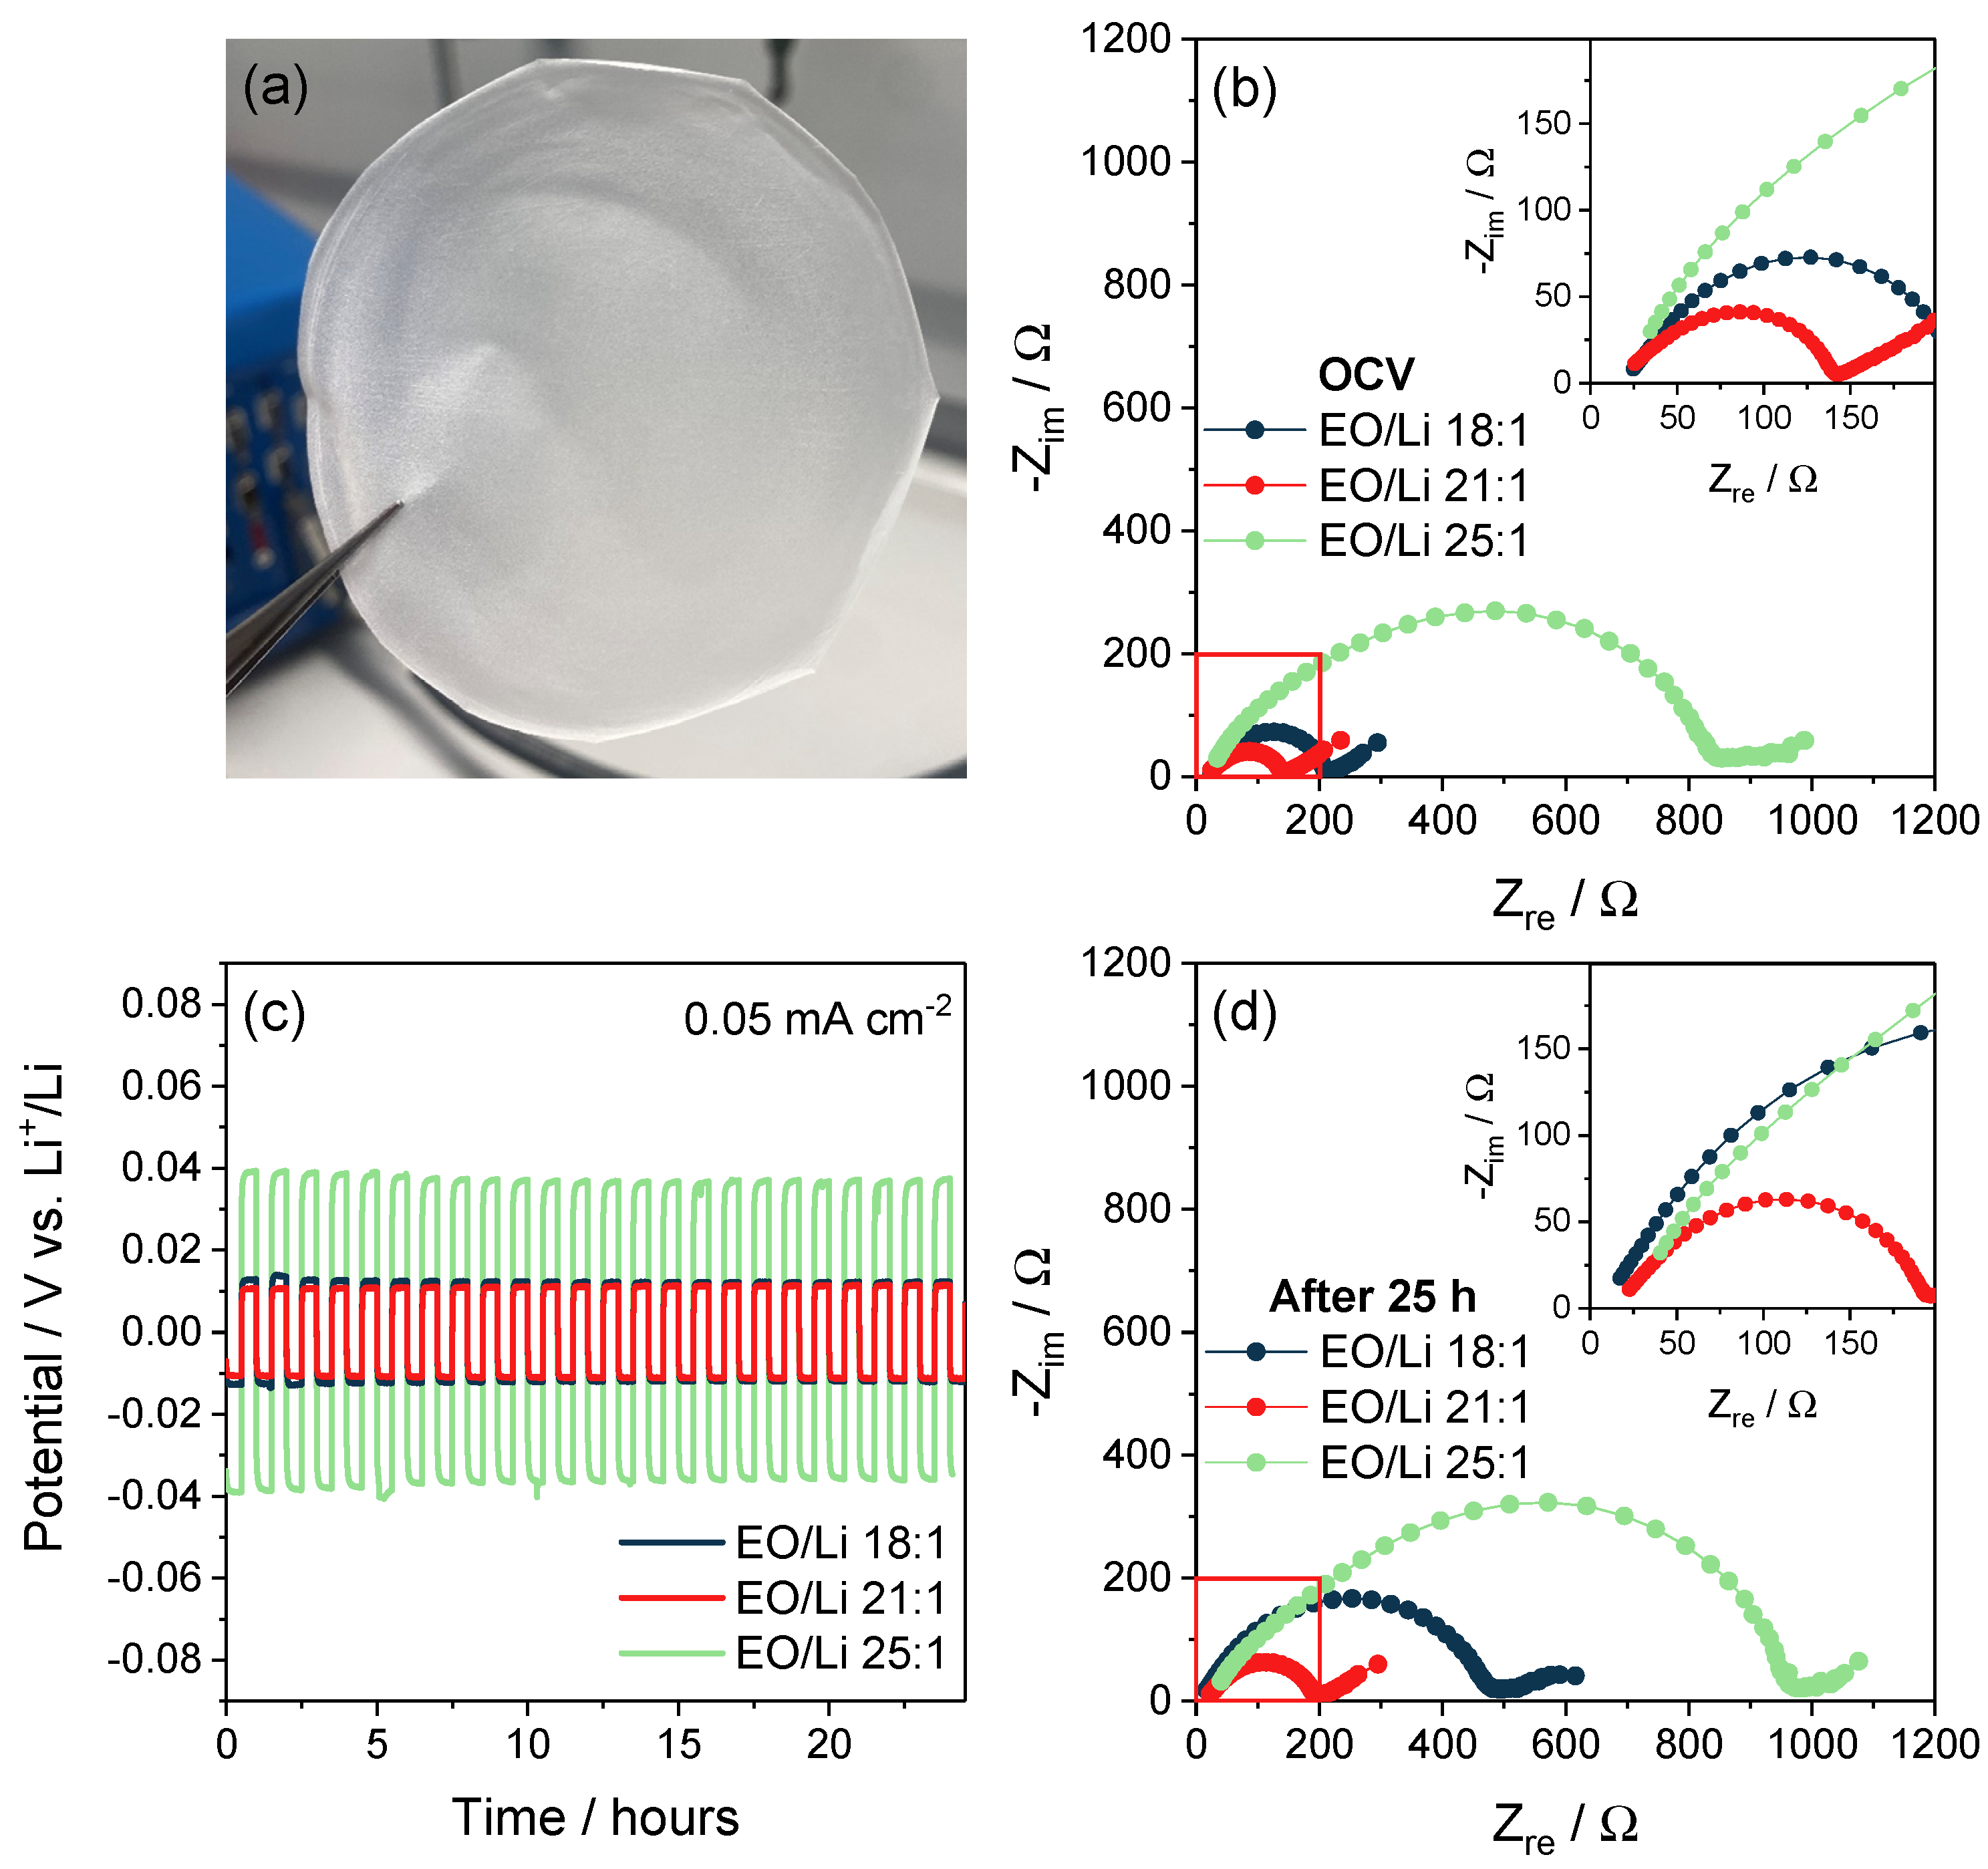
3.1. Polymer Electrolytes with LiTFSI

In terms of morphology, the membranes, synthesized as reported in the experimental section, displayed a macroscopically homogeneous texture after hot pressing, indicating a good dispersion of the salt within the polymer matrix (Figure 1a). In order to unravel the influence of different LiTFSI salt concentrations on the electrochemical performance of the polymer electrolyte and on the eventual lithium dendrite growth, impedance measurements for cells with EO/Li ratios of 18:1, 21:1 and 25:1 were collected before and after galvanostatic Li plating/stripping cycles at 65 °C in a Li/PEO-LiTFSI/Li configuration. The obtained Nyquist plots (Figure 1b,d) were modeled using the equivalent circuit method [35] through a non-linear least squares (NLLS) fitting protocol by using the RelaxIS 3 software (rhd instruments, Darmstadt, Germany). The equivalent circuit Re(RiCi)Qw, written according to Boukamp’s notation [36,37], was used to take into account the different features of the spectra: Li+ ion migration through the solid electrolyte (high-frequency intercept with real axis, Re); contact resistance and Li metal interface resistance, coupled to the related double-layer capacitances (two medium-low frequency semicircles, RiCi = R1C1 + R2C2, with the latter being the dominant contribution); and Warburg-type bulk solid-state diffusion (low-frequency line, Qw). For the fitting procedures, the pure capacitive elements (C1 and C2) were substituted by constant phase elements (Q1 and Q2) to account for the non-ideal behavior given by surface roughness and inhomogeneities [35]. The calculated parameters of the NLLS analysis are listed in Table S1.
From the Nyquist plots obtained in Figure 1b, all the symmetrical cells display comparable Re values at OCV; however, significant differences can be observed from the Ri contribution, with values of 190 Ω, 125 Ω and 776 Ω obtained from 18:1, 21:1 and 25:1 (EO/Li) ratios, respectively. The much higher Ri value for the 25:1 polymer-to-salt ratio indicates higher Li interface resistance as compared to the other tested membranes, leading to four- and six-fold higher overall resistance as compared to those displayed by the 18:1 and 21:1 ratios, respectively. The negative effect of the higher polarization is indeed confirmed by the plating/stripping test conducted at 0.05 mA cm−2 (Figure 1c), where an overpotential of 0.04 V is reached. This value is much higher than those obtained for the 21:1 and 18:1 ratios, which in turn display an overpotential of about 0.010 V and 0.013 V, respectively, when cycled in the same conditions. Finally, EIS measurements were performed to check variations in the polarizations after 25 h plating/stripping cycles; the related Nyquist plots are reported in Figure 1d. The Re value decreases for the membrane with the 18:1 ratio (from 18.7 Ω to 3.6 Ω), while it remains almost constant for the 21:10 ratio (from 11.0 Ω to 13.3 Ω) and increases for the 25:1 ratio (from 10.0 Ω to 24.3 Ω). In contrast, all the Ri values increase due to the SEI evolution at the Li–electrolyte interface upon cycling, with that of the 21:1 membrane being less affected (from 125 Ω to 178 Ω) as compared to those of the 18:1 (from 190 Ω to 448 Ω) and 25:1 (from 776 Ω to 929 Ω) membranes.
The trends of Re and Ri can be rationalized by considering the effect of the salt concentration within the polymer matrix. When a high salt concentration is employed (i.e., EO/Li 18:1), the Li+ ion migration through the electrolyte is favored, thus resulting in a decrease in the Re value upon cycling; however, a higher decomposition of the electrolyte to form the SEI layer also seems to be promoted, leading to a high increase in the Ri value, which may be assigned due to the formation of a thicker Li–electrolyte interphase, causing a more sluggish charge transfer. By contrast, when a low concentration is employed (i.e., EO/Li 25:1), the Li+ ion migration through the electrolyte is more hindered, thus resulting in a decrease in the Re value upon cycling; due to the lack of sufficient Li+ ions from the electrolyte in the formation of the SEI layer, the Li–electrolyte interphase is poorly ionically conductive, also leading to a great increase in the Ri value. When using an intermediate salt concentration (i.e., EO/Li 21:1), the Re value remains essentially constant upon cycling, while the Ri value only slightly increases; this indicates a good ionic transport within the electrolyte and an optimal Li–electrolyte interphase formation, which positively affect the cycling performance and charge transfer kinetics by yielding the lowest and most stable overpotential among the tested membranes. A schematic illustration of the equivalent circuit used to fit the impedance spectra of Figure 1b,d is shown in Figure S1.

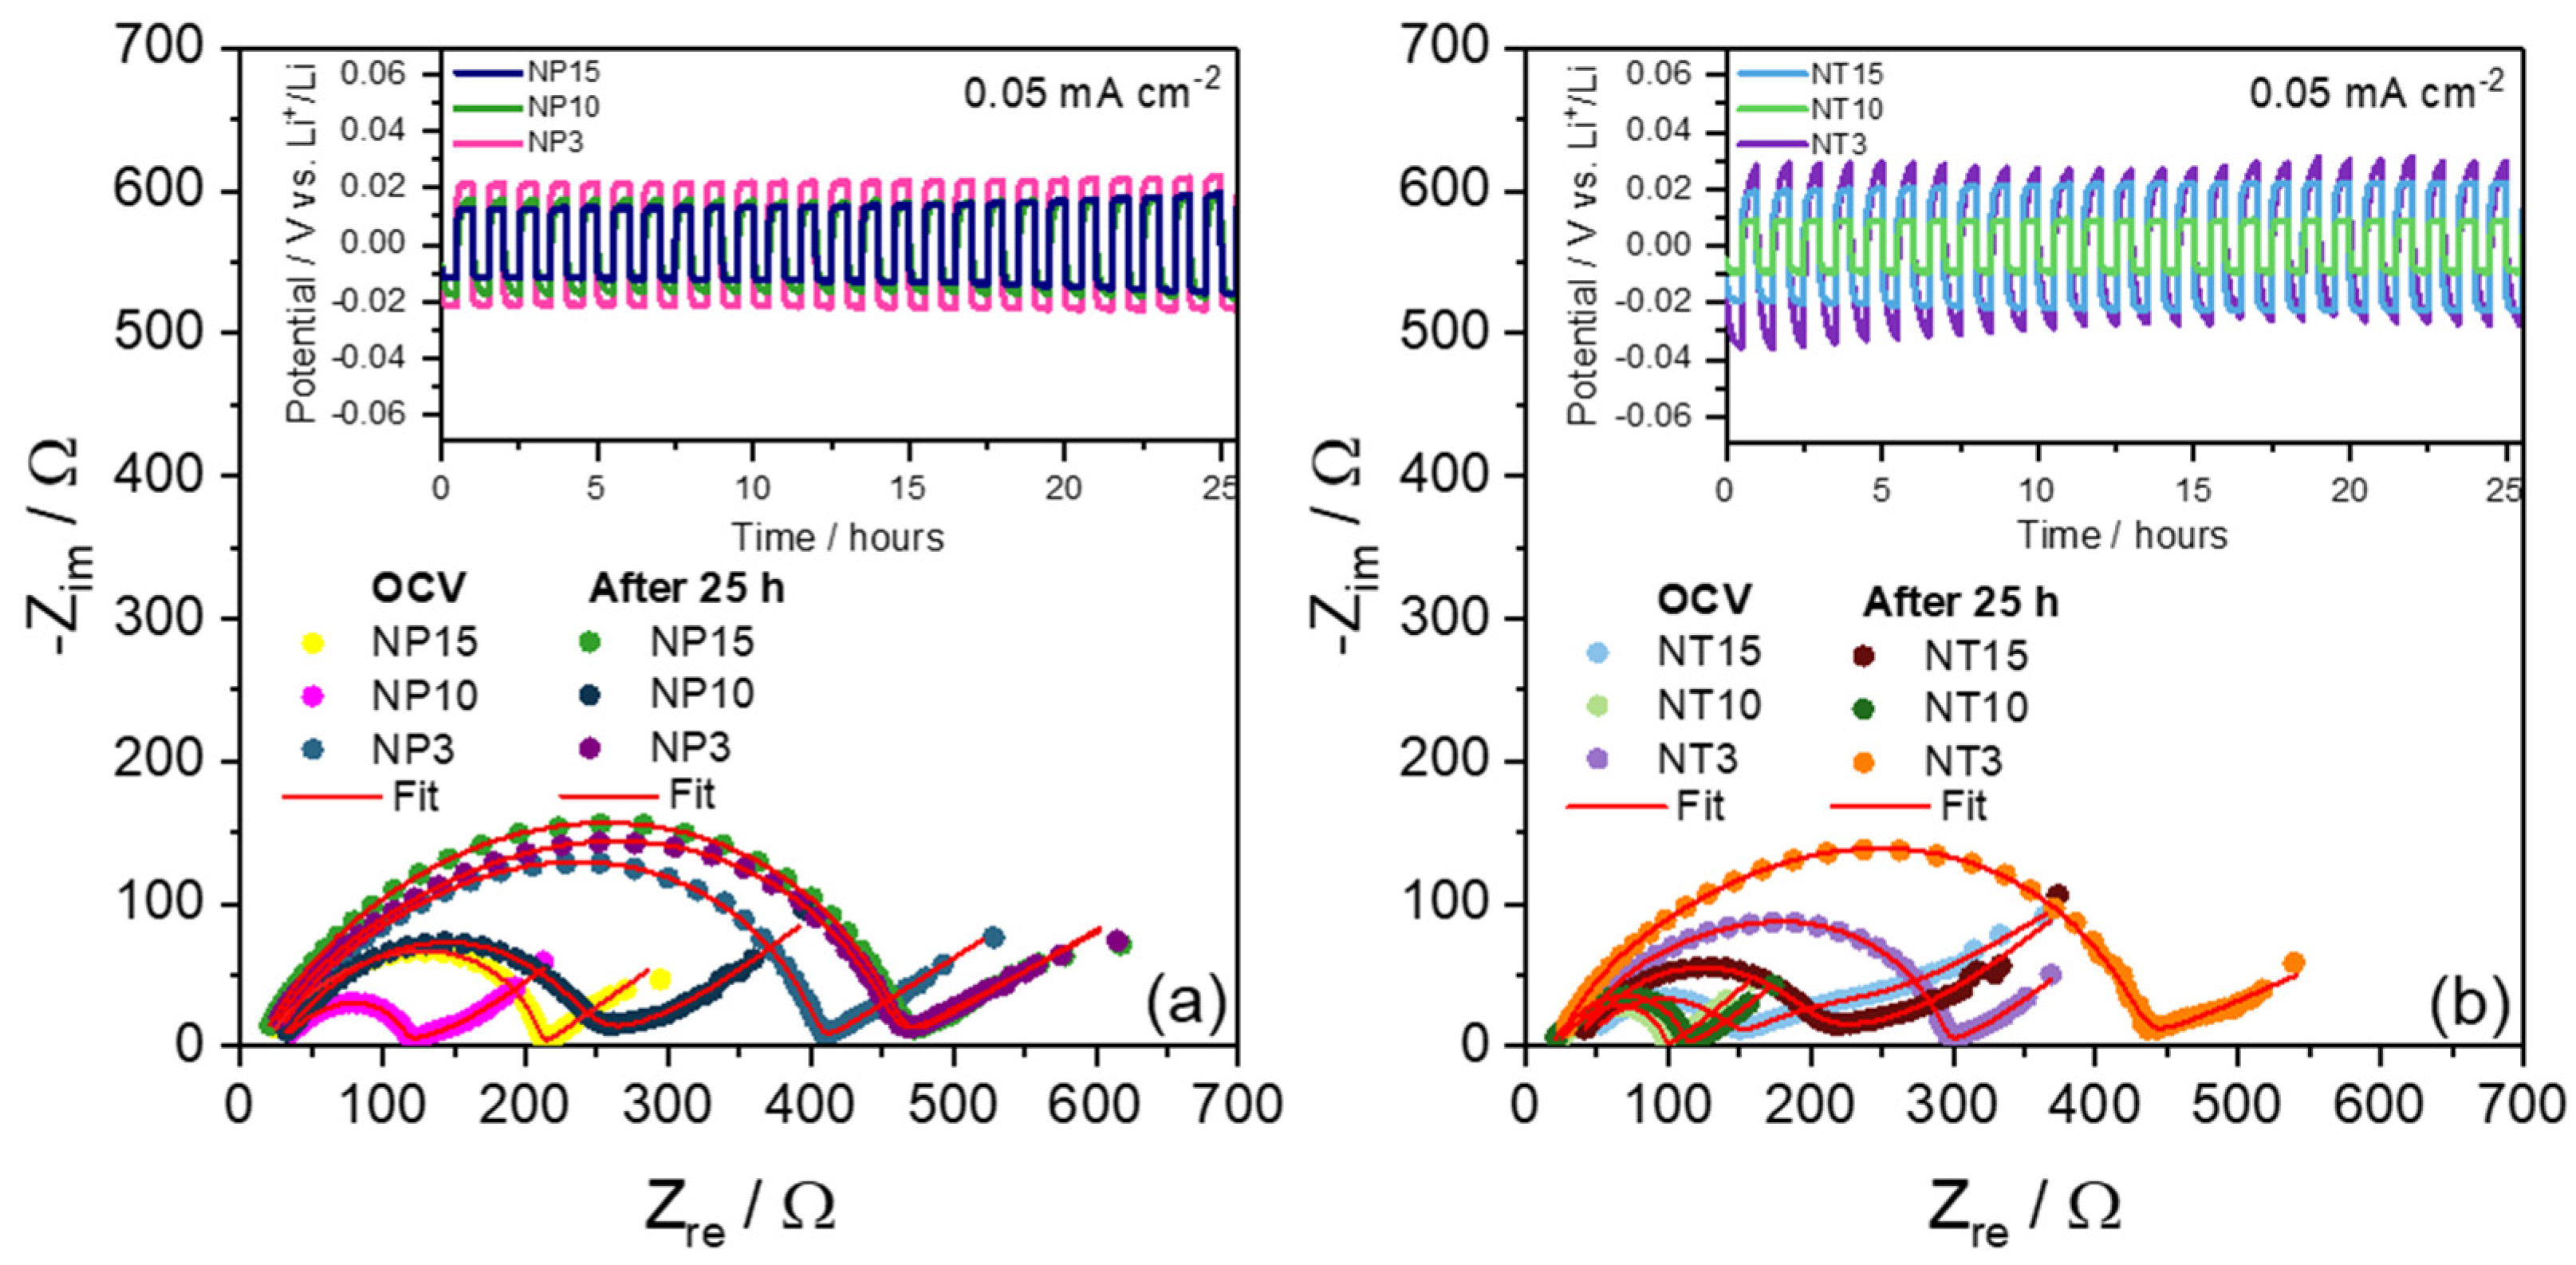
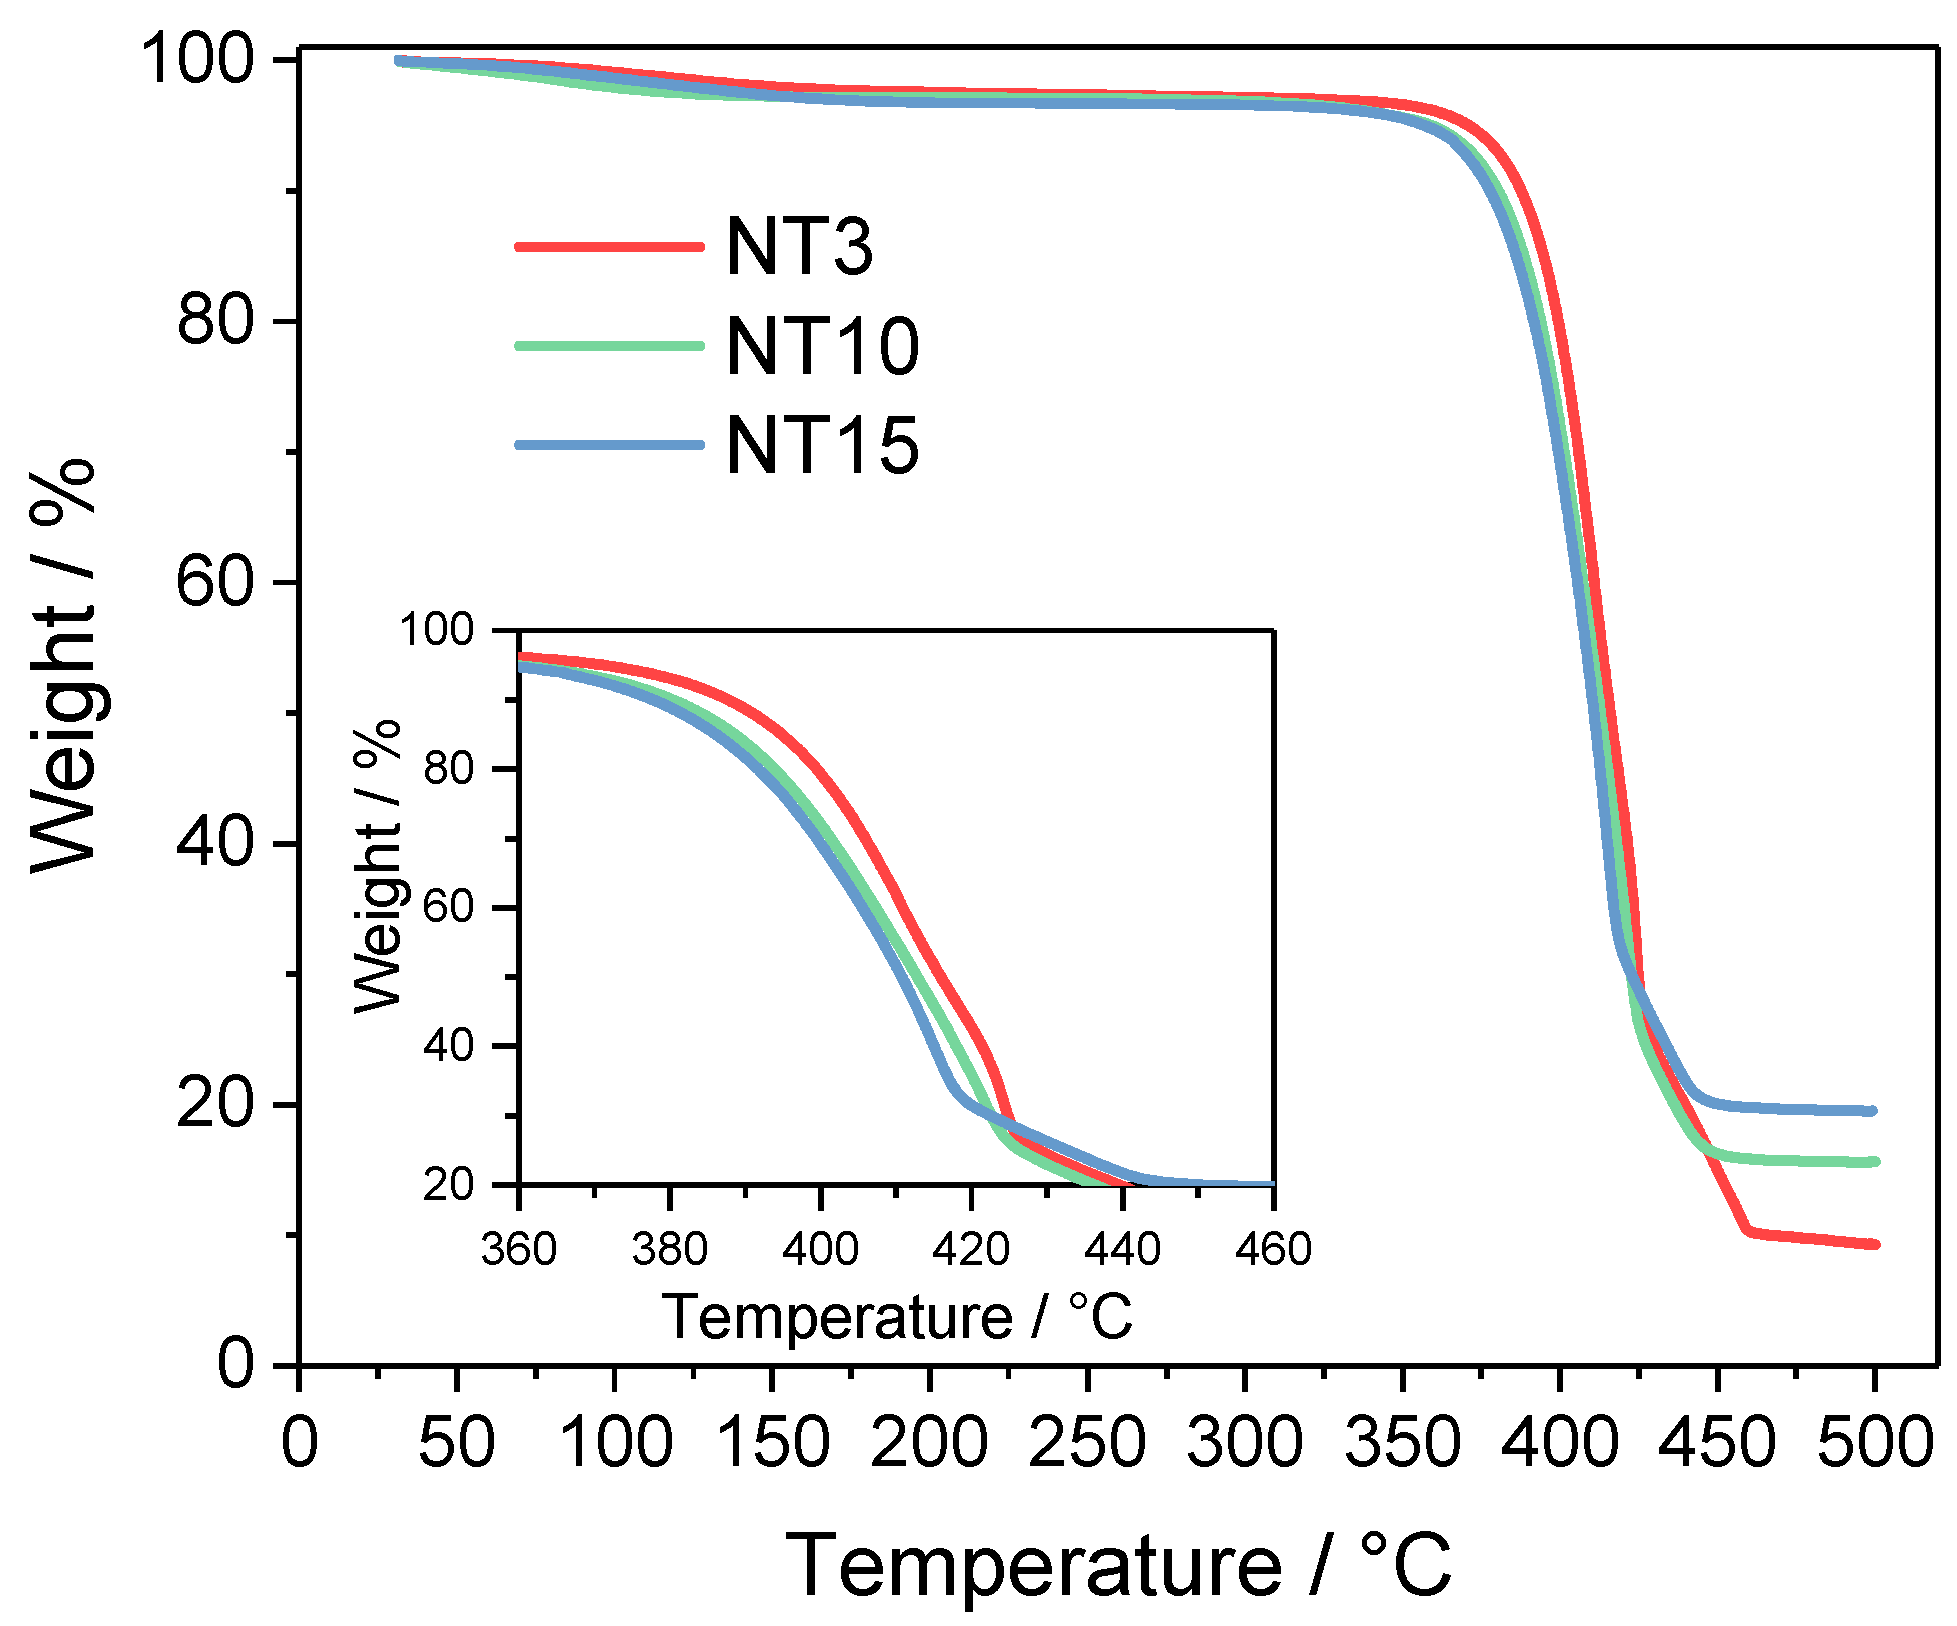
3.2. Polymer Electrolytes with Optimized LiTFSI Concentration and Fillers

Given the better performance and the more stable polarizations displayed upon cycling, the membrane with a 21:1 polymer-to-salt ratio was chosen to study the effect of synthesized TiO2 nanotubes (NT) as the inorganic filler in the polymer matrix. Different filler concentrations were introduced within the membrane (i.e., 15%, 10% and 3%) and compared to membranes loaded with commercial TiO2 nanoparticles (NP) at the same concentrations used as a reference filler. For the sake of clarity, the membranes were hereby labeled as “NPX” or “NTX”, where X indicates the filler percentage within the electrolyte, and NP or NT indicates the TiO2 morphology (nanoparticles or nanotubes, respectively).
In order to confirm the actual formation of titanium dioxide nanotubes, diffractograms of the starting material (i.e., commercial P25 nanoparticles) and the synthesized one, acquired in the 15° to 65° 2 θ range, are shown in Figure 2a, as well as their related peak indexing. In particular, the diffraction pattern of NP is characterized by the presence of both the anatase and rutile phases of tTiO2, in agreement with the literature data. Instead, after the basic treatment and the annealing at 500 °C, only the anatase phase was detected [38]. In particular, the absence of the rutile phase in nanotubes is attributable to the temperature at which the heat treatment was performed, since the rutile phase is formed above 600 °C. The sole presence of the anatase phase would be beneficial for the filler’s morphology, as it was previously reported that reaching the higher temperature necessary for the thermal transition to the rutile phase could cause the deformation of the nanotube’s shape [39]. Hence, the comparison between the pristine and the post-synthetic diffraction patterns reveals substantial differences between the two materials, suggesting the success of the synthetic strategy [40]. Indeed, no additional peaks related to possible impurities were detected, confirming the purity of the phases.
The morphology of the as-prepared filler was verified by means of SEM analysis displayed in Figure 2b, and a comparison between NTs and NPs is displayed in Figure S2a,b. This result confirms that, after the synthetic procedure, the pristine spherical nanoparticles (about 20–30 nm diameter) achieved an elongated morphology of which the average calculated width turned out to be 31 nm, as shown by particle size distribution, calculated from the SEM image through the ImageJ software (ImageJ 1.53 e, USA), in Figure 2c.
To understand the influence of different filler concentrations on the electrochemical performance of the polymer electrolyte, impedance measurements for cells with 15%, 10% and 3% TiO2 NT in the membrane were collected before and after 25 h of galvanostatic Li plating/stripping cycles at 65 °C in symmetric cell configuration. The results were then compared to the cells where commercial TiO2 NP at the same concentrations of NTs were added. The obtained Nyquist plots (Figure 3a,b) were modeled following the procedure previously described for Figure 1b,d, and the calculated parameters of the NLLS analysis are listed in Table S2.
From the Nyquist plots obtained in Figure 3a, all the cells with NP fillers show comparable Re values at OCV, with NP15 possessing the lowest electrolyte resistance; as for the Ri contribution, significant differences can be observed as a function of filler concentration, with values of 193 Ω, 78 Ω and 380 Ω for NP15, NP10 and NP3, respectively. This is reflected in the plating/stripping test at 0.05 mA cm−2 displayed in the figure inset, where the highest overpotential (0.02 V) is observed for NP3 as a result of the more resistive Li interface resistance as compared to NP15 and NP10, the latter being less polarized (about 0.01 V, slightly increasing upon cycling). EIS measurements after 25 h cycling reveal a decrease in the Re value for all membranes, indicating a positive effect of the filler in promoting higher Li+ ion migration through the electrolyte. All the Ri values increase due to the evolution of the SEI at the Li–electrolyte interface upon cycling, with that of NP10 being less affected (from 78 Ω to 209 Ω) as compared to those of NP15 (from 193 Ω to 445 Ω) and NP3 (from 380 Ω to 437 Ω). When the commercial NP is substituted by the synthesized NT (Figure 3b), only NT10 displays Re values at OCV comparable with those from Figure 3a (i.e., 21.1 Ω), while greater values are observed in the case of NT15 (41.8 Ω) and NT3 (34.5 Ω); when considering the Ri contribution, all the values for the NT-containing membranes are lower than those for the NP-containing ones, with NT10 displaying the lowest interface resistance (i.e., 73 Ω). Indeed, from the plating/stripping tests, the latter cell displays a stable overpotential lower than 0.01 V when cycled at 0.05 mA cm−2 for 25 h, as a result of the less resistive electrolyte and interphase resistances. Notably, the overpotential polarization of NT15 and NT10 is about equal and lower than NP15 and NP10, respectively, and only NT3 shows higher polarization as compared to NP3. This aspect points out that, at lower filler concentrations, the simple NP morphology provides better conduction paths as compared to the NT one; however, upon increasing filler concentrations, the NT morphology has a more pronounced effect as compared to simple NP, with NT10 displaying the lowest and most stable overpotential upon cycling. Moreover, to further confirm the superior stability of NT10, a prolonged stripping/plating was provided in Figure S3.
After cycling, a decrease in the Re is observed for all membranes, with NT10 still possessing the lowest value (16.4 Ω), as a result of the promoted ion migration. The Ri increases after the formation of the Li–electrolyte interphase but reveals overall lower values for the NT morphology as compared to the commercial NP (i.e., 91 Ω for NT10, 155 Ω for NT15 and 400 Ω for NT3). In general, it is possible to observe that the membranes loaded with 10% TiO2 NTs have similar Re values as compared to those loaded with commercial NPs, both before and after cycling. In addition, when considering the Ri values, NT10 exhibits the lowest increase in the Li–electrolyte interphase polarization among all the membranes tested, with the lowest value after cycling. When it comes to performance, all the overpotential polarizations are fairly low as compared to other studies reported in the literature [41,42] (i.e., the maximum overpotential here observed is about 0.03 V at 0.05 mA cm−2), with NT10, NP10 and NP15 displaying similar initial values; nevertheless, only NT10 is able to maintain a constant value of about 0.01 V during the entire test. Overall, NT10 seems to promote more suitable ion diffusion pathways, favoring the ion migration within the polymer membrane, also positively affecting the stability of the Li–electrolyte interphase and promoting more stable and lower polarization over time upon cycling.
As NT10 outperforms all the other tested membranes, a more extensive thermal and morphological characterization was performed on this system. In addition, all the different NT filler concentrations were evaluated.
Since reaching adequate thermal stability is a fundamental goal for solid polymer electrolytes, TGA measurements were carried out in order to further determine the effect of increasing quantities of titanium oxide fillers on the decomposition temperature of the membranes. The analyses were performed under an inert nitrogen atmosphere in the temperature range between 30 °C and 500 °C, and the comparison between the TGA curves of the composite membranes containing different percentages of nanotubes is reported in Figure 4. For all the samples, an initial weight loss from 3 to 10% is detected, which could be attributed to the loss of water that has been absorbed during the process of sample loading due to the highly hygroscopic nature of LiTFSI and PEO. Notably, all the membranes demonstrated a high thermal stability up to 400 °C. Nevertheless, slight differences in the thermal behavior of the samples can be evidenced: when approaching the decomposition temperature (see inset of Figure 4), the thermal stability of the samples decreases upon increasing filler concentration, indicating that a lower crystallinity of the PEO framework is favored by the presence of TiO2 NT. At 500 °C, all samples are fully decomposed, with the weight % reaching a plateau as only TiO2 and carbon remain in the sample holder.
Further studies on thermal properties were carried out by means of differential scanning calorimetry (DSC). Figure S4 shows the DSC thermograms of PEO polymer, pristine membrane and the electrolytes containing 3, 10 and 15% of TiO2 nanotubes. Moreover, the so-obtained glass transition temperatures (Tg) are reported in Table 1.
As previously reported, the presence of lithium salt plays an important role in the crystallinity of the pure polymer; indeed, the addition of LiTFSI (EO/Li 21:1) causes a rise in the glass transition temperature, which is probably due to an eventual coordination between salt and polymer’s chains that are less able to move [43]. Thus, comparing the values obtained for the composite electrolytes with the pristine membrane (EO/Li 21:1), we can notice how the addition of only 3% of TiO2 negatively affected the Tg. This could be related to the fact that the filler concentration is not high enough to bring a beneficial effect; instead, it could interact with the polymer anchoring the chains and hindering the passage of lithium ions. Thus, this interaction could lead to local crystallization and stiffness that preclude the free motion of the polymeric matrix. Furthermore, by increasing the percentage of the filler, a trend could be underlined: the increasing additions of titanium oxide cause a decrease in the glass transition temperature, which could be explained by a decrease in the crystallinity of the polymeric matrix promoted by the well-known plasticizer effect characteristic of TiO2 [44,45].
The morphological features of the as-obtained composite electrolytes were also analyzed, and, in particular, SEM micrographs of both the pristine (Figure S5) and NT10 membrane (Figure 5) are reported. The images from Figure 5a and Figure S5a reveal a general uniformity of the surface, without evident cracking or discontinuity, indicating that the addition of the filler does not affect the homogeneity of the membrane surface. Then, the distribution of the lithium salt and the fillers within the membrane is verified by EDS mapping analysis which did not identify a significant agglomeration. It is worth noticing how titanium, oxygen, fluorine and sulfur are well dispersed across the surface either for the pristine membrane (Figure S5b–g) or the NT10 membrane (Figure 5b–e). Furthermore, Figure S6 shows how the distribution of titanium within the membrane is affected by the increasing percentage of fillers from 3% (Figure S6a) to 10% (Figure S6b) and 15% (Figure S6c). Notably, an increase in the concentration of purple spots related to titanium is detected which, however, remain fairly evenly distributed without the formation of agglomerates.
To further investigate the proprieties of NT10, a flammability test was performed, and the results are reported in Figure 6. Nowadays, safety is one of the most critical aspects related to the use of lithium-ion batteries, and thus, the use of liquid electrolytes that contain highly flammable solvents has caused several concerns, and it is now limiting their practical applications. Instead, one of the major features of solid electrolytes is their safety, non-toxicity and low flammability which makes them suitable for electric transport and much more. For these reasons, a comparison between the liquid electrolyte (Figure 6a,b) and NT10 membrane (Figure 6c,d) is reported, confirming the superior safety characteristics of the composite solid electrolyte. In the first case, we can see how, when a flame is brought close to a Whatman GF/D separator soaked in LP30, it releases an intense and persistent flame, and instead, the membrane begins to fold in on itself and melts without propagating the flame.
The NT10 membrane is studied, as shown in Figure 7, in terms of ionic conductivity, the Li+ transference number, the anodic electrochemical stability window and chemical stability in lithium cells. Figure 7a shows the Arrhenius plot obtained for the NT10 and the pristine membrane, where the ionic conductivity was obtained by the NLLS fit of the Nyquist plots (reported in Figure S7) recorded in the 25 to 75 °C temperature range. The data reveal that the addition of the nanotubes significantly enhances the ionic conductivity of the electrolyte with values of log σ that are about −5.5, −3.4 and −3.2 with respect to −6, −3.6 and −3.4 at 25, 65 and 75 °C for the NT10 and pristine membranes, respectively. This result could be due to the combination of several aspects; first of all, it is important to consider the high Lewis acid character of the titanium oxide that allows an acid–base reaction between the polar filler surface and the ionic group of the salt and the polymer, thereby lowering the crystallinity of PEO [46]. The formation of these bonds weakens the attraction between Li+ and the oxygen atoms of the polymeric matrix, thus facilitating lithium ion motion and, eventually, enhancing the ionic conductivity. Another relevant aspect is related to the higher dielectric constant of TiO2 (435) with respect to PEO ( 3) that actively assists lithium ion dissociation within the polymeric matrix, increasing the mobile carrier concentration and hence the conductivity [43,47]. It is worth mentioning that the Nyquist plots of Figure S7 are characterized by a low-frequency solid-state diffusion element assigned to the Li+ ions and a middle-frequency semicircle (only at temperatures below 55 °C) ascribed to the interphase. For higher temperatures, the Nyquists showed a blocking-type shape due to the melting of the polymer which resembles a liquid-like behavior [48]. Furthermore, also at lower temperatures, the Nyquist plots did not feature the high-frequency element most likely ascribed to the grain boundary or irregularities in the electrolyte. This absence may be associated with the amorphous phases of PEO, as well as the homogeneous distribution of the filler into the polymer matrix, without the formation of agglomerates [23,48].
Moreover, in the Arrhenius plot of Figure 7a, a slope change is clearly visible at around 3 × 10⁻³ K−1, dividing two different slopes between 55 and 60 °C, which corresponds to the temperature range where the melting of PEO takes place. This behavior was previously reported in the literature, and it is due to a switch from Arrhenius behavior to a Vogel–Tamman–Fulcher behavior after the melting point of the polymer electrolyte [49]. According to this trend, two different activation energies could be calculated from the slope values, one before 60 °C that turned out to be 43.3 KJ mol−1 for NT10 and 51.3 KJ mol−1 for the pristine membrane and a lower value after the melting point of 22.3 KJ mol−1 for NT10 and 23.2 KJ mol−1 for the pristine membrane. After the melting point of the polymer, the slopes of the two electrolytes seem to be very similar resulting in almost equal activation energy values, proving that at a high temperature, the presence of the filler has a minor impact on the mobility of the lithium ion, and instead, titanium oxide is more important at low temperatures.
The ion transport features of the NT10 membrane at different temperatures are further studied with the Li+ transference number according to the Bruce–Vincent–Evans equation at 45, 55 and 65 °C [34,50]. Figure 7b shows the chronoamperometric profiles for each temperature, while the inset reports the Nyquist plots obtained through impedance measurements before and after cell polarization. The τ + numbers of NT10 (Table 2), obtained from the Bruce–Vincent–Evans method and the data reported in Figure 7, range from 0.27 at 45 °C to 0.28 at 55 °C and 0.29 at 65 °C, with a marginal improvement, possibly due to more efficient anion solvation by the polymer chains as the temperature rises, facilitating the movement of the lithium ions [25,48,49]. Although the obtained values are lower than the ones of liquid electrolytes due to the intrinsically lower ion mobility in a solid medium (e.g., glyme-based solutions are generally equal to or higher than 0.5 [51,52]), the τ + values of NT10 are in line with those reported in the literature for other solid polymer electrolytes, such as PEO-based or PEGDME-based systems tested at similar temperatures [13,53]. Moreover, when considering the pristine membrane without any filler (Figure S8), the calculated τ + value at 65 °C does not exceed 0.28, further confirming the effect of the NT filler on the transport properties of the solid electrolyte.
The anodic electrochemical stability window of the NT10 membrane is determined by LSV on Li/NT10/WE cell. The results are reported in Figure 7c, where a relevant increase in the oxidation current due to the decomposition of the polymer membrane at about 4.6 V vs. Li+/Li is depicted. When considering the pristine membrane (Figure S9), the LSV measurement essentially displays a similar behavior as NT10, with decomposition starting after 4.6 V vs. Li+/Li. Notably, a quite extended anodic stability window of the electrolyte was detected, and this suggests that the NT10 membrane could be suitable for application with different cathode materials like lithium iron phosphate or mixed olivine cathodes [54]. Although the main objective of this work is not to test the efficacy of the polymer electrolyte with anode materials serving as the counter-electrode, the cathodic stability of NT10 was also investigated by means of CV within the potential range of 0.01–2 V vs. Li+/Li, with Super P carbon serving as the working electrode. The obtained results, shown in Figure S10, demonstrate excellent cathodic stability, evidencing the SEI formation at the first cycle and the reversible Li+ intercalation in the carbon host as the main processes occur, thus indicating the possible use of NT10 also with conventional anode materials such as graphite.
Figure 7d shows the Nyquist plots collected on a symmetrical Li/NT10/Li cell in order to determine the chemical stability of the Li/electrolyte interphase upon aging for about 20 days. The interphase resistances obtained by the fit of the impedance spectra (Table S3) are plotted as a function of time to evidence their trend, as shown in Figure 7e. The graph reports Ri values that increase from about 90 Ω to about 100 Ω during initial hours, slightly decrease to initial values in the first 10 days and moderately increase to 120 Ω after 20 days. This trend, coupled with the overall low resistance values, suggests the formation, partial dissolution and subsequent consolidation of a suitable SEI and indicates a relevant chemical stability of the NT10 and its potential application in Li-metal batteries [13,55].
Moreover, the IR and Raman spectra of the NT10 sample are reported in Figure S11, showing the typical signal of the PEO polymer, LiTFSI salt and anatase TiO2, as reported in the literature [56,57].

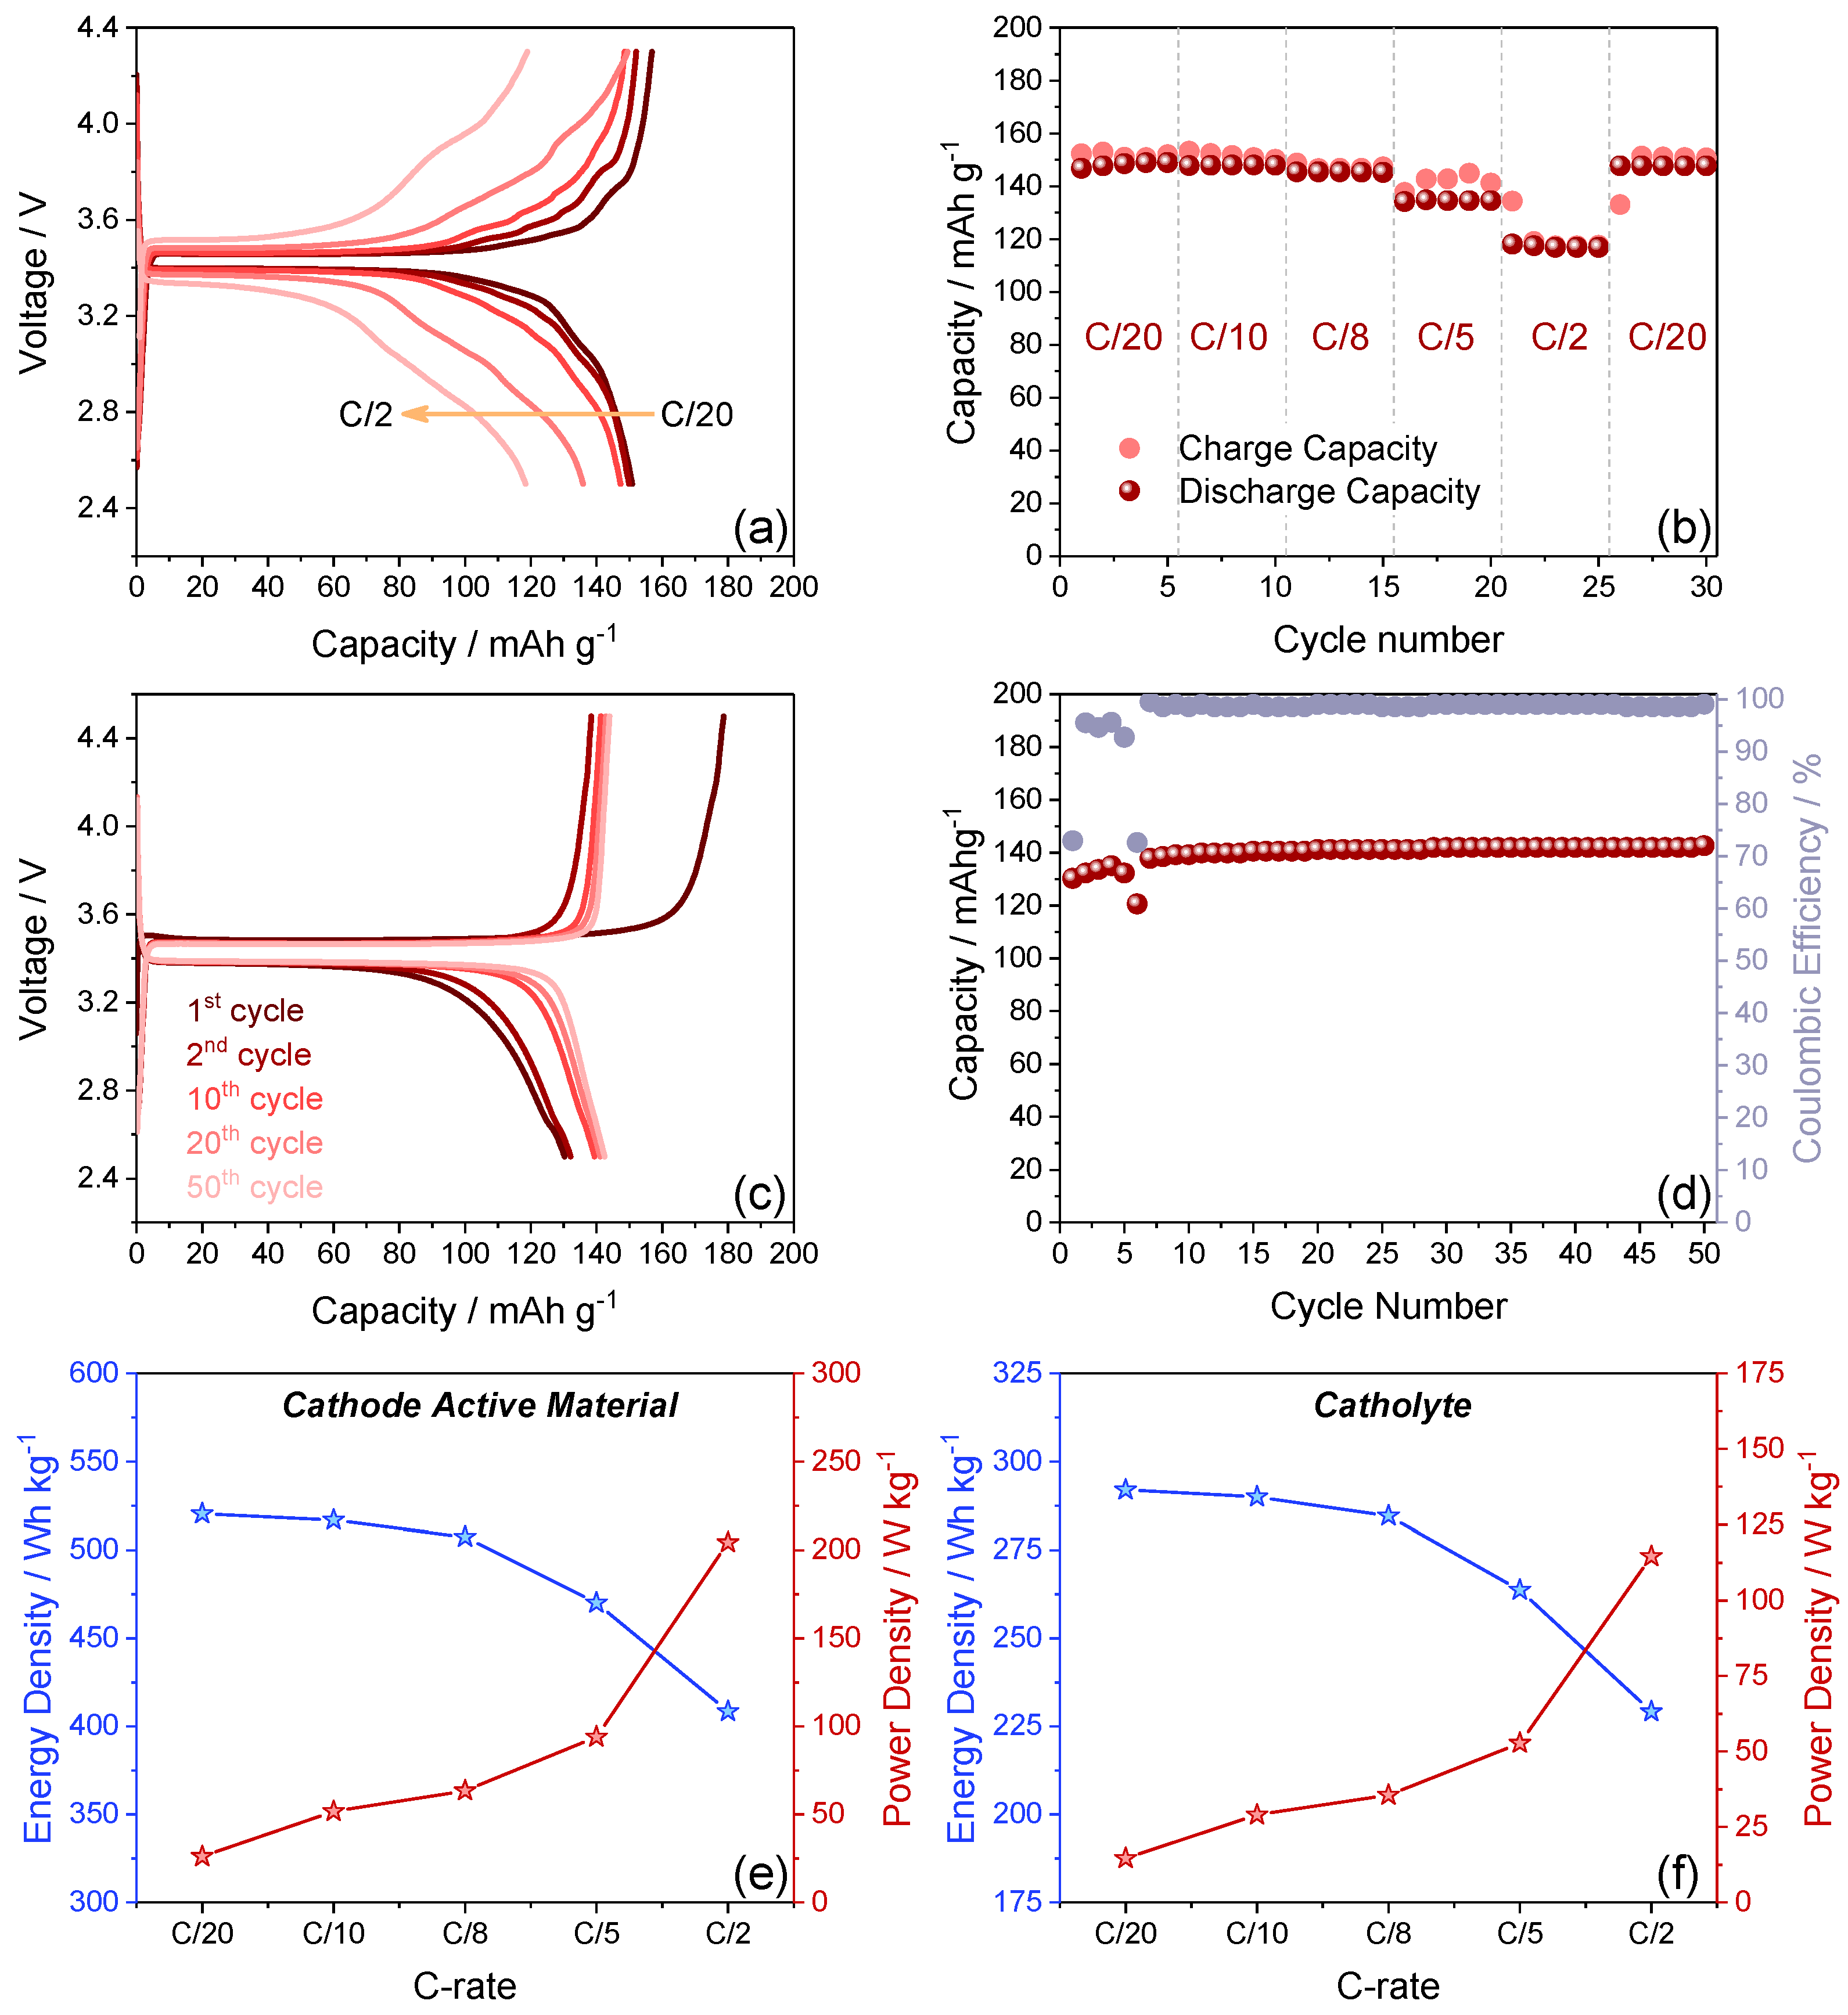
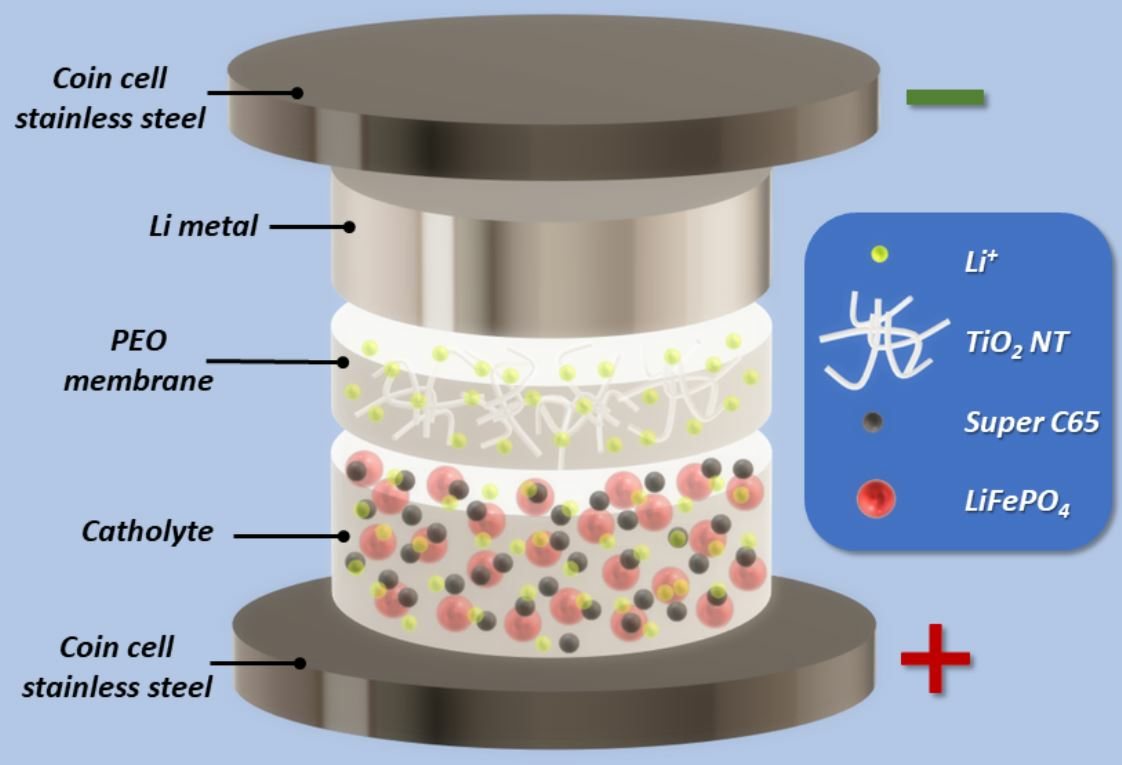
3.3. Full Li-Metal Cell with Self-Standing Catholyte

Nowadays, flexible lithium-ion batteries with high-energy density and capacity are essential. In conventional LIB fabrication, copper or aluminum foils are employed as current collectors, but they have a significant cost, particularly copper, and, more importantly, they add additional weight to the battery decreasing the power density [58]. On the other hand, fabricating flexible self-standing electrodes could maximize the specific capacity of the electrode by eliminating the dead weight of the collector, thus achieving very high performance. A commercial LFP powder was characterized by XRD, as reported in Figure S12. The results reveal the purity of the cathode crystalline phase compared with a reference diffractogram [59].
Figure 8 reports the mechanical and morphological features of the self-standing lithium iron phosphate obtained by SEM, TEM and STEM. SS-LFP is characterized by good flexibility and mechanical strength, as shown in Figure 8a. Then, it was further investigated by SEM, STEM and TEM analysis, as reported in Figure 8b–d. The SEM image of the catholyte reveals the existence of conglomerates with a dimension of about 20–30 µm, composed of submicrometric LFP primary particles, with dimensions of about hundreds of nanometers, as visible in STEM and TEM images. This composite morphology could ensure at the same time a short diffusion path for Li+ ions and prevent the electrolyte decomposition [54]. Additionally, the EDS mapping performed on the STEM image (Figure 8e–j) reveals that the LFP particles are homogeneously blended into the polymer matrix and eliminates the possibility of contamination in accordance with the XRD pattern of Figure S12. Indeed, the as-prepared LFP catholyte seems suitable for electrochemical application.
The electrochemical performances of SS-LFP in an all-solid-state lithium metal cell, using the NT10 membrane as an electrolyte was evaluated. The galvanostatic cycling tests at 65 °C are reported in Figure 9. The voltage profile (Figure 9a) and the trend (Figure 9b) of the rate capability were examined by changing the current from C/20 to C/2 (1C = 170 mA g−1) in the 2.5–4.3 V voltage range. The cell profile is characterized by a plateau at 3.45 V attributable to the Fe3+/Fe2+ redox couple. Moreover, the profiles of Figure 9a indicate a growth of the polarization by increasing the current which results in a capacity decrease from 150 mAh g−1 (i.e., about 88% of the theoretical value) at C/20 to about 120 mAh g−1 (70% of the theoretical value) at C/2, as predicted by the increase in ohmic polarization; the results show a clear decrease in capacity. However, when examining the cycling trend in Figure 9b, it is evident that the initial capacity remains intact up to C/8 and is ultimately recovered by decreasing the current from C/2 to C/10 in the final section of the experiment. This suggests that the SS-LFP catholyte displays good rate capability and stability even under the stress of raised currents [54]. The encouraging results obtained by the rate capability test, also considering the absence of the current collector in the electrodes, suggest the possibility of enlarging the voltage window of the cell in order to reach the maximum capacity and energy density of the cell [60]. To evaluate the stability of the all-solid-state cell in the 2.5–4.5 V potential range, three voltammetric cycles were carried out at a scan rate of 5 mV s−1, as shown in Figure S13. The high scan rate is used to increase the current response in order to evidence the presence of further redox peaks with respect to those ascribed to the Fe3+/Fe2+ redox couple. Overall, the absence of additional voltammetric signals confirms the possibility of broadening the voltage range of the cell up to 4.5 V. The electrochemical process of lithium (de)insertion in SS-LFP within an all-solid-state cell is examined for stability through repeated cycles of charge and discharge at a constant C-rate in the 2.5–4.5 V voltage range. The voltage profiles of the test performed at C/5 show the well-defined plateau above described and a maximum capacity of 145 mAh g−1, higher than the one obtained with the rate capability test, as expected by enlarging the voltage window. The cell demonstrated a coulombic efficiency of about 70% in the first cycle which increased to more than 99% during the subsequent ones; this phenomenon can be explained by the necessity of a few cycles to activate the material, as both the catholyte and the solid electrolyte need to reach optimum conditions. With the progression of cycles, the cell’s performance improves as the contact between the electrode and the electrolyte increases. Moreover, also the capacity increased from the first cycle (130 mAh g−1) to the following ones (145 mAh g−1), suggesting an activation of the catholyte material in the cell. More significantly, the material exhibits high coulombic efficiency and outstanding retention, indicating high stability during charge/discharge cycles.
Given the obtained performances and the high electrode mass loadings, the energy and power densities of the cell were calculated both at the active material level and at the catholyte level, without considering the counter-electrode material to allow for a direct comparison with data reported in the literature. As displayed in Figure 9e,f, the SS-LFP is able to deliver an energy density as high as 292 Wh kg−1 at the catholyte level (520 Wh kg−1 at the active material level) when cycled at the C/20 current rate, only slightly decreasing to 229 Wh kg−1 (408 Wh kg−1 at the active material level) when cycled at C/2. The power density is quite low at the slowest current rate, with a value of 15 W kg−1 at the catholyte level (26 W kg−1 at the active material level), but it rapidly increases up to 115 W kg−1 at C/2 (204 W kg−1 at the active material level). The obtained values are well in line with recently reported data for thick electrodes, thus hinting at the possibility of using the SS-LFP in solid-state configuration cells for high-energy/power-density applications [61].

4. Conclusions

In conclusion, the best molar ratio between PEO and LiTFSI was determined by evaluating the electrochemical performances of three membranes where the salt concentration was modified until the optimized salt concentration was found on the grounds of ionic conductivity and Li–electrolyte interphase formation. Titanium dioxide nanotubes were successfully synthesized and compared to commercial TiO2 nanoparticles as passive fillers of the polymeric membranes. Six non-flammable SPEs were prepared using the best PEO-LiTFSI membrane and three different concentrations of each filler. The SPEs were fully characterized by means of SEM, DSC, TGA, XRD, FTIR, Raman spectroscopy and electrochemical measurements such as CA, LSV, PEIS, CV and GCPL. According to the electrochemical tests, the best electrolyte was found to be the one with 10% TiO2 nanotubes, which stabilizes the Li–electrolyte interphase and promotes more suitable ion diffusion pathways in favor of better ion migration within the electrolyte. This electrolyte was tested in an all-solid-state configuration with a novel self-standing LFP catholyte that avoids the use of conventional Cu and/or Al current collectors, thus increasing the gravimetric energy density of the cell. The resulting Li-metal full cell with the composite polymer electrolyte and the SS-catholyte demonstrated good cyclability, high coulombic efficiency, superior safety and still high performances after 50 cycles at 65 °C, with the possibility to optimize the system either toward high-energy-density or high-power-density applications.

Supplementary Materials

The following supporting information can be downloaded at https://www.mdpi.com/article/10.3390/batteries10010011/s1, Figure S1: Representation of the equivalent circuit used in Figure 1b,d; Figure S2: SEM images of (a) synthesized titanium dioxide nanotubes and (b) commercial P25 nanoparticles; Figure S3: 50 h of galvanostatic plating/stripping test performed on symmetrical Li/NT10/Li cells at T = 65 °C; Figure S4: Differential Scanning Calorimetry curves of PEO polymer (red), pristine membrane (orange), NT15 (blue), NT10 (green), and NT3 (yellow) recorded under nitrogen flow in the −80–25 °C temperature range; Figure S5: (a) SEM image of the pristine membrane, (b) EDS mapping of (c) sulfur (d) carbon (e) fluorine and (f) oxygen. (g) Overlapping of all the elements detetected by EDS; Figure S6: EDS elemental maps of different concentrations of TiO2 in (a) NT3, (b) NT10, and (c) NT15; Figure S7: Nyquist plots related to EIS measurements performed at various temperatures on a stainless-steel/membrane/stainless-steel symmetrical cell with (a) pristine membrane and (b) NT10 to evaluate the electrolyte ionic conductivity, with magnification of the high-frequency region in the insets; Figure S8: Chronoamperometry curve recorded on a Li/Li symmetrical cell using pristine membrane as electrolyte for determination of Li+ transference number at 65 °C. The inset displays the corresponding Nyquist plots obtained by EIS at the initial and steady state; Figure S9: Linear sweep voltammetry in anodic region (OCV—5 V vs. Li+/Li potential range) performed at 65 °C in lithium cell using the pristine membrane as the electrolyte and Super P carbon coated on aluminium as the working electrode; Figure S10: CV curve of the cathodic region (0.01–2 V vs. Li+/Li potential range) performed at 65 ° using the NT10 membrane as the electrolyte and Super P carbon coated on copper as the working electrode; Figure S11: IR spectrum (top panel), recorded in the 500–4000 cm−1 range, and Raman spectrum (bottom panel), recorded in the 0–1750 cm−1 range, of the NT10; Figure S12: XRD pattern of commercial LFP powder compared to corresponding reference diffractogram (ICSD #72545); Figure S13: CV measurement performed on the Li/NT10/SS_LFP cell in the potential range 2.5–4.5 V vs. Li+/Li at the scan rate of 5 mV s−1; Table S1: Electrolyte resistance (Re), interphase resistance (Ri), and chi-square value indicating the accuracy (χ2) of the non-linear least squares (NLLS) analysis using the equivalent circuit Re(R1C1)(R2C2)Qw on the EIS data of the symmetrical Li/membrane/Li cells with different polymer-to-salt ratio (EO/Li), collected at OCV of the cells and after 25 h. See Figure 1b,d in the manuscript for related Nyquist plots; Table S2: Electrolyte resistance (Re), interphase resistance (Ri), and chi-square value indicating the accuracy (χ2) of the non-linear least squares (NLLS) analysis using the equivalent circuit Re(R1C1)(R2C2)Qw on the EIS data of the symmetrical Li/membrane/Li cells with TiO2 filler with different morphologies (nanotubes or nanoparticles) and concentration, collected at OCV of the cells and after 25 h. See Figure 3 in the manuscript for related Nyquist plots; Table S3: NLLS analysis on the Nyquist plots reported in Figure 7d in the manuscript collected by EIS on a Li/NT10/Li symmetrical cell upon aging. The NLLS fitting was performed through the RelaxIS3 software, and the corresponding resistance trend is shown in Figure 7e in the manuscript.

Author Contributions

The manuscript was written with the contributions of all authors. All authors have given approval to the final version of the manuscript. A.P., F.N. and M.Á.M.-M. conceptualized the work. A.P., L.S., L.M., F.N. and M.Á.M.-M. wrote the manuscript. A.P., H.D., L.S. and L.M. contributed to the analysis and discussion. G.A.E. performed the TEM and STEM measurements. F.N., V.C. and M.Á.M.-M. supervised the work. All authors have read and agreed to the published version of the manuscript.

Funding

This research received no external funding.

Data Availability Statement

Data are available on request to the corresponding author. The data are not publicly available due to privacy issues.

Acknowledgments

The authors thank HP Composites and the Italian Ministry of University and Research for funding the doctoral fellowship of A.P. in the framework of the project “Composite Materials Hub of Valle del Tronto, Marche region”.

Conflicts of Interest

V.C. is employee of the company HP Composites S.p.A. The remaining authors declare that the research was conducted in the absence of any commercial or financial relationships that could be construed as a potential conflict of interest.

References

  1. Xi, G.; Xiao, M.; Wang, S.; Han, D.; Li, Y.; Meng, Y. Polymer-Based Solid Electrolytes: Material Selection, Design, and Application. Adv. Funct. Mater. 2021, 31, 2007598. [Google Scholar] [CrossRef]
  2. Aragane, J.; Matsui, K.; Andoh, H.; Suzuki, S.; Fukuda, H.; Ikeya, H.; Kitaba, K.; Ishikawa, R. Development of 10 Wh Class Lithium Secondary Cells in the “New Sunshine Program”. J. Power Sources 1997, 68, 13–18. [Google Scholar] [CrossRef]
  3. Beaton, S.P.; Bishop, G.A.; Zhang, Y.; Stedman, D.H.; Ashbaugh, L.L.; Lawson, D.R. On-Road Vehicle Emissions: Regulations, Costs, and Benefits. Science 1995, 268, 991–993. [Google Scholar] [CrossRef] [PubMed]
  4. Scrosati, B. Challenge of Portable Power. Nature 1995, 373, 557–558. [Google Scholar] [CrossRef]
  5. Zhang, S.; Liang, T.; Wang, D.; Xu, Y.; Cui, Y.; Li, J.; Wang, X.; Xia, X.; Gu, C.; Tu, J. A Stretchable and Safe Polymer Electrolyte with a Protecting-Layer Strategy for Solid-State Lithium Metal Batteries. Adv. Sci. 2021, 8, 2003241. [Google Scholar] [CrossRef]
  6. Xu, K. Electrolytes and Interphases in Li-Ion Batteries and Beyond. Chem. Rev. 2014, 114, 11503–11618. [Google Scholar] [CrossRef] [PubMed]
  7. Song, B.; Dhiman, I.; Carothers, J.C.; Veith, G.M.; Liu, J.; Bilheux, H.Z.; Huq, A. Dynamic Lithium Distribution upon Dendrite Growth and Shorting Revealed by Operando Neutron Imaging. ACS Energy Lett. 2019, 4, 2402–2408. [Google Scholar] [CrossRef]
  8. Yang, X.; Luo, J.; Sun, X. Towards High-Performance Solid-State Li-S Batteries: From Fundamental Understanding to Engineering Design. Chem. Soc. Rev. 2020, 49, 2140–2195. [Google Scholar] [CrossRef]
  9. Zhou, Q.; Ma, J.; Dong, S.; Li, X.; Cui, G. Intermolecular Chemistry in Solid Polymer Electrolytes for High-Energy-Density Lithium Batteries. Adv. Mater. 2019, 31, e1902029. [Google Scholar] [CrossRef]
  10. Manthiram, A.; Yu, X.; Wang, S. Lithium Battery Chemistries Enabled by Solid-State Electrolytes. Nat. Rev. Mater. 2017, 2, 16103. [Google Scholar] [CrossRef]
  11. Zhao, Y.; Zheng, K.; Sun, X. Addressing Interfacial Issues in Liquid-Based and Solid-State Batteries by Atomic and Molecular Layer Deposition. Joule 2018, 2, 2583–2604. [Google Scholar] [CrossRef]
  12. Umeshbabu, E.; Zheng, B.; Yang, Y. Recent Progress in All-Solid-State Lithium−Sulfur Batteries Using High Li-Ion Conductive Solid Electrolytes. Electrochem. Energy Rev. 2019, 2, 199–230. [Google Scholar] [CrossRef]
  13. Marangon, V.; Tominaga, Y.; Hassoun, J. An Alternative Composite Polymer Electrolyte for High Performances Lithium Battery. J. Power Sources 2019, 449, 227508. [Google Scholar] [CrossRef]
  14. Ma, J.; Liu, Z.; Chen, B.; Wang, L.; Yue, L.; Liu, H.; Zhang, J.; Liu, Z.; Cui, G. A Strategy to Make High Voltage LiCoO2 Compatible with Polyethylene Oxide Electrolyte in All-Solid-State Lithium Ion Batteries. J. Electrochem. Soc. 2017, 164, A3454–A3461. [Google Scholar] [CrossRef]
  15. Lin, Z.; Guo, X.; Yu, H. Amorphous Modified Silyl-Terminated 3D Polymer Electrolyte for High-Performance Lithium Metal Battery. Nano Energy 2017, 41, 646–653. [Google Scholar] [CrossRef]
  16. Zhang, S.; Xia, X.; Xie, D.; Xu, R.; Xu, Y.; Xia, Y.; Wu, J.; Yao, Z.; Wang, X.; Tu, J. Facile Interfacial Modification via In-Situ Ultraviolet Solidified Gel Polymer Electrolyte for High-Performance Solid-State Lithium Ion Batteries. J. Power Sources 2018, 409, 31–37. [Google Scholar] [CrossRef]
  17. Zhou, D.; Shanmukaraj, D.; Tkacheva, A.; Armand, M.; Wang, G. Polymer Electrolytes for Lithium-Based Batteries: Advances and Prospects. Chem 2019, 5, 2326–2352. [Google Scholar] [CrossRef]
  18. He, K.-Q.; Zha, J.-W.; Du, P.; Cheng, S.H.-S.; Liu, C.; Dang, Z.-M.; Li, R.K.Y. Tailored High Cycling Performance in a Solid Polymer Electrolyte with Perovskite-Type Li0.33La0.557TiO3 Nanofibers for All-Solid-State Lithium Ion Batteries. Dalton Trans. 2019, 48, 3263–3269. [Google Scholar] [CrossRef]
  19. Shi, C.; Yu, M. Flexible Solid-State Lithium-Sulfur Batteries Based on Structural Designs. Energy Storage Mater. 2023, 57, 429–459. [Google Scholar] [CrossRef]
  20. Croce, F.; Bonino, F.; Panero, S.; Scrosati, B. Properties of Mixed Polymer and Crystalline Ionic Conductors. Philos. Mag. B 1989, 59, 161–168. [Google Scholar] [CrossRef]
  21. Shi, C.; Alexander, G.V.; O’neill, J.; Duncan, K.; Godbey, G.; Wachsman, E.D. All-Solid-State Garnet Type Sulfurized Polyacrylonitrile/Lithium-Metal Battery Enabled by an Inorganic Lithium Conductive Salt and a Bilayer Electrolyte Architecture. ACS Energy Lett. 2023, 8, 1803–1810. [Google Scholar] [CrossRef]
  22. Wetjen, M.; Navarra, M.A.; Panero, S.; Passerini, S.; Scrosati, B.; Hassoun, J. Composite Poly(Ethylene Oxide) Electrolytes Plasticized by N-Alkyl-N-Butylpyrrolidinium Bis(Trifluoromethanesulfonyl)Imide for Lithium Batteries. ChemSusChem 2013, 6, 1037–1043. [Google Scholar] [CrossRef] [PubMed]
  23. Appetecchi, G.; Croce, F.; Hassoun, J.; Scrosati, B.; Salomon, M.; Cassel, F. Hot-Pressed, Dry, Composite, PEO-Based Electrolyte Membranes: I. Ionic Conductivity Characterization. J. Power Sources 2003, 114, 105–112. [Google Scholar] [CrossRef]
  24. Cheung, I.; Chin, K.; Greene, E.; Smart, M.; Abbrent, S.; Greenbaum, S.; Prakash, G.; Surampudi, S. Electrochemical and Solid State NMR Characterization of Composite PEO-Based Polymer Electrolytes. Electrochim. Acta 2003, 48, 2149–2156. [Google Scholar] [CrossRef]
  25. Liu, Y.; Lee, J.; Hong, L. In Situ Preparation of Poly(Ethylene Oxide)-SiO2 Composite Polymer Electrolytes. J. Power Sources 2004, 129, 303–311. [Google Scholar] [CrossRef]
  26. Krawiec, W.; Scanlon, L.; Fellner, J.; Vaia, R.; Vasudevan, S.; Giannelis, E. Polymer Nanocomposites: A New Strategy for Synthesizing Solid Electrolytes for Rechargeable Lithium Batteries. J. Power Sources 1995, 54, 310–315. [Google Scholar] [CrossRef]
  27. Croce, F.; Appetecchi, G.B.; Persi, L.; Scrosati, B. Nanocomposite Polymer Electrolytes for Lithium Batteries. Nature 1998, 394, 456–458. [Google Scholar] [CrossRef]
  28. Golodnitsky, D.; Ardel, G.; Peled, E. Ion-Transport Phenomena in Concentrated PEO-Based Composite Polymer Electrolytes. Solid State Ion. 2002, 147, 141–155. [Google Scholar] [CrossRef]
  29. Bloise, A.; Tambelli, C.; Franco, R.; Donoso, J.; Magon, C.; Souza, M.; Rosario, A.; Pereira, E. Nuclear Magnetic Resonance Study of PEO-Based Composite Polymer Electrolytes. Electrochim. Acta 2001, 46, 1571–1579. [Google Scholar] [CrossRef]
  30. Kumar, B.; Rodrigues, S.J.; Scanlon, L.G. Ionic Conductivity of Polymer-Ceramic Composites. J. Electrochem. Soc. 2001, 148, A1191–A1195. [Google Scholar] [CrossRef]
  31. Feng, J.; Wang, L.; Chen, Y.; Wang, P.; Zhang, H.; He, X. PEO Based Polymer-Ceramic Hybrid Solid Electrolytes: A Review. Nano Converg. 2021, 8, 1–12. [Google Scholar] [CrossRef] [PubMed]
  32. Sun, K.C.; Qadir, M.B.; Jeong, S.H. Hydrothermal Synthesis of TiO2 Nanotubes and Their Application as an Over-Layer for Dye-Sensitized Solar Cells. RSC Adv. 2014, 4, 23223–23230. [Google Scholar] [CrossRef]
  33. Sun, K.C.; Yun, S.H.; Yoon, C.H.; Ko, H.H.; Yi, S.; Jeong, S.H. Enhanced Power Conversion Efficiency of Dye-Sensitized Solar Cells Using Nanoparticle/Nanotube Double Layered Film. J. Nanosci. Nanotechnol. 2013, 13, 7938–7943. [Google Scholar] [CrossRef] [PubMed]
  34. Evans, J.; Vincent, C.A.; Bruce, P.G. Electrochemical Measurement of Transference Numbers in Polymer Electrolytes. Polymer 1987, 28, 2324–2328. [Google Scholar] [CrossRef]
  35. Barsoukov, E.; Macdonald, J.R. Impedance Spectroscopy: Theory, Experiment, and Applications; John Wiley & Sons: Hoboken, NJ, USA, 2005. [Google Scholar]
  36. Boukamp, B.A. A Package for Impedance/Admittance Data Analysis. Solid State Ion. 1986, 18–19, 136–140. [Google Scholar] [CrossRef]
  37. Boukamp, B.A. A Nonlinear Least Squares Fit Procedure for Analysis of Immittance Data of Electrochemical Systems. Solid State Ion. 1986, 20, 31–44. [Google Scholar] [CrossRef]
  38. Li, N.; Pan, N.; Li, D.; Lin, S. Natural Dye-Sensitized Solar Cells Based on Highly Ordered TiO2Nanotube Arrays. Int. J. Photoenergy 2013, 2013, 598753. [Google Scholar] [CrossRef]
  39. Rao, B.M.; Roy, S.C. Anatase TiO2 Nanotube Arrays with High Temperature Stability. RSC Adv. 2014, 4, 38133–38139. [Google Scholar] [CrossRef]
  40. Shaban, M.; Poostforooshan, J.; Weber, A.P. Surface-Initiated Polymerization on Unmodified Inorganic Semiconductor Nanoparticles: Via Surfactant-Free Aerosol-Based Synthesis toward Core-Shell Nanohybrids with a Tunable Shell Thickness. J. Mater. Chem. A 2017, 5, 18651–18663. [Google Scholar] [CrossRef]
  41. Xu, H.; Chien, P.-H.; Shi, J.; Li, Y.; Wu, N.; Liu, Y.; Hu, Y.-Y.; Goodenough, J.B. High-Performance All-Solid-State Batteries Enabled by Salt Bonding to Perovskite in Poly(Ethylene Oxide). Proc. Natl. Acad. Sci. USA 2019, 116, 18815–18821. [Google Scholar] [CrossRef]
  42. Olmedo-Martínez, J.L.; Porcarelli, L.; Guzmán-González, G.; Calafel, I.; Forsyth, M.; Mecerreyes, D.; Müller, A.J. Ternary Poly(Ethylene Oxide)/Poly(l, l -Lactide) PEO/PLA Blends as High-Temperature Solid Polymer Electrolytes for Lithium Batteries. ACS Appl. Polym. Mater. 2021, 3, 6326–6337. [Google Scholar] [CrossRef]
  43. St-Onge, V.; Cui, M.; Rochon, S.; Daigle, J.-C.; Claverie, J.P. Reducing Crystallinity in Solid Polymer Electrolytes for Lithium-Metal Batteries via Statistical Copolymerization. Commun. Mater. 2021, 2, 83. [Google Scholar] [CrossRef]
  44. Croce, F.; Persi, L.; Ronci, F.; Scrosati, B. Nanocomposite Polymer Electrolytes and Their Impact on the Lithium Battery Technology. Solid State Ion. 2000, 135, 47–52. [Google Scholar] [CrossRef]
  45. Wieczorek, W.; Florjanczyk, Z.; Stevens, J. Composite Polyether Based Solid Electrolytes. Electrochim. Acta 1995, 40, 2251–2258. [Google Scholar] [CrossRef]
  46. Vignarooban, K.; Dissanayake, M.; Albinsson, I.; Mellander, B.-E. Effect of TiO2 Nano-Filler and EC Plasticizer on Electrical and Thermal Properties of Poly(Ethylene Oxide) (PEO) Based Solid Polymer Electrolytes. Solid State Ion. 2014, 266, 25–28. [Google Scholar] [CrossRef]
  47. Panero, S.; Scrosati, B.; Sumathipala, H.; Wieczorek, W. Dual-Composite Polymer Electrolytes with Enhanced Transport Properties. J. Power Sources 2007, 167, 510–514. [Google Scholar] [CrossRef]
  48. Mao, G.; Saboungi, M.-L.; Price, D.L.; Armand, M.B.; Howells, W.S. Structure of Liquid PEO-LiTFSI Electrolyte. Phys. Rev. Lett. 2000, 84, 5536–5539. [Google Scholar] [CrossRef]
  49. Maurel, A.; Armand, M.; Grugeon, S.; Fleutot, B.; Davoisne, C.; Tortajada, H.; Courty, M.; Panier, S.; Dupont, L. Poly(Ethylene Oxide)−LiTFSI Solid Polymer Electrolyte Filaments for Fused Deposition Modeling Three-Dimensional Printing. J. Electrochem. Soc. 2020, 167, 070536. [Google Scholar] [CrossRef]
  50. Besenhard, J.O. Handbook of Battery Materials; John Wiley & Sons: Hoboken, NJ, USA, 2007. [Google Scholar]
  51. Marangon, V.; Minnetti, L.; Barcaro, E.; Hassoun, J. Room-Temperature Solid-State Polymer Electrolyte in Li-LiFePO4, Li-S and Li-O2 Batteries. Chem.–A Eur. J. 2023, 29, e202301345. [Google Scholar] [CrossRef]
  52. Carbone, L.; Gobet, M.; Peng, J.; Devany, M.; Scrosati, B.; Greenbaum, S.; Hassoun, J. Comparative Study of Ether-Based Electrolytes for Application in Lithium–Sulfur Battery. ACS Appl. Mater. Interfaces 2015, 7, 13859–13865. [Google Scholar] [CrossRef]
  53. Marangon, V.; Di Lecce, D.; Minnetti, L.; Hassoun, J. Novel Lithium-Sulfur Polymer Battery Operating at Moderate Temperature. ChemElectroChem 2021, 8, 3971–3981. [Google Scholar] [CrossRef]
  54. Minnetti, L.; Marangon, V.; Hassoun, J. Synthesis and Characterization of a LiFe0.6Mn0.4PO4 Olivine Cathode for Application in a New Lithium Polymer Battery. Adv. Sustain. Syst. 2022, 6, 202100464. [Google Scholar] [CrossRef]
  55. Kim, G.-T.; Appetecchi, G.B.; Alessandrini, F.; Passerini, S. Solvent-Free, PYR1ATFSI Ionic Liquid-Based Ternary Polymer Electrolyte Systems. I. Electrochemical Characterization. J. Power Sources 2007, 171, 861–869. [Google Scholar] [CrossRef]
  56. Kim, K.; Kuhn, L.; Alabugin, I.V.; Hallinan, D.T. Lithium Salt Dissociation in Diblock Copolymer Electrolyte Using Fourier Transform Infrared Spectroscopy. Front. Energy Res. 2020, 8, 569442. [Google Scholar] [CrossRef]
  57. Khalid, A.; Ahmad, P.; Alharthi, A.I.; Muhammad, S.; Khandaker, M.U.; Faruque, M.R.I.; Din, I.U.; Alotaibi, M.A. Unmodified Titanium Dioxide Nanoparticles as a Potential Contrast Agent in Photon Emission Computed Tomography. Crystals 2021, 11, 171. [Google Scholar] [CrossRef]
  58. Chen, C.-H.; Chiu, J.-M.; Shown, I.; Wang, C.-H. Simple Way of Making Free-Standing Cathode Electrodes for Flexible Lithium-Ion Batteries. RSC Adv. 2022, 12, 9249–9255. [Google Scholar] [CrossRef]
  59. Streltsov, V.A.; Belokoneva, E.L.; Tsirelson, V.G.; Hansen, N.K. Multipole Analysis of the Electron Density in Triphylite, LiFePO4, Using X-ray Diffraction Data. Acta Crystallogr. Sect. B Struct. Sci. 1993, 49, 147–153. [Google Scholar] [CrossRef]
  60. Padhi, A.K.; Nanjundaswamy, K.S.; Goodenough, J.B. Phospho-olivines as Positive-Electrode Materials for Rechargeable Lithium Batteries. J. Electrochem. Soc. 1997, 144, 1188–1194. [Google Scholar] [CrossRef]
  61. Wu, J.; Zhang, X.; Ju, Z.; Wang, L.; Hui, Z.; Mayilvahanan, K.; Takeuchi, K.J.; Marschilok, A.C.; West, A.C.; Takeuchi, E.S.; et al. From Fundamental Understanding to Engineering Design of High-Performance Thick Electrodes for Scalable Energy-Storage Systems. Adv. Mater. 2021, 33, 2101275. [Google Scholar] [CrossRef]
Figure 1. (a) As-synthesized solid membrane after hot pressing; (b) EIS measurements for PEO membranes with different polymer-to-salt (EO/Li) ratios at OCV; (c) galvanostatic plating/stripping test of symmetrical Li/membrane/Li cells at T = 65 °C with a current of 0.05 mA cm−2; (d) EIS measurements for PEO membranes with different polymer-to-salt (EO/Li) ratios after 25 h.
Batteries 10 00011 g001
Figure 2. (a) X-ray diffraction patterns of NTs (green) and NPs (black) with indexing according to phases reported in literature. (b) SEM image of the synthetized nanotubes. (c) Particle size distribution (PSD) in terms of width obtained from the analysis of the SEM images through the ImageJ software.
Batteries 10 00011 g002
Figure 3. Nyquist plots of PEO membranes loaded with 3%, 10% and 15% of (a) TiO2 NP and (b) TiO2 NT at OCV and after 25 h of galvanostatic plating/stripping test (insets) performed on symmetrical Li/membrane/Li cells at T = 65 °C.
Batteries 10 00011 g003
Figure 4. TGA curves of NT3 (red), NT10 (green) and NT15 (blue) recorded under nitrogen flow in the 30–500 °C temperature range (magnification of the 360–460 °C region in the inset) at a heating rate of 10 °C min−1.
Batteries 10 00011 g004
Figure 5. (a) SEM image of NT10 membrane and elemental mapping of (b) Ti, (c) O, (d) F and (e) S.
Batteries 10 00011 g005
Figure 6. Photographic images of flammability test on (a,b) Whatman GF/D separator soaked in LP30 liquid electrolyte and (c,d) NT10 membrane. In particular, photographic images taken (a,c) before and (b,d) after direct exposure to a butane flame.
Batteries 10 00011 g006
Figure 7. Electrochemical characterization of NT10. (a) Ionic conductivity plot of NT10 in comparison with pristine membrane, with corresponding linear fits before and after melting that underline the existence of two different slopes (see corresponding Nyquist plots in Figure S4). (b) Chronoamperometry curves recorded on a Li/Li symmetrical cell used for determining Li+ transference number at 45 °C (blue), 55 °C (red) and 65 °C (green). The inset displays the corresponding Nyquist plots obtained by EIS at the initial and steady state for each temperature. (c) Linear sweep voltammetry in anodic region performed at 65 °C in lithium cell using NT10 as electrolyte and Super P carbon coated on aluminum as working electrode. (d) Nyquist plots of Li/Li symmetrical cell aged at 65 °C and (e) trend of related interphase resistance values obtained by NLLS fit (see Table S3).
Batteries 10 00011 g007
Figure 8. Photographic and electron micrscopy images of self-standing SS-LFP electrode: (a) Photographic image; (b) Scanning electron micrography (SEM); (c) Scanning transmission electron micrography (STEM); (d) Transmission electron micrography (TEM); (e) STEM-EDS (energy-dispersive X-ray spectroscopy) micrography; (fj) EDS elemental mapping of Fe, P, O, C, S.
Batteries 10 00011 g008
Figure 9. Galvanostatic cycling performances of the Li/NT10/SS-LFP cell. Rate capability in terms of (a) voltage profiles and (b) corresponding cycling trend performed at C/20, C/10, C/8, C/5 and C/2 currents (1C = 170 mA g−1), within the voltage range 2.5–4.3 V; electrochemical performance of the cell at constant current rate of C/5 in terms of (c) voltage profiles and (d) corresponding cycling trend in terms of discharge capacity and related coulombic efficiency, within the voltage range 2.5–4.5 V; calculated gravimetric energy density and gravimetric power density for the different current rates at (e) cathode active material level and (f) catholyte level.
Batteries 10 00011 g009
Table 1. Glass transition temperature (Tg) of the pristine membrane, the various NTX membranes and PEO obtained by DSC analysis. See Figure S3 Supporting Information for related DSC curves.
SampleTg (°C)
Pristine membrane:PEO/LiTFSI 21:1−44.7
NT3−41.8
NT10−45.2
NT15−46.8
PEO−54.3
Table 2. Parameters used to determine lithium transference number of NT10 at different temperatures using the Bruce–Vincent–Evans method. Resistance values were obtained by NLLS analysis of the Nyquist plots displayed in the inset of Figure 7b.
Temperature
(°C)
Initial Current
(i0) (A)
Steady-State
Current
(iSS) (A)
Initial
Resistance
(R0) (Ω)
Steady-State
Resistance
(RSS)
(Ω)
Li+
Transference
Number
+)
45 3.25 × 10−51.23 × 10−5322.61321.190.27
559.94 × 10−53.86 × 10−5134.16 148.120.28
651.57 × 10−48.60 × 10−5129.81134.390.29
Disclaimer/Publisher’s Note: The statements, opinions and data contained in all publications are solely those of the individual author(s) and contributor(s) and not of MDPI and/or the editor(s). MDPI and/or the editor(s) disclaim responsibility for any injury to people or property resulting from any ideas, methods, instructions or products referred to in the content.

