Article

Synthesis and Characterization of Lithium Phosphate (Li3PO4) as a Solid Electrolyte

Department of Chemical Engineering and Technology, School of Chemistry and Chemical Engineering, Central South University, Changsha 410083, China
*
Author to whom correspondence should be addressed.
Batteries 2024, 10(12), 429; https://doi.org/10.3390/batteries10120429
Submission received: 13 October 2024 / Revised: 26 November 2024 / Accepted: 30 November 2024 / Published: 3 December 2024

Abstract

:
Due to its high thermal stability, environmental friendliness, and safety, lithium phosphate (Li3PO4) is used as a solid electrolyte in battery applications, but it is usually used with dopants due to its lower ionic conductivity, which is required for ion transport. However, due to its stability and environmentally friendly aspect, lithium phosphate is still a hot topic among suitable energy materials that need further research to improve its electrochemical properties. In the current work, a novel synthesis of lithium phosphate was proposed from the raw materials lithium carbonate (Li2CO3) and trisodium phosphate dodecahydrate (Na3PO4*12H2O) under suitable stoichiometric conditions using the co-precipitation method. In the set of synthesized samples, a single-phase β-Li3PO4 (named LPO-4) with 99.7% purity and 93.49% yield was successfully prepared under appropriate stoichiometric conditions and pH 13 at 90 °C. The average particle size was 10 nm with a large surface area of 9.02 m2g−1. Electrochemical impedance spectroscopy (EIS) of LPO-4 revealed a conductivity of 7.1 × 10⁻⁶ S.cm−1 at room temperature and 2.7 × 10⁻⁵ S.cm−1 at 80 °C with a low activation energy of 0.38 eV. This performance is attributed to the morphology of the nanotubes and the smaller particle size, which enlarge the reaction interfaces and shorten the diffusion distance of lithium ions. The kinetic and thermodynamic key parameters showed that the β-Li3PO4 exhibits thermal stability in the room temperature range up to 208.8 °C. All these property values indicate a promising application of lithium phosphate as a solid electrolyte in solid-state batteries and a new route for further investigation.

Highlights

  • The single-phase and high-purity β-Li3PO4 was synthesized by a facile co-precipitation method.
  • A particle nanoscale sample with a high surface area was successfully prepared.
  • A solid electrolyte, lithium phosphate, with high ionic conductivity was achieved.
  • Kinetic and thermodynamic studies established lithium phosphate behavior as a function of the temperature.

1. Introduction

Lithium element has become an essential component of the new generation of sustainable and green energy technologies. Lithium phosphate produced from lithium plays a crucial role in modern battery technology and biomass conversion as a catalyst [1] due to its excellent electrochemical and catalytic performance in alkylene oxide isomerization reactions. In lithium-ion batteries, it is usually used as a solid electrolyte or as a protective coating rather than directly as a cathode material [2,3]. Due to the safety issues associated with liquid electrolytes, such as leakage, explosion, and fire risks, a solid electrolyte has been developed as an alternative solution to overcome these problems and improve the energy density of lithium-ion batteries [4,5].
Therefore, researchers have applied various techniques to improve conductivity, including particle size modulation and doping with some elements (iron, cobalt, and nickel) [6], using different synthesis methods, including the plasma spray [2,7], the co-precipitation [8], the pulsed laser decomposition [9], wet chemical (conductivity of 4.65 × 10⁻⁸ S.cm−1) [10] and the solid-state methods [11]. These approaches for producing lithium phosphate include a co-precipitation method, which is the best way to obtain a homogeneous lithium phosphate product under suitable stoichiometric conditions and pH values due to the high ion exchange. In the co-precipitation method, several routes were explored by a combination of various sources of lithium (hydroxide, carbonate, etc.) and phosphate ions (phosphoric acid, ammonium dihydrogen phosphate, sodium phosphate, etc.), as shown in Table 1.
He Guoduan et al. [12] extracted the lithium from the mother liquor of lithium carbonate precipitation to obtain high purity of lithium phosphate in the temperature range of 70–78 °C at a pH of 12.5–13. Norikazu Ishigaki and Junji Akimoto [17] synthesized lithium phosphate as a solid electrolyte for batteries at room temperature and investigated its phase transformation from β-Li3PO4 to γ-Li3PO4 type. The challenge is to propose the most cost-effective high-purity lithium phosphate and improve its ionic conductivity (10−10 S.cm−1 at room temperature [8]) with excellent electrochemical performance. Some researchers propose to reduce the particle size to the nanoscale due to the increased surface area, which could establish a balance between the ion transport pathways and structural integrity [2].
However, a simple method to prepare Li3PO4 by considering the proper stoichiometry and studying the key kinetic and thermodynamic parameters may be crucial to understanding the properties, behavior, and potential of lithium phosphate (Figure 1).
Herein, we proposed a new preparation of lithium phosphate (Li3PO4) as a solid electrolyte from lithium mother liquor (Li2CO3) and the phosphate source trisodium phosphate dodecahydrate (Na3PO4*12H2O) for solid-state batteries. To improve the lower conductivity of lithium phosphate, the average particle size was set to a nanoscale of 10 nm with a micropore volume close to zero. This resulted in nanostructured Li3PO4, which improves its electrochemical performance by reducing the diffusion pathways for lithium ions. The kinetic and thermodynamic models of Coats and Redfern were developed using the constants of Plank and Boltzmann to determine the sample thermal behavior, including mass loss phases, activation energy (Ea), entropy changes (ΔS), enthalpy changes (ΔH), Gibbs free energy changes (ΔG), and pre-exponential factor (A).

2. Experimental Procedures and Characterization

The raw materials of lithium mother liquor (Li2CO3) and the phosphate source trisodium phosphate dodecahydrate (Na3PO4*12H2O) were purchased from the National Pharmaceutical Group Chemical Reagent Co., Ltd. (Shanghai, China).

2.1. Titration

The titration procedure (acid mixture): 0.25 g of the lithium carbonate sample was dissolved in 50 mL of deionized solution and stirred well until the solid was completely dissolved. Eight drops of the indicator bromocresol green-methyl red solution (3:1) were added to this solution, which turned green. The titration acid solution was prepared from 50 mL chloric acid (HCl, 0.4996 mol/L) and distilled water (1:1). Using the titrator, the acid solution was first gradually added to the sample solution in the round bottom flask and stirred until the solution turned red. This solution was then heated for 2 min (the color must turn green again) and allowed to cool naturally. The titration was continued the second time; generally, one or two drops of acid were sufficient for the sample solution to turn red. The titration was stopped when the solution turned red, and the acid solution used was measured, as presented in Figure 2. Then, the purity was calculated through the following equation: W L i C O 3 = C B * V * M m * 1000 * 100 . CB: HCl concentration in the solution (1:1) (CB = 0.2498 mol/L); V: measured volume (mL) of HCl injected in the tested solution during titration; M: ½ of the mass molar (g/mol) of lithium Li2CO3; m: mass (g) of Li2CO3 tested sample. For example: W L i C O 3 = 0.2498 m o l / L * 28.80 m L * 36.94 g / m o l 0.2720 g * 1000 * 100 = 97.704 % .

2.2. Preparation

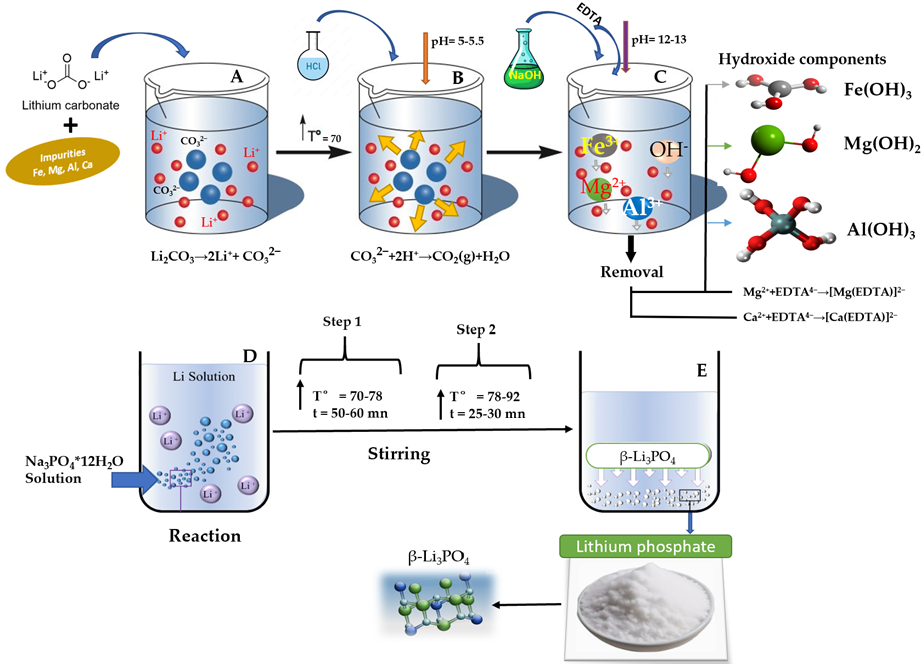
Figure 3 describes the Lithium phosphate preparation procedure and the main steps for removal of impurities. The Li3PO4 samples were prepared using co-precipitation. First, 3 g of lithium carbonate (Li2CO3) sample was dissolved in deionized water at room temperature to obtain a lithium concentration of 0.21 mol/L (Li+) in the solution. The initial pH of the sample solution was adjusted to 5–5.5 by adding chloric acid (HCl, 36–38%). After stirring at 70 °C for 20–25 min to remove the carbonate ions in the solution, the pH was readjusted to 12–13 by adding NaOH (1%) and 0.025–0.5 g.L−1 and EDTA (ethylenediaminetetraacetic acid).
During the increase in the lithium carbon solution’s pH, some impurities such as Al, Fe, and Mg formed insoluble hydroxides in basic conditions and were removed from the solution. The added EDTA formed soluble complexes with Mg2⁺ and Ca2⁺ under vigorous stirring for 25–30 min and supported the precipitation of the remaining impurities.
The obtained solution was then filtered using a multifunction vacuum pump with water circulation and filter paper.
Secondly, an equivalent molarity of sodium phosphate source was dissolved in deionized water according to the following relationship: n[Na3PO4.12H2O] = n[Li+]/3. The sodium phosphate solution was gradually added to the lithium source solution at 70–78 °C with vigorous stirring for 50–60 min. Additional heating and stirring for 25–30 min at 78–92 °C were necessary to complete the reaction, and a white precipitate (Li3PO4) began to form immediately. The final white solution was filtered and washed; the solid phase was collected and dried at 105 °C for 2 h in an electrothermal fan dryer (Shanghai Lichen Bangxi Instrument Technology Co., Ltd., Shanghai, China, No. 101-185). Table 2 presents the basic conditions of the process and statistics of the different samples.

2.3. Sample Characterization Methods

Various techniques were used to characterize the different samples. The purity of the Li2CO3 source and the content of impurities were determined using the standard titration method and inductively coupled plasma optical emission spectroscopy (ICP-OES) (Optima 5300 DV model, S09022867, manufacturing unit: PerkinElmer, USA).
The crystal phase studies for all samples were performed using the Empyrean Malvinpanakry X-ray diffractometer (Goniometer reproducibility: 0.0001 degrees; controllable step: 0.0001 degrees; test voltage 45 kv 40 mA). All reflections were assigned using the International Center for Diffraction Data (ICDD).
The surface morphology of the particles and the distribution of the samples were characterized using scanning electron microscopy (SEM) (Company: Zeiss, Germany, Model: Sigma300) in combination with energy dispersive X-ray spectroscopy (EDS) (Oxford Energy Spectrograph 30 xplore).
X-ray photoelectron spectroscopy (XPS) was performed using ThermoFisher Scientific (America) with X-ray radiation of 10–400 μm (5 μm step size setting). The binding energies of the chemical elements were corrected with the internal standard C 1s (284.5 eV). The peaks were fitted with a Gaussian line shape in Origin 2024b software.
The electrochemical properties of the sample were analyzed by electrochemical impedance spectroscopy (EIS) using the DH7000 Electrochemical Workstation. The test was performed at room temperature, 40, 60, and 80 °C. The frequency was set to 1 MHz–0.01 Hz, and the amplitude to 5 mV. After the test, the EIS card was adjusted.
The atmospheric plasma spraying (APS, Jiangsu Donghua Analytical instrument Co., Ltd., Jiangyan, China) technique was used to deposit materials as coatings on surfaces with a surface area of 0.785 cm2 and a thickness of 0.0781 cm measured with a spiral micrometer (model IP64). It used a symmetric cell with stainless steel blocking electrodes, with an amplitude of 10 mV and a frequency range of 0.1 to 1 MHz. This method consisted of measuring the conductivity from high temperature to room temperature to ensure the thermal stability of the sample. The ionic conductivity (σ) of LPO-4 was calculated from the impedance data at RT, 40, 80 °C.
The thermal properties of the tested solid electrolyte were investigated using the TG/DTA7300 system (Seiko, Japon: Hitachi Corporation). The LPO-4 powder was heated to 820 °C under nitrogen supply at a rate of 10 °C min−1. Subsequently, the TG data were used to develop Coats and Redfern models using Plank and Boltzmann constants and to calculate the key kinetic and thermodynamic parameters for each thermal phase of the LPO-4 sample.

2.4. Modeling

We assumed that all conversions were first-order reactions. Coats and Redfern models were developed to calculate the kinetic and thermodynamic key parameters for each thermal phase, such as pre-exponential factor (A), Gibbs free energy changes ( G ) , entropy changes   ( S ) , and enthalpy changes H [19,20,21,22,23]. The following equations and constants were used in this procedure:
ln ln 1 x = l n A R T 2 β E a E a R T ,
where: x = w i w t w i w f ; wi: initial sample weight; wt: weight of sample at particular temperature T; wf: final sample weight; A: pre-exponential factor; β : heating rate (10 °C/min); R: gas constant (8.3143 Jmol−1K−1); Ea: activation energy, T: temperature (K) at the peak of the DTG curves.
E a   =   slope × 8.3143
A = β E a e E a R T 2 R T 2
H = E a R T
G = E a + T . l n K T h A
S = H G T
where K is Boltzmann’s constant (1.381 × 10⁻²³ J.K−1), and h is Planck’s constant (6.626 × 10⁻³⁴ J s).
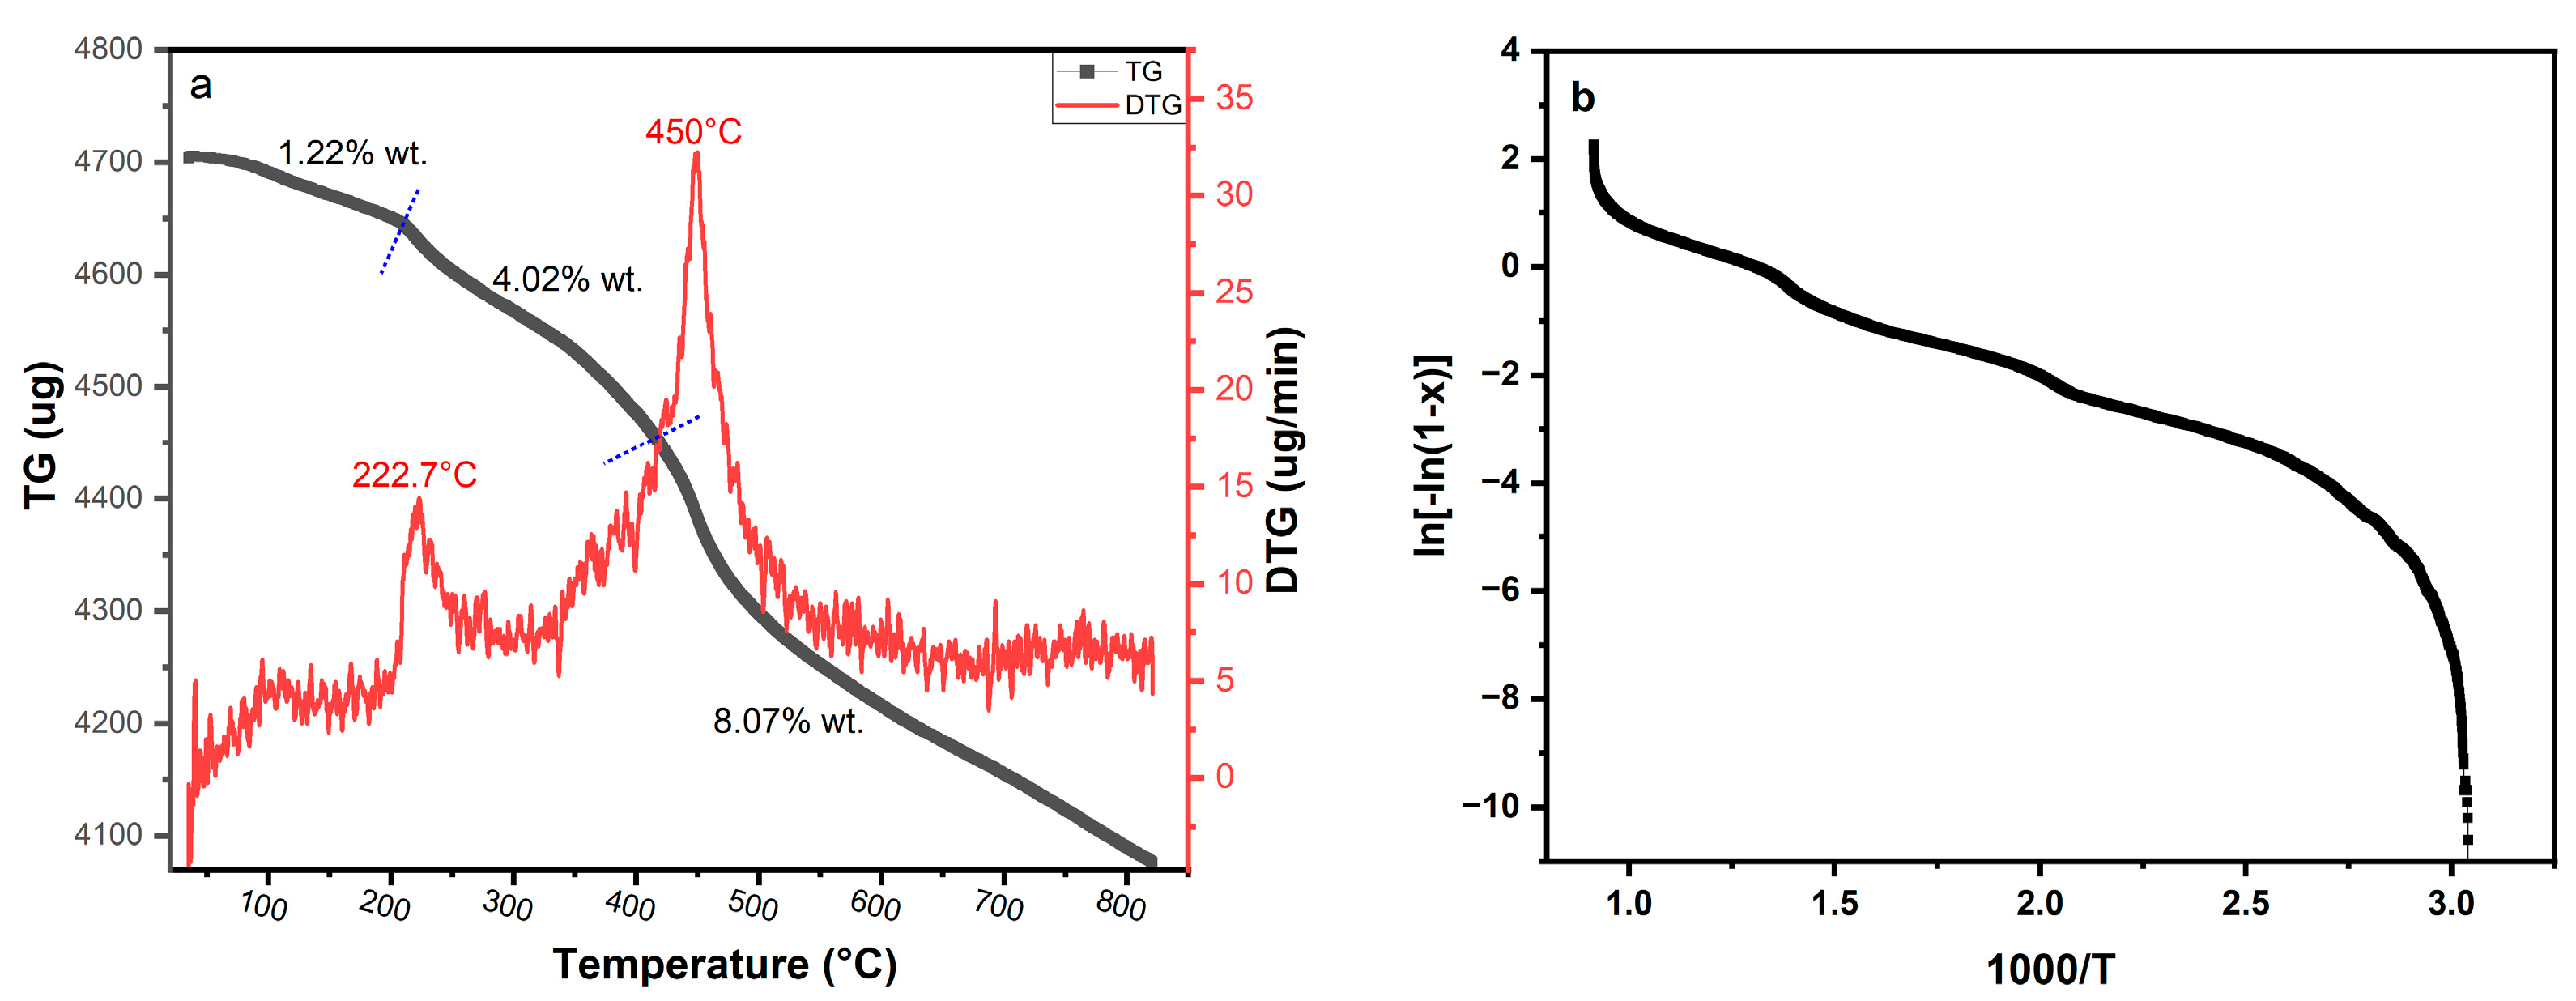
The slope and intercept values of the plot of ln ln 1 x versus 1000/T were used to determine the activation energies and other thermodynamic parameters.

3. Results and Discussion

3.1. Lithium Mother Source Study

The lithium mother liquor (Li2CO3) was first analyzed to understand its composition, purity, and water content. Titration is still one of the most popular and oldest methods for determining the purity of chemical components. The titration results of the different samples showed a purity of 96–97%.
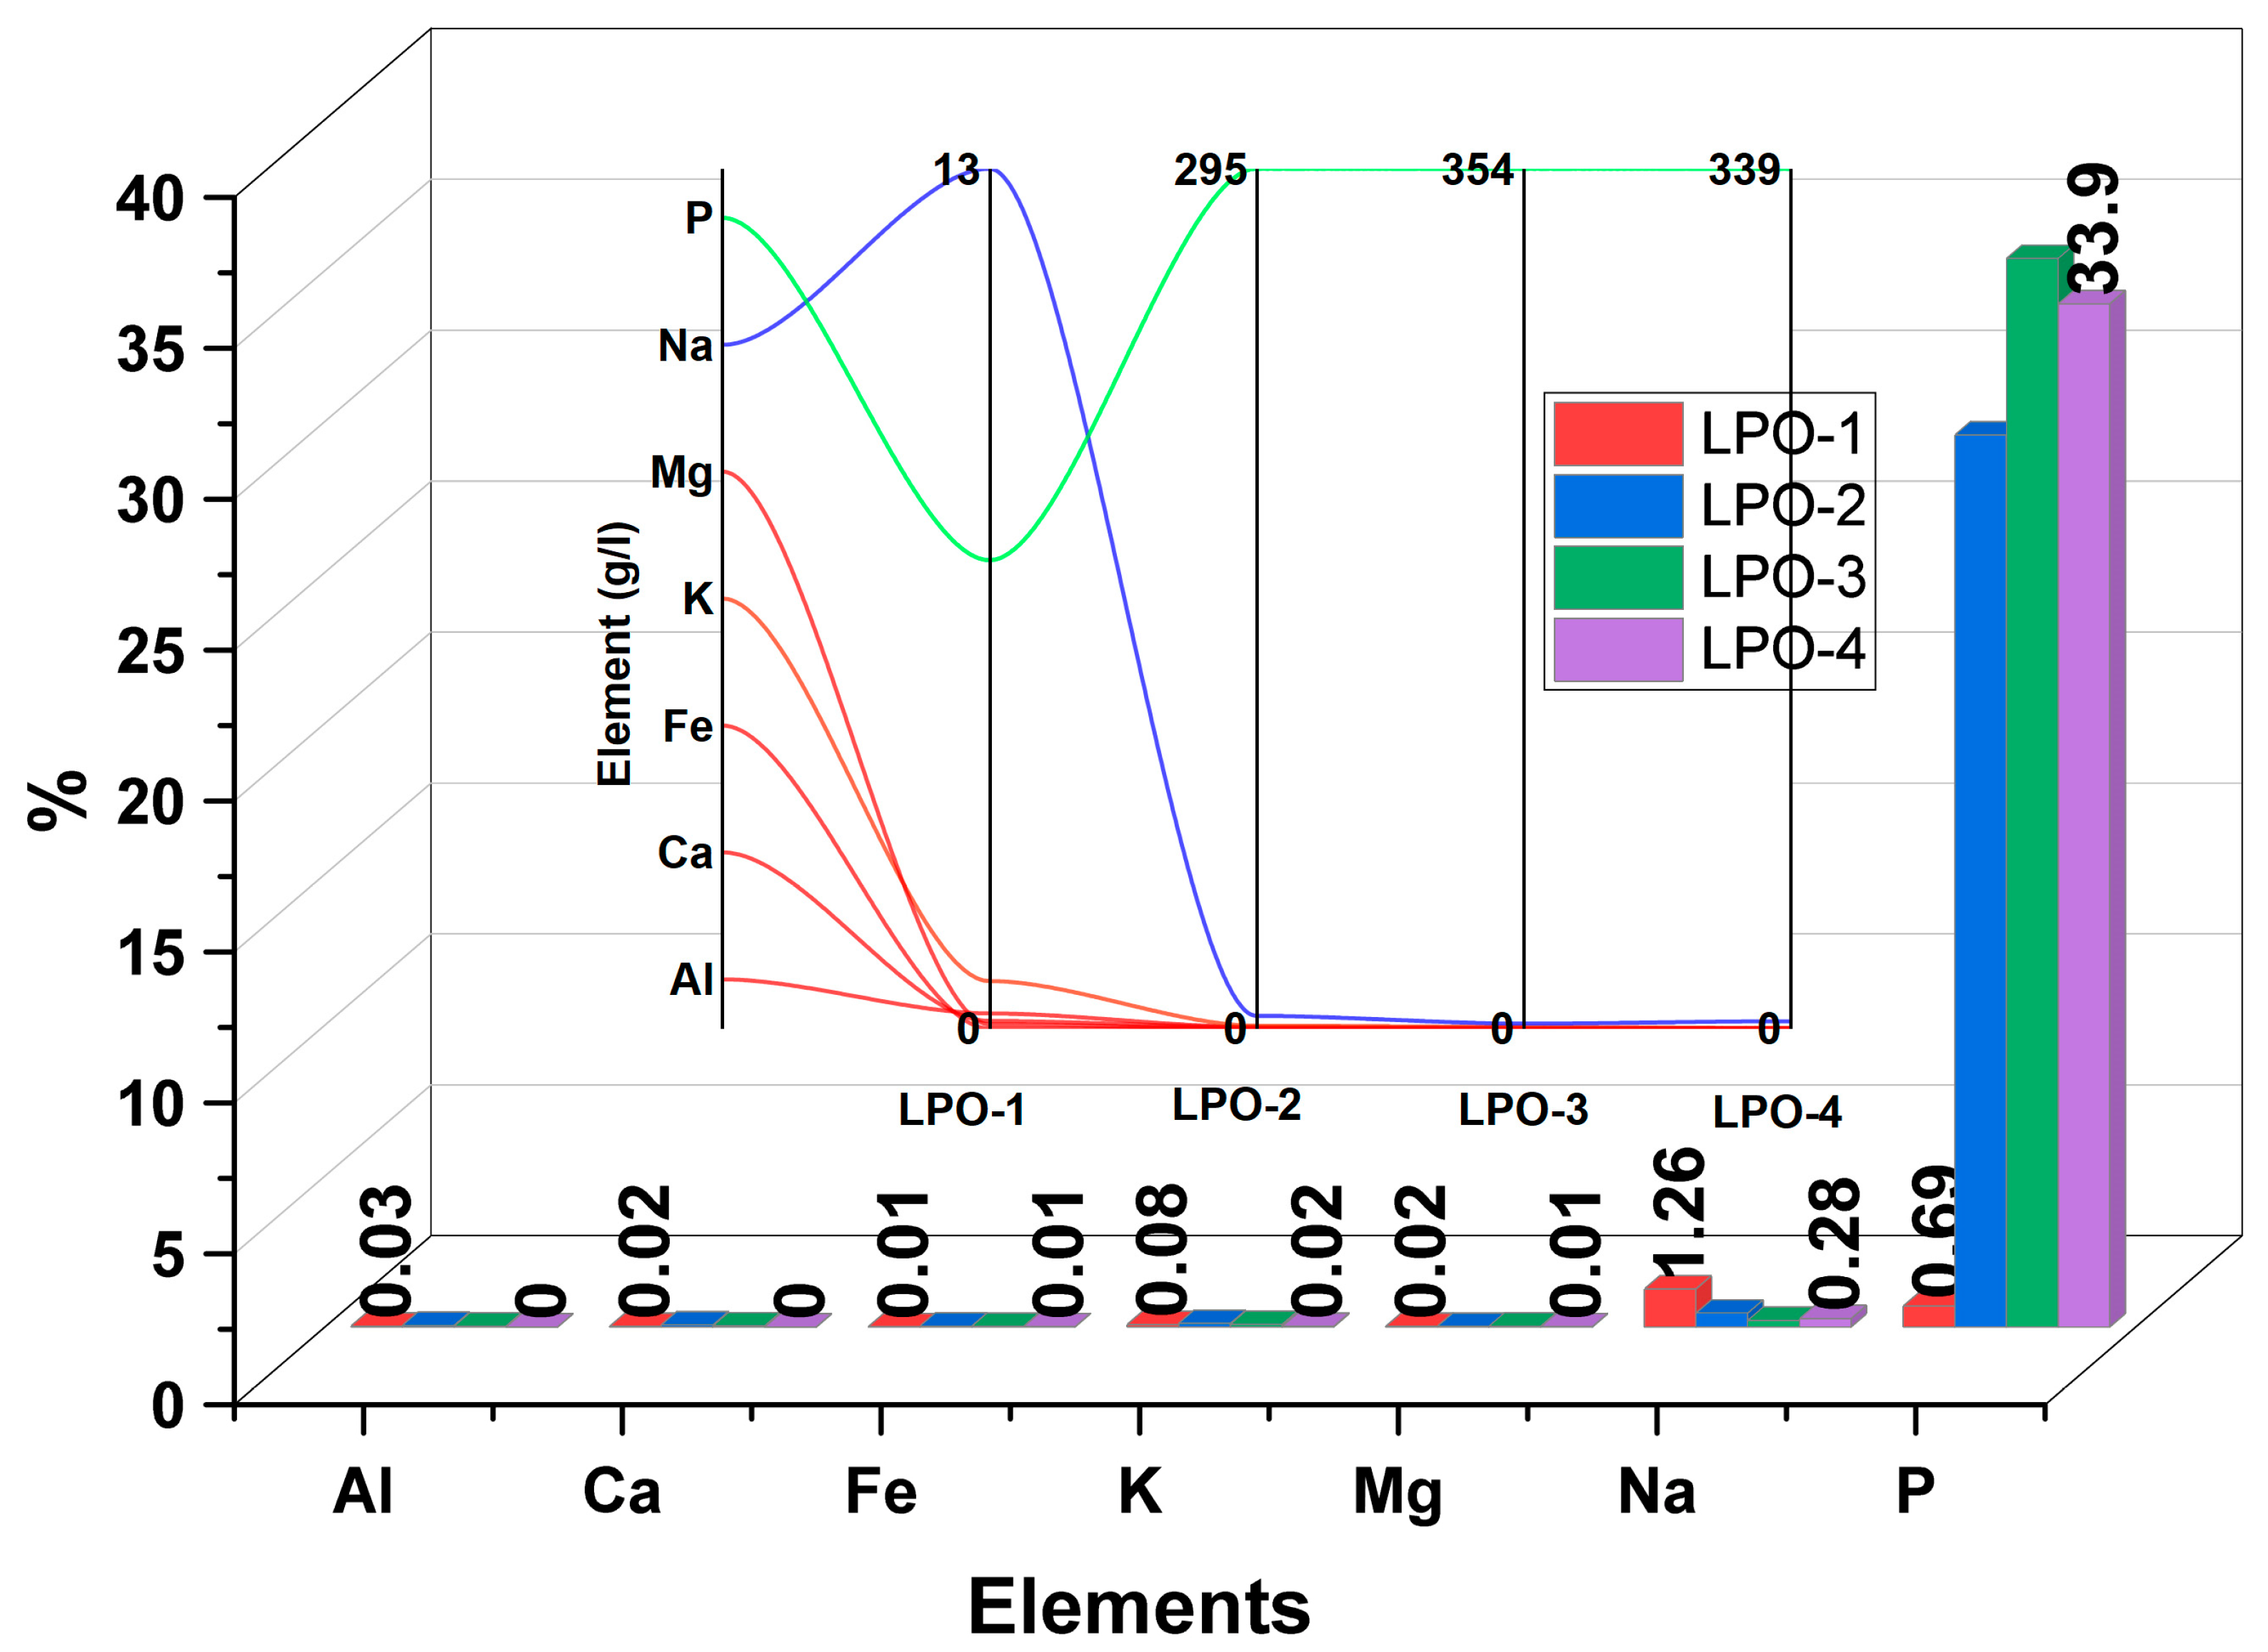
Inductively coupled plasma mass spectroscopy indicates the presence of lithium and other impurities that were further removed during the treatment, as shown in Figure 3. The percentage and the concentration of each element were calculated using Equations (1) and (2), respectively, as presented in Table 3. The water content of lithium phosphate was calculated using Equation (3), as shown in Table 4.
% e l e m e n t = C · V 1 m L 2 C O 3 ·   V 2 V · 0.0001
o n c e n t r a t o n   e l e m e n t   ( g / L ) = ( C · V 1 m L 2 C O 3 ·   V 2 V ) / ( 1000 )
where, V1 = 100 mL, V2 = 100 mL, V = 2 mL, mLi2CO3 = 0.507 g, and C (mg/L): concentration from ICP.
% Water content = [(A + B) − (C)]/B

3.2. Impurities Removal Process and Their Distribution in Synthesized Samples

The preparation of lithium phosphate by co-precipitation of lithium carbonate (Li2CO3) and trisodium phosphate dodecahydrate (Na3PO4*12H2O) has attracted great interest (simple and inexpensive). However, the challenge is the presence of some impurities that need to be removed or reduced to minimize their effects in the synthesized sample. As described in the previous section, these different steps cannot definitively remove some impurities. As can be seen in Figure 4, there were still traces of impurities in varying amounts in the samples due to the preparation conditions and severity. Since sodium is difficult to control, it was reduced from 1.26% in the first sample (LPO-1) to 0.28% in LPO-4 (only this sample was used to study ionic conductivity). Other impurities such as Al (0.03–0%), Ca (0.02–0%), Fe (0.01%), K (0.08–0.02) and Mg (0.02–0.01) were significantly reduced or eliminated. This performance in removing impurities was related to various factors, such as stirring of the solution, pH, amount of HCl, NaOH, and EDTA, as described in the “Experiment” section.

3.3. Surfaces, Pore Distribution, and Isotherm (N2) Analysis

As can be seen from Table 5, the BET surface area (9.0293 m2g−1) is significantly lower than the Langmuir surface area (28.1896 m2g−1). This is because the BET method considers multilayer adsorption and provides a more conservative estimate compared to the Langmuir method, which assumes single-layer adsorption. The higher Langmuir value indicates that the sample has a significant amount of fine surface features that provide additional adsorption sites. On the other hand, the BET surface area (9.0293 m2g−1) is lower than the external t-plot surface area (19.6989 m2g−1). This is because BET measures the total accessible surface area, including contributions from micropores and mesopores, while the external t-plot surface area focuses on the surface area without micropores, suggesting that the sample has significant mesoporous and microporous structure. However, when the Langmuir and t-plot surface areas are compared, it is found that the Langmuir surface area is larger than the t-plot surface area. The Langmuir method tends to overestimate the surface area as it only takes into account the adsorption of single layers at all available sites, whereas the t-plot method provides a more realistic measure of the surface area accessible to larger molecules, excluding micropores.
The differences in these surface area measurements indicate the complex pore structure of the lithium phosphate sample. A higher Langmuir surface area indicates many fine pores, while a significant external t-plot surface area indicates a substantial contribution from larger mesopores and macropores. This balance is critical to understanding the material’s potential applications in solid electrolytes, where both large surface area and appropriate pore sizes are important for ionic conductivity and structural integrity. The average BET adsorption pore width (size) indicates a predominance of mesopores with an average width of 10.08 nm.
Figure 5a shows the isothermal N2 adsorption–desorption curve of the LPO-4 sample. The adsorption–desorption curve has characteristics similar to those of type IV, according to IUPAC rules [23]. The hysteresis loop appears above p/p0 = 0.057, which represents a low-pressure point in the adsorption isotherm where mesoporous materials exhibit initial multilayer adsorption. The virtual absence of micropores is also observed.
Figure 5b shows the particle size distributions as a function of the pore volume of LPO-4. From the observations in the figure and the table, the density of the small particles below 5 nm is important at a moderate pore volume compared to the particles above 10 nm. The 10 nm particles have a large pore volume, which increases the free ion transport and improves the sample’s electrochemical performance.

3.4. Crystallography Analysis

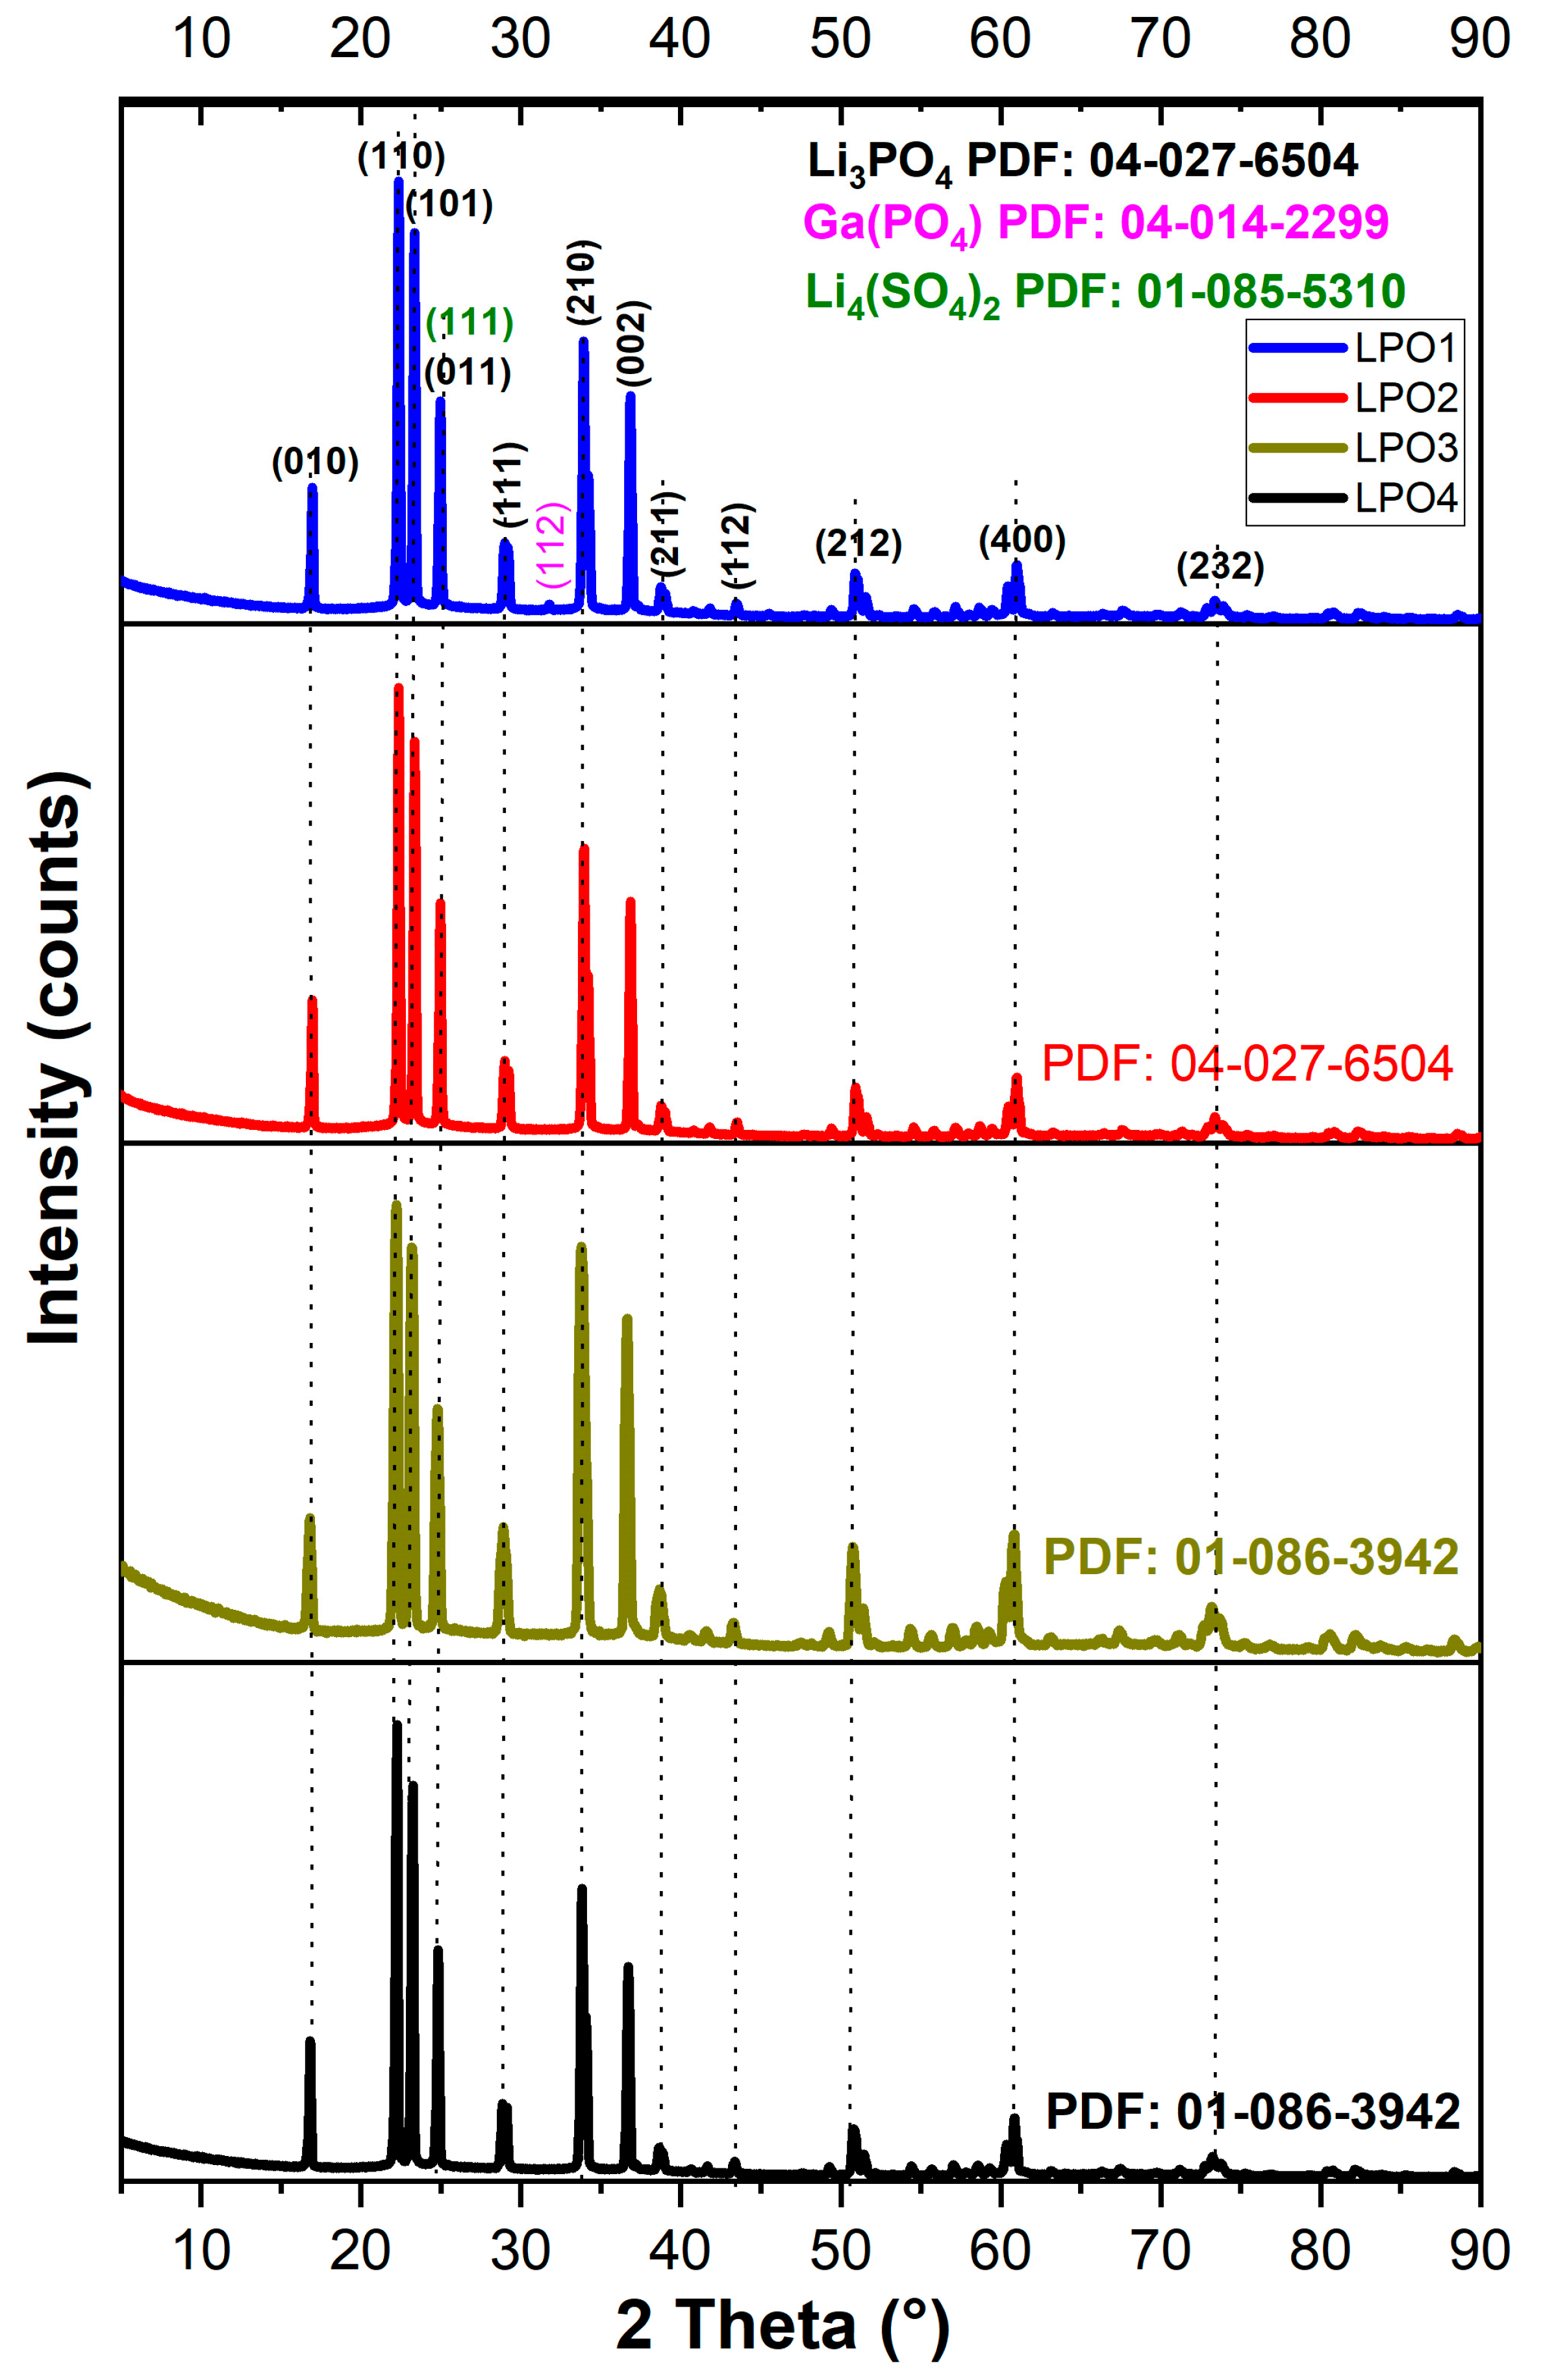
The precipitation method is still available and simple to form a wide range of lithium phosphate structures and well-crystalline materials. In addition, the stochiometric conditions, solution dissolution, stirring, time, and temperature of the preparation must be strict to ensure a good particle size distribution. Figure 6 shows the XRD patterns of the synthesized samples performed in the MDI Jade V9.1 software using WPF and the Rietveld refinement method. LPO-2, LPO-3, and LPO-4 spectrums reveal a single phase of Li3PO4, which agrees well with the patterns of lithium phosphate structure corresponding to the orthorhombic crystal system with space group Pmn21 (31) (PDF of 04-027-6504 and 01-086-3942) [10,24]. In all samples, the diffraction peaks appeared at close positions of 16.9, 22.32, 23.37, 24.98, 28.99, 36.99, 38.78, 43.64, 51.06, 60.08, 60.51, 73.58°, corresponding to the reflections (010), (110), (101), (011), (111), (002), (211), (112), (212), (222), (400), and (232) planes. However, the spectrum of LPO-1 shows lithium phosphate as the main phase and two other phases of gallium phosphate (Ga(PO4)) with a weak intensity peak of 2θ ≈ 31.77° and Li4(SO4)2 with a peak of 2θ ≈ 25.86°, corresponding to the reflections (112) and (111) planes, (PDF: 04-014-2299 and 01-085-5310) [25,26]. The formation of the Ga(PO4) phase of 0.1% probably comes from other reagents used in the process, while the formation of 0.2% Li4(SO4)2 phase may attributed to the lithium reach and the synthesis conditions as presented in the experience and XPS analysis sections. As shown in Table 6, the calculations of the XRD data revealed the amount and the lattice constants of the individual phases formed in the different samples. The LPO-2, LPO-3, and LPO-4 samples showed a single phase (100%) of β-Li3PO4, as shown in Figure 7 (left).

3.5. Morphology and Impurities Distribution Analysis (SEM-EDS and ICP-OES)

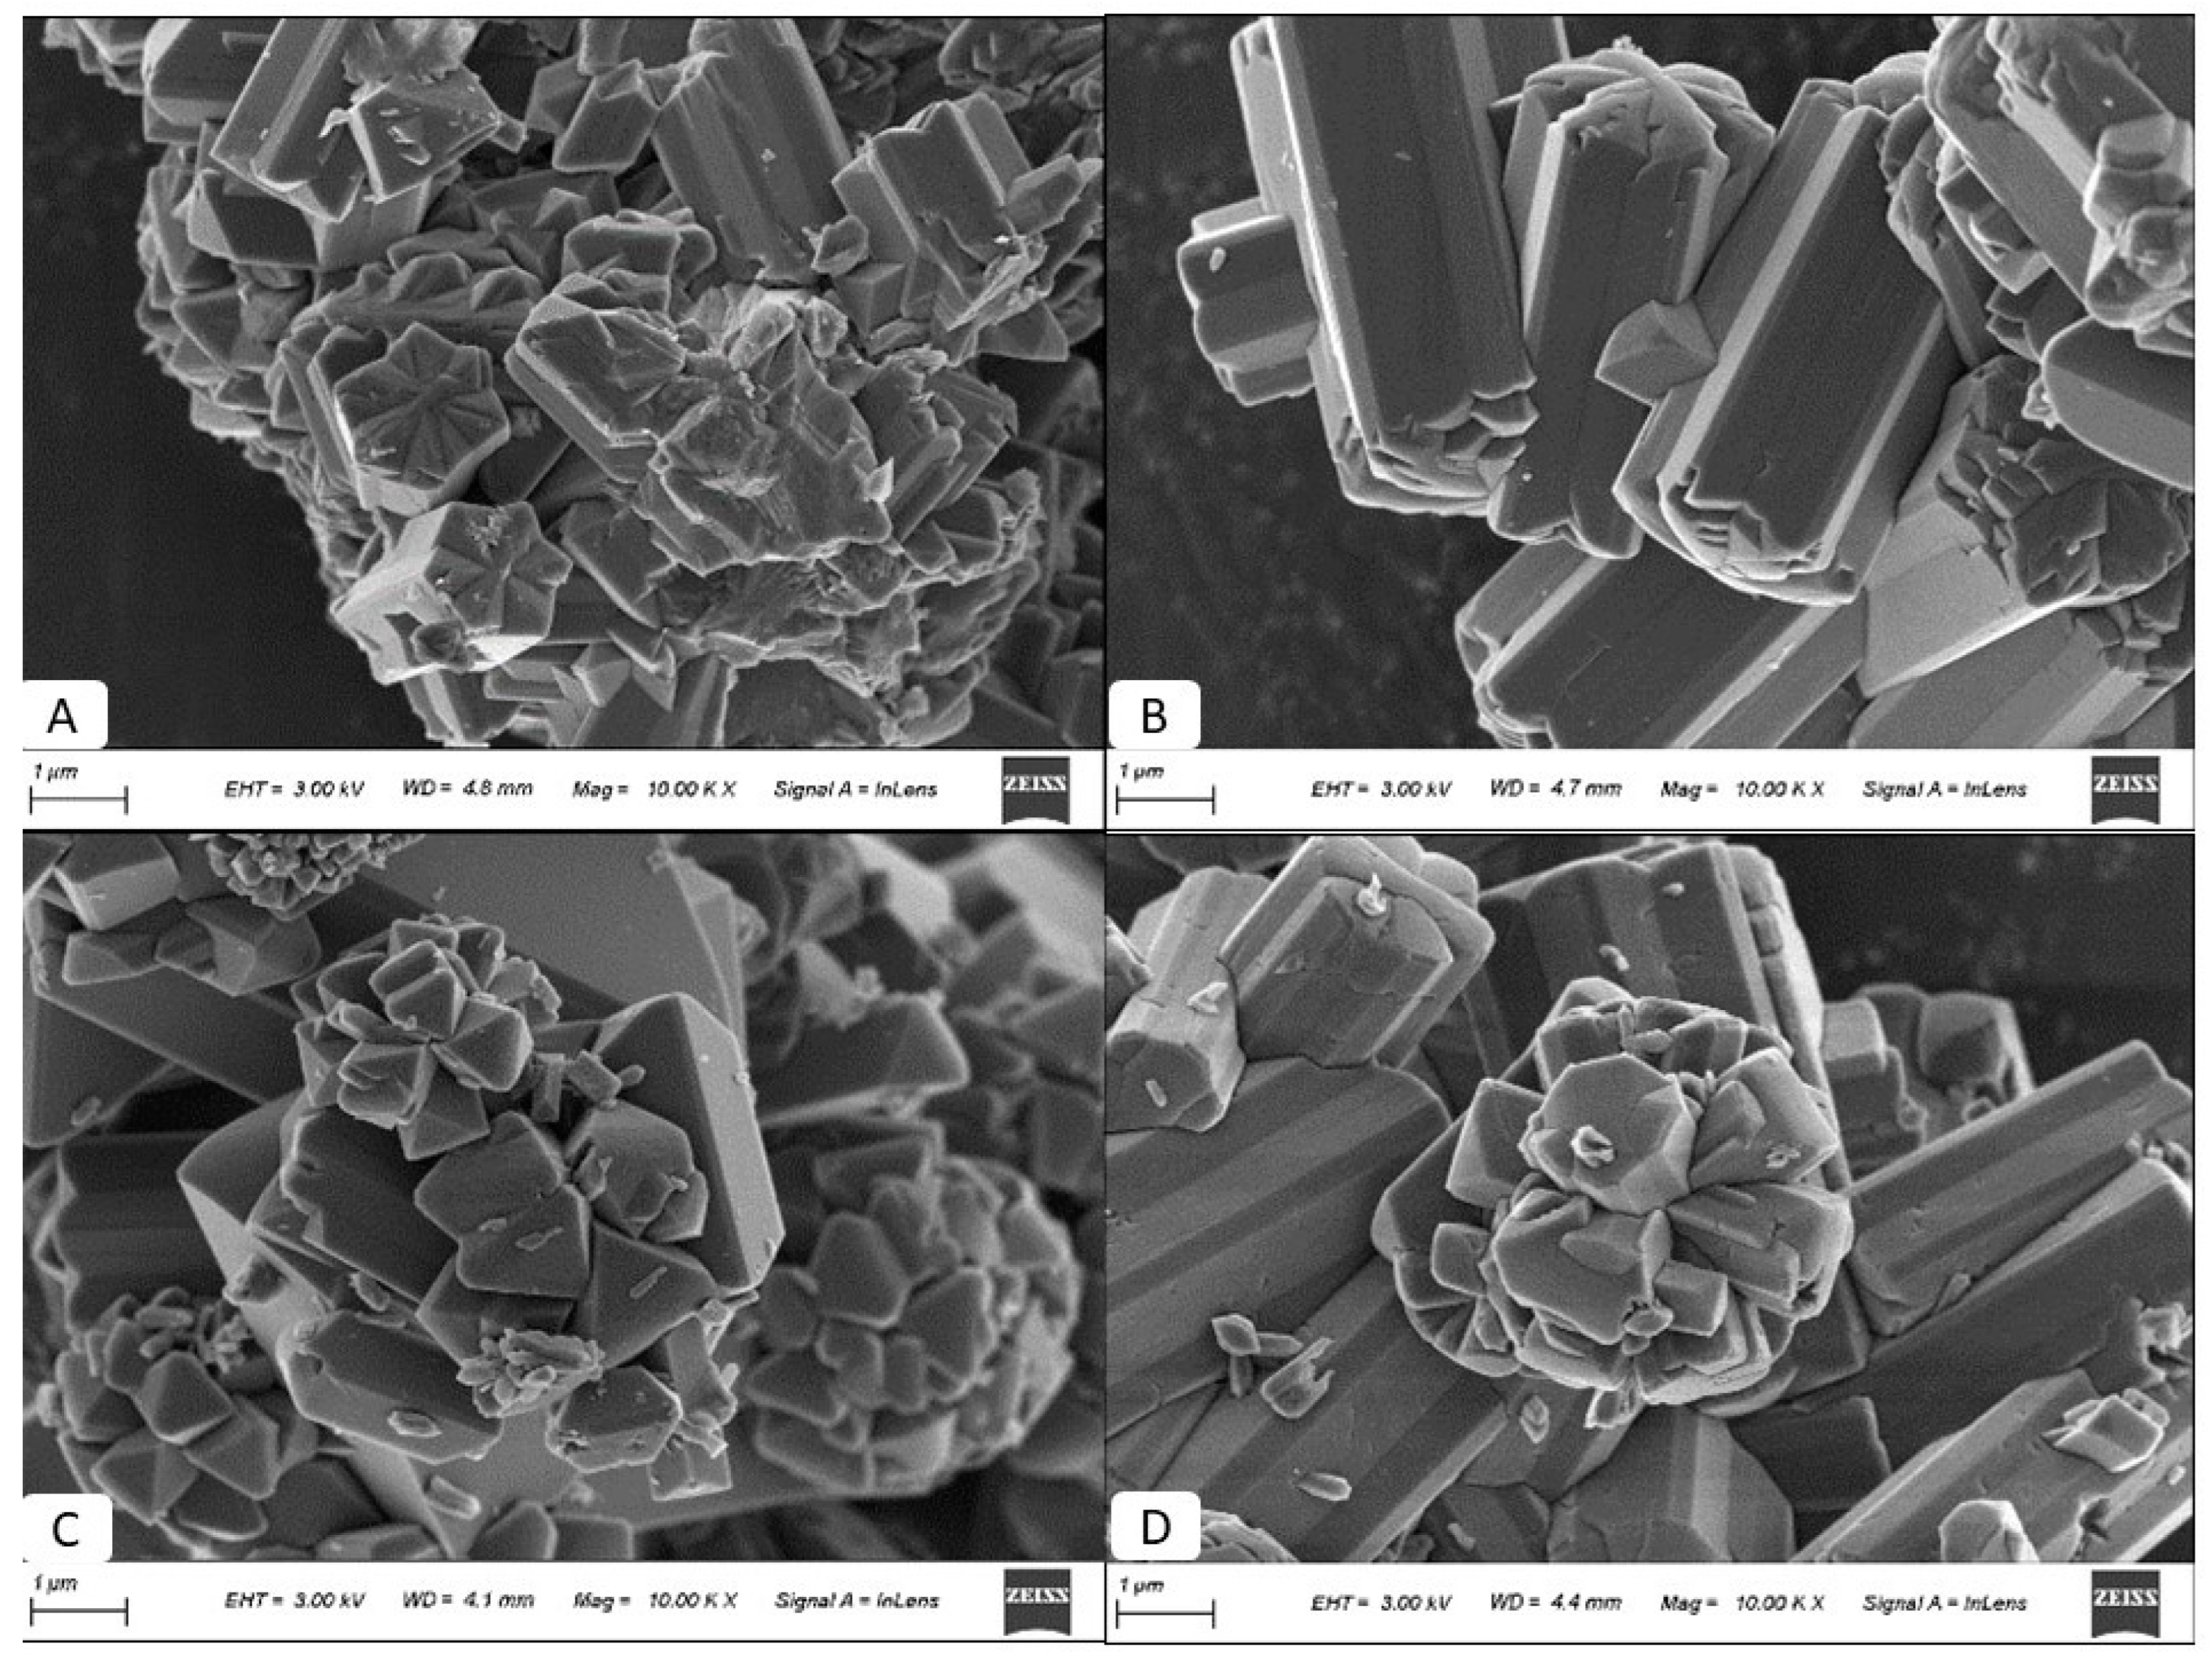
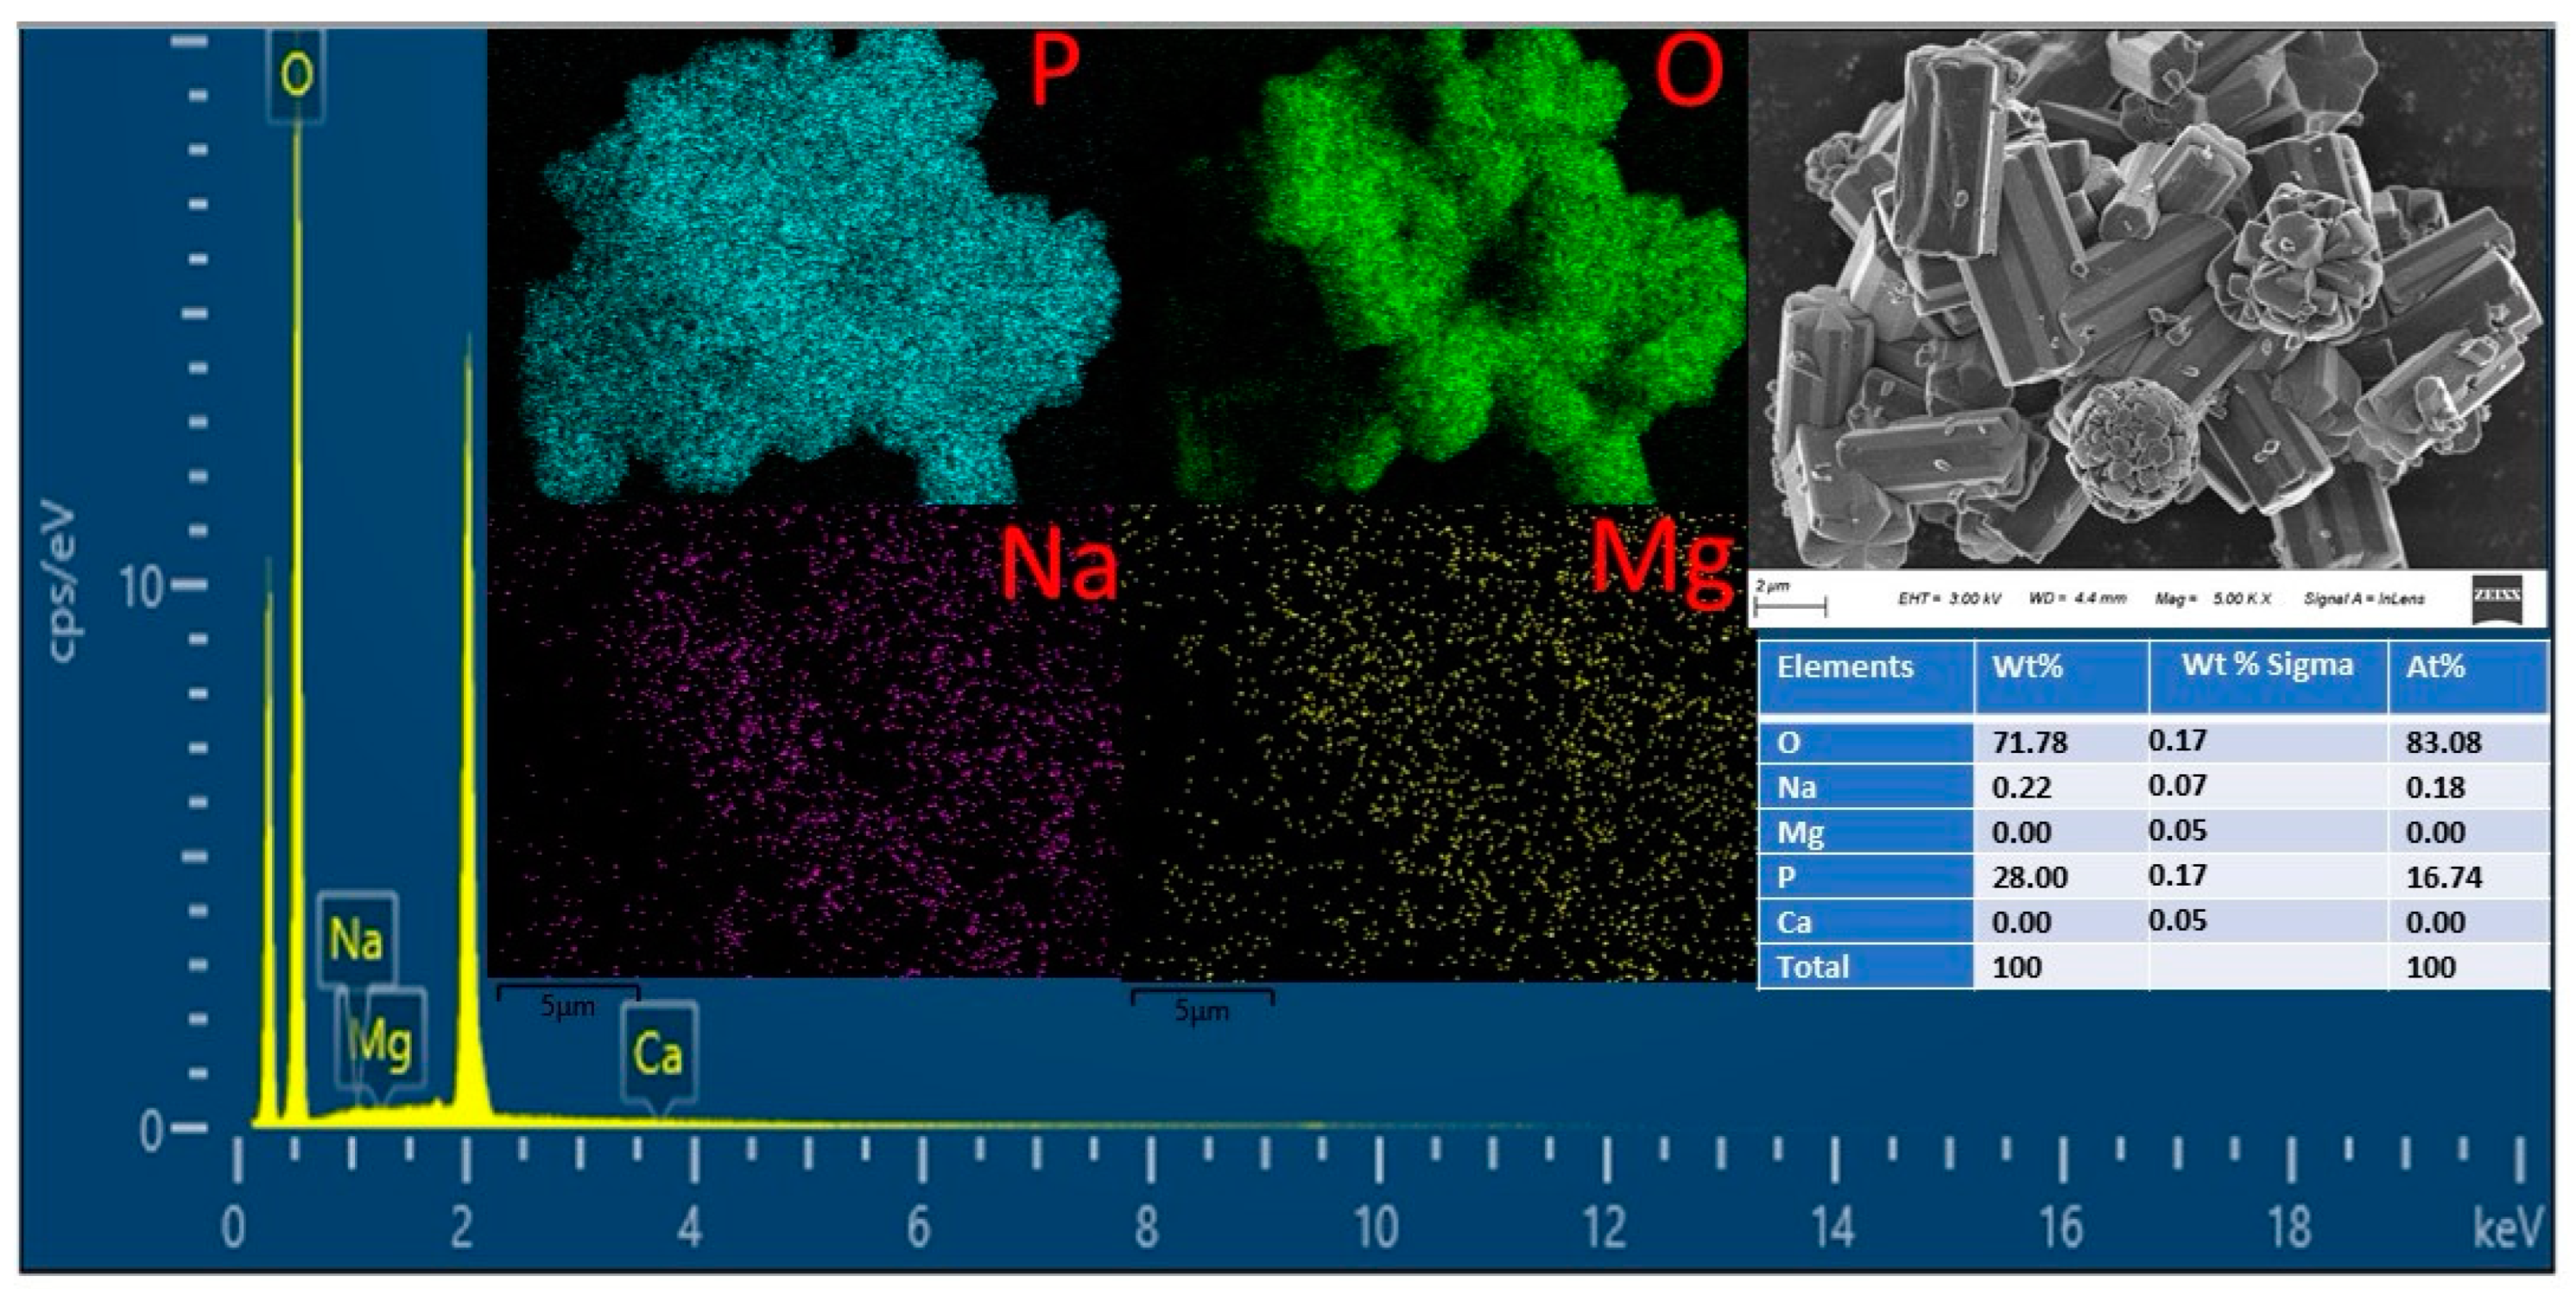
Figure 8 shows the SEM images of samples LPO-1, LPO-2, LPO3, and LPO-4, which were prepared from lithium carbonate and trisodium phosphate dodecahydrate at different pH values and temperatures. All samples exhibited irregular (rectangular) nanotube shapes. A comparison of the observations revealed that the particle shapes of LPO-1 (pH = 12) may be due to an incomplete reaction during production. LPO-2 (pH = 12.5), LPO-3 (pH = 13), and LPO-4 (pH = 13) exhibited complete particle shapes with spherical, cross-linked small particles, with average small particle sizes increasing between 2–100 nm. In the bulk of the samples, LPO-4 showed high purity with a trace of the element sodium (0.28–0.22%, 2.88 g/L), confirmed by coupled plasma mass spectroscopy (ICP) and energy dispersive X-ray spectroscopy (EDS) analysis, as shown in Figure 4 and Figure 9, respectively.

3.6. X-Ray Photoelectron Analysis

The X-ray photoelectron (XPS) analysis was investigated to determine the main elements bending energies, their atomic concentration, and ratio in the material. XPS is known to be a powerful technique that can provide a surface analysis with specific information about bonding between atoms and their oxidation in the material.
Table 7 shows the elemental states of lithium, phosphate, and oxygen and their atomic compositions, which were analyzed using X-ray photoelectron spectroscopy (XPS). In both samples, the atomic ratios of Li/P and O/P were close to the stoichiometric values of 3 and 4, respectively. These slight deviations from the stoichiometric values could be due to the slight excess of lithium and oxygen atoms compared to the ideal ratios. The bending energy values of Li 1s, P 2p, and O 1s of all samples were similar and close, as shown in Table 7. On the other hand, these values are in good agreement with those reported by Tae Yong Kim [1]. The atomic ratio of Na/P of all samples was also calculated to determine the degree of sample purities and understand their impact on the chemical environment as the main impurity. The LPO-4 presents the lowest Na/P ratio of 0.06 against 0.84, 0.66, and 0.52 for LPO-1, LPO-2, and LPO-3, respectively. Because of its lowest Na atomic concentrations (0.67% atomic), LPO-4 was considered as a reference to compare the local electronic environment of C 1s, Li 1s, P 2p, O 1s, and Na 1s species in different samples.
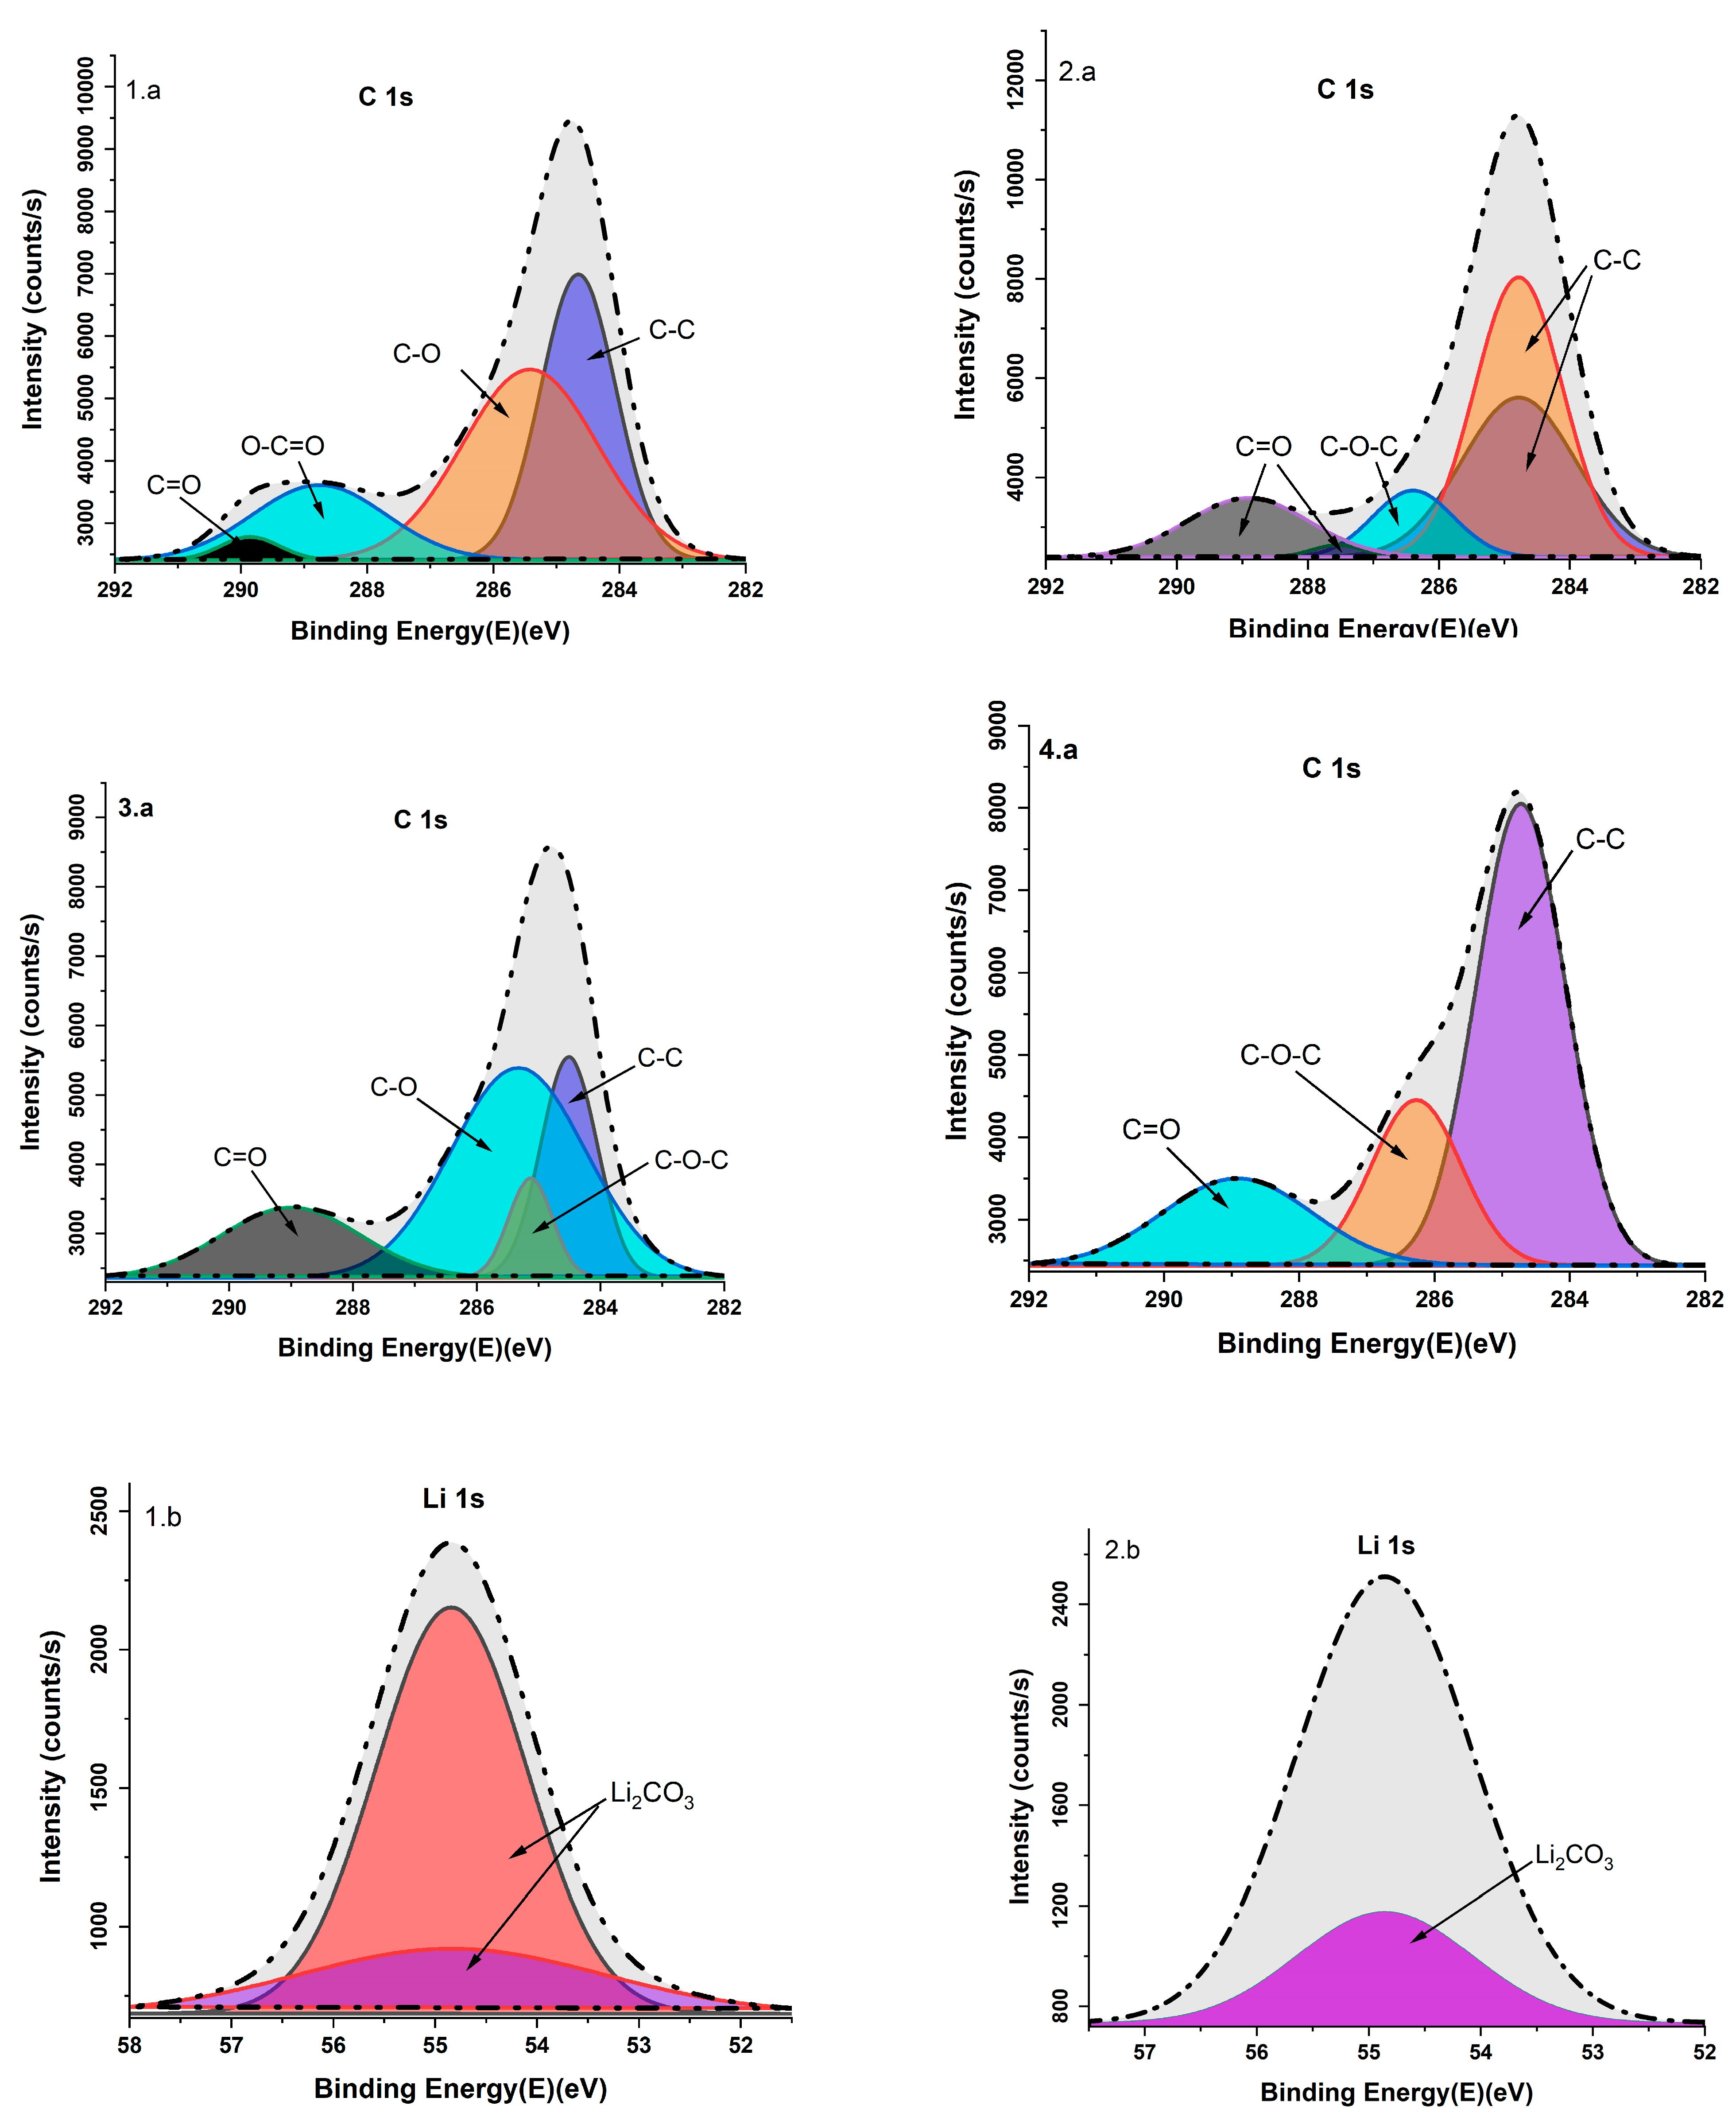
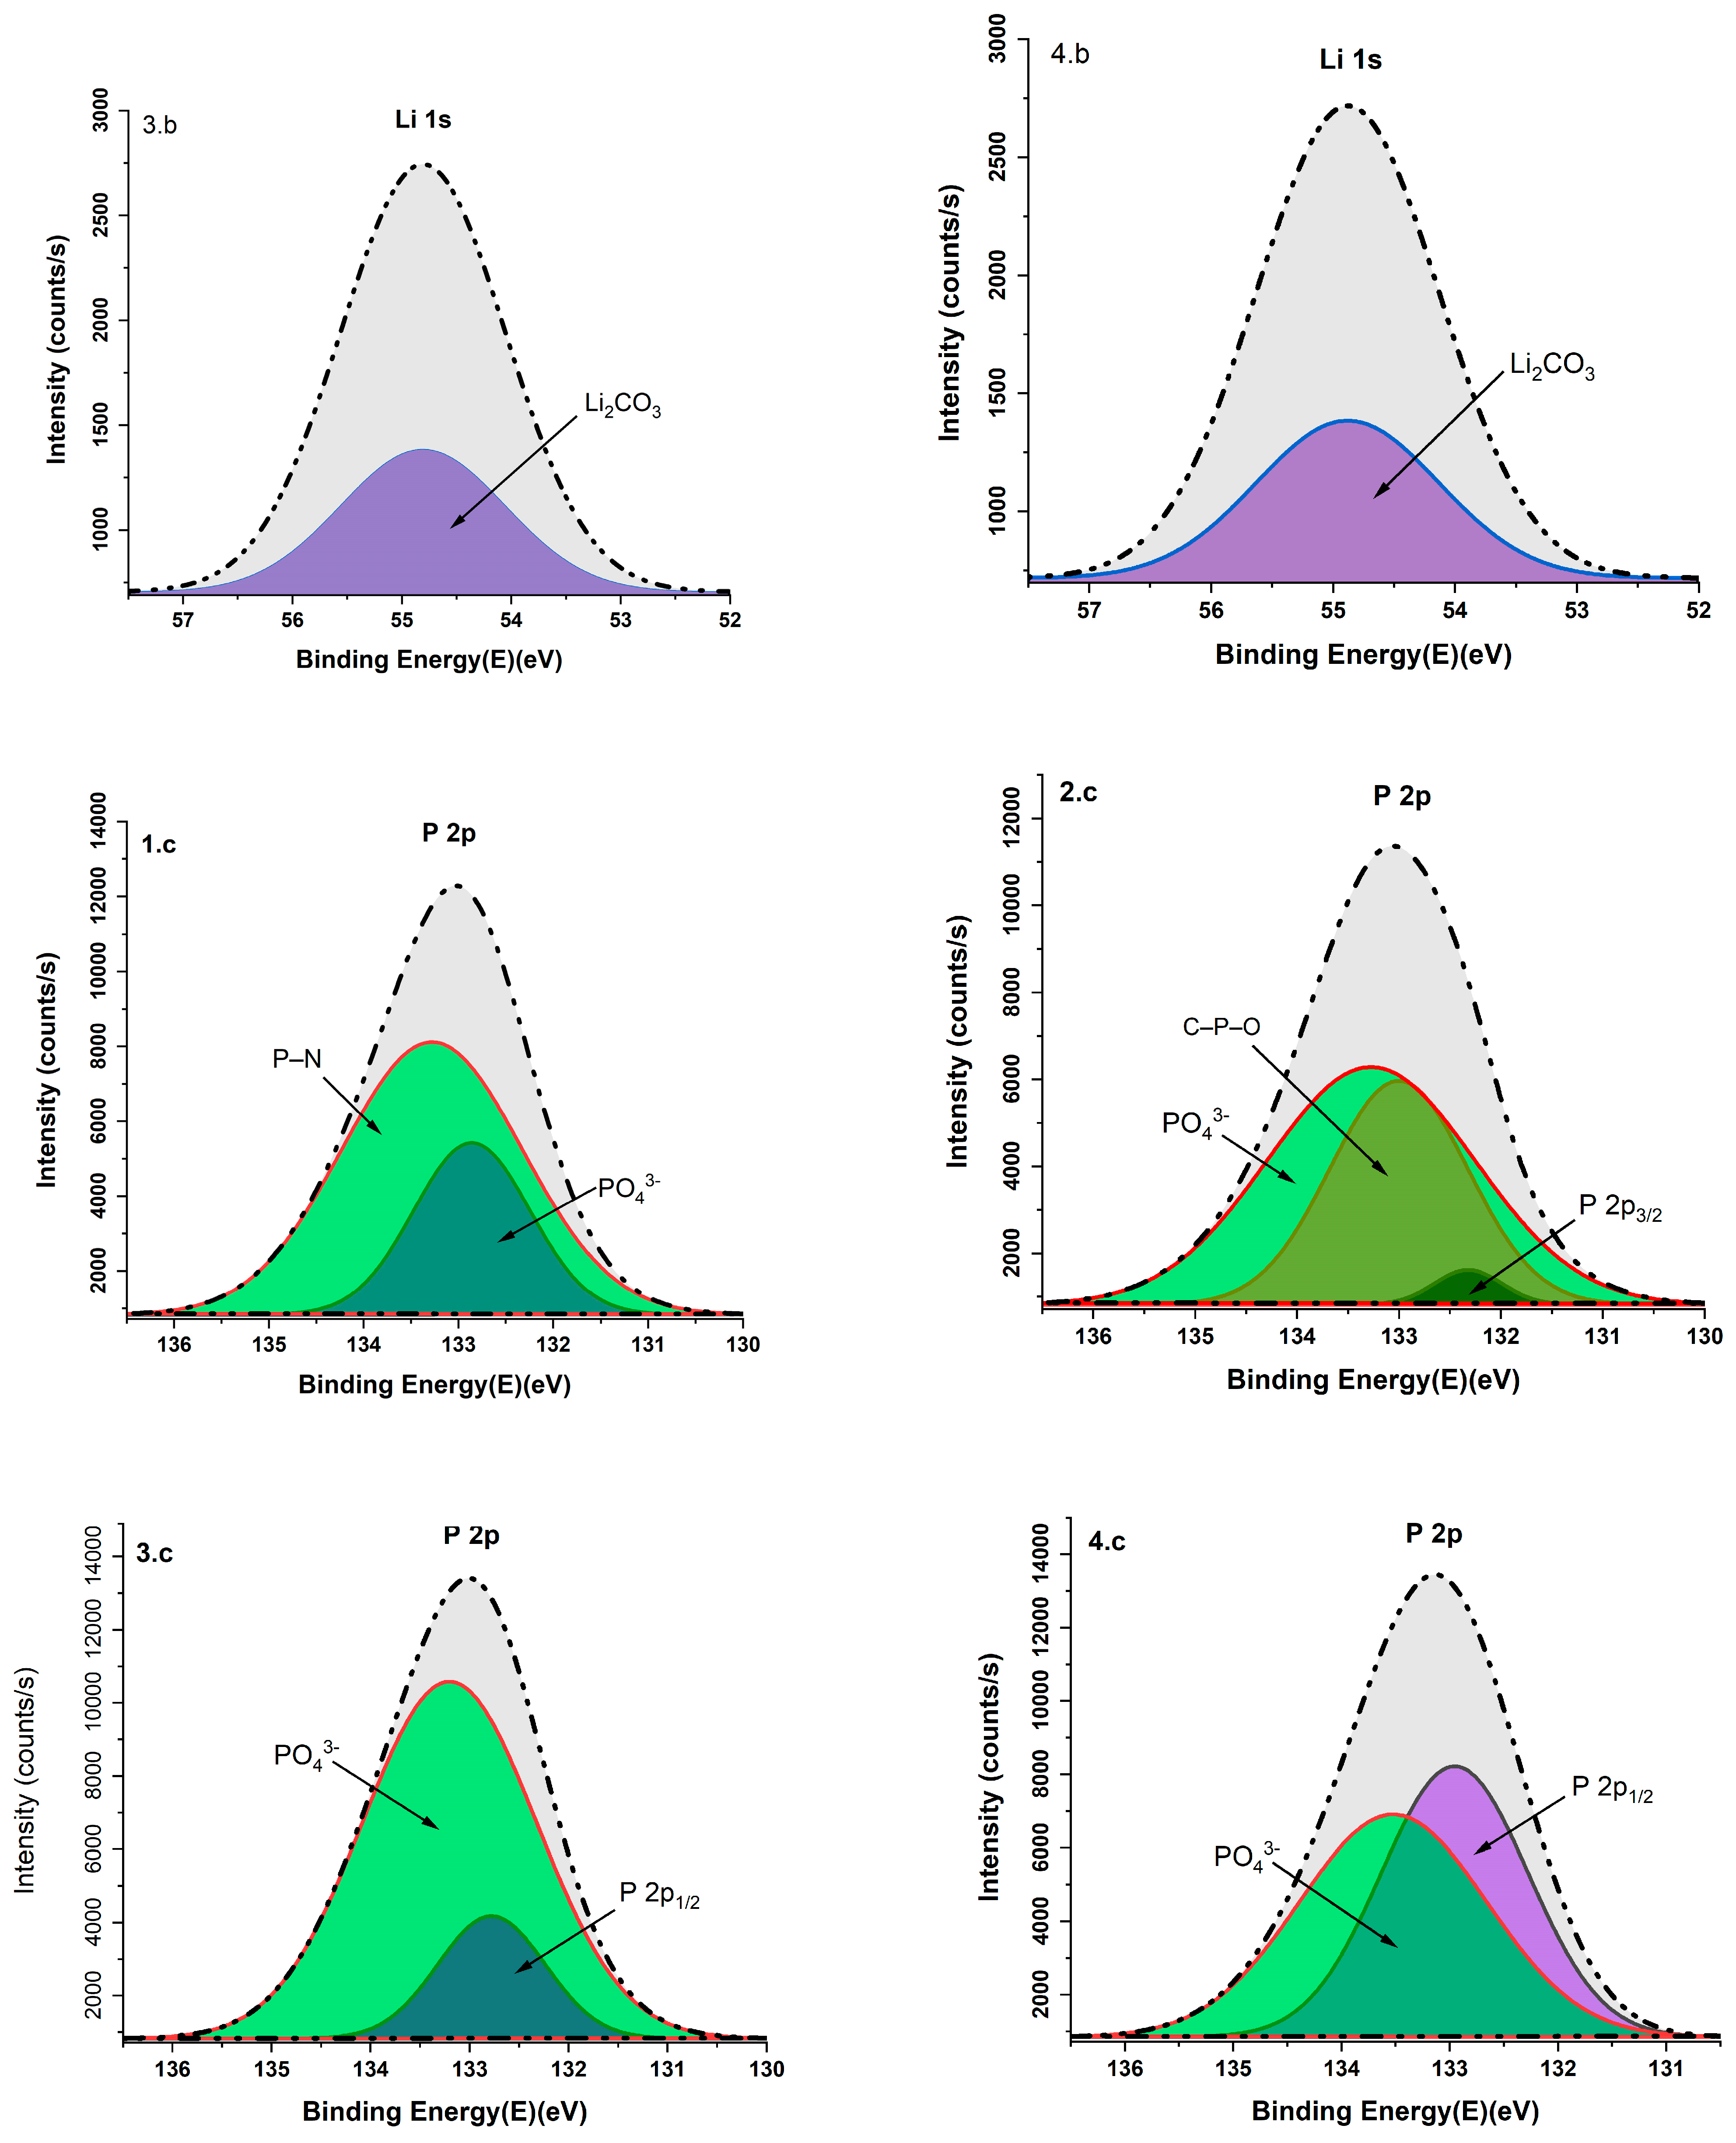
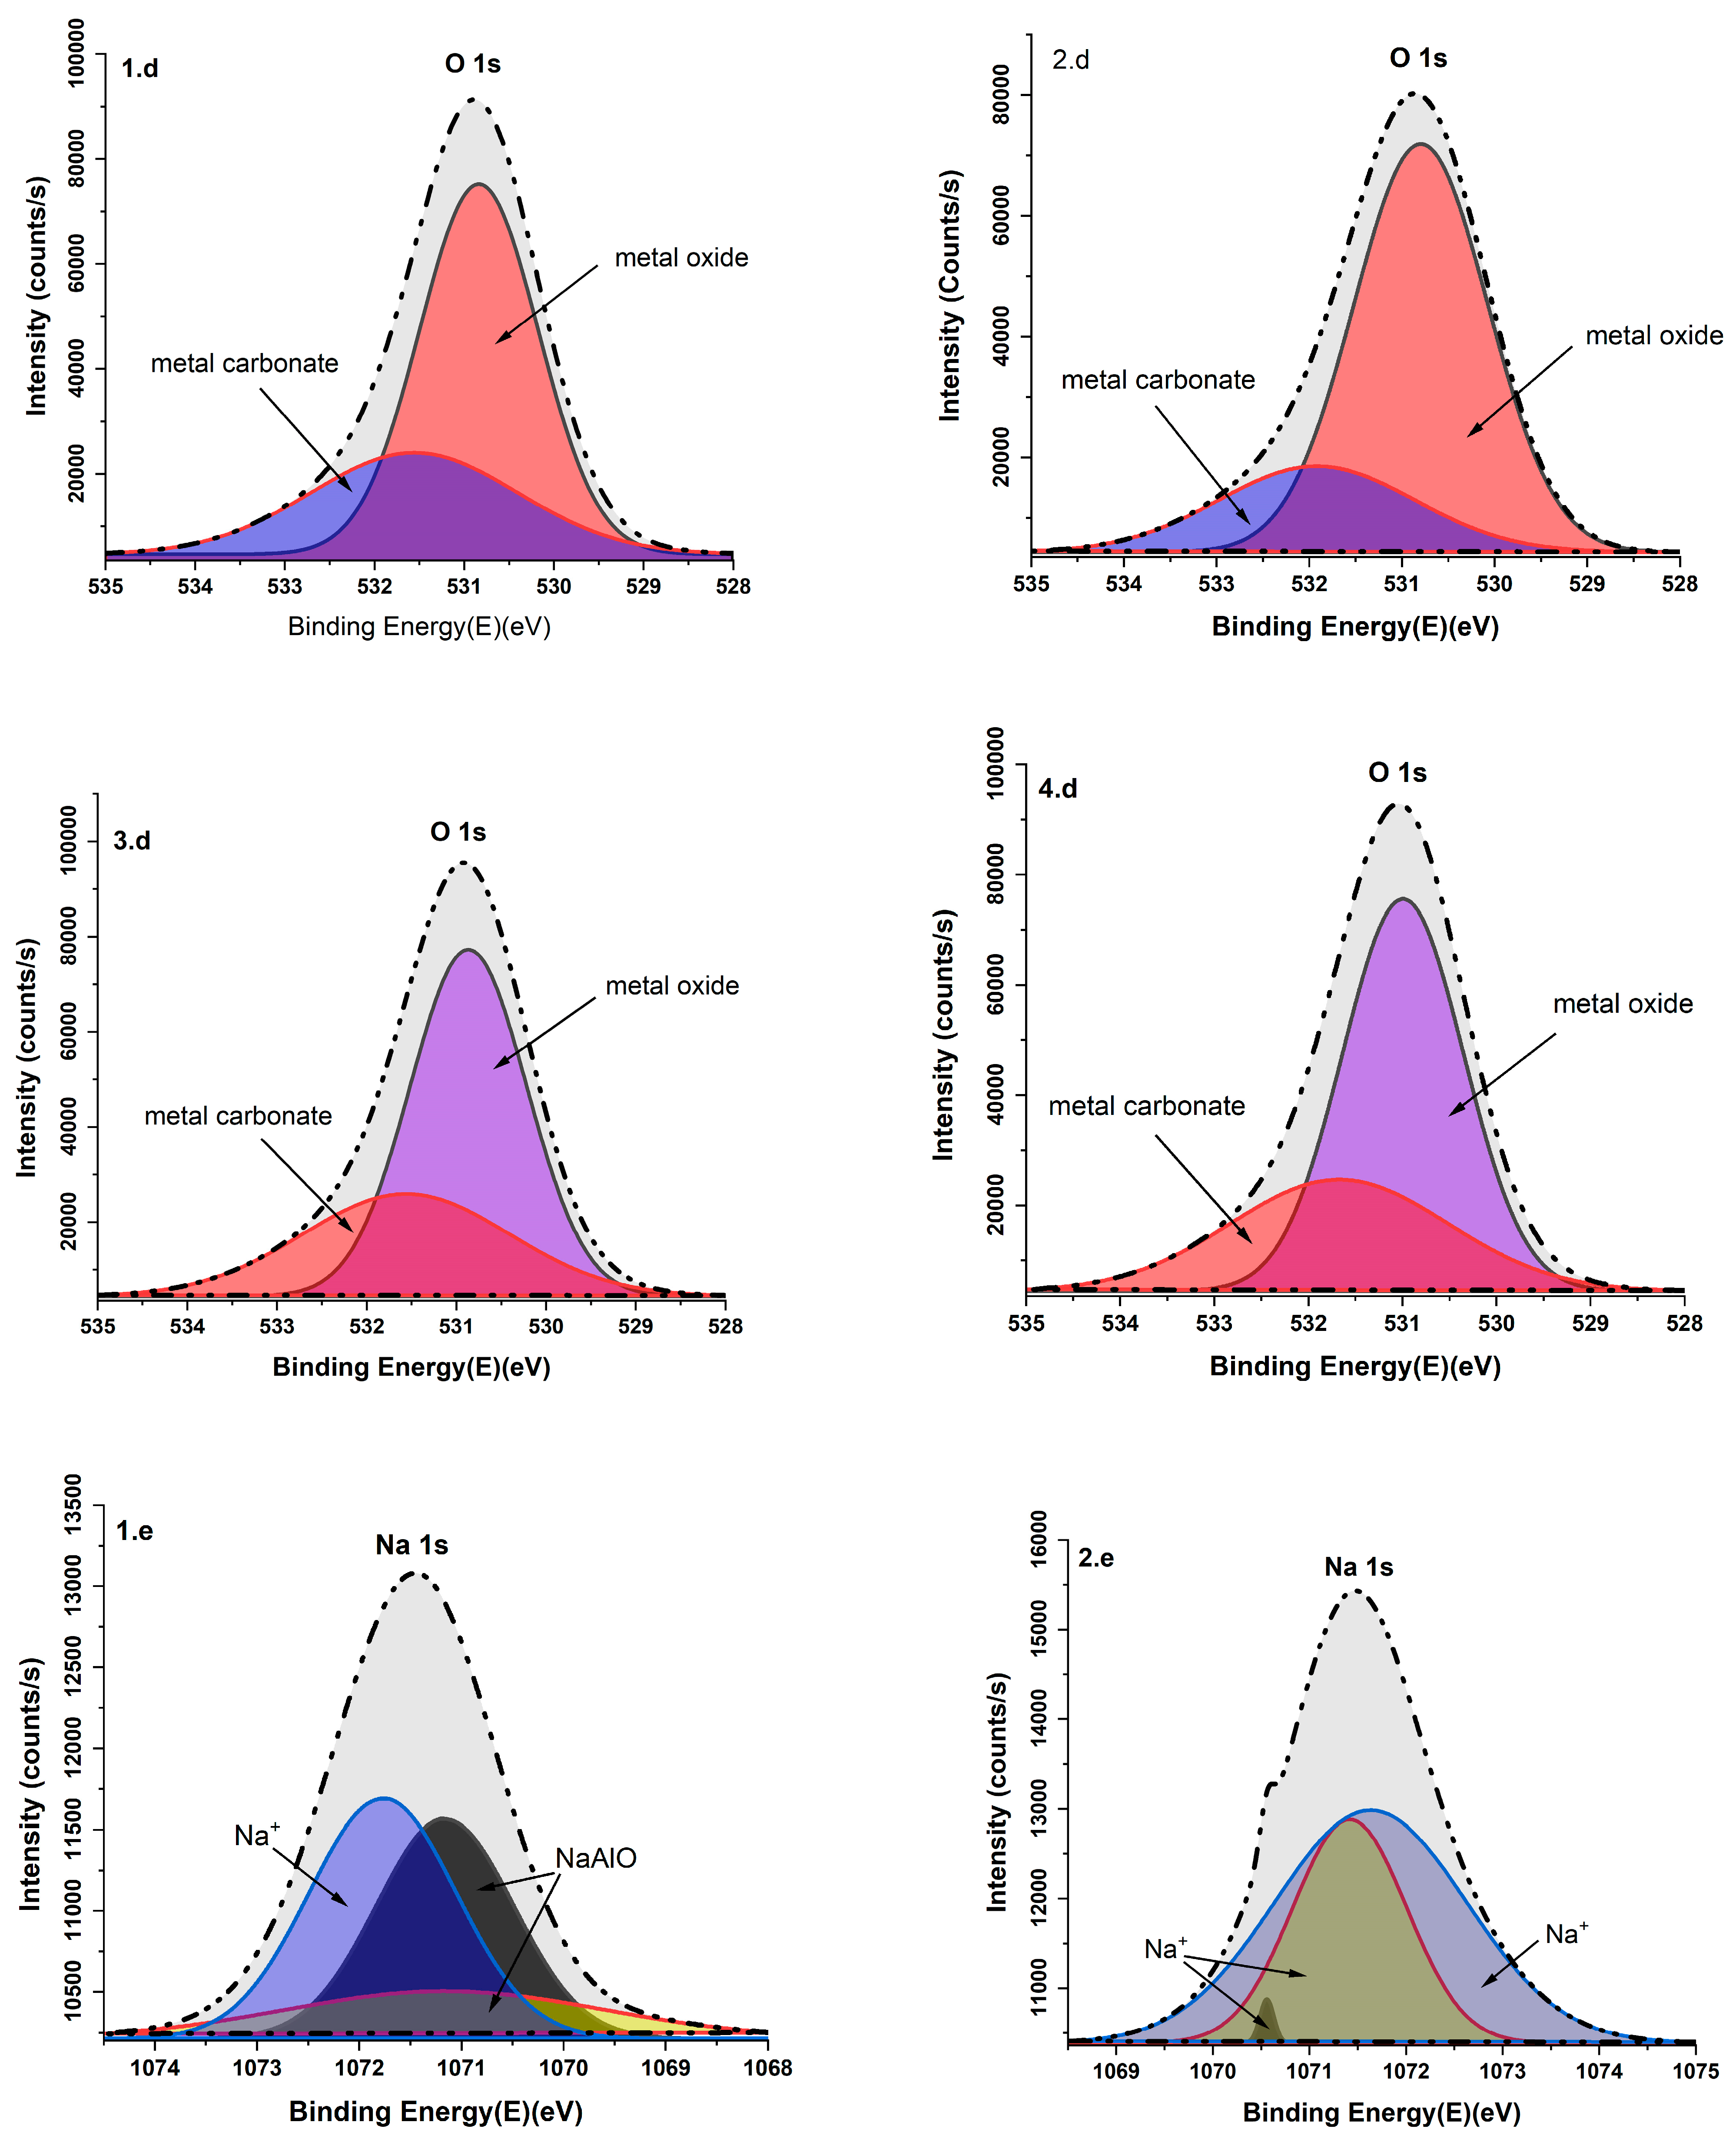
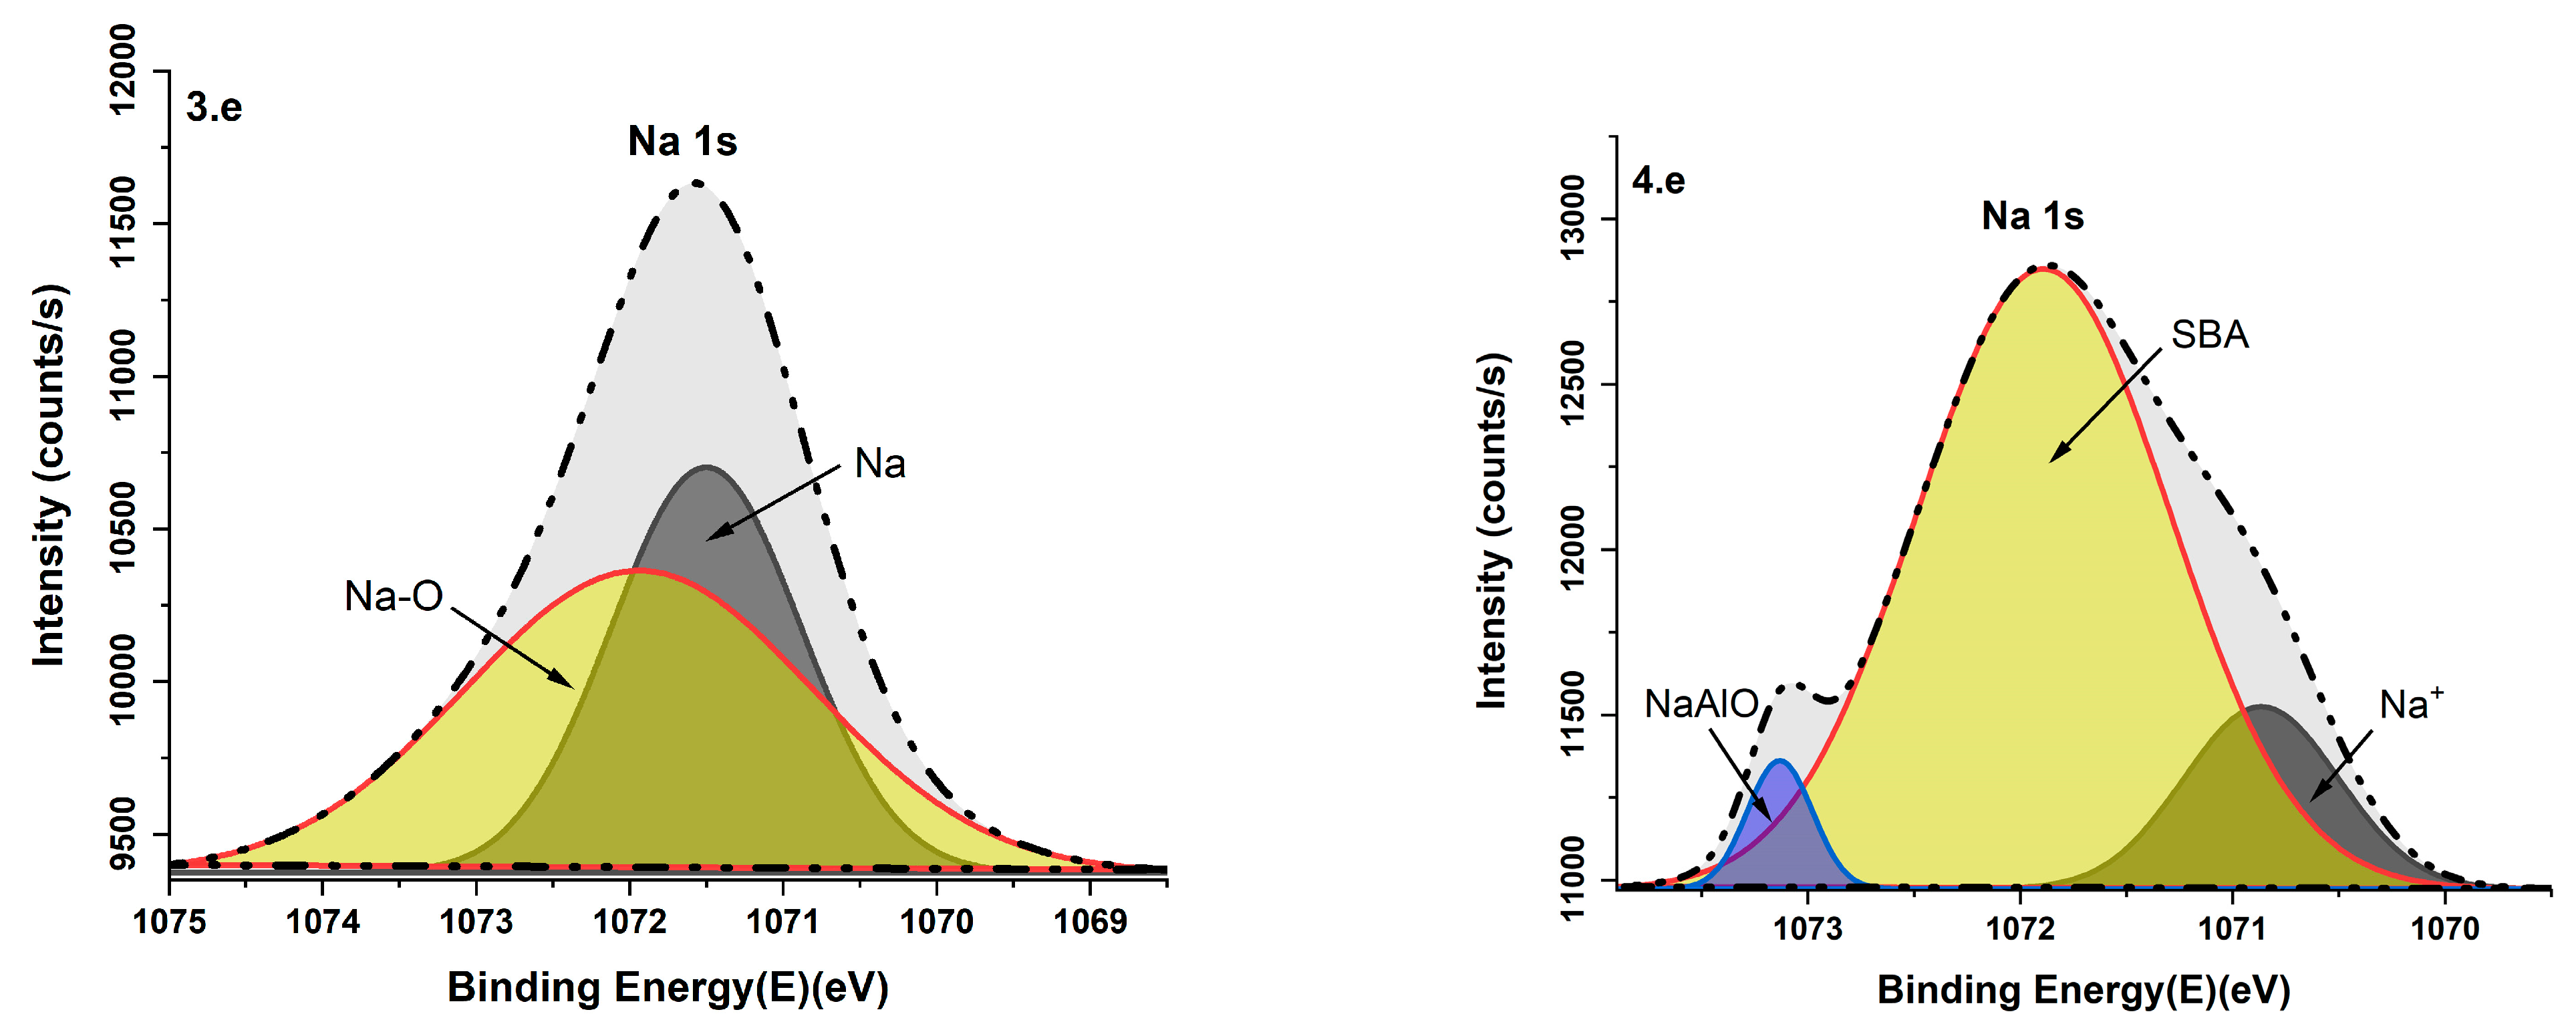
Figure 10 shows C 1s, Li 1s, P 2p, O 1s, and Na 1s spectra, elements, and bending energies (as shown in Table 8) of various samples. For all samples, Li 1s spectra exhibited a major peak at 54.84 eV attributed to Li2CO3, which may originate from the lithium mother liquor source. LPO-1 showed an additional smaller Li2CO3 peak in the Li-1s spectra at the same position as the first peak. Observation shows that the intensity of the main peak of Li2CO3 decreases from LPO1 to LPO-4, indicating the decrease in its concentration due to the stoichiometric approach to the ideal values (Li/P).
The P 2p peaks of PO43- were identified in all samples with slight shifts at 133.2 eV for LPO-4/LPO-2 and at 132.85 eV and 133.5 eV for LPO-1 and 3, respectively. The P 2p spectra of LPO-1 showed a peak at 133.27 eV, which was assigned to the P-N species. The P 2p spectra showed a peak of the P 2p1/2 species at 132.77 and 132.95 eV for LPO-4 and 3, respectively. The additional LPO-2 P 2p peaks identified at 133.00 eV and 132.32 eV were assigned to C–P–O and P 2p3/2, respectively. However, the surface areas and intensities of the O 1s peaks were similar for all samples, with a slight shift. The peaks at 530.86 and 531.56 eV correspond to metal oxide (possibly Li2O) and metal carbonate, respectively.
The C 1s XPS core spectra showed peaks with slight shifts attributable to C-C bonds at 284.65, 284.77, 284.50, and 284.72 eV in LPO-1, 2, 3, and 4, respectively. Additional peaks of 286.39, 285.12, and 286.26 eV were found in LPO-2, 3, and 4, respectively. These C 1s peaks corresponded to the C-0-C species. The C=O binding energy at 289.85 eV for LPO-1, 287.53–288.91 eV for LPO-2, 289.00 for LPO-3 and 288.91 eV for LPO-4. The O-C=0 binding energy at 288.75 eV was found only in the LPO-1 C1s spectra, while two other binding energies at 285.41 and 285.12 eV were found in LPO-1 and 3, which correspond to the C-O environment due to the carbon layer on most of the sample surfaces exposed to air. The carbon peaks of the samples originate from surface impurities.
The XPS spectrum of Na 1s in LPO4 is decomposed into two peaks at 1070.77 and 1073.13 eV, indicating the presence of Na+. The Na 1s peaks in LPO3 with binding energies of 1071.50 and 1071.94 eV indicate the presence of Na and Na-O, respectively.
The same Na 1s peak of Na+ was found at 1071.16, 1071.16, and 1071.77 eV for LPO-2 and 1071.63 eV. An additional Na 1s peak of sodium oxides (NaAlO) was found at 1070.55 and 1071.41 eV in LPO-1 and at 1073.131 eV in LPO-4. The XPS spectrum of LPO-4 for Na 1s showed another peak at 1071.89 eV, indicating the presence of SBA species in the sample structure.
As can be seen in Figure 10, LPO-4 exhibited clear and strong peaks of C 1s, Li 1s, P 2p, and O 1s, indicating that this sample may have more stable solid electrolytes. Other slight changes in peak positions or intensities could be related to the slight variations in particle structure (e.g., slight disorder or variations in crystal quality) of the different samples (as shown in Figure 8), which may affect the electronic structure of the elements, resulting in shifts in the observed binding energies. The change may also originate from the local chemical environment around the lithium, phosphorus, and oxygen atoms, which is essentially due to residual impurities in LPO-1, LPO-2, and LPO-3 samples.

3.7. Electrical Properties

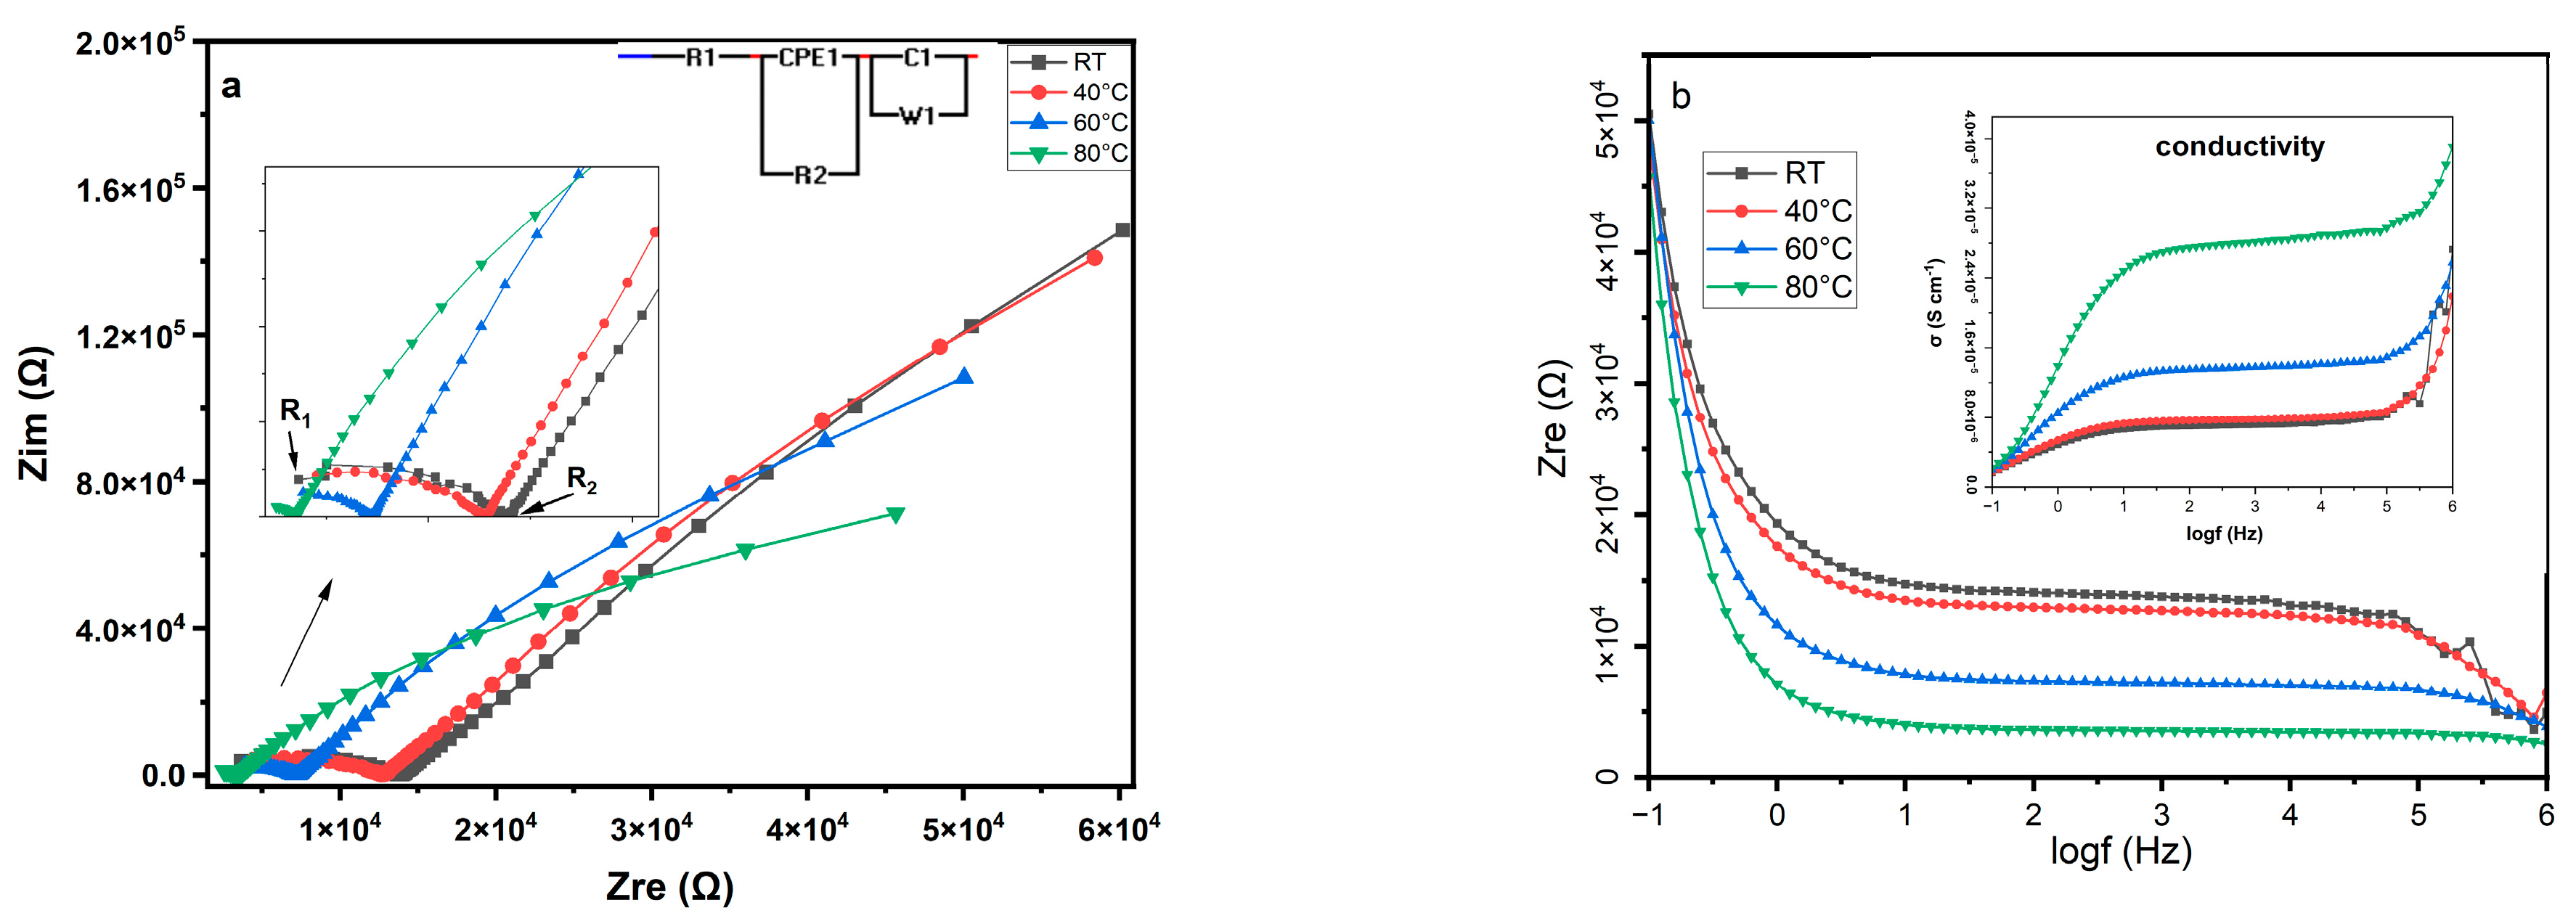
Figure 11a shows the Nyquist plot curves of lithium phosphate (LPO-4, pH = 13) at different temperatures (room temperature, 40, 60, and 80 °C). The spectra were obtained in a frequency range of f = 0.01 Hz to 1 MHz. A clear semicircle was identified in the high-frequency range, and the Warburg impedance line was identified in the low-frequency range.
The first resistance (R1) was interpreted as the bulk’s response to the electric field. The second resistance (R2) could indicate additional resistances, such as grain boundary resistance or secondary interfacial processes of the sample.
An electrical circuit containing three resistors, a constant phase (CPE1), a capacitor, and an open Warburg, which was associated with lithium-ion diffusion, was proposed for the electrical analysis. The following formula was used to determine the ionic conductivity of the sample: σ = L/(R.A)
Where: L is the thickness of the pellets in cm, R is the bulk resistance in Ω, and A is the paste area of the sample in cm2. The intersection of the semicircle with the high-frequency region was used to determine the total resistance, which corresponds to the R2 of the circle. The ionic conductivities obtained were 7.1 × 10⁻⁶ S.cm−1 at room temperature, 7.6 × 10⁻⁶ S.cm−1, 1.3 × 10⁻⁵ S.cm−1, and 2.7 × 10⁻⁵ S.cm−1 at 40, 60 and 80 °C, respectively. As presented in Figure 11b, these values were higher than Li3PO4 conductivity values of 1.8.10−10 s.cm−1 and 4.65 × 10⁻⁸ S.cm−1, 3.10−7 S.cm- 1, and 4.10−8 S.cm−1 reported by Lugas Dwi Prayogi et al. [3], Yin-Qiu Sun et al. [2], and Nur I.P. Ayu et al. [10], respectively. This performance in conductivity may be attributed to the short diffusion distance of lithium ions due to the particle nanoscales and nanotube morphologies with high surface area (9.029 m2g−1).

3.8. Kinetic and Thermodynamic Analysis

Figure 12 shows the thermogravimetric (TG) profile and a derived thermogravimetric (DTG) profile as a function of temperature. The TG curve shows the mass loss profile with increasing temperature, while the DTG curve shows two small and strong endothermic peaks at 222.7 and 450 °C. These peaks may correspond to decomposition processes. These peaks can be assigned to the decomposition phases of the sample from its original structure.
The sample, with its key kinetic and thermodynamic parameters, provided important insights into the thermal stability and decomposition behavior of LPO-4 (β-Li3PO4). The data were divided into three different phases, each characterized by specific temperature ranges, weight loss percentages, activation energies (Ea), and thermodynamic parameters (ΔS, ΔH, and ΔG), as shown in Table 9. These parameters are crucial for understanding the stability of the material and its potential performance as a solid electrolyte in lithium batteries, pointing the way for further investigations.
The first phase was measured at room temperature up to 208.7 °C. This phase exhibits relatively low weight loss and moderate activation energy (0.38 eV). This loss can be related to the removed moisture in the sample (RT–208.7 °C). The negative entropy change (ΔS) indicates a decrease in disorder in this phase. The higher pre-exponential factors in the first phase lead to more frequent effective collisions and reactions, reflecting the efficiency of LPO-4 in facilitating ion movement in this region.
The second phase was defined in the temperature range of 208.7–414.8 °C. In this phase, a higher weight loss indicates a stronger decomposition, and the activation energy decreases to 0.19 eV. The more negative ΔS value indicates a greater decrease in disorder.
The third phase shows the highest weight loss, indicating a significant decomposition of the material. The activation energy (Ea = slope × 8.3143) increases slightly to 0.29 eV compared to the second phase, indicating a certain resistance of the bonds and a degree of thermal stability, which is still relatively low. The entropy change (ΔS) remains negative. The high values for enthalpy change (ΔH) in the first and third phases indicate that the material is relatively stable and requires significant energy to decompose; thus, it may be suitable for applications requiring high thermal stability. The activation energies for all phases are below 5 ev and relate to the values for superionic conductors [47,48]. The R2 values for all phases show a strong correlation between the experimental data and the fitting model.

4. Conclusions

Solid lithium phosphate electrolyte samples with the formula (Li3PO4) were synthesized from lithium carbonate (Li2CO3) and trisodium phosphate dodecahydrate (Na3PO4*12H2O) by co-precipitation at different pHs, temperatures, and stoichiometric values. A single-phase, high-purity and ionically conductive β-Li3PO4 with nanotube morphologies was successfully prepared in the set of samples at 90 °C and pH 13. The ionic conductivities obtained were 7.1 × 10⁻⁶ S.cm−1 at room temperature, 7.6 × 10⁻⁶ S.cm−1, 1.3 × 10⁻⁵ S.cm−1, and 2.7 × 10⁻⁵ S.cm−1 at 40, 60, and 80 °C, respectively.
The LPO-4 sample exhibited excellent electrochemical properties and represents a promising route for the further industrial application of lithium phosphate as a sustainable and environmentally friendly solid electrolyte. The actual achievement compared with some previous work on lithium phosphate, including its conductivity, high surface area, and lower activation energy, may attributed to nanotubes and nanoscale size of the synthesized LPO-4, which enlarge the reaction interfaces and shorten the diffusion distance of lithium ions.
The kinetic and thermodynamic studies confirmed the excellent stability in the temperature range RT–208 °C and some endothermic reactions that can occur in high-temperature ranges.

Author Contributions

Conceptualization, S.Y.Z.; Methodology, S.Y.Z.; Software, S.Y.Z.; Validation, S.Y.Z., H.Y. and C.J.; Formal analysis, S.Y.Z.; Investigation, S.Y.Z.; Resources, S.Y.Z. and H.Y.; Data curation, S.Y.Z.; Writing—original draft, S.Y.Z.; Writing—review & editing, S.Y.Z. and C.J.; Visualization, S.Y.Z.; Supervision, H.Y.; Project administration, S.Y.Z., H.Y. and C.J.; Funding acquisition, H.Y. All authors have read and agreed to the published version of the manuscript.

Funding

This research was funded by National Natural Science Foundation project 21975288.

Data Availability Statement

The data presented in this study are available on request from the authors.

Conflicts of Interest

The authors declare no conflict of interest.

References

  1. Kim, T.Y.; Song, C.K.; Yun, Y.S.; Yun, D.; Han, J.W.; Yi, J. Active site structure of a lithium phosphate catalyst for the isomerization of 2,3-epoxybutane to 3-buten-2-ol. Mol. Catal. 2018, 445, 133–141. [Google Scholar] [CrossRef]
  2. Sun, Y.Q.; Luo, X.T.; Zhu, Y.S.; Liao, X.J.; Li, C.J. Li3PO4 electrolyte of high conductivity for all-solid-state lithium battery prepared by plasma spray. J. Eur. Ceram. Soc. 2022, 42, 4239–4247. [Google Scholar] [CrossRef]
  3. Prayogi, L.D.; Faisal, M.; Kartini, E.; Honggowiranto, W. Supardi, Morphology and conductivity study of solid electrolyte Li3PO4. AIP Conf. Proc. 2016, 1710, 030047. [Google Scholar] [CrossRef]
  4. Fan, L.; Wei, S.; Li, S.; Li, Q.; Lu, Y. Recent Progress of the Solid-State Electrolytes for High-Energy Metal-Based Batteries. Adv. Energy Mater. 2018, 8, 1702657. [Google Scholar] [CrossRef]
  5. Rosen, M.; Hecker, P.; Mann, M.; Ma, Q.; Gross, J.P.; Schwaiger, R.; Guillon, O.; Fattakhova-Rohlfing, D.; Finsterbusch, M. Reducing the environmental footprint of solid-electrolytes—A green synthesis route for LATP. Green Chem. 2024, 26, 2712–2720. [Google Scholar] [CrossRef]
  6. Saran, S.; Eker, Y.R. Synthesis, structural and conductive properties of Nd doped garnet-type Li7La3Zr2O12 Li-ion conductor. Curr. Appl. Phys. 2022, 41, 1–6. [Google Scholar] [CrossRef]
  7. Xiao, B.; Li, D.; Dai, X.; Wei, Y.; Liao, Y.; Wang, C.; Ji, F.; Wu, F. Construction of a robust lithium cobalt phosphate layer for enhancement of the electrochemical performance of LiNi0.8Co0.1Mn0.1O2 at high voltage. Electrochim. Acta 2024, 475, 143648. [Google Scholar] [CrossRef]
  8. Zeng, S.; Ding, X.; He, L.; Li, H.W.; Zhang, Q.; Li, Y. Realizing fast Li-ion conduction of Li3PO4 solid electrolyte at low temperature by mechanochemical formation of lithium-containing dual-shells. Mater. Adv. 2023, 4, 2780–2784. [Google Scholar] [CrossRef]
  9. Kuwata, N.; Iwagami, N.; Matsuda, Y.; Tanji, Y.; Kawamura, J. Thin Film Batteries with Li3PO4 Solid Electrolyte Fabricated by Pulsed Laser Deposition. ECS Trans. 2009, 16, 53–60. [Google Scholar] [CrossRef]
  10. Ayu, N.I.P.; Kartini, E.; Prayogi, L.D.; Faisal, M. Supardi, Crystal structure analysis of Li3PO4 powder prepared by wet chemical reaction and solid-state reaction by using X-ray diffraction (XRD). Ionics 2016, 22, 1051–1057. [Google Scholar] [CrossRef]
  11. Zhao, S.; Jiang, W.; Zhu, X.; Ling, M.; Liang, C. Understanding the synthesis of inorganic solid-state electrolytes for Li ion batteries: Features and progress. Sustain. Mater. Technol. 2022, 33, e00491. [Google Scholar] [CrossRef]
  12. Method for Recovering Lithium from Lithium Carbonate Precipitation Mother Liquor. CN111533146A. Available online: https://patents.google.com/patent/CN111533146A/zh (accessed on 25 October 2024).
  13. Liu, W.Y.; Li, C.L.; Fu, Z.W. Stability of Nitrogen-Containing Lithium Phosphate Films in Air. Acta Phys.-Chim. Sin. 2006, 11, 1413–1418. Available online: https://qikan.cqvip.com/Qikan/Article/Detail?id=23426027&from=Qikan_Article_Detail (accessed on 2 October 2024).
  14. Wu, J. Discussion on the process of preparing lithium dihydrogen phosphate from lithium phosphate tower skin. XinJiang Youse Jinshu 2012, S1, 124–125. Available online: https://qikan.cqvip.com/Qikan/Article/Detail?id=1003444489&from=Qikan_Article_Detail (accessed on 2 October 2024).
  15. Wu, S.; Zhang, M.; Zan, C.; Zhou, H. Process of Deep Recovery of Lithium from the Mother Liquor of Lithium Carbonate by Phosphate Precipitation. J. Tianjin Univ. Sci. Technol. 2023, 38, 35–41. [Google Scholar] [CrossRef]
  16. Yao, X.; Wang, Y.; Xu, M.; Shuying, S.U.N. Preparation of lithium phosphate from waste liquid of retired lithium batteries. Chem. Ind. Eng. 2024, 41, 179–190. [Google Scholar] [CrossRef]
  17. Ishigaki, N.; Akimoto, J. Room temperature synthesis and phase transformation of lithium phosphate Li3PO4 as solid electrolyte. J. Asian Ceram. Soc. 2021, 9, 452–458. [Google Scholar] [CrossRef]
  18. Puente, P.M.G.; Song, S.; Cao, S.; Rannalter, L.Z.; Pan, Z.; Xiang, X.; Shen, Q.; Chen, F. Garnet-type solid electrolyte: Advances of ionic transport performance and its application in all-solid-state batteries. J. Adv. Ceram. 2021, 10, 933–972. [Google Scholar] [CrossRef]
  19. Farrukh, M.A.; Butt, K.M.; Chong, K.K.; Chang, W.S. Photoluminescence emission behavior on the reduced band gap of Fe doping in CeO2-SiO2 nanocomposite and photophysical properties. J. Saudi Chem. Soc. 2019, 23, 561–575. [Google Scholar] [CrossRef]
  20. Del Mar Graciani, M.; Rodríguez, A.; Muñoz, M.; Moyá, M.L. Micellar solutions of sulfobetaine surfactants in water-ethylene glycol mixtures: Surface tension, fluorescence, spectroscopic, conductometric, kinetic studies. Langmuir 2005, 21, 7161–7169. [Google Scholar] [CrossRef]
  21. Silva, J.M.R.; de Morais Araújo, A.M.; da Costa Evangelista, J.P.; da Silva, D.R.; Gondim, A.D.; de Araujo, A.S. Evaluation of the kinetic and thermodynamic parameters in catalytic pyrolysis process of sunflower oil using Al-MCM-41 and zeolite H-ZSM-5. Fuel 2023, 333, 126225. [Google Scholar] [CrossRef]
  22. Bhardwaj, G.; Kumar, M.; Mishra, P.K.; Upadhyay, S.N. Kinetic analysis of the slow pyrolysis of paper wastes. Biomass Convers. Biorefinery 2023, 13, 3087–3100. [Google Scholar] [CrossRef]
  23. Zakariyaou, S.Y.; Ye, H.; Oumarou, A.D.M.; Aziz, M.S.A.; Ke, S. Characterization of Equilibrium Catalysts from the Fluid Catalytic Cracking Process of Atmospheric Residue. Catalysts 2023, 13, 1483. [Google Scholar] [CrossRef]
  24. Keffer, C.; Mighell, A.; Mauer, F.; Swanson, H.; Block, S. The Crystal Structure of Twinned Low-Temperature Lithium Phosphate. Inorg. Chem. 1967, 6, 119–125. [Google Scholar] [CrossRef]
  25. Lander, L.; Reynaud, M.; Carrasco, J.; Katcho, N.A.; Bellin, C.; Polian, A.; Baptiste, B.; Rousse, G.; Tarascon, J.M. Unveiling the electrochemical mechanisms of Li2Fe(SO4)2 polymorphs by neutron diffraction and density functional theory calculations. Phys. Chem. Chem. Phys. 2016, 18, 14509–14519. [Google Scholar] [CrossRef]
  26. Huang, Y.X.; Liu, J.Y.; Mi, J.X.; Zhao, J.T. (Ga0.71B0.29)PO4 with a high-cristobalite-type structure refined from powder data. Acta Crystallogr. Sect. E Struct. Rep. Online 2010, 66, i4. [Google Scholar] [CrossRef]
  27. Carbon|XPS Periodic Table|Thermo Fisher Scientific|Thermo Fisher Scientific—CN. Available online: https://www.thermofisher.cn/cn/zh/home/materials-science/learning-center/periodic-table/non-metal/carbon.html (accessed on 18 November 2024).
  28. Carbon Spectra—Li2CO3—Lithium Carbonate. Available online: https://xpsdatabase.net/carbon-spectra-li2co3-lithium-carbonate/ (accessed on 18 November 2024).
  29. Al-Kadhi, N.S.; Hefnawy, M.A.; Alamro, F.S.; Pashameah, R.A.; Ahmed, H.A.; Medany, S.S. Polyaniline-Supported Nickel Oxide Flower for Efficient Nitrite Electrochemical Detection in Water. Polymers 2023, 15, 1804. [Google Scholar] [CrossRef]
  30. Alamro, F.S.; Medany, S.S.; Al-Kadhi, N.S.; Ahmed, H.A.; Hefnawy, M.A. Modified NiFe2O4-Supported Graphene Oxide for Effective Urea Electrochemical Oxidation and Water Splitting Applications. Molecules 2024, 29, 1215. [Google Scholar] [CrossRef]
  31. Shulga, Y.M.; Baskakov, S.A.; Knerelman, E.I.; Davidova, G.I.; Badamshina, E.R.; Shulga, N.Y.; Skryleva, E.A.; Agapov, A.L.; Voylov, D.N.; Sokolov, A.P.; et al. Carbon nanomaterial produced by microwave exfoliation of graphite oxide: New insights. RSC Adv. 2014, 4, 587–592. [Google Scholar] [CrossRef]
  32. Lu, Y.C.; Crumlin, E.J.; Veith, G.M.; Harding, J.R.; Mutoro, E.; Baggetto, L.; Dudney, N.J.; Liu, Z.; Shao-Horn, Y. In Situ Ambient Pressure X-ray Photoelectron Spectroscopy Studies of Lithium-Oxygen Redox Reactions. Sci. Rep. 2012, 2, 715. [Google Scholar] [CrossRef]
  33. Yin, X.; Sun, X.; Li, D.; Xie, W.; Mao, Y.; Liu, Z.; Liu, Z. 2D/2D Phosphorus-Doped g-C3N4/Bi2WO6 Direct Z-Scheme Heterojunction Photocatalytic System for Tetracycline Hydrochloride (TC-HCl) Degradation. Int. J. Environ. Res. Public. Health 2022, 19, 14935. [Google Scholar] [CrossRef]
  34. Liu, X.; Yu, M.; Wu, S.; Gong, J. Composite nanoarchitectonics for efficient lithium storage by encapsulating black phosphorus quantum dots in cobalt/iron based Prussian blue analogues. J. Alloys Compd. 2023, 969, 172291. [Google Scholar] [CrossRef]
  35. Chatterjee, T.; Raul, C.K.; Mandal, S.; Pradhan, S.K.; Meikap, A.K. Effect of surfactant-assisted hierarchical growth of cupric oxide-hydroxyapatite nanocomposite on the dielectric and electrical transport behavior. Phys. B Condens. Matter 2023, 650, 414560. [Google Scholar] [CrossRef]
  36. Jung, W.D.; Jeon, M.; Shin, S.S.; Kim, J.S.; Jung, H.G.; Kim, B.K.; Lee, J.H.; Chung, Y.C.; Kim, H. Functionalized Sulfide Solid Electrolyte with Air-Stable and Chemical-Resistant Oxysulfide Nanolayer for All-Solid-State Batteries. ACS Omega 2020, 5, 26015–26022. [Google Scholar] [CrossRef]
  37. Chen, K.; Tang, Y.; Zhang, S.; Hao, X.; Zhao, X.; Cheng, L.Q.; Xiao, Y.; Wen, Z. Promoted Stability and Reaction Kinetics in Ni-Rich Cathodes via Mechanical Fusing Multifunctional LiZr2(PO4)3 Nanocrystals for High Mass Loading All-Solid-State Lithium Batteries. ACS Appl. Mater. Interfaces 2024, 16, 45459–45472. [Google Scholar] [CrossRef]
  38. Fontecha, D.; Nuwayhid, R.B.; Kozen, A.C.; Stewart, D.M.; Rubloff, G.W.; Gregorczyk, K.E. Low temperature plasma-enhanced atomic layer deposition of sodium phosphorus oxynitride with tunable nitrogen content. J. Vac. Sci. Technol. A 2022, 40, 032403. [Google Scholar] [CrossRef]
  39. López, E.O.; Bernardo, P.L.; Checca, N.R.; Rossi, A.L.; Mello, A.; Ellis, D.E.; Rossi, A.M.; Terra, J. Hydroxyapatite and lead-substituted hydroxyapatite near-surface structures: Novel modelling of photoemission lines from X-ray photoelectron spectra. Appl. Surf. Sci. 2022, 571, 151310. [Google Scholar] [CrossRef]
  40. Wang, Y.; Zheng, X.; Qu, Q.; Liu, G.; Battglia, V.S.; Zheng, H. A novel maleic acid/graphite composite anode for lithium ion batteries with high energy and power density. Carbon. 2018, 132, 420–429. [Google Scholar] [CrossRef]
  41. Oxygen|Thermo Fisher Scientific XPS Periodic Table|Thermo Fisher Scientific|Thermo Fisher Scientific—CN. Available online: https://www.thermofisher.cn/cn/zh/home/materials-science/learning-center/periodic-table/non-metal/oxygen.html (accessed on 18 November 2024).
  42. Khan, Z.; Park, S.O.; Yang, J.; Park, S.; Shanker, R.; Song, H.K.; Kim, Y.; Kwak, S.K.; Ko, H. Binary N,S-doped carbon nanospheres from bio-inspired artificial melanosomes: A route to efficient air electrodes for seawater batteries. J. Mater. Chem. A Mater. 2018, 6, 24459–24467. [Google Scholar] [CrossRef]
  43. García-Bordejé, E.; Dongil, A.B.; Conesa, J.M.; Guerrero-Ruiz, A.; Rodríguez-Ramos, I. Dual functional materials based on Ni and different alkaline metals on alumina for the cyclic stepwise CO2 capture and methanation. Chem. Eng. J. 2023, 472, 144953. [Google Scholar] [CrossRef]
  44. Fang, R.; Li, Y.; Wu, N.; Xu, B.; Liu, Y.; Manthiram, A.; Goodenough, J.B. Ultra-Thin Single-Particle-Layer Sodium Beta-Alumina-Based Composite Polymer Electrolyte Membrane for Sodium-Metal Batteries. Adv. Funct. Mater. 2022, 33, 2211229. [Google Scholar] [CrossRef]
  45. Foucaud, Y.; Badawi, M.; Filippov, L.O.; Barres, O.; Filippova, I.V.; Lebègue, S. Synergistic adsorptions of Na2CO3 and Na2SiO3 on calcium minerals revealed by spectroscopic and ab initio molecular dynamics studies. Chem. Sci. 2019, 10, 9928–9940. [Google Scholar] [CrossRef] [PubMed]
  46. Savinova, E.R.; Zemlyanov, D.Y.; Scheybal, A.; Schlögl, R.; Doblhofer, K. Ex Situ X-ray Photoelectron Spectroscopy Study of the Interface between a Ag(111) Electrode and an Alkaline Electrolyte. 2. Structure of the Double Layer. Langmuir 1999, 15, 6552–6556. [Google Scholar] [CrossRef]
  47. He, X.; Zhu, Y.; Mo, Y. Origin of fast ion diffusion in super-ionic conductors. Nat. Commun. 2017, 8, 15893. [Google Scholar] [CrossRef] [PubMed]
  48. Du, Y.A.; Holzwarth, N.A.W. Li Ion Diffusion Mechanisms in the Crystalline Electrolyte γ-Li3PO4. J. Electrochem. Soc. 2007, 154, A999–A1004. [Google Scholar] [CrossRef]
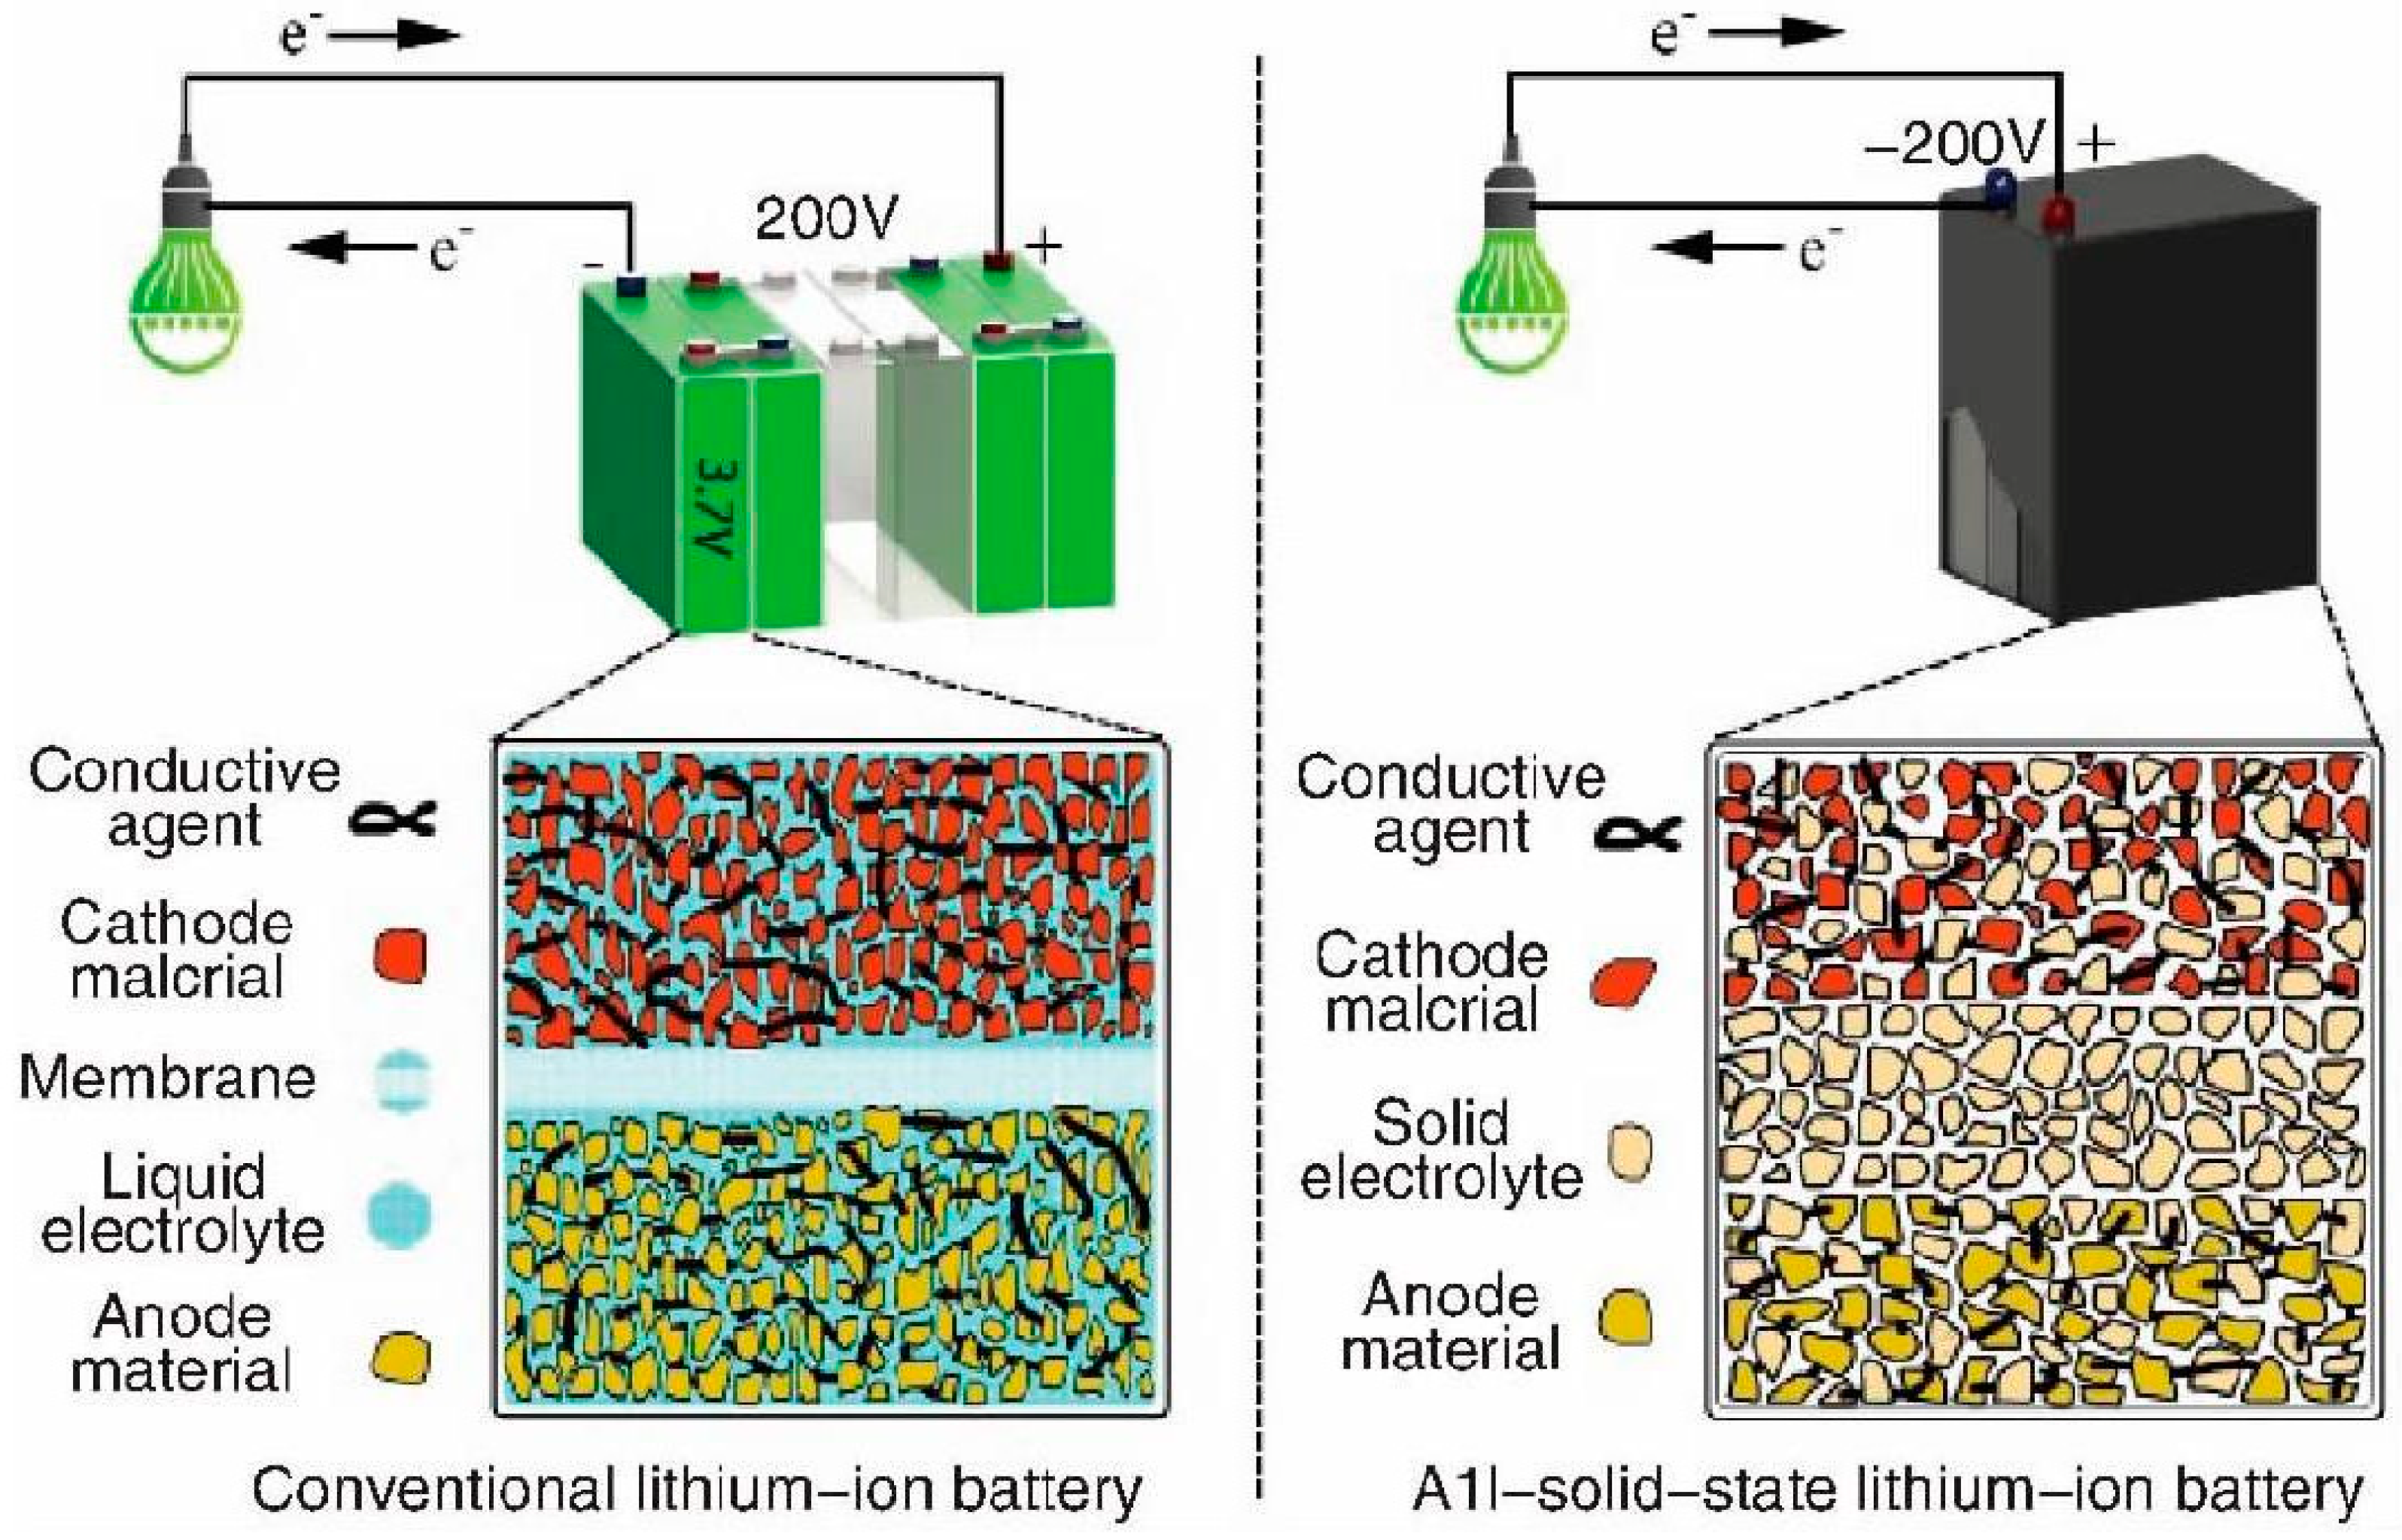
Figure 1. A typical solid-state battery: A solid electrolyte, anode material, and conductive agent. Copyright permission obtained from the author [18].
Batteries 10 00429 g001
Figure 2. Titration steps for lithium carbonate purity testing.
Batteries 10 00429 g002
Figure 3. Lithium phosphate synthesis and raw materials impurities removal process.
Batteries 10 00429 g003
Figure 4. ICP analysis of element distribution in different samples.
Batteries 10 00429 g004
Figure 5. Isothermal adsorption–desorption curves (a) and the pore size distribution as the function of pore volume (b).
Batteries 10 00429 g005
Figure 6. XRD patterns of samples LPO1, LPO2, LPO3, and LPO4.
Batteries 10 00429 g006
Figure 7. Crystal structure of β-Li3PO4 (left) and γ-Li3PO4 (right) [10].
Batteries 10 00429 g007
Figure 8. SEM images of (A) (LPO-1), (B) (LPO-2), (C) (LPO-3), and (D) (LPO-4).
Batteries 10 00429 g008
Figure 9. Energy Dispersive X-ray Spectroscopy (EDS) of LPO-4 sample—purities distribution.
Batteries 10 00429 g009
Figure 10. XPS C 1s, Li 1s, P 2p, O 1s, and Na 1s core spectra for LPO-1 (1.a, 1.b, 1.c, 1.d, and 1.e), LPO-2 (2.a, 2.b, 2.c, 2.d, and 2.e), LPO-3 (3.a, 3.b, 3.c, 3.d, and 3.e), and LPO-4 (4.a, 4.b, 4.c, 4.d, and 4.e).
Batteries 10 00429 g010aBatteries 10 00429 g010bBatteries 10 00429 g010cBatteries 10 00429 g010d
Figure 11. (a) The Nyquist plot of LPO-4 and the equivalent experimental circuit; (b) resistivities and ionic conductivities as a function of frequencies (logf(Hz)).
Batteries 10 00429 g011
Figure 12. (a): Thermal phases and (b): plot of ln[−ln(1 − x)] over 1000/T.
Batteries 10 00429 g012
Table 1. Basic conditions for the synthesis of lithium phosphate.
Lithium
Source
Phosphate SourcepH Control
Reagent
Reaction
Temperature °C
Reaction Time/minpHRef.
Li2CO3Na3PO4•10H2OHCl; NaOH70–78 20–2512.5–13[12]
LiOH•H2ONH4H2PO4-20060-[13]
LiOHH3PO4 ->80-7.5[14]
Li2CO3Na3PO4•10H2OHCl>9060>12[15]
Spent batteryH3PO4-70–9060–1207–8[16]
Table 2. Basic conditions and statistics.
SamplesLi2CO3Na3PO4.12H2OpH
Control
Reagent
Reaction
Temperature/°C
Reaction
Time/min
pHLi3PO4
(g)
Yield
(%)
LPO-13 g9.942 gHCl-NaOH7840 min122.4079.19
LPO-29.942 g7850 min12.52.3778.20
LPO-39.942 g78–921 h 30 min132.5082.49
LPO-410 g78–901 h 30 min12.72.8593.49
y i e l d ( % ) = E x p e r i m e n t a l   m a s s T h e o r i c a l   m a s s ·100; where Theorical mass = 3.04 to 3.05 g.
Table 3. Composition of lithium carbonate.
Li2CO3
ElementIntensityConcentration (C)
(mg/L)
with Equation (1)
(%)
with Equation (2)
(g/L)
Al396.1630.2420.2392.390
As188.984−0.320−0.316−3.163
B249.778−0.082−0.081−0.816
Ba233.5330.0020.0020.020
Bi223.065−0.009−0.009−0.096
Ca317.9410.3580.3533.531
Cd214.443−0.003−0.003−0.039
Cr283.5680.0010.00150.015
Co228.6180.0010.0010.018
Cu324.7620.0010.0010.016
Fe238.2050.1250.1231.236
K766.510.1240.1231.230
Li670.80318.46018.205182.059
Mg285.2170.1340.1321.323
Mn257.6150.0110.0110.110
Na589.6061.1501.13411.344
Ni231.6050.0030.0030.036
P213.6210.1010.0990.999
Pb220.36−0.009−0.009−0.097
Se196.0320.0590.0580.582
Sr407.780.0030.0030.034
V290.8860.00060.00060.006
Zn213.8610.0470.0470.473
Table 4. Water content.
SampleWeigh of Empty Glass (A) Weigh of Sample (B) (A + B)Weigh After Drying (C)Water Content (%)
Li2CO342.101658.1057.106.25
Table 5. LPO-4 properties.
SamplesSBET
(m2g−1)
St-Plot-Ext
(m2g−1)
SLangmuir
(m2g−1)
Vtotal
(cm3g−1)
Vmicro
(cm3g−1)
Size
LPO-49.02919.6928.1890.022-10.08 nm
Table 6. Calculated lattice Constants of samples.
SamplesPhasea (Å)b (Å)C (Å)Cell Volume (Å3)Density (g/cm3)
LPO-1β-Li3PO46.1155.23944.855155.562.472
LPO-2β-Li3PO46.1155.23944.854155.562.471
LPO-3β-Li3PO46.1155.23944.854155.562.471
LPO-4β-Li3PO46.1155.23944.854155.562.471
Table 7. Sample elements’ binding energies and atomic ratios.
LPO-1LPO-2LPO-3LPO-4
Binding Energy (eV)Li 1s54.854.854.754.8
P 2p133.0133.05133.0133.1
O 1s530.9530.87530.9531.0
C 1s284.8284.8284.8284.7
Na 1s1071.41071.41071.61071.8
Atomic ratioLi/P3.13.23.03.0
O/P4.34.34.24.1
Na/P0.840.660.520.06
Table 8. XPS peak Blinding Energies and Assignments.
SpectraBinding Energy (eV)AssignmentRefs.
C 1s284.65/284.50/284.72C-C[27,28]
285.41/285.32C-O[29,30]
288.75OC=O[27]
289.00/289.85C=O[27,31]
285.12/286.26C-O-C[27]
Li 1s54.84Li2CO3[32]
P 2p133.27P–N[33]
132.77/132.95P 2p1/2[34,35]
133.27/133.52/133.20/132.85PO43−[36,37,38]
132.32P 2p3/2[39]
133.00C–P–O[40]
O 1s531.56metal carbonate[41]
530.86metal oxide[41]
Na 1s1071.7/1070.86Na+[42]
1071.16/1073.13Sodium oxides
(NaAlO)
[43]
1071.89SBA[44]
1071.94Na-O[45]
1071.50Na[46]
Table 9. Kinetic and thermodynamic parameters of LPO-4.
PhasesT°C RangeLoss (Wt.%)Ea (eV)∆SH ∆GFitting EquationsA (M.s−1)
1RT–208.7 °C1.220.38 −206.5021.49 × 10+81.49 × 10+8Y = −4.4647x + 7.498
R2 = 80.56
163.89
2208.7–414.8 °C4.020.19 −261.541.1 × 10+81.1 × 10+8Y = −2.3067x + 2.608
R2 = 98.92
0.31
3414.8–820.89 °C8.070.29−255.3742.58 × 10+82.58 × 10+8Y = −3.4057x + 4.352
R2 = 95.09
1.04
Disclaimer/Publisher’s Note: The statements, opinions and data contained in all publications are solely those of the individual author(s) and contributor(s) and not of MDPI and/or the editor(s). MDPI and/or the editor(s) disclaim responsibility for any injury to people or property resulting from any ideas, methods, instructions or products referred to in the content.