Article

The Novel Coupling of Operando Methods: Electrochemical Dilatometry with Mass Spectrometry Using the Example of a Li|Graphite Half Cell

1
Department of Applied Electrochemistry, Fraunhofer Institute for Chemical Technology ICT, Joseph-von-Fraunhofer-Str. 7, 76327 Pfinztal, Germany
2
Institute for Mechanical Process Engineering and Mechanics, Karlsruhe Institute of Technology KIT, Straße am Forum 8, 76131 Karlsruhe, Germany
*
Author to whom correspondence should be addressed.
These authors contributed equally to this work.
Batteries 2024, 10(12), 445; https://doi.org/10.3390/batteries10120445
Submission received: 15 November 2024 / Revised: 9 December 2024 / Accepted: 12 December 2024 / Published: 16 December 2024

Abstract

:
The aging of lithium-ion cells critically affects their lifetime, safety, and performance, particularly due to electrode and electrolyte degradation. This study introduced a novel combined-measurement cell-integrating operando dilatometry and operando mass spectrometry to observe real-time physical and chemical changes during electrochemical cycling. Operando dilatometry measures thickness changes in the working electrode, while operando mass spectrometry analyzes gas emissions to provide insights into the underlying degradation processes. The results indicated significant correlations between electrochemical behavior, thickness changes, and gas evolution, revealing both the reversible and irreversible growth of constituents on particles and the electrode surface. The formation of the solid electrolyte interphase due to the degradation of electrolyte components, such as solvents or conductive salts, is identified as a key factor contributing to irreversible changes. The operando gas analysis highlighted the presence of decomposition intermediates and products, which are all linked to electrolyte degradation. Additionally, post-mortem gas chromatography coupled with mass spectrometry identified several compounds, confirming the presence of different decomposition pathways. This integrated and holistic approach deepened the understanding of the aging mechanisms at the electrode level.

Graphical Abstract

1. Introduction

The aging of lithium-ion cells is highly relevant in battery research, as it significantly impacts the longevity, safety, and performance of energy storage systems [1,2,3]. In particular, the degradation of electrodes, especially the anode, plays a pivotal role in determining the efficiency and safety of lithium-ion batteries and was investigated in detail by many researchers [4,5,6]. To elucidate the underlying aging mechanisms, it is essential to closely monitor physical and chemical changes occurring within the cell.
Operando dilatometry facilitates the measurement of thickness changes occurring during the charge and discharge cycles of the cells [7,8,9]. These changes serve as indicators of volumetric alterations in the electrode material, which are driven by, e.g., (de-)intercalated lithium ions and structural transformations in anode and cathode materials [7,10,11]. Pegel et al., Heugel et al., and Bazlen et al., for example, used a well-known commercial dilatometry system to take a closer look at the influence of electrode thickness changes in relation to the thickness change in commercial pouch or cylindrical cells and their active materials [10,12,13]. Holzapfel et al. and Jahn et al., to name a few more sources, applied dilatometry as an advanced characterization method to take a closer look at the thickness change in silicon-containing anodes [14] or the deposition of lithium on graphitic anodes [15].
Concurrently, operando mass spectrometry (MS) can be employed to analyze gases released during cell operation [16,17,18,19,20]. Access to these gaseous intermediates and products provides insights into the chemical reactions and potential degradation processes taking place [21,22,23,24]. In addition, this operando technique supports the understanding of various decomposition pathways up to solid electrolyte interface (SEI) formation [22,24,25], playing a decisive role in high cycle stability and, therefore, the lifetime of cells [6,26,27]. Many research groups already investigated the formation and composition of the SEI in lithium-ion batteries [28,29,30,31].
The simultaneous application of both methods explained in detail provides valuable information regarding the interplay between physical thickness changes in the electrodes and the chemical processes contributing to aging. By integrating thickness measurements with gas analysis, a more comprehensive understanding of the aging mechanisms at the electrode level could be achieved. This not only facilitates deeper insights into the fundamental processes but also offers potential avenues for developing strategies aimed at prolonging the lifespan of lithium-ion cells.
In this research paper, we presented a newly developed combined measurement cell enabling the real-time simultaneous monitoring of both thickness changes and gas evolution. To compare the obtained results with existing literature, a well-known cell chemistry (Li|Graphite with 1 M LiPF6 as conductive salt in ethylene carbonate-dimethyl carbonate (EC:DMC, 1:1, wt/wt)) was investigated. There are numerous studies on both the LiPF6-conducting salt [22,32,33,34] and the carbonate-based solvents DMC and EC [35,36,37,38]. Our setup and obtained results presented a significant advancement in the investigation of aging processes and contributed to the optimization of lithium-ion battery performance.

2. Materials and Methods

In this section, the novel combined operando measurement cell is introduced, as well as the electrodes, further measurement devices, and parameters used for the presented measurement process.

2.1. Combined-Measurement Cell Assembly and Multifunctional Measurement Setup

All measurements were carried out with the help of an in-house designed and built combined operando cell, as shown in Figure 1.
The actual test cell included a three-way polypropylene body (1) with helium-tight, O-ring sealed stainless steel plungers. The top plunger (2) can move freely and is utilized as both electrical and mechanical contact for the working electrode (5). The bottom plunger (3) works as a counter-electrode (8) electrical contact. A constant pressure of the cell stack is maintained using internal springs (4). The working electrode (18 mm in diameter) and the counter electrode (20 mm in diameter) are separated by a porous glass frit (6) and a glass fiber separator (7) (Whatman GF/A), ensuring that only the thickness variation in the working electrode is detected. For this purpose, a constructive separation of the components was realized. For connection to the capillary inlet, the side-mounted plunger (9) is equipped with a bellow valve and a 1/16” ferrule sealed connector for gas analysis.
For the working electrode, high-power anodes with 95 wt % graphite (SMG-NA-P2, Showa Denko K.K., Tokyo, Japan) as active material were used. They were coated on an industrial-sized coater. Mass loading was set to 7 mg cm−2 with an areal capacity of 2.3 mAh cm−2. The electrodes were calandered to a single-side electrode thickness of 58.8 µm. As a counter electrode for the half cells, Li-foil (Merck KGaA, Darmstadt, Germany) with a thickness of approx. 300 µm was used. The commercially available electrolyte (E-Lyte Innovations GmbH, Münster, Germany) consisted of 1.0 M LiPF6 in EC:DMC (50:50 by weight). Per cell, 400 µL of electrolyte was used.
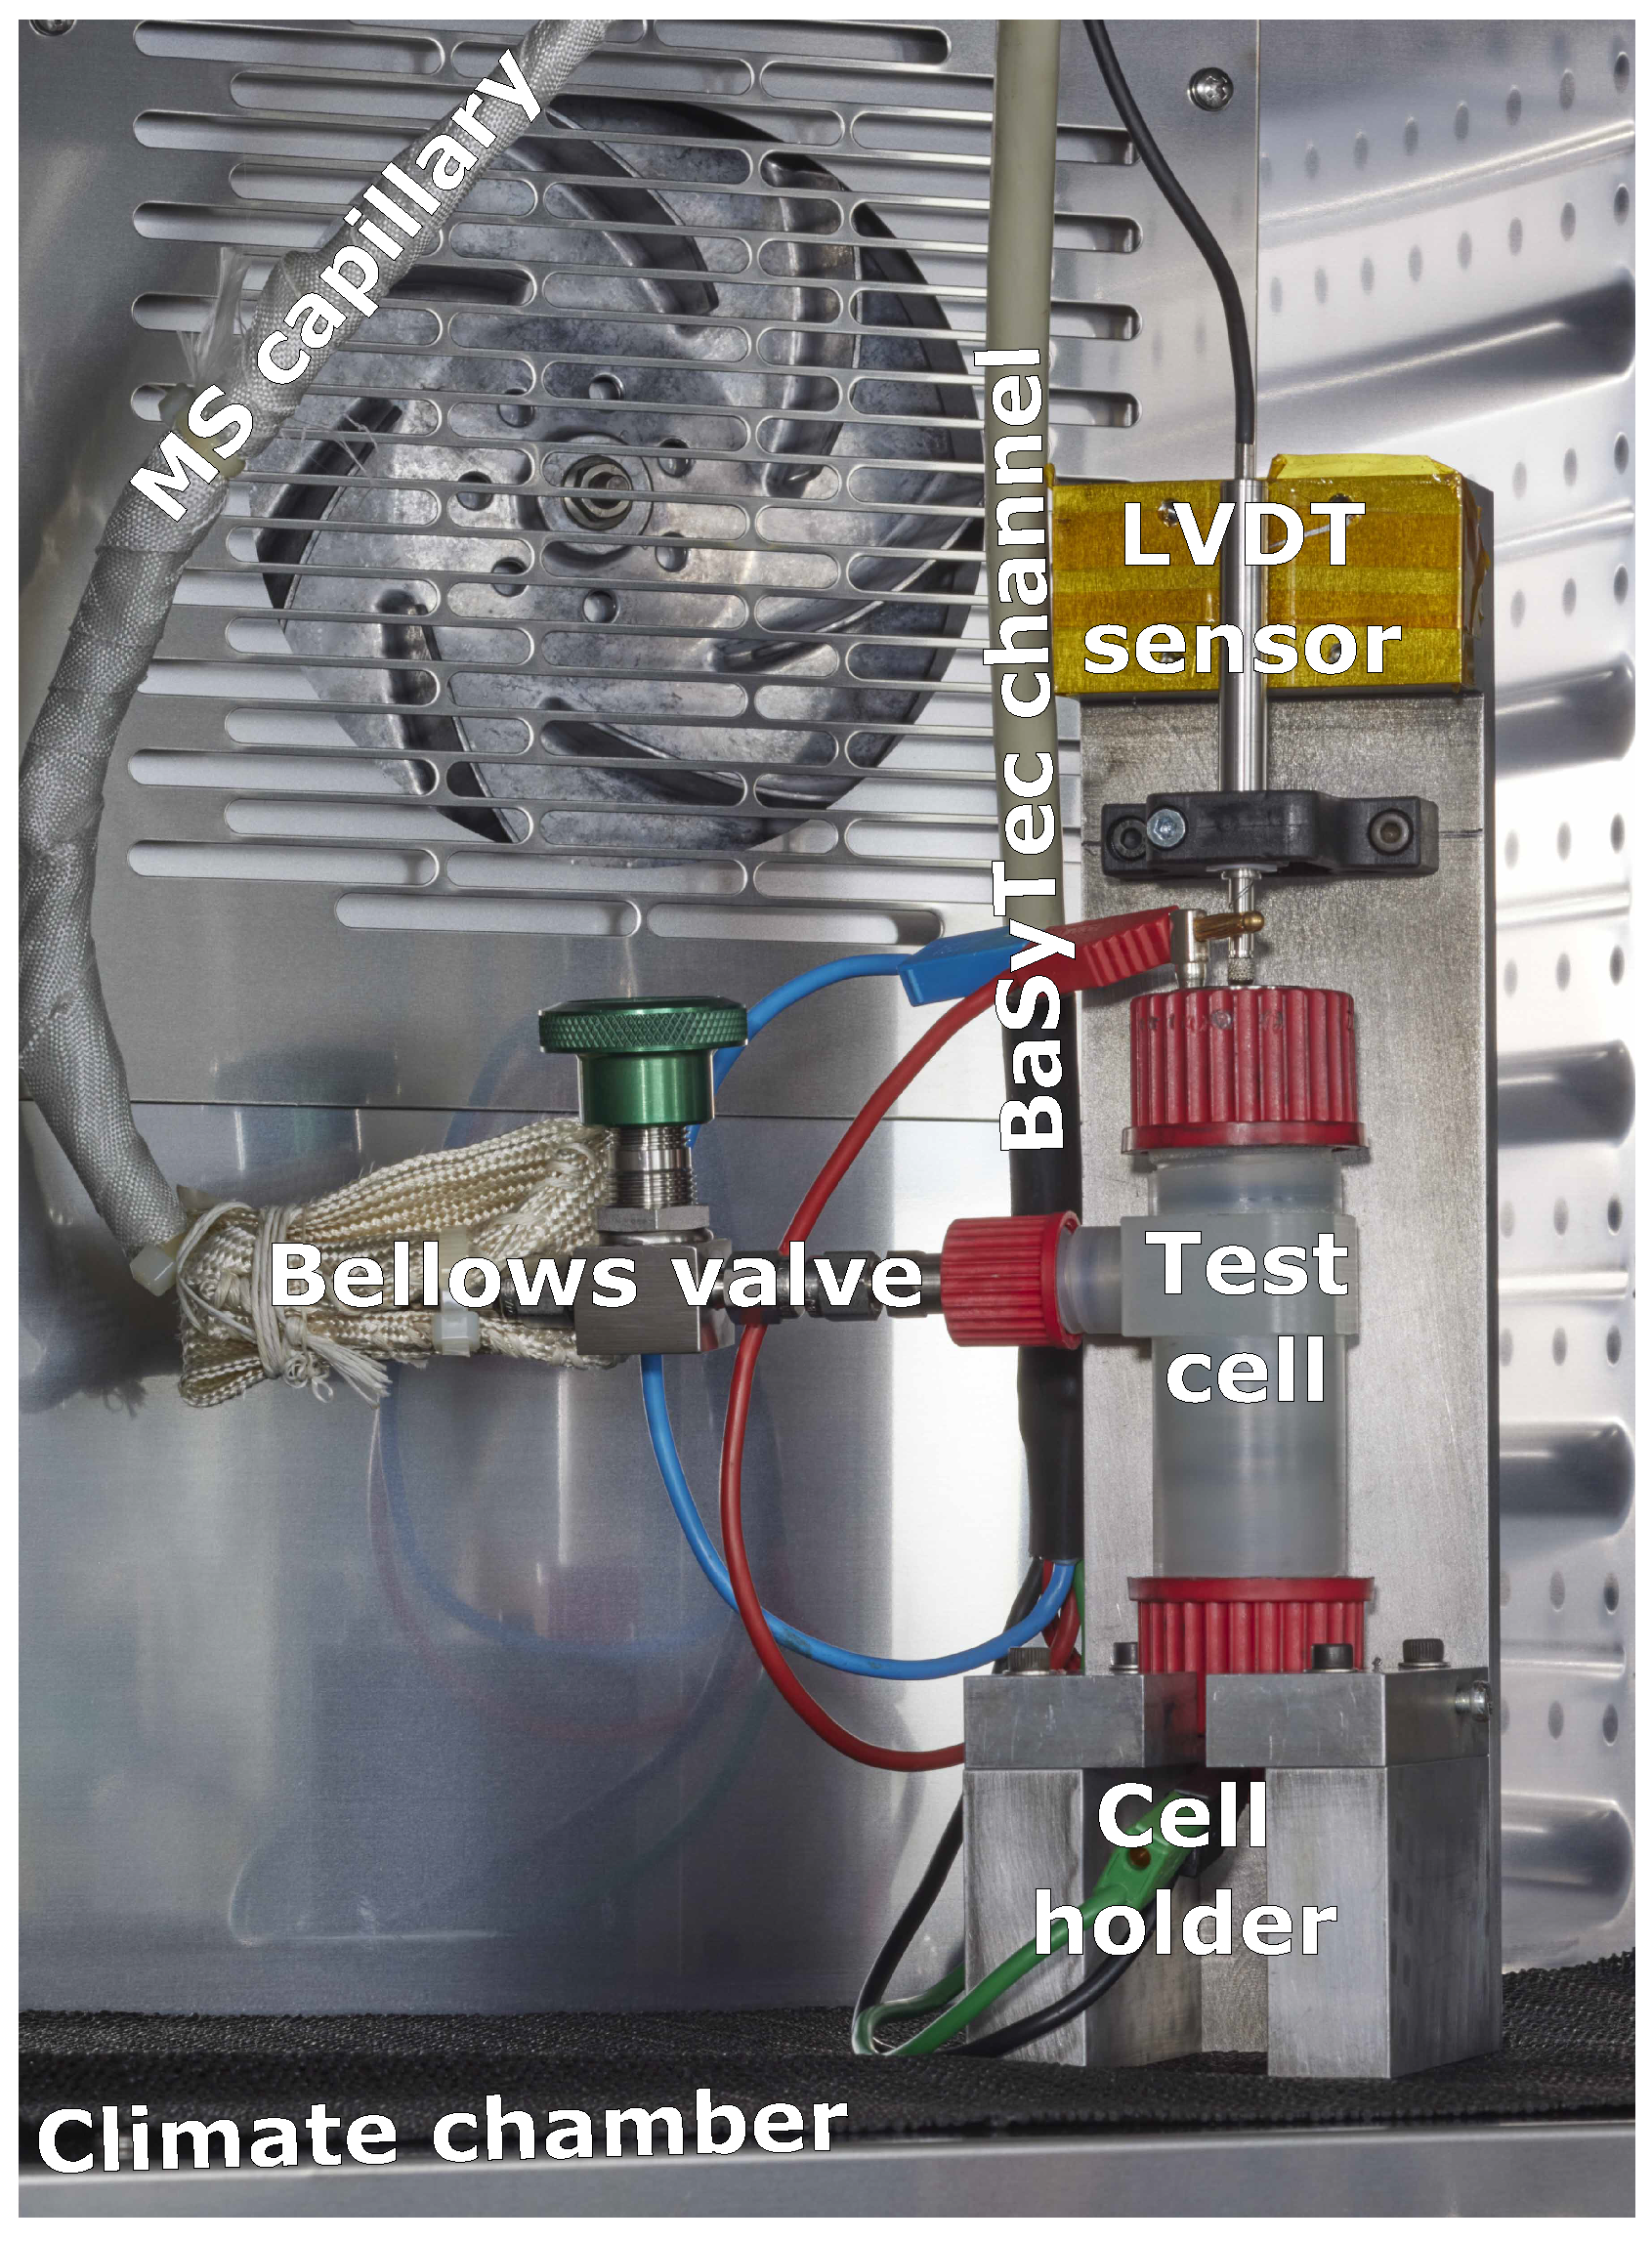
All parts were dried overnight at 80 °C in vacuum. The combined operando cell was assembled in an Ar-filled glovebox (MBraun GmbH, Garching bei München, Germany, H2O < 0.1 ppm, O2 < 0.1 ppm). Prior to operation, the capillary assembly was evacuated overnight to minimize containment by residual gas components. The complete assembled unit consists of a main steel body with fixtures for both the test cell and the sensor unit. All relevant parts are labeled in Figure 2.

2.2. Electrochemical Testing

All electrochemical measurements were performed with a CTS cell test system (BaSyTec GmbH, Asselfingen, Germany) in a climate chamber (Binder GmbH, Tuttlingen, Germany) at constant 25 °C. In Table 1, the electrochemical test plan used for the measurements is shown.
For charging and discharging, slow C-rates of C/20 at constant current (CC) with constant voltage (CV)-phase until C/100 were used to guarantee a very high measurement resolution. The voltage window was set to upper cut-off voltage (UCV) of 1.0 V and lower cut-off voltage (LCV) of 10 mV. In total, six full cycles were performed.

2.3. Operando Electrochemical Dilatometry

The displacement sensor used in the setup is an inductive-type linear variable differential transformer (LVDT) with full travel of ±1 mm, a resolution of <1 µm and linearized 0–10 V output signal (LVIT series, WayCon Positionsmesstechnik GmbH, Taufkirchen, Germany). Data were recorded via 12-channel graphic data logging unit, type Ecograph T RSG35 (Endress+Hauser GmbH+Co. KG, Weil am Rhein, Germany) with a frequency of 1 Hz.

2.4. Operando Mass Spectrometry

A PrismaPro QMG 250 mass spectrometer (MS) unit (Pfeiffer Vacuum GmbH, Aßlar, Germany) equipped with an open ion source, dual tungsten filament option, continuous secondary electron multiplier (C-SEM) and a mass range of 0–200 m/z was used for the operando mass spectrometry. The direct connection between the measuring cell and high vacuum inlet was realized through a 3 m long, heated (60 °C) and insulated fused silica capillary with inner diameter of 50 µm and outer diameter of 250 µm (Postnova Analytics GmbH, Landsberg am Lech, Germany). Spectrometer-side high-vacuum conditions were maintained by a HiCube 300 H Classic vacuum system (Pfeiffer Vacuum GmbH) below 5 × 10⁻⁶ hPa. Data were successively recorded with a per m/z dwell time of 1024 ms and fixed m/z transfer time of 8 ms, yielding a total per m/z measurement frequency of 206.5 s.

2.5. Gas Chromatography with Coupled Mass Spectrometry (GC-MS)

For post-mortem analysis of extracted gas samples, a mass spectrometer type Agilent 5977B combined with a flame ionization detector (FID) equipped Agilent 7820A gas chromatograph (both: Agilent Technologies, Inc., Santa Clara, CA, USA) were used. A medium polarity column (length 60 m, inner diameter 0.32 mm, film thickness 1.8 µm) was utilized for the separation of mobile gas phase components. All samples were introduced into the system by a heated injection valve/sample loop combination with a volume of 500 µL (Teckso GmbH, Neukirchen-Vluyn, Germany). Recorded spectra were cross-referenced and matched qualitatively by NIST version 2.3 database software [39]. For sample introduction, a 25 mL gas tight syringe (Hamilton Co., Reno, NV, USA) was used. The obtained gas sample was diluted 2:1 by the addition of Ar. The device received 5 mL of the sample gas volume.

3. Results and Discussion

The following section is divided into three main parts. In Section 3.1, an overview of the combined operando measurement is presented and described. Section 3.2 analyzes the results of the electrochemical dilatometry. In Section 3.3, the gas analytical results are presented in detail. The investigations focus in particular on occurring SEI formation and electrolyte degradation. Furthermore, all the relationships between the results obtained from the one single measurement are presented and put into context.

3.1. Combined Operando Dilatometry with Operando Mass Spectrometry

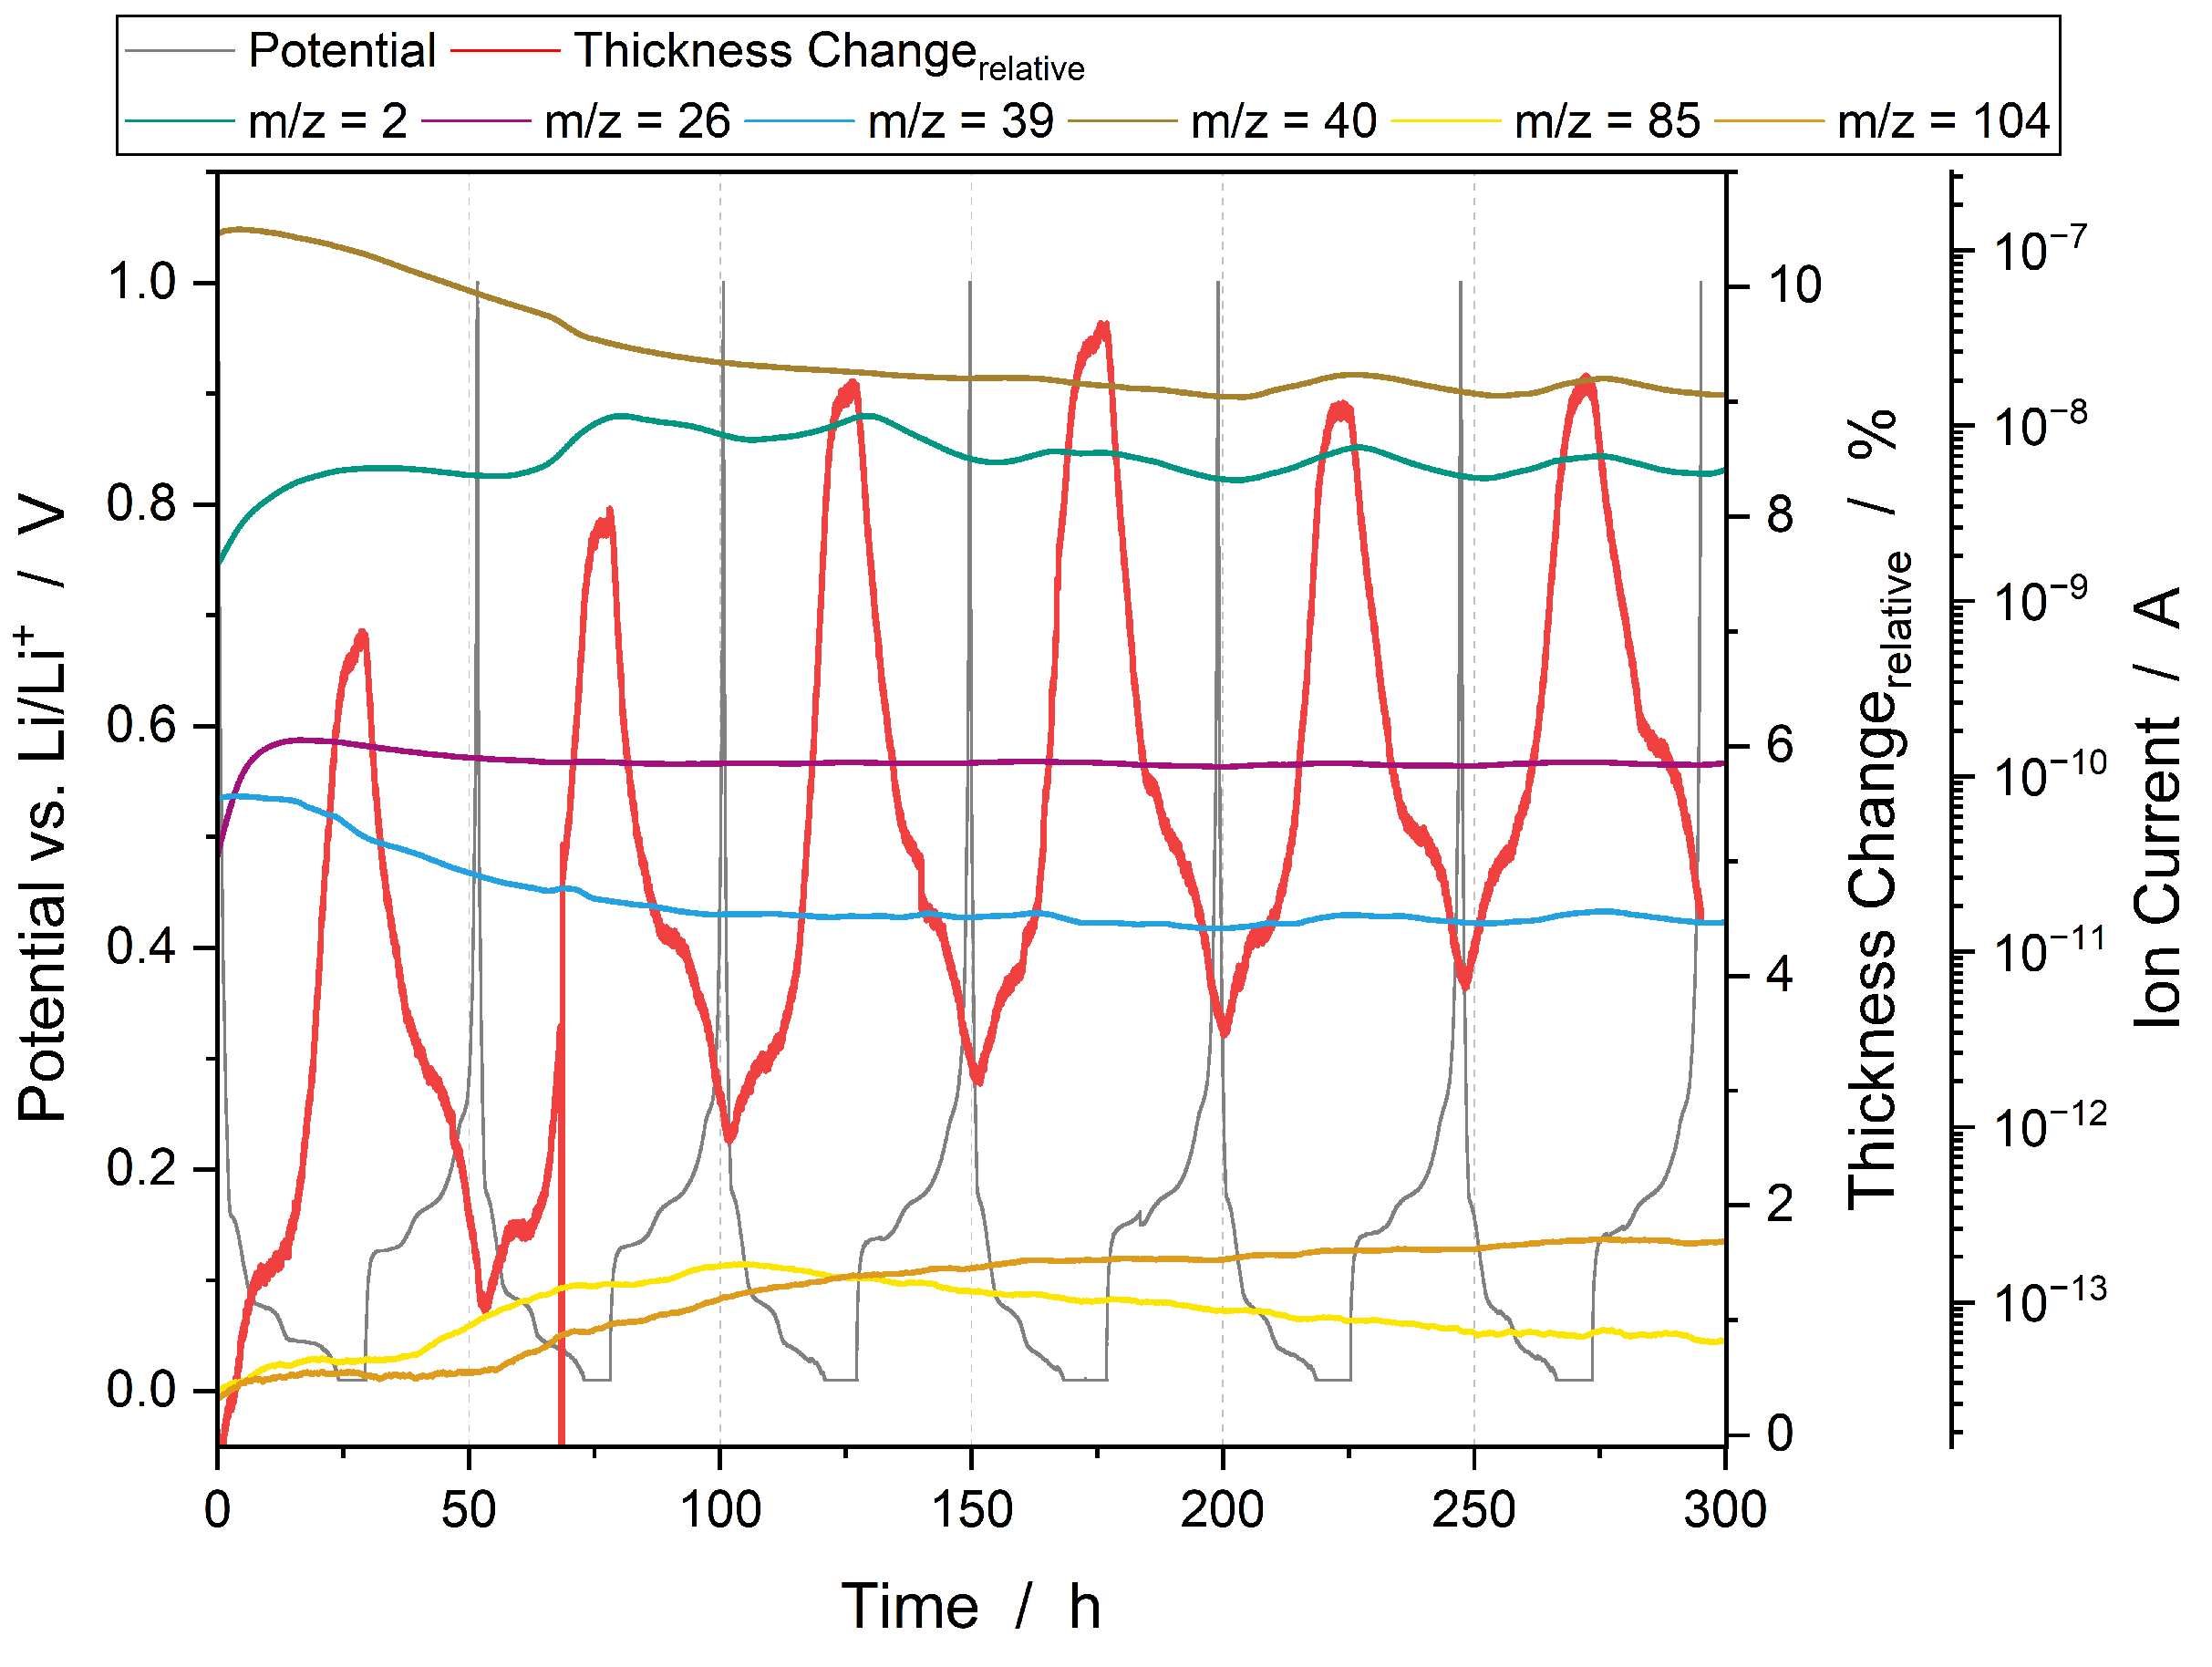
In Figure 3, all results gained from only one single measurement are presented in the diagram. On the left y-axis, the potential curve is plotted in gray, whereas the thickness change in the electrode in red and the measured ion currents of the masses of interest in different colors are plotted on the right y-axis. All curves are plotted over the measurement time on the x-axis. During the six full charge and discharge cycles, the electrode thickness is increasing during lithiation and decreasing during delithiation. The corresponding turning points are clearly visible in the thickness profile. For the mass curves shown in the diagram, various behaviors can be observed. For example, m/z = 2 shows cyclical behavior, whereas m/z = 39, m/z = 40, m/z = 85 and m/z = 104 show different behavior in the first cycles (formation) compared to the following cycles. The individual results and the detailed explanation of the measurement results obtained for electrochemistry, thickness change and gas analysis will be discussed in more detail in the following chapters.
The novel coupling of the operando methods dilatometry, mass spectrometry and the electrochemistry allows the direct and related investigation of the electrochemistry, change in cell thickness and gas formation during charging and discharging. Normally, these studies are carried out in individual cells [24,25,40,41]. Even if measurements are made with the same parameters, e.g., currents, etc., the results, unlike the measurement presented here, were not created in a single cell and during a single measurement. Here, we are able to measure both thickness change and gas generation at the exactly same time and the exactly same electrode in one single cell, which allows for a perfectly direct comparision.

3.2. Thickness Change

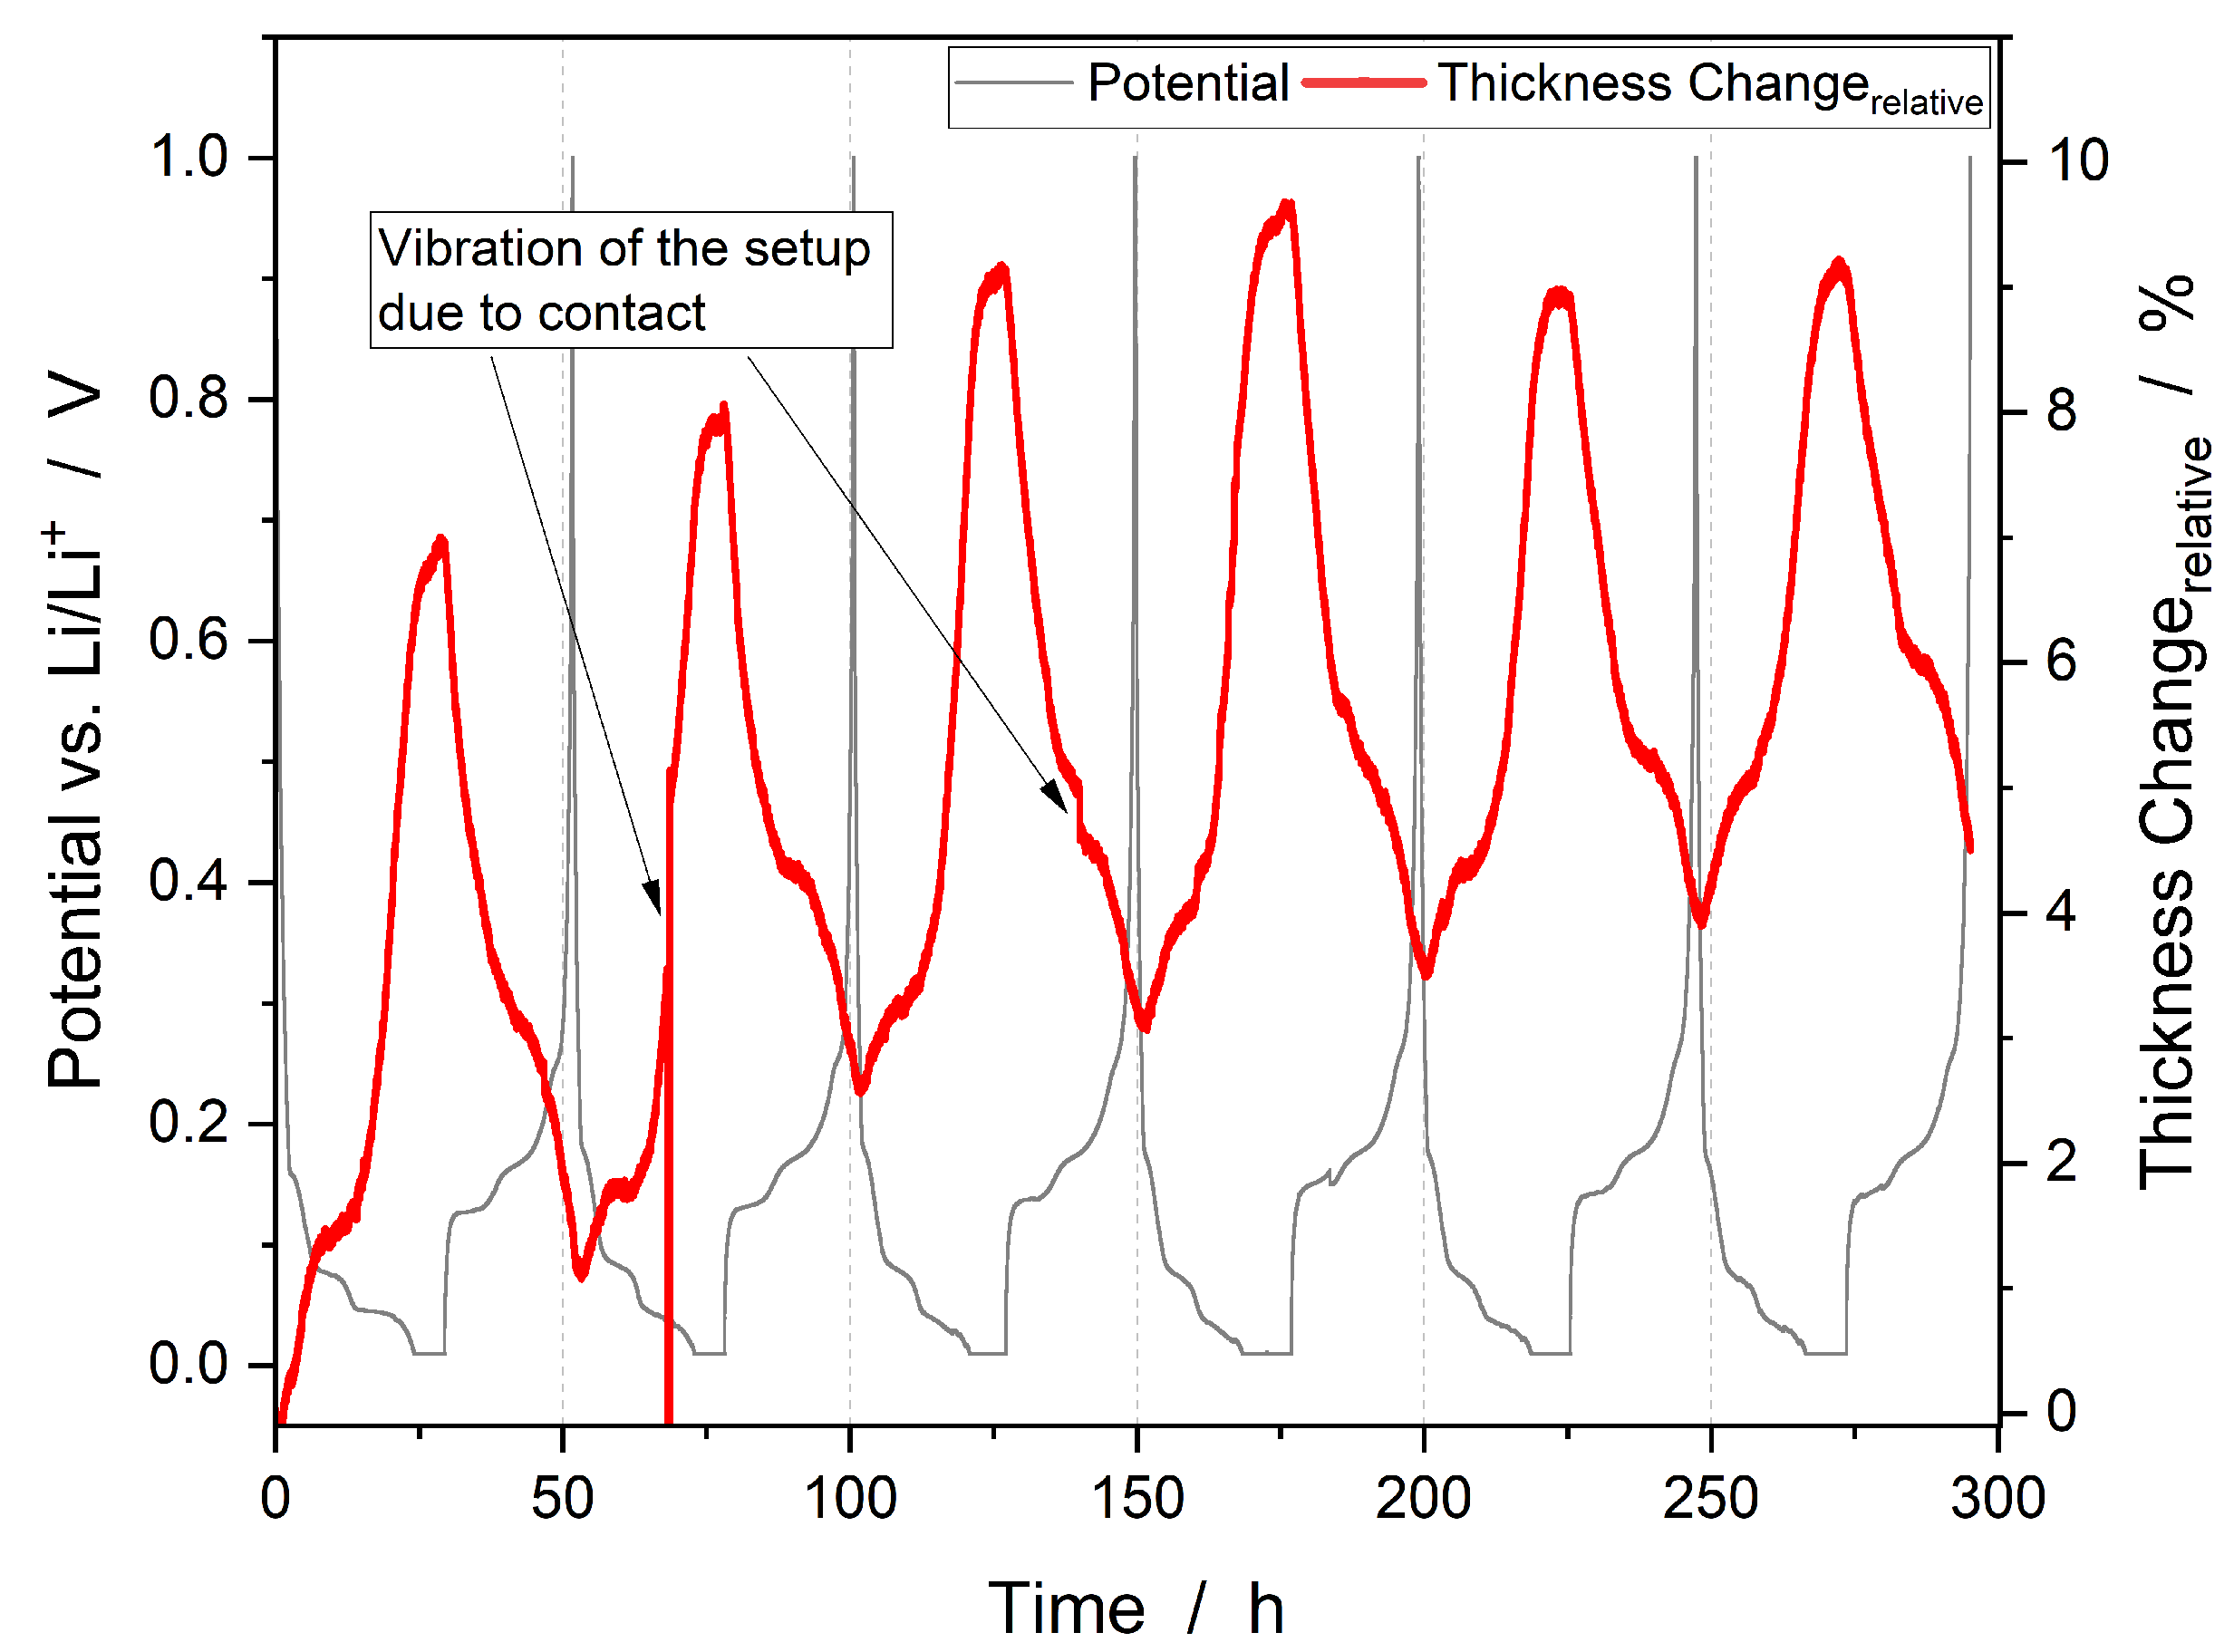
Figure 4 shows a version of Figure 3 but reduced to the potential and thickness change in the electrode during cycling for six full cycles, corresponding to approximately 300 h. A clear correlation between the voltage profile (lithiation and delithiation of graphite) and the thickness change is possible. During discharging of the half cell (i.e., lithiation of graphite), the thickness of the cell increases and during charging (i.e., delithiation of graphite), the electrode thickness decreases again [9,11]. The thickness change can be divided into a reversible and an irreversible part [10,40]. As the cycle number increases, the proportion of irreversible growth per cycle decreases. SEI formation on the particle and electrode surface is mainly responsible for the irreversible part [40,42]. Since SEI formation occurs mainly in the first cycles, i.e., during formation [43,44], the irreversible thickness change varies between 1.10% in the first cycle and 0.43% after the fifth cycle. In the case of the investigated electrode in this study, the layered structure of the graphite used as active material is responsible for the reversible portion [9,11,45], as shown in more detail in Figure 5. The values of the reversible absolute change in thickness vary at about 5–7%. These values are in a common range reported in the relevant literature [9,10,46]. However, the values vary within a certain larger or smaller range due to the fact that the particle size, porosity, binder and electrode composition have a significant influence on the change in thickness [7,11,47].
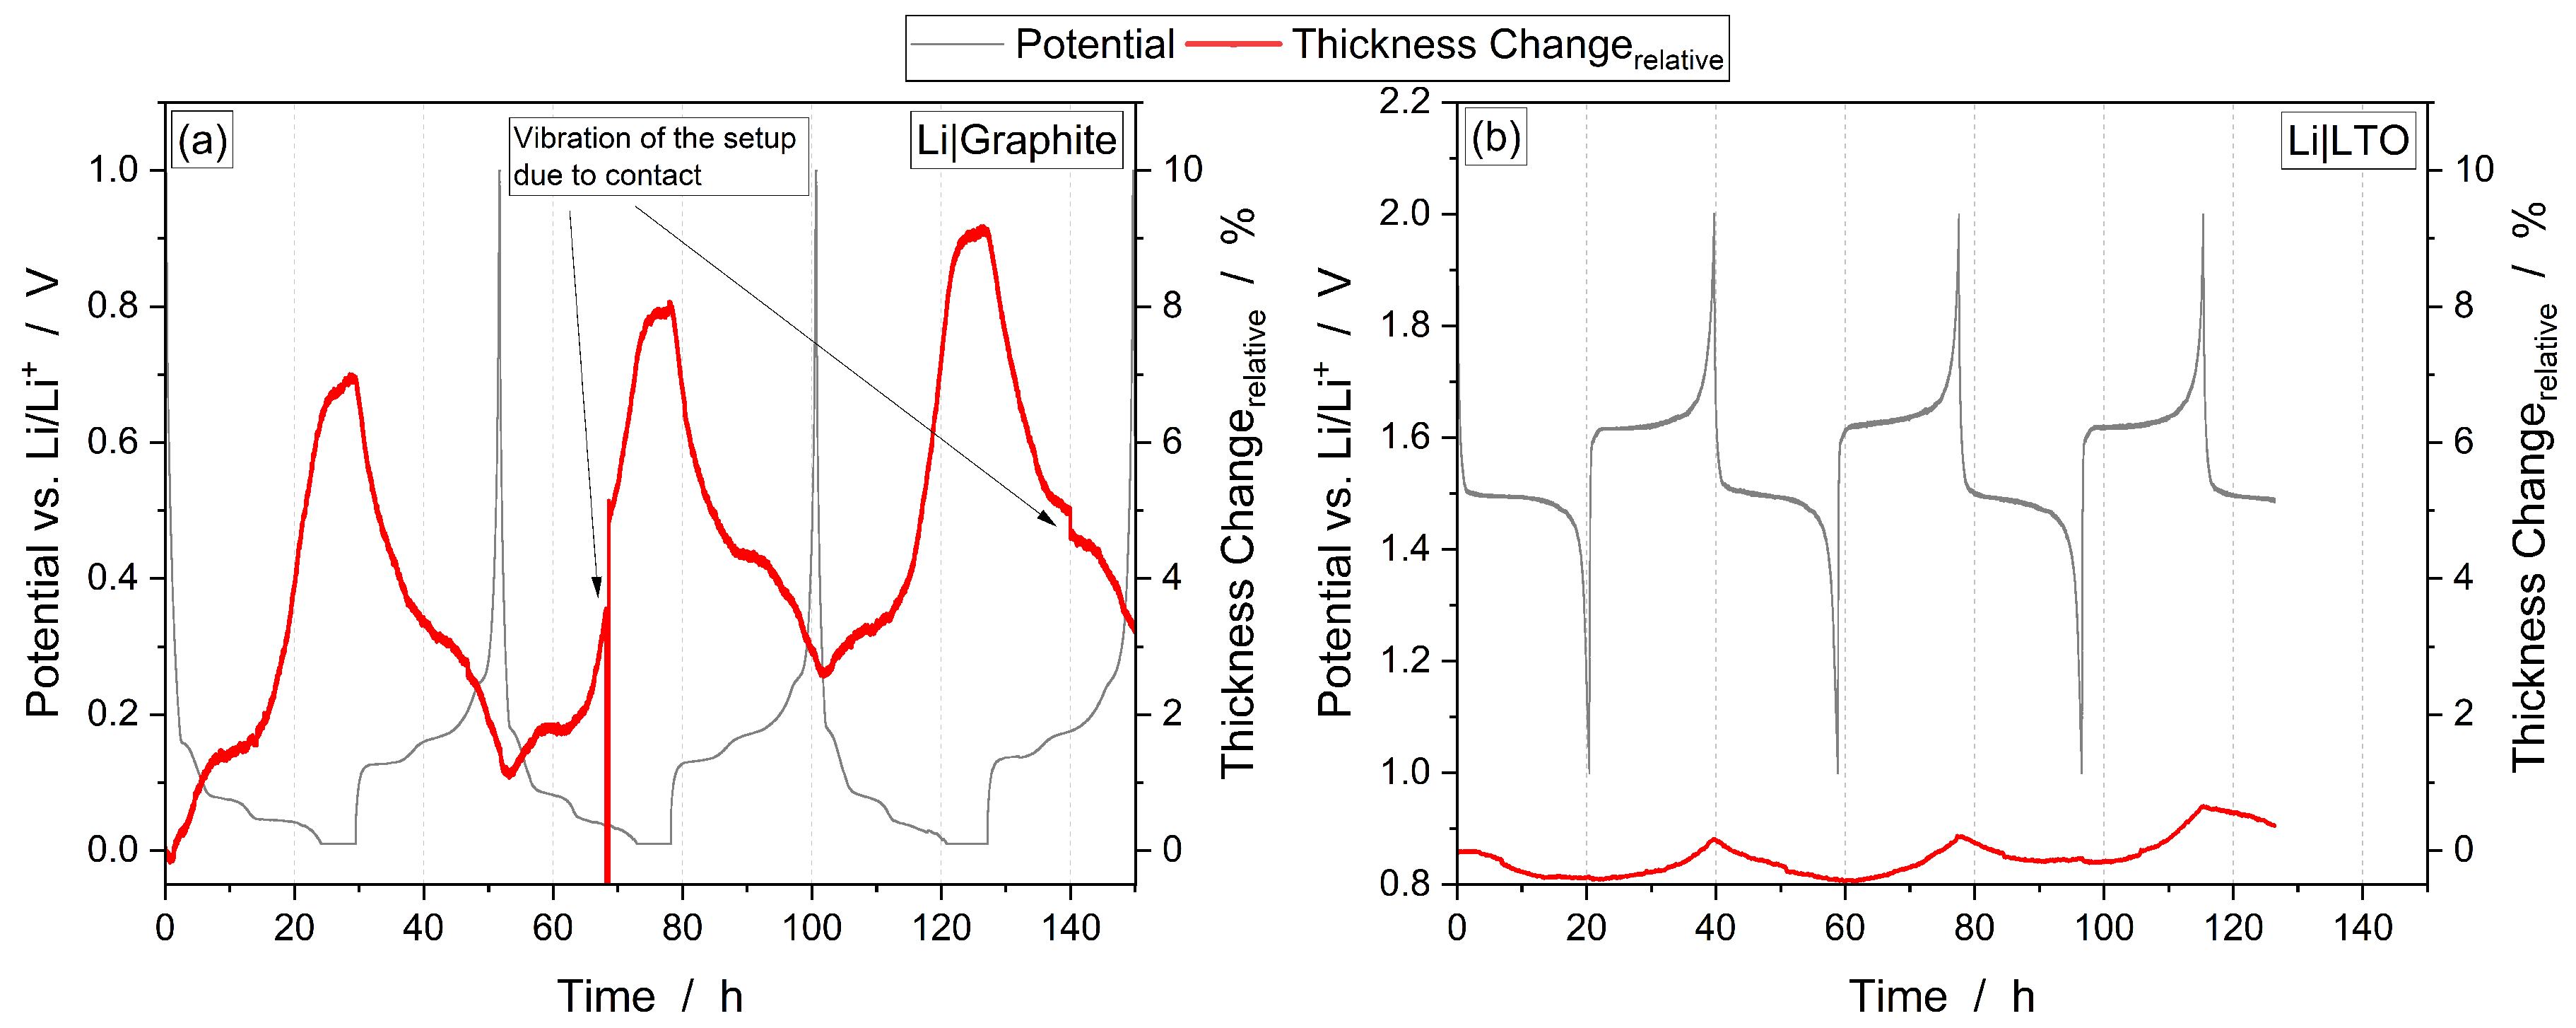
The setup is, as described in Section 2, very precise and is able to measure even the slightest changes in thickness. In Figure A1, a comparison between graphite and lithium titanium oxide (LTO), which is considered as “zero-strain” material [48,49], is shown. For the combined measurement (i.e., Li|graphite) at around hours 70 and 140, one person minimally bumped into the climate chamber with the measurement setup inside as described in the diagram.
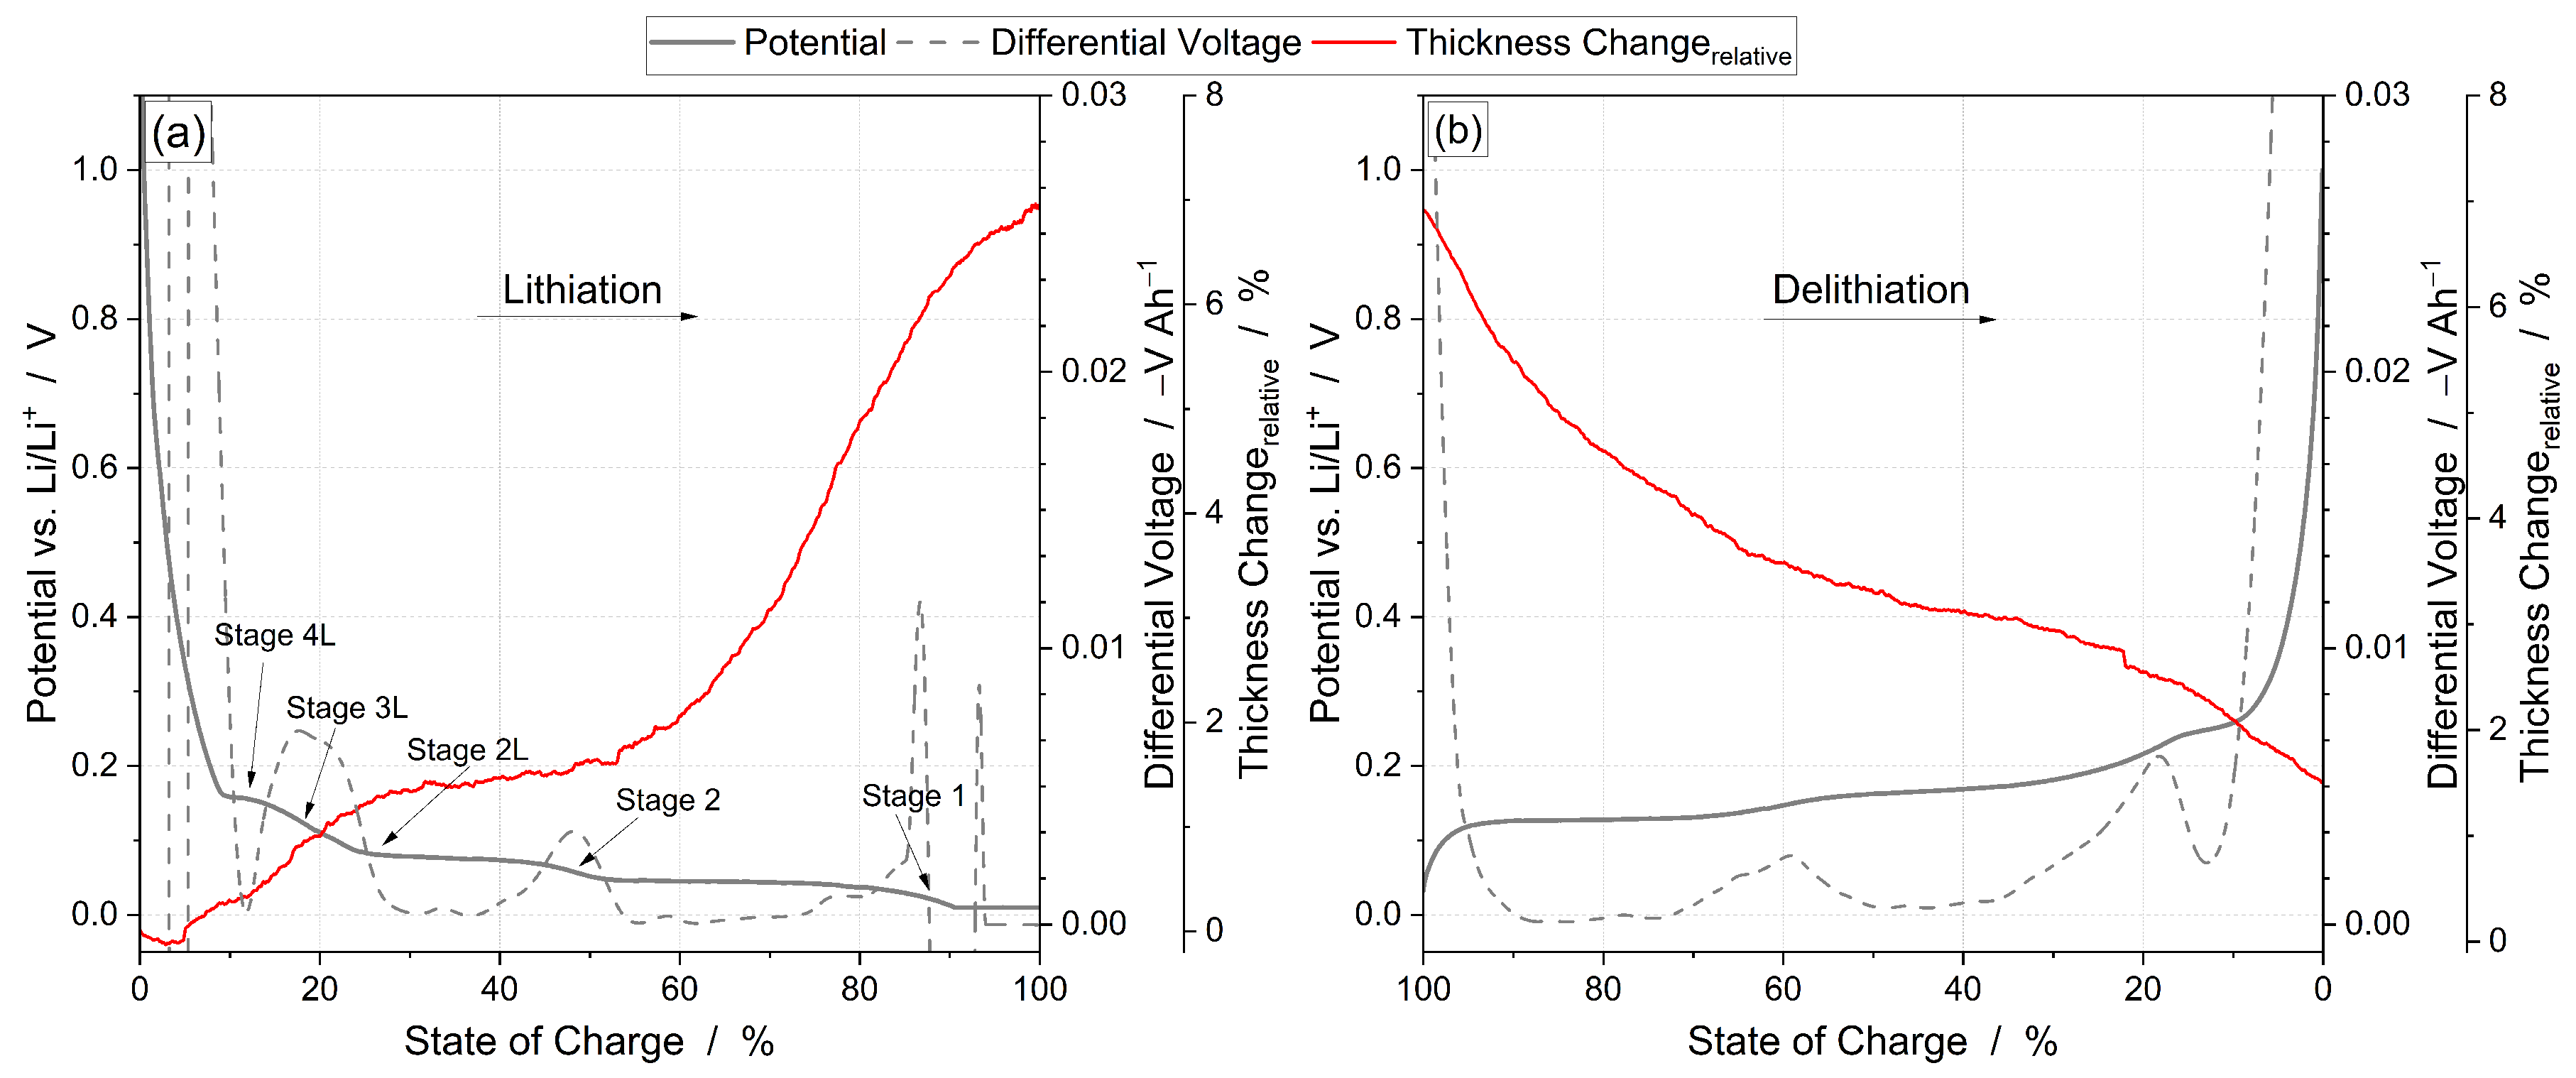
In Figure 5a, the lithiation is presented in detail and in Figure 5b, the delithiation is shown. Both diagrams show the potential on the left y-axis, the differential voltage (dU dQ−1) on the first and the thickness change on the second y-axis to the right. The data are plotted over the state of charge (SOC) of the respective half-cycle. A clear correlation between the potential curve, respectively, the differential voltage (DV) curve and the thickness change during the (half-)cycle [24], is clearly visible. The anode shows increasing thickness change during lithiation and a decrease in thickness during delithiation. The slope changes of the thickness curve fit perfectly to the peaks in the DV curve as well as the voltage plateaus in the potential curve fit to the plateaus of the thickness curve. By comparing and correlating these peaks (or the corresponding plateaus between the peaks) with the curve of the thickness change, it is visible that the thickness curve changes its slope at exactly the points where peaks occur. The opposite is true at the plateaus: at points where there are no peaks, i.e., voltage plateaus can be observed, the thickness curve remains constant or changes only minimally. This was also investigated by Dahn et al. and Asenbauer et al., and it can be explained by the staging mechanism, whereby the Li-ions are stored (or outsourced) or rearranged in the graphite layers at different voltage levels [50,51]. In Figure 5a, the graphite stages are marked. For example, the voltage plateau at 0.1 V during lithiation can be assigned to the change from stage 2 L to 2 [45,52]. The same applies for delithation but vice versa from stage 2 to 2 L [52,53].

3.3. SEI Formation and Electrolyte Degradation

The following subsection is divided into two parts. In Section 3.3.1, the operando MS results are analyzed in detail in order to detect possible gaseous intermediates depending on the potential. Section 3.3.2 furthermore presents a post-mortem analysis of the gas phase in order to qualitatively identify individual substances.

3.3.1. Operando Gas Analysis

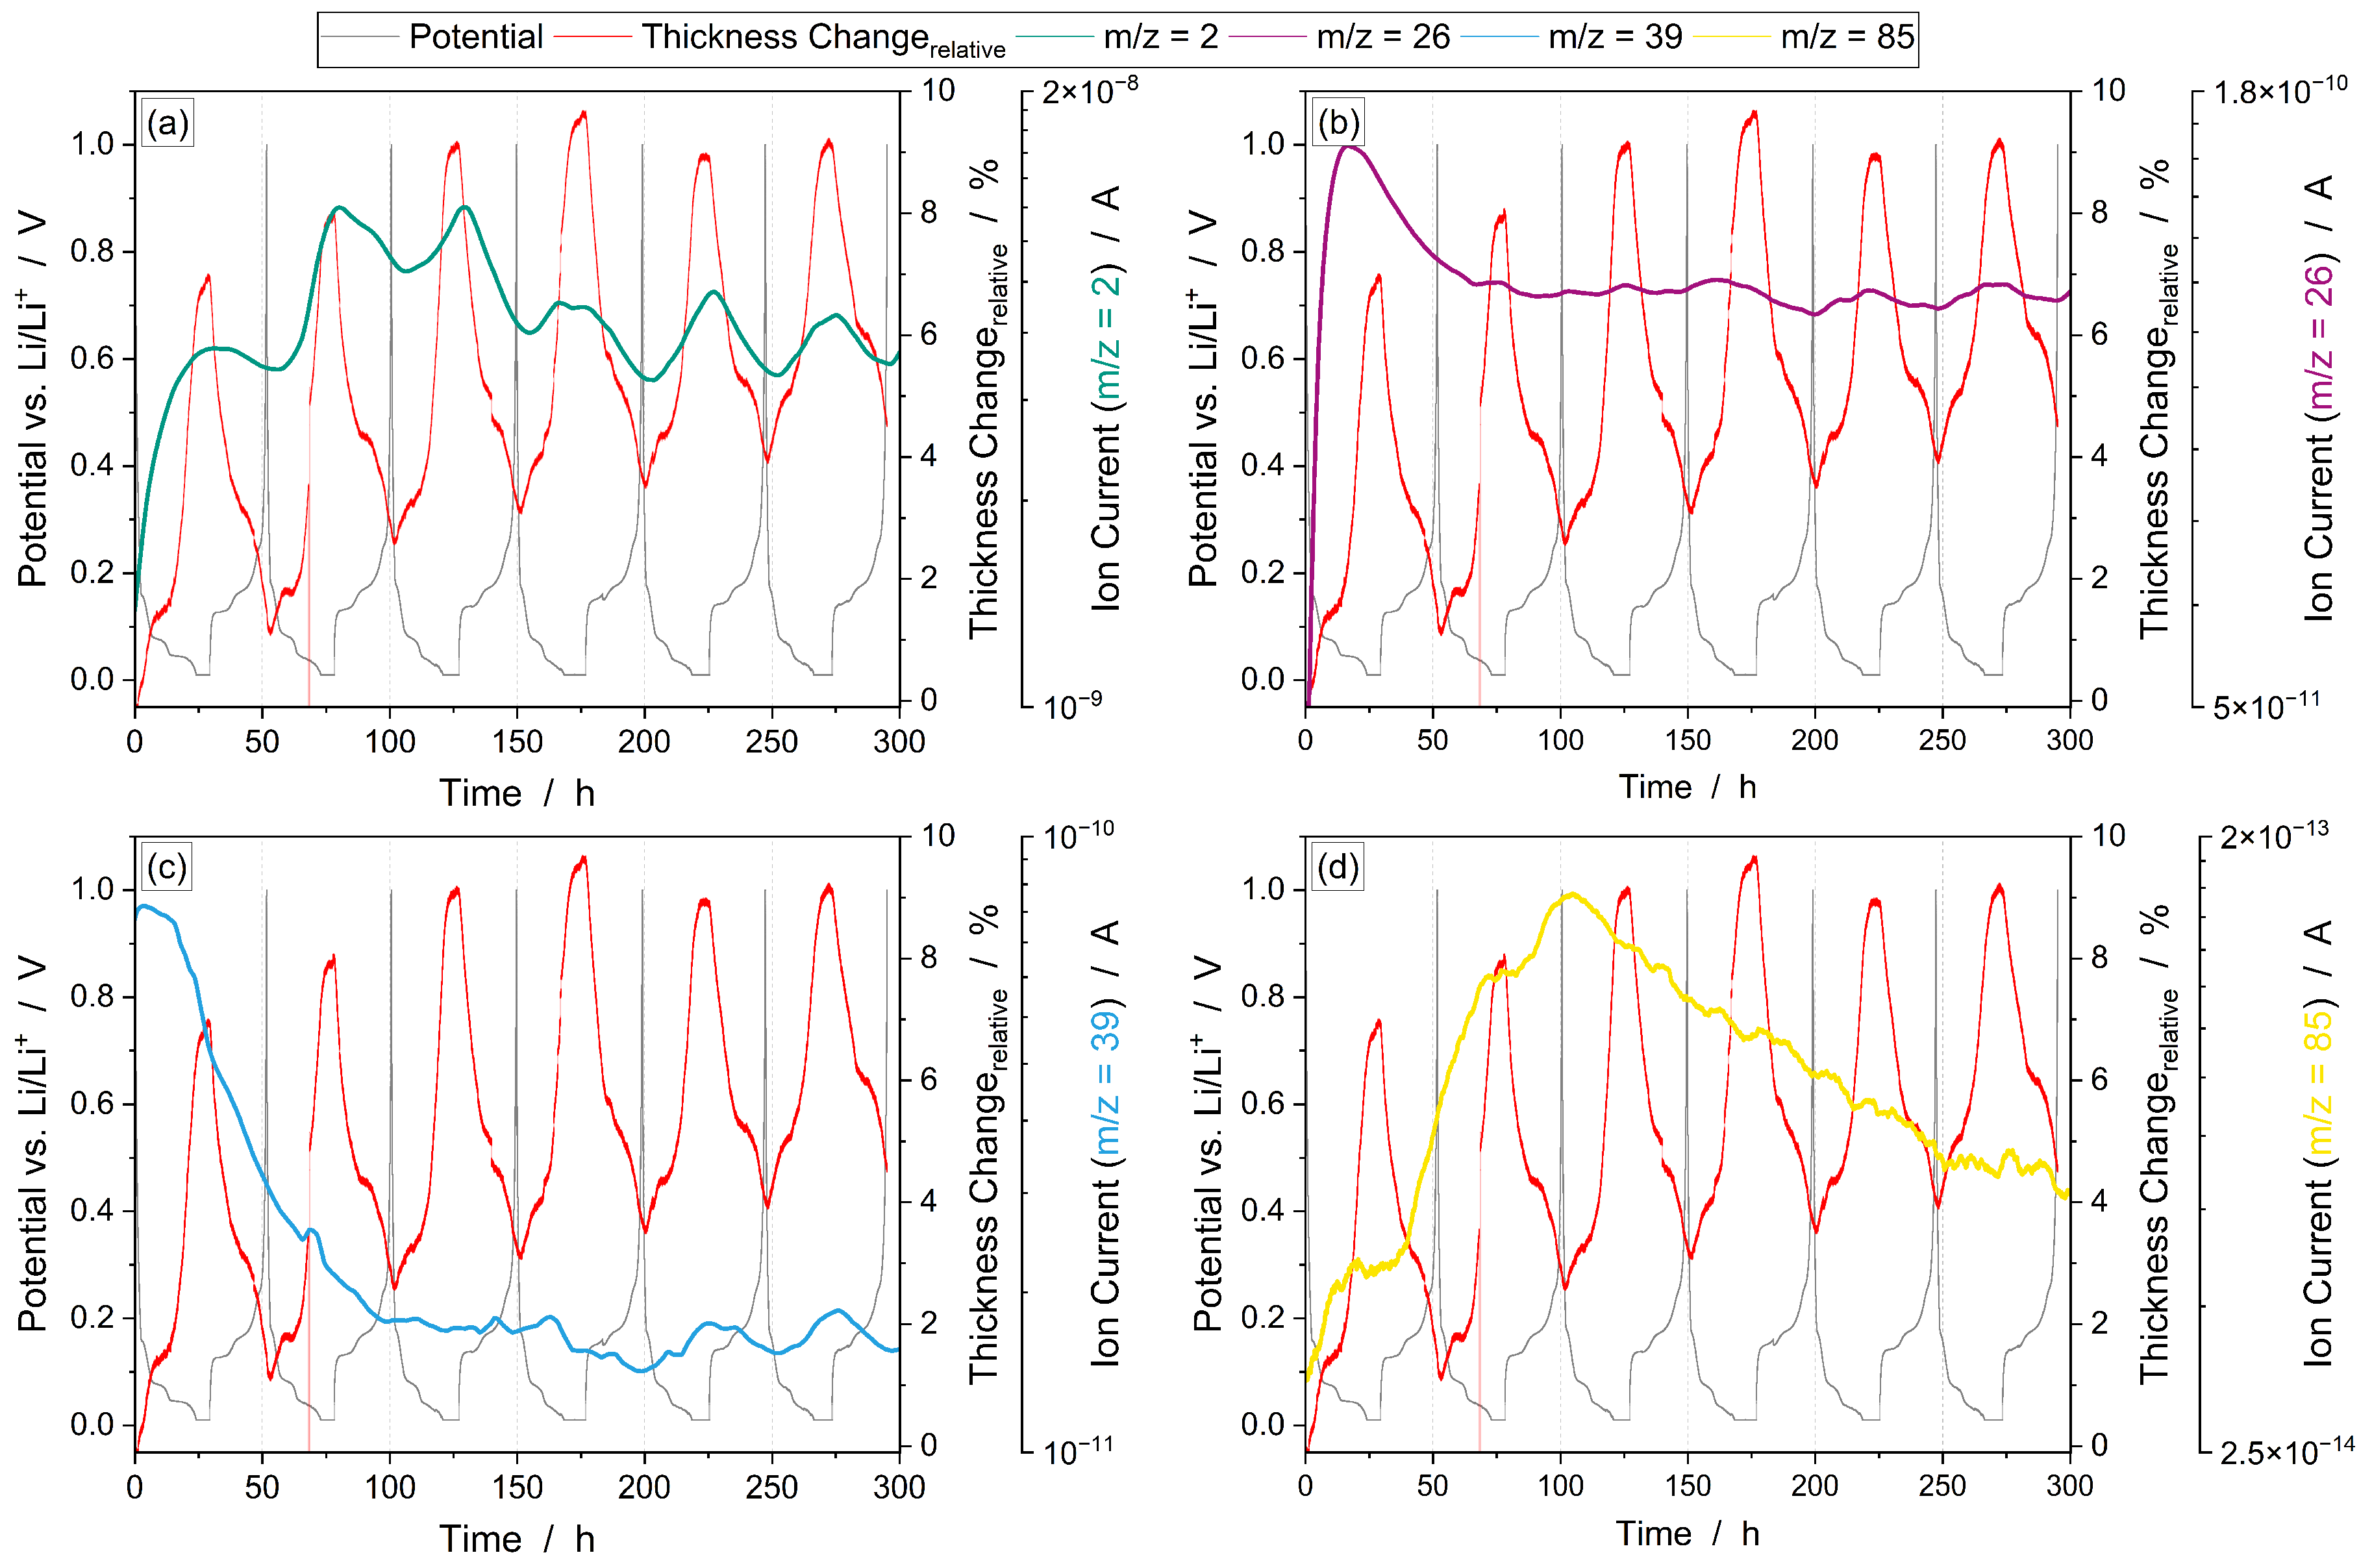
For a more differentiated evaluation, it is more helpful to plot the conspicuous mass signals individually. Here, Figure 6 displays the potential curves and operando MS analysis of selected masses with simultaneous thickness change to show a general trend of gas evolution during cycling. On the left y-axis, the potential is plotted in gray, and on the right y-axis, the thickness change in red as well as the ion current of the particular mass signal are colored, each over the time on the x-axis.
In Figure 6a, the mass course of m/z = 2 is depicted, which can be assigned to hydrogen as a typical degradation product during SEI formation and irreversible electrolyte decomposition [19,20,54,55,56]. The gassing of H2 in lithium-ion batteries is typically linked to leftover moisture. In this context, the water is reduced to hydroxide and hydrogen [19,56]. By adding vinylene carbonate (VC) to the electrolyte, Bernhard et al. demonstrated that an intact SEI prevents the reduction of water and consequently decreases the formation of hydrogen [20].
The cyclical behavior becomes even more clearly visible. At the beginning of the first lithiation, the signal increases significantly, indicating initial reactions. During the first delithiation, the signal drops slightly only to rise sharply again during the second lithiation. During the subsequent second delithiation, the signal drops again. The trend of the following cycles shows an increase in the single mass ion current during lithiation and a decrease during delithiation. The peaks in the mass curve represent the turning point between these two processes. The described mass course of m/z = 2 suggests increased stable SEI formation at the beginning of the measurement and rather electrolyte decomposition from cycle three onwards. If the thickness curve is also included, it becomes clear that the increase in the mass signal for each cycle correlates very well with the increase in the thickness change.
Figure 6b presents the ion current of m/z = 26, which can be assigned to ethene [21]. Here too, an enormous increase in the signal can be observed during the first lithiation. This can be attributed to the ongoing SEI formation, as short-chain hydrocarbons are a good indicator for this reaction. Ethene is generated directly from the electrochemical breakdown of EC [22,30,31,57] and is therefore one of the main decomposition products of the carbonate-based solvents used [58]. During the formation of the SEI, EC is primarily decomposed in comparison to the linear carbonate, in this specific case DMC. As a result, ethene emerges as the main decomposition product in the gas phase, making the most significant contribution to hydrocarbons [59].
At the start of the first delithiation, the ethene signal drops slightly and stabilizes at a high level for the following cycles. Similar to the hydrogen signal in Figure 6a, a trend can be observed for the subsequent cycles, however with a weaker characteristic. The respective increase during lithiation can be attributed to the light formation of new SEI due to repeated cracking and the exposure of fresh active material surfaces to the electrolyte. Groher et al. showed in their work that the proportion of ethene in the investigated gas phase decreased as soon as additives were added in order to obtain a more stable SEI [21]. The simultaneous observation of the thickness curve supports these findings. As described in Figure 4, the proportion of irreversible growth per cycle decreases as the number of cycles increases. This is an indication of the establishment of a stable SEI. The remaining part of the irreversible increase in thickness fits well with the course of the signal for ethene.
Figure 6c shows the mass course of m/z = 39. According to Groher et al. and Gachot et al., this specific m/z-signal can be associated with propene [21,22] and furan [21]. The origin of these two species has not yet been conclusively clarified, but it is assumed that they stem from the ring-shaped carbonate molecule EC. Within the first two cycles, the signal drops continuously and then remains at the same level. From the fifth cycle onwards, a cyclical behavior can be seen comparable to the signals of m/z = 2 and m/z = 26 already discussed. During lithiation, the signal increases, whereas it decreases again during delithiation. The curve just described can also be observed for the mass signal m/z = 40 in Figure 3. The knowledge gained provides indications of further organic decomposition processes of the electrolyte. When looking at the thickness curve at the same time, it is noticeable that the extent of the relative reversible expansion of the electrode decreases from the fifth cycle onwards.
Figure 6d illustrates the ion current of m/z = 85. During the first lithiation, the signal increases significantly only to remain on a plateau at the start of the first delithiation. In the course of delithiation, a sharp increase in the signal is observed, lasting until the end of the second cycle. From then on, the signal decreases continuously for the rest of the measurement. This specific mass signal is a good indicator for the detection of a further degradation product, since it is a characteristic signal for the conducting salt fragment POF3. This is formed during the decomposition reaction of the LiPF6 conducting salt [22,32]. Among others in organic solvents, LiPF6 is largely dissociated into its ions and is also in equilibrium with its molecular dissociation products, LiF and PF5 [60,61,62]. PF5 reacts with traces of water to form POF3 [63]. The mass signal of m/z = 85 equally applies for phosphonic difluoride, as identified by GCMS (see Figure 7). This species is quite similar to H2PO2F2, which is a further reaction product of the hydrolysis of LiPF6 in carbonate-based electrolytes described by several research groups [33,34,60]. Thus, the course of mass signal m/z = 85 indicates an increased SEI formation at the beginning of the measurement. This fact also correlates well with the thickness curve, as the irreversible portion per cycle decreases continuously in later cycles.
The method of operando MS enables access to several degradation intermediates such as POF3 and degradation products like hydrogen and ethene. These insights gained help to illustrate the decomposition processes occurring.

3.3.2. Post-Mortem Gas Analysis

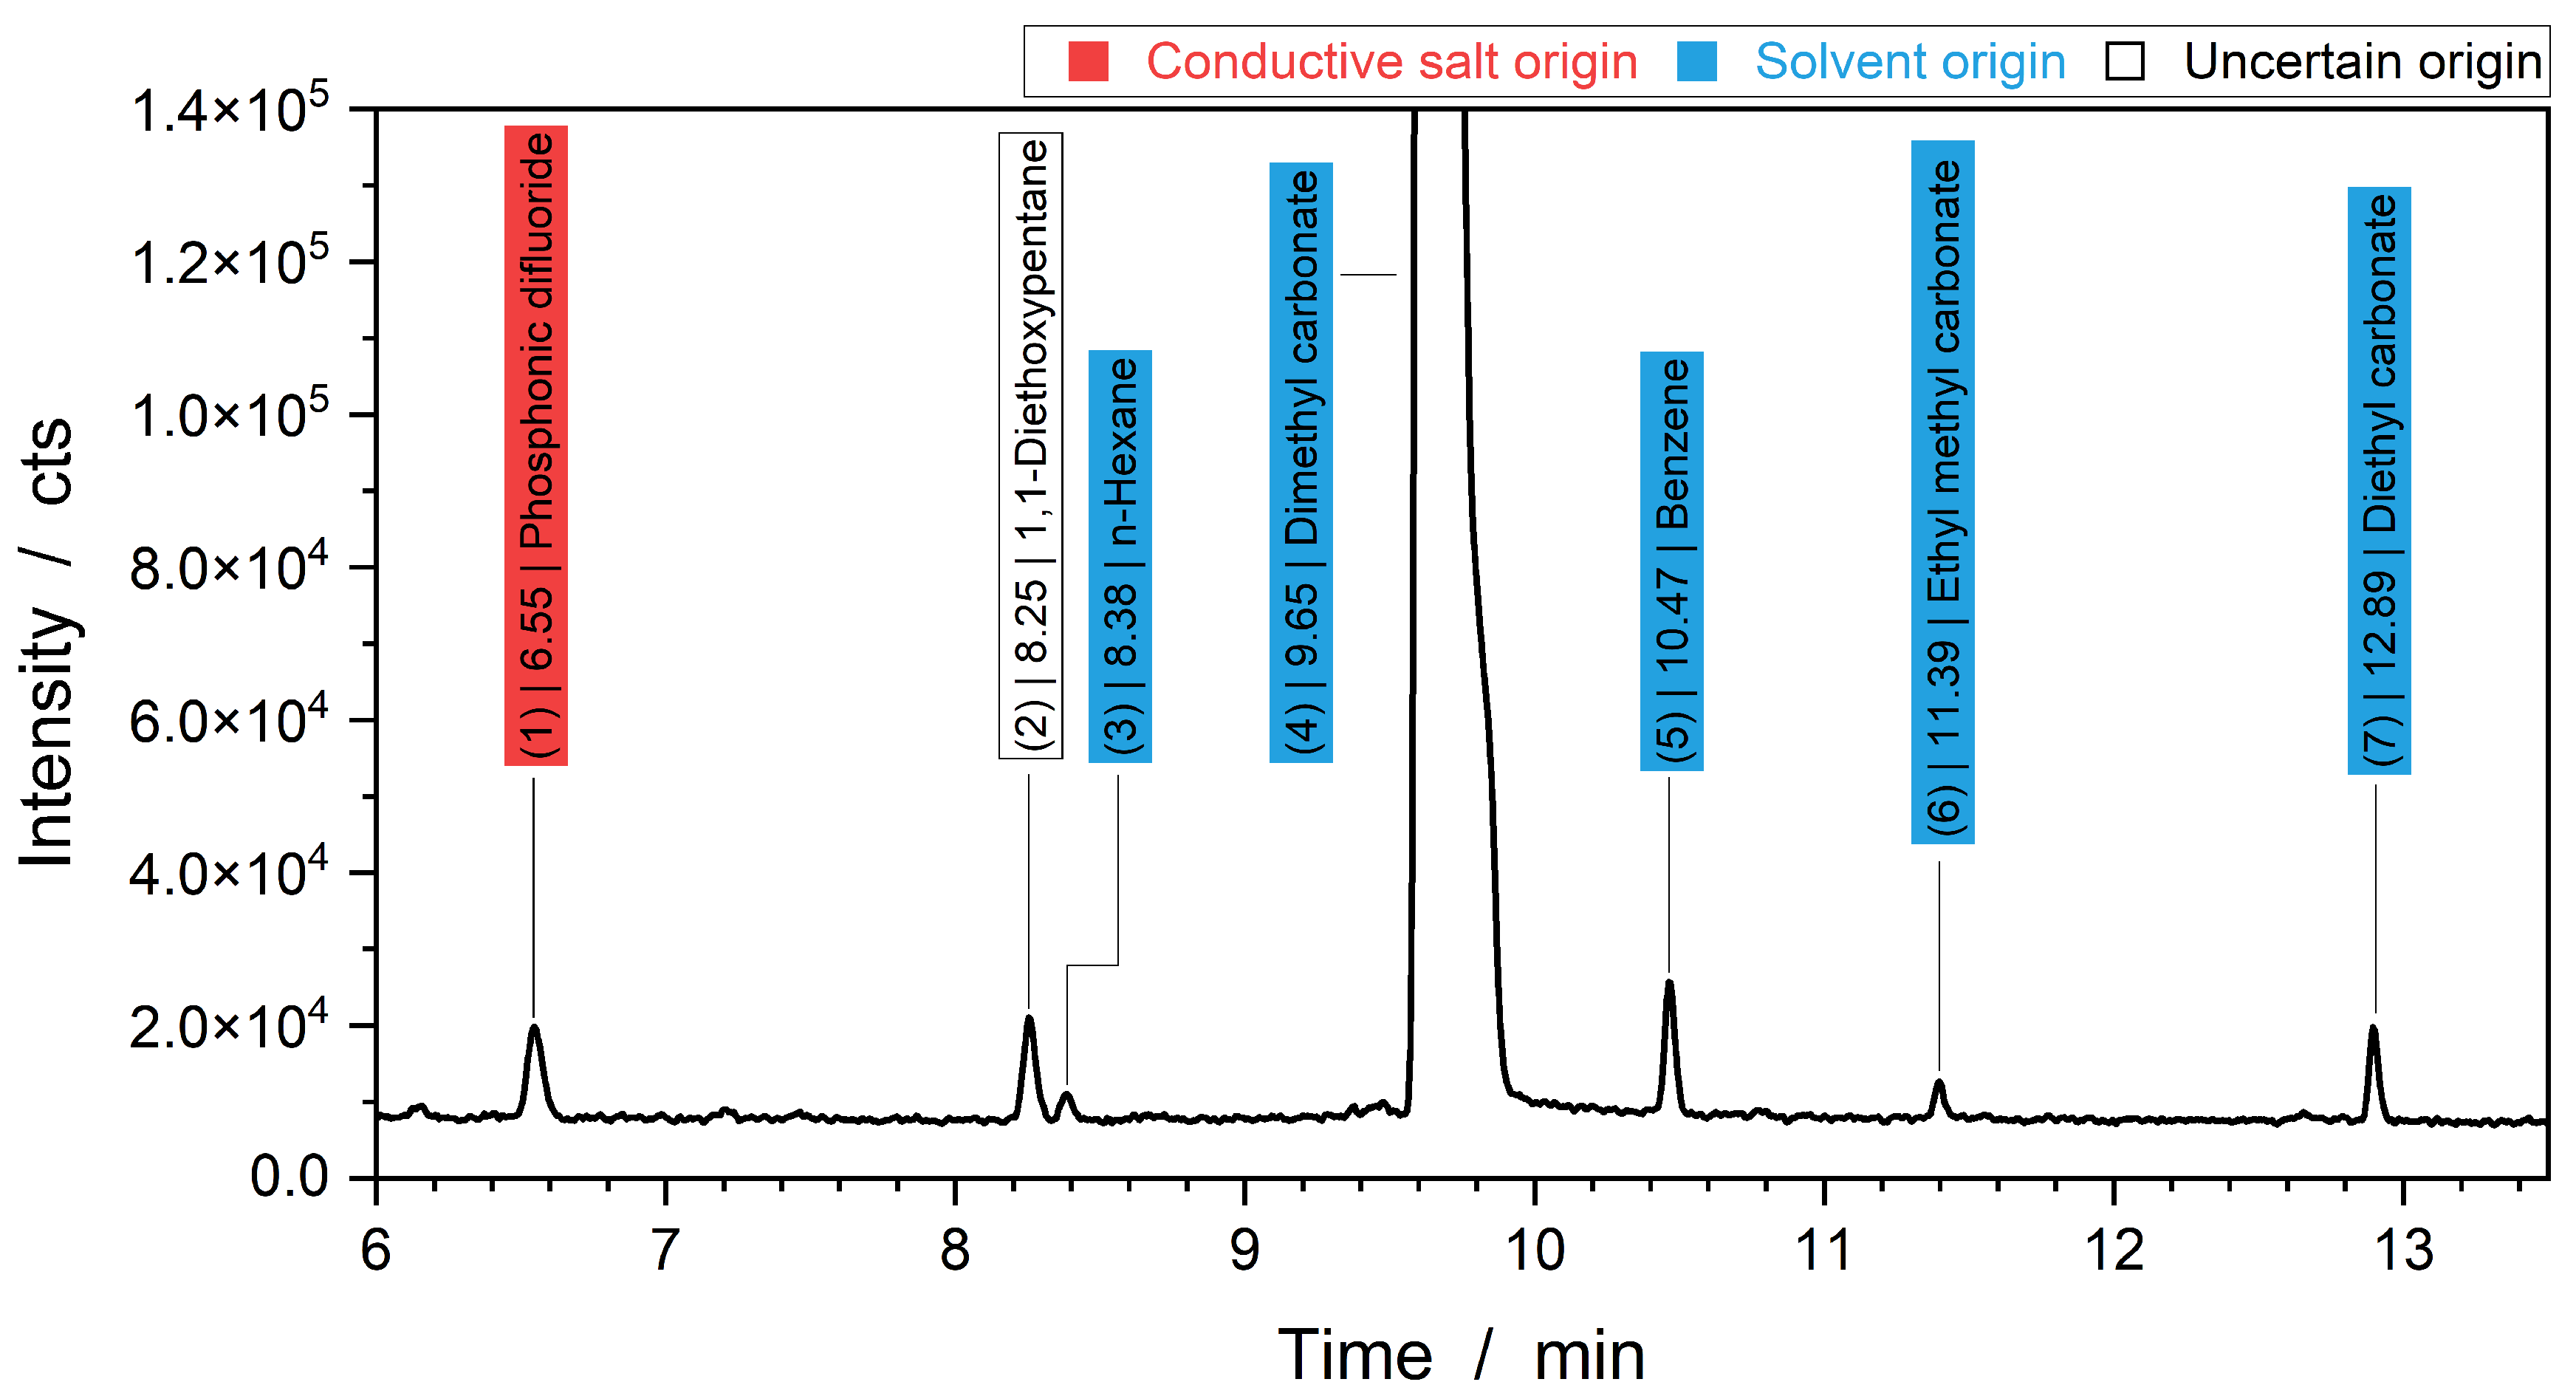
Figure 7 presents the total ion current (TIC) spectrum for the representative gas sample collected after six complete cycles (300 h). The timeframe from 6.00 min to 13.50 min features seven significant peaks, as detailed in Table 2. Substances with a light blue background originate from components produced by solvent reactions, while light red background color indicates substances originating from conductive salt decomposition pathways. Substances with a white background are of unknown origin.
After subtraction of the underlying background spectra, peaks can be assigned via NIST [39] to (1) phosphonic difluoride (6.55 min), (2) 1,1-diethoxypentane (8.25 min), (3) n-hexane (8.38 min), (4) dimethyl carbonate (9.65 min), (5) benzene (10.47 min), (6) ethyl methyl carbonate (11.39 min) and (7) diethyl carbonate (12.89 min).
Phosphonic difluoride results from the decomposition of LiPF6 contained in the electrolyte, which is comparable to findings by Gachot et al., Stich et al. and Stenzel et al. [22,34,64]. 1,1-diethoxypentane was declared by NIST with a 65.3% hit probability. However, its origin cannot be determined definitively by the authors. Assumedly, a recombination reaction of organic radicals takes place. Peak (4), n-hexane, was also identified by Kahr et al. [65] as a formation product. The most count intensive signal allocates to the main electrolyte component, dimethyl carbonate (DMC). Benzene, originating from ethylene carbonate (EC), is created by the combination of three free ethylene radicals as proposed by Nedjalkov et al. [66]. Further electrolyte recombination products are identified as ethyl methyl carbonate (EMC) and diethyl carbonate (DEC) [21,22]. Thus, the supporting post-mortem gas analysis using GCMS hightlights the existence of various degradation pathways.

4. Conclusions

This study successfully demonstrated the efficacy of a novel combined measurement cell integrating operando dilatometry and operando mass spectrometry to monitor real-time physical and chemical changes in lithium- and sodium-ion cells during electrochemical cycling on the electrode level. In order to compare the overall findings with the current literature, a well-known cell chemistry (Li|graphite half cell using 1 M LiPF6 in a 1:1 mixture by weight of EC and DMC) was examined. The results generated from one single measurement revealed significant correlations between electrochemical behavior, thickness changes and gas evolution and provided crucial insights into the aging mechanisms of lithium-ion cells.
High-resolution operando dilatometry results provided valuable insights into the reversible intercalation and displacement of Li-ions into the graphite layers. The formation of the SEI and the degradation of electrolyte components were identified as key factors contributing to irreversible changes in the electrodes.
Operando gas analysis revealed the presence of various degradation intermediates such as POF3 (from electrolyte conductive salt) as well as degradation products including hydrogen and ethene (from electrolyte solvent). All identified species were directly linked to electrolyte degradation and emphasized different decomposition pathways. Furthermore, by including the simultaneously recorded thickness curve, conclusions and correlations could be obtained about SEI formation. Additionally, post-mortem analysis confirmed the identification of compounds like phosphonic difluoride, EMC and DEC, underlining the presence of different degradation pathways.
This integrated approach by combining operando dilatometry and operando mass spectrometry enhanced our understanding of the fundamental processes governing battery aging and allowed an even more holistic view of the processes taking place, such as SEI formation, electrolyte degradation or side reactions.
Future work should focus on optimizing electrode materials and electrolytes based on the insights gained from this research and with the help of the novel combined operando tool introduced in this article, ultimately contributing to the development of more durable and efficient energy storage systems.

Author Contributions

Conceptualization, J.P.; methodology, J.P. and P.H.; validation, J.P., P.H. and S.G.; formal analysis, J.P. and P.H.; investigation, J.P., P.H. and S.G.; resources, F.K. and J.T.; data curation, J.P., P.H. and S.G.; writing—original draft preparation, J.P., P.H. and S.G.; writing—review and editing, J.P., P.H., S.G., F.K. and J.T.; visualization, P.H. and S.G.; supervision, F.K. and J.T.; project administration, J.P. and P.H.; funding acquisition, J.T. All authors have read and agreed to the published version of the manuscript.

Funding

This research was partly funded by the joint project ClusterBatt within the Fraunhofer and Max Planck cooperation program and by the joint project OsabanPlus (03XP0469C) within the German-Japanese cooperation program of BMBF (Federal Ministry for Education and Research) and NEDO (New Energy and Industrial Technology Development Organization).

Institutional Review Board Statement

Not applicable.

Informed Consent Statement

Not applicable.

Data Availability Statement

Data available within the article.

Acknowledgments

The authors thank Patrik Fanz (Fraunhofer ICT) for the construction drawings and Franziska Schneider (Fraunhofer ICT) for support in GCMS analysis.

Conflicts of Interest

The authors declare no conflicts of interest.

Abbreviations

The following abbreviations are used in this manuscript:
CCConstant current
C-SEMContinuous secondary electron multiplier
CTSCell test system
CVConstant voltage
DECDiethyl carbonate
DMCDimethyl carbonate
DVDifferential voltage
ECEthylene carbonate
EMCEthyl methyl carbonate
FIDFlame ionization detector
GCGas chromatography
LCVLower cut-off voltage
LIBLithium ion battery
LTOLithium titanium oxide
LVDTLinear variable differential transformer
MIDMultiple ion detection
MSMass spectrometry
NISTNational Institute of Standards and Technology
SEISolid electrolyte interface
SOCState of charge
TCD     Thermal conductivity detector
TICTotal ion current
UCVUpper cut-off voltage
VCVinylene carbonate

Appendix A

Figure A1. Comparison between the thickness change measured in the dilatometer of graphite (a) and lithium titanium oxide (b).
Batteries 10 00445 g0a1
In order to demonstrate the high resolution and small thicknesses that the dilatometer is able to measure, cells with lithium titanium oxide (LTO) as the working electrode were also examined for comparison. Graphite and LTO exhibit different behaviors in terms of thickness change during lithiation and delithiation processes [67]. LTO has a zero-strain property, meaning it undergoes minimal volume change during lithiation and delithiation [49]. The thickness change is typically less than 1% due to its spinel structure which accommodates lithium without significant structural alteration [48,49,68]. The same electrolyte as presented in Section 2.1 was used, and the LTO (CustomCells Itzehoe GmbH, Itzehoe, Germany) was cycled between 1.0 and 2.0 V with C/20 at constant current against lithium.
In Figure A1, the comparison between both materials in the dilatometer is shown. Figure A1a shows the thickness change of graphite, as already presented in Figure 4 in Section 3.2. Figure A1b shows the thickness change of LTO. Even the small thickness changes in the LTO electrode could be nicely measured. With increasing voltage against Li/Li+, the thickness of the electrode increases and vice versa.

References

  1. Edge, J.S.; O’Kane, S.; Prosser, R.; Kirkaldy, N.D.; Patel, A.N.; Hales, A.; Ghosh, A.; Ai, W.; Chen, J.; Yang, J.; et al. Lithium ion battery degradation: What you need to know. Phys. Chem. Chem. Phys. PCCP 2021, 23, 8200–8221. [Google Scholar] [CrossRef] [PubMed]
  2. Ko, M.; Chae, S.; Cho, J. Challenges in Accommodating Volume Change of Si Anodes for Li-Ion Batteries. ChemElectroChem 2015, 2, 1645–1651. [Google Scholar] [CrossRef] [PubMed]
  3. Essl, C.; Seifert, L.; Rabe, M.; Fuchs, A. Early Detection of Failing Automotive Batteries Using Gas Sensors. Batteries 2021, 7, 25. [Google Scholar] [CrossRef]
  4. Waldmann, T.; Iturrondobeitia, A.; Kasper, M.; Ghanbari, N.; Aguesse, F.; Bekaert, E.; Daniel, L.; Genies, S.; Gordon, I.J.; Löble, M.W.; et al. Review—Post-Mortem Analysis of Aged Lithium-Ion Batteries: Disassembly Methodology and Physico-Chemical Analysis Techniques. J. Electrochem. Soc. 2016, 163, A2149–A2164. [Google Scholar] [CrossRef]
  5. Vetter, J.; Novák, P.; Wagner, M.R.; Veit, C.; Möller, K.C.; Besenhard, J.O.; Winter, M.; Wohlfahrt-Mehrens, M.; Vogler, C.; Hammouche, A. Ageing mechanisms in lithium-ion batteries. J. Power Sources 2005, 147, 269–281. [Google Scholar] [CrossRef]
  6. Pender, J.P.; Jha, G.; Youn, D.H.; Ziegler, J.M.; Andoni, I.; Choi, E.J.; Heller, A.; Dunn, B.S.; Weiss, P.S.; Penner, R.M.; et al. Electrode Degradation in Lithium-Ion Batteries. ACS Nano 2020, 14, 1243–1295. [Google Scholar] [CrossRef]
  7. Escher, I.; Hahn, M.; Ferrero, G.A.; Adelhelm, P. A Practical Guide for Using Electrochemical Dilatometry as Operando Tool in Battery and Supercapacitor Research. Energy Technol. 2022, 10, 2101120. [Google Scholar] [CrossRef]
  8. Michael, H.; Jervis, R.; Brett, D.J.L.; Shearing, P.R. Developments in Dilatometry for Characterisation of Electrochemical Devices. Batter. Supercaps 2021, 4, 1378–1396. [Google Scholar] [CrossRef]
  9. Bauer, M.; Wachtler, M.; Stöwe, H.; Persson, J.V.; Danzer, M.A. Understanding the dilation and dilation relaxation behavior of graphite-based lithium-ion cells. J. Power Sources 2016, 317, 93–102. [Google Scholar] [CrossRef]
  10. Pegel, H.; von Kessel, O.; Heugel, P.; Deich, T.; Tübke, J.; Birke, K.P.; Sauer, D.U. Volume and thickness change of NMC811|SiOx-graphite large-format lithium-ion cells: From pouch cell to active material level. J. Power Sources 2022, 537, 231443. [Google Scholar] [CrossRef]
  11. Hahn, M.; Buqa, H.; Ruch, P.W.; Goers, D.; Spahr, M.E.; Ufheil, J.; Novák, P.; Kötz, R. A Dilatometric Study of Lithium Intercalation into Powder-Type Graphite Electrodes. Electrochem. Solid-State Lett. 2008, 11, A151. [Google Scholar] [CrossRef]
  12. Heugel, P.; Märkle, W.; Deich, T.; von Kessel, O.; Tübke, J. Thickness change and jelly roll deformation and its impact on the aging and lifetime of commercial 18650 cylindrical Li-ion cells with silicon containing anodes and nickel-rich cathodes. J. Energy Storage 2022, 53, 105101. [Google Scholar] [CrossRef]
  13. Bazlen, S.; Heugel, P.; von Kessel, O.; Commerell, W.; Tübke, J. Influence of charging protocols on the charging capability and aging of lithium-ion cells with silicon-containing anodes. J. Energy Storage 2022, 49, 104044. [Google Scholar] [CrossRef]
  14. Holzapfel, M.; Buqa, H.; Hardwick, L.J.; Hahn, M.; Würsig, A.; Scheifele, W.; Novák, P.; Kötz, R.; Veit, C.; Petrat, F.M. Nano silicon for lithium-ion batteries. Electrochim. Acta 2006, 52, 973–978. [Google Scholar] [CrossRef]
  15. Jahn, L.; Katzer, F.; Danzer, M.A. Combined dilatometry and voltage analysis for a reliable detection of lithium deposition on graphitic anodes. J. Power Sources 2022, 520, 230870. [Google Scholar] [CrossRef]
  16. Zhang, L.; Tsolakidou, C.; Mariyappan, S.; Tarascon, J.M.; Trabesinger, S. Unraveling gas evolution in sodium batteries by online electrochemical mass spectrometry. Energy Storage Mater. 2021, 42, 12–21. [Google Scholar] [CrossRef]
  17. Holzapfel, M.; Würsig, A.; Scheifele, W.; Vetter, J.; Novák, P. Oxygen, hydrogen, ethylene and CO2 development in lithium-ion batteries. J. Power Sources 2007, 174, 1156–1160. [Google Scholar] [CrossRef]
  18. Seitzinger, C.L.; Sacci, R.L.; Coyle, J.E.; Apblett, C.A.; Hays, K.A.; Armstrong, R.R.; Rogers, A.M.; Armstrong, B.L.; Bennet, T.H.; Neale, N.R.; et al. Intrinsic Chemical Reactivity of Silicon Electrode Materials: Gas Evolution. Chem. Mater. 2020, 32, 3199–3210. [Google Scholar] [CrossRef]
  19. Metzger, M.; Strehle, B.; Solchenbach, S.; Gasteiger, H.A. Origin of H2 Evolution in LIBs: H2O Reduction vs. Electrolyte Oxidation. J. Electrochem. Soc. 2016, 163, A798–A809. [Google Scholar] [CrossRef]
  20. Bernhard, R.; Metzger, M.; Gasteiger, H.A. Gas Evolution at Graphite Anodes Depending on Electrolyte Water Content and SEI Quality Studied by On-Line Electrochemical Mass Spectrometry. J. Electrochem. Soc. 2015, 162, A1984–A1989. [Google Scholar] [CrossRef]
  21. Groher, C.; Cupid, D.M.; Mautner, A.; Rosenberg, E.; Kahr, J. Operando GC/MS for the investigation of different decomposition pathways during solid electrolyte interphase (SEI) formation with SEI forming additives. J. Power Sources 2024, 605, 234481. [Google Scholar] [CrossRef]
  22. Gachot, G.; Ribière, P.; Mathiron, D.; Grugeon, S.; Armand, M.; Leriche, J.B.; Pilard, S.; Laruelle, S. Gas chromatography/mass spectrometry as a suitable tool for the Li-ion battery electrolyte degradation mechanisms study. Anal. Chem. 2011, 83, 478–485. [Google Scholar] [CrossRef] [PubMed]
  23. Geisler, J.; Pfeiffer, L.; Ferrero, G.A.; Axmann, P.; Adelhelm, P. Setup Design and Data Evaluation for DEMS in Sodium Ion Batteries, Demonstrated on a Mn–Rich Cathode Material. Batter. Supercaps 2024, 7, e202400006. [Google Scholar] [CrossRef]
  24. Heugel, P.; Petit, J.; Klein, F.; Tübke, J. Investigation of the Influence of Silicon Oxide Content on Electrolyte Degradation, Gas Evolution, and Thickness Change in Silicon Oxide/Graphite Composite Anodes for Li-Ion Cells Using Operando Techniques. Batteries 2023, 9, 449. [Google Scholar] [CrossRef]
  25. Kreissl, J.J.A.; Petit, J.; Oppermann, R.; Cop, P.; Gerber, T.; Joos, M.; Abert, M.; Tübke, J.; Miyazaki, K.; Abe, T.; et al. Electrochemical Lithiation/Delithiation of ZnO in 3D-Structured Electrodes: Elucidating the Mechanism and the Solid Electrolyte Interphase Formation. ACS Appl. Mater. Interfaces 2021, 13, 35625–35638. [Google Scholar] [CrossRef]
  26. Winter, M. The Solid Electrolyte Interphase—The Most Important and the Least Understood Solid Electrolyte in Rechargeable Li Batteries. Z. Phys. Chem. 2009, 223, 1395–1406. [Google Scholar] [CrossRef]
  27. Rumberg, B.; Epding, B.; Stradtmann, I.; Kwade, A. Identification of Li ion battery cell aging mechanisms by half-cell and full-cell open-circuit-voltage characteristic analysis. J. Energy Storage 2019, 25, 100890. [Google Scholar] [CrossRef]
  28. Heiskanen, S.K.; Kim, J.; Lucht, B.L. Generation and Evolution of the Solid Electrolyte Interphase of Lithium-Ion Batteries. Joule 2019, 3, 2322–2333. [Google Scholar] [CrossRef]
  29. Gerasimov, M.; Soto, F.A.; Wagner, J.; Baakes, F.; Guo, N.; Ospina-Acevedo, F.; Röder, F.; Balbuena, P.B.; Krewer, U. Species Distribution During Solid Electrolyte Interphase Formation on Lithium Using MD/DFT-Parameterized Kinetic Monte Carlo Simulations. J. Phys. Chem. C 2023, 127, 4872–4886. [Google Scholar] [CrossRef]
  30. Zhang, B.; Metzger, M.; Solchenbach, S.; Payne, M.; Meini, S.; Gasteiger, H.A.; Garsuch, A.; Lucht, B.L. Role of 1,3-Propane Sultone and Vinylene Carbonate in Solid Electrolyte Interface Formation and Gas Generation. J. Phys. Chem. C 2015, 119, 11337–11348. [Google Scholar] [CrossRef]
  31. Nie, M.; Chalasani, D.; Abraham, D.P.; Chen, Y.; Bose, A.; Lucht, B.L. Lithium Ion Battery Graphite Solid Electrolyte Interphase Revealed by Microscopy and Spectroscopy. J. Phys. Chem. C 2013, 117, 1257–1267. [Google Scholar] [CrossRef]
  32. Ravdel, B.; Abraham, K.; Gitzendanner, R.; DiCarlo, J.; Lucht, B.; Campion, C. Thermal stability of lithium-ion battery electrolytes. J. Power Sources 2003, 119–121, 805–810. [Google Scholar] [CrossRef]
  33. Terborg, L.; Nowak, S.; Passerini, S.; Winter, M.; Karst, U.; Haddad, P.R.; Nesterenko, P.N. Ion chromatographic determination of hydrolysis products of hexafluorophosphate salts in aqueous solution. Anal. Chim. Acta 2012, 714, 121–126. [Google Scholar] [CrossRef] [PubMed]
  34. Stich, M.; Göttlinger, M.; Kurniawan, M.; Schmidt, U.; Bund, A. Hydrolysis of LiPF6 in Carbonate-Based Electrolytes for Lithium-Ion Batteries and in Aqueous Media. J. Phys. Chem. C 2018, 122, 8836–8842. [Google Scholar] [CrossRef]
  35. Han, J.G.; Kim, K.; Lee, Y.; Choi, N.S. Scavenging Materials to Stabilize LiPF6 -Containing Carbonate-Based Electrolytes for Li-Ion Batteries. Adv. Mater. 2019, 31, e1804822. [Google Scholar] [CrossRef]
  36. Kanayama, K.; Takahashi, S.; Nakamura, H.; Tezuka, T.; Maruta, K. Experimental and modeling study on pyrolysis of ethylene carbonate/dimethyl carbonate mixture. Combust. Flame 2022, 245, 112359. [Google Scholar] [CrossRef]
  37. Han, K.S.; Lee, M.S.; Kim, N.; Choi, D.; Chae, S.; Ryu, J.; Piccini, G.; Rousseau, R.; Thomsen, E.C. Lithium-ion hopping weakens thermal stability of LiPF6 carbonate electrolytes. Cell Rep. Phys. Sci. 2024, 5, 101768. [Google Scholar] [CrossRef]
  38. Ein-Eli, Y. Dimethyl carbonate (DMC) electrolytes—The effect of solvent purity on Li–ion intercalation into graphite anodes. Electrochem. Commun. 2002, 4, 644–648. [Google Scholar] [CrossRef]
  39. National Institute of Standards and Technology. The NIST Mass Spectral Search Program 2.3; National Institute of Standards and Technology: Gaithersburg, MD, USA, 2017. [Google Scholar]
  40. Sauerteig, D.; Ivanov, S.; Reinshagen, H.; Bund, A. Reversible and irreversible dilation of lithium-ion battery electrodes investigated by in-situ dilatometry. J. Power Sources 2017, 342, 939–946. [Google Scholar] [CrossRef]
  41. Daubinger, P.; Ebert, F.; Hartmann, S.; Giffin, G.A. Impact of electrochemical and mechanical interactions on lithium-ion battery performance investigated by operando dilatometry. J. Power Sources 2021, 488, 229457. [Google Scholar] [CrossRef]
  42. Ivanov, S.; Sauerteig, D.; Dimitrova, A.; Krischok, S.; Bund, A. Irreversible dilation of graphite composite anodes influenced by vinylene carbonate. J. Power Sources 2020, 457, 228020. [Google Scholar] [CrossRef]
  43. An, S.J.; Li, J.; Daniel, C.; Mohanty, D.; Nagpure, S.; Wood, D.L. The state of understanding of the lithium-ion-battery graphite solid electrolyte interphase (SEI) and its relationship to formation cycling. Carbon 2016, 105, 52–76. [Google Scholar] [CrossRef]
  44. Wang, A.; Kadam, S.; Li, H.; Shi, S.; Qi, Y. Review on modeling of the anode solid electrolyte interphase (SEI) for lithium-ion batteries. Npj Comput. Mater. 2018, 4, 15. [Google Scholar] [CrossRef]
  45. Ohzuku, T.; Iwakoshi, Y.; Sawai, K. Formation of Lithium–Graphite Intercalation Compounds in Nonaqueous Electrolytes and Their Application as a Negative Electrode for a Lithium Ion (Shuttlecock) Cell. J. Electrochem. Soc. 1993, 140, 2490. [Google Scholar] [CrossRef]
  46. Fill, A.; Zhan, M.; Stapf, N.; Hemmerling, J.; Avdyli, A.; Petit, J.; Heugel, P.; Tübke, J.; Birke, K.P. Electro-mechanical Li-Ion Cell Model considering the composite Graphite-Silicon Structure of the negative Electrode. In Proceedings of the 2024 7th International Conference on Electrical Engineering and Green Energy (CEEGE), Los Angeles, CA, USA, 28 June–1 July 2024; IEEE: Piscataway, NJ, USA, 2024; pp. 186–192. [Google Scholar] [CrossRef]
  47. Lory, P.F.; Mathieu, B.; Genies, S.; Reynier, Y.; Boulineau, A.; Hong, W.; Chandesris, M. Probing Silicon Lithiation in Silicon-Carbon Blended Anodes with a Multi-Scale Porous Electrode Model. J. Electrochem. Soc. 2020, 167, 120506. [Google Scholar] [CrossRef]
  48. Assefa, T.A.; Suzana, A.F.; Wu, L.; Koch, R.J.; Li, L.; Cha, W.; Harder, R.J.; Bozin, E.S.; Wang, F.; Robinson, I.K. Imaging the Phase Transformation in Single Particles of the Lithium Titanate Anode for Lithium-Ion Batteries. ACS Appl. Energy Mater. 2021, 4, 111–118. [Google Scholar] [CrossRef]
  49. Mukai, K.; Kato, Y.; Nakano, H. Understanding the Zero-Strain Lithium Insertion Scheme of Li[Li1/3Ti5/3]O4: Structural Changes at Atomic Scale Clarified by Raman Spectroscopy. J. Phys. Chem. C 2014, 118, 2992–2999. [Google Scholar] [CrossRef]
  50. Dahn. Phase diagram of LixC6. Phys. Rev. B Condens. Matter 1991, 44, 9170–9177. [Google Scholar] [CrossRef]
  51. Asenbauer, J.; Eisenmann, T.; Kuenzel, M.; Kazzazi, A.; Chen, Z.; Bresser, D. The success story of graphite as a lithium-ion anode material—Fundamentals, remaining challenges, and recent developments including silicon (oxide) composites. Sustain. Energy Fuels 2020, 4, 5387–5416. [Google Scholar] [CrossRef]
  52. Schmitt, C.; Kube, A.; Wagner, N.; Friedrich, K.A. Understanding the Influence of Temperature on Phase Evolution during Lithium–Graphite (De-)Intercalation Processes: An Operando X-ray Diffraction Study. ChemElectroChem 2022, 9, e202101342. [Google Scholar] [CrossRef]
  53. Schweidler, S.; de Biasi, L.; Schiele, A.; Hartmann, P.; Brezesinski, T.; Janek, J. Volume Changes of Graphite Anodes Revisited: A Combined Operando X-ray Diffraction and In Situ Pressure Analysis Study. J. Phys. Chem. C 2018, 122, 8829–8835. [Google Scholar] [CrossRef]
  54. Belharouak, I.; Koenig, G.M.; Amine, K. Electrochemistry and safety of Li4Ti5O12 and graphite anodes paired with LiMn2O4 for hybrid electric vehicle Li-ion battery applications. J. Power Sources 2011, 196, 10344–10350. [Google Scholar] [CrossRef]
  55. Belharouak, I.; Koenig, G.M.; Tan, T.; Yumoto, H.; Ota, N.; Amine, K. Performance Degradation and Gassing of Li4Ti5O12/LiMn2O4 Lithium-Ion Cells. J. Electrochem. Soc. 2012, 159, A1165–A1170. [Google Scholar] [CrossRef]
  56. Bernhard, R.; Meini, S.; Gasteiger, H.A. On-Line Electrochemical Mass Spectrometry Investigations on the Gassing Behavior of Li4Ti5O12 Electrodes and Its Origins. J. Electrochem. Soc. 2014, 161, A497–A505. [Google Scholar] [CrossRef]
  57. Lanz, M.; Novák, P. DEMS study of gas evolution at thick graphite electrodes for lithium-ion batteries: The effect of gamma-butyrolactone. J. Power Sources 2001, 102, 277–282. [Google Scholar] [CrossRef]
  58. Pritzl, D.; Solchenbach, S.; Wetjen, M.; Gasteiger, H.A. Analysis of Vinylene Carbonate (VC) as Additive in Graphite/LiNi0.5Mn1.5O4 Cells. J. Electrochem. Soc. 2017, 164, A2625–A2635. [Google Scholar] [CrossRef]
  59. Kriston, A.; Adanouj, I.; Ruiz, V.; Pfrang, A. Quantification and simulation of thermal decomposition reactions of Li-ion battery materials by simultaneous thermal analysis coupled with gas analysis. J. Power Sources 2019, 435, 226774. [Google Scholar] [CrossRef]
  60. Plakhotnyk, A.V.; Ernst, L.; Schmutzler, R. Hydrolysis in the system LiPF6—Propylene carbonate—Dimethyl carbonate—H2O. J. Fluor. Chem. 2005, 126, 27–31. [Google Scholar] [CrossRef]
  61. Sloop, S.E.; Pugh, J.K.; Wang, S.; Kerr, J.B.; Kinoshita, K. Chemical Reactivity of PF5 and LiPF6 in Ethylene Carbonate/Dimethyl Carbonate Solutions. Electrochem. Solid-State Lett. 2001, 4, A42. [Google Scholar] [CrossRef]
  62. Terborg, L.; Weber, S.; Blaske, F.; Passerini, S.; Winter, M.; Karst, U.; Nowak, S. Investigation of thermal aging and hydrolysis mechanisms in commercial lithium ion battery electrolyte. J. Power Sources 2013, 242, 832–837. [Google Scholar] [CrossRef]
  63. Tasaki, K.; Kanda, K.; Nakamura, S.; Ue, M. Decomposition of LiPF6 and Stability of PF5 in Li-Ion Battery Electrolytes. J. Electrochem. Soc. 2003, 150, A1628. [Google Scholar] [CrossRef]
  64. Stenzel, Y.; Horsthemke, F.; Winter, M.; Nowak, S. Chromatographic Techniques in the Research Area of Lithium Ion Batteries: Current State-of-the-Art. Separations 2019, 6, 26. [Google Scholar] [CrossRef]
  65. Kahr, J.; Groher, C.; Schierer, V.; Rosenberg, E.; Jahn, M. Operando gas chromatography mass spectrometry for the continuous study of overcharge-induced electrolyte decomposition in lithium-ion batteries. J. Power Sources 2024, 615, 235038. [Google Scholar] [CrossRef]
  66. Nedjalkov, A.; Meyer, J.; Köhring, M.; Doering, A.; Angelmahr, M.; Dahle, S.; Sander, A.; Fischer, A.; Schade, W. Toxic Gas Emissions from Damaged Lithium Ion Batteries—Analysis and Safety Enhancement Solution. Batteries 2016, 2, 5. [Google Scholar] [CrossRef]
  67. Daubinger, P.; Göttlinger, M.; Hartmann, S.; Giffin, G.A. Consequences of Different Pressures and Electrolytes on the Irreversible Expansion of Lithium Metal Half Cells. Batter. Supercaps 2023, 6, e202200452. [Google Scholar] [CrossRef]
  68. Mukai, K.; Yamada, I. High-pressure study of Li[Li1/3Ti5/3]O4 spinel. Inorg. Chem. Front. 2018, 5, 1941–1949. [Google Scholar] [CrossRef]
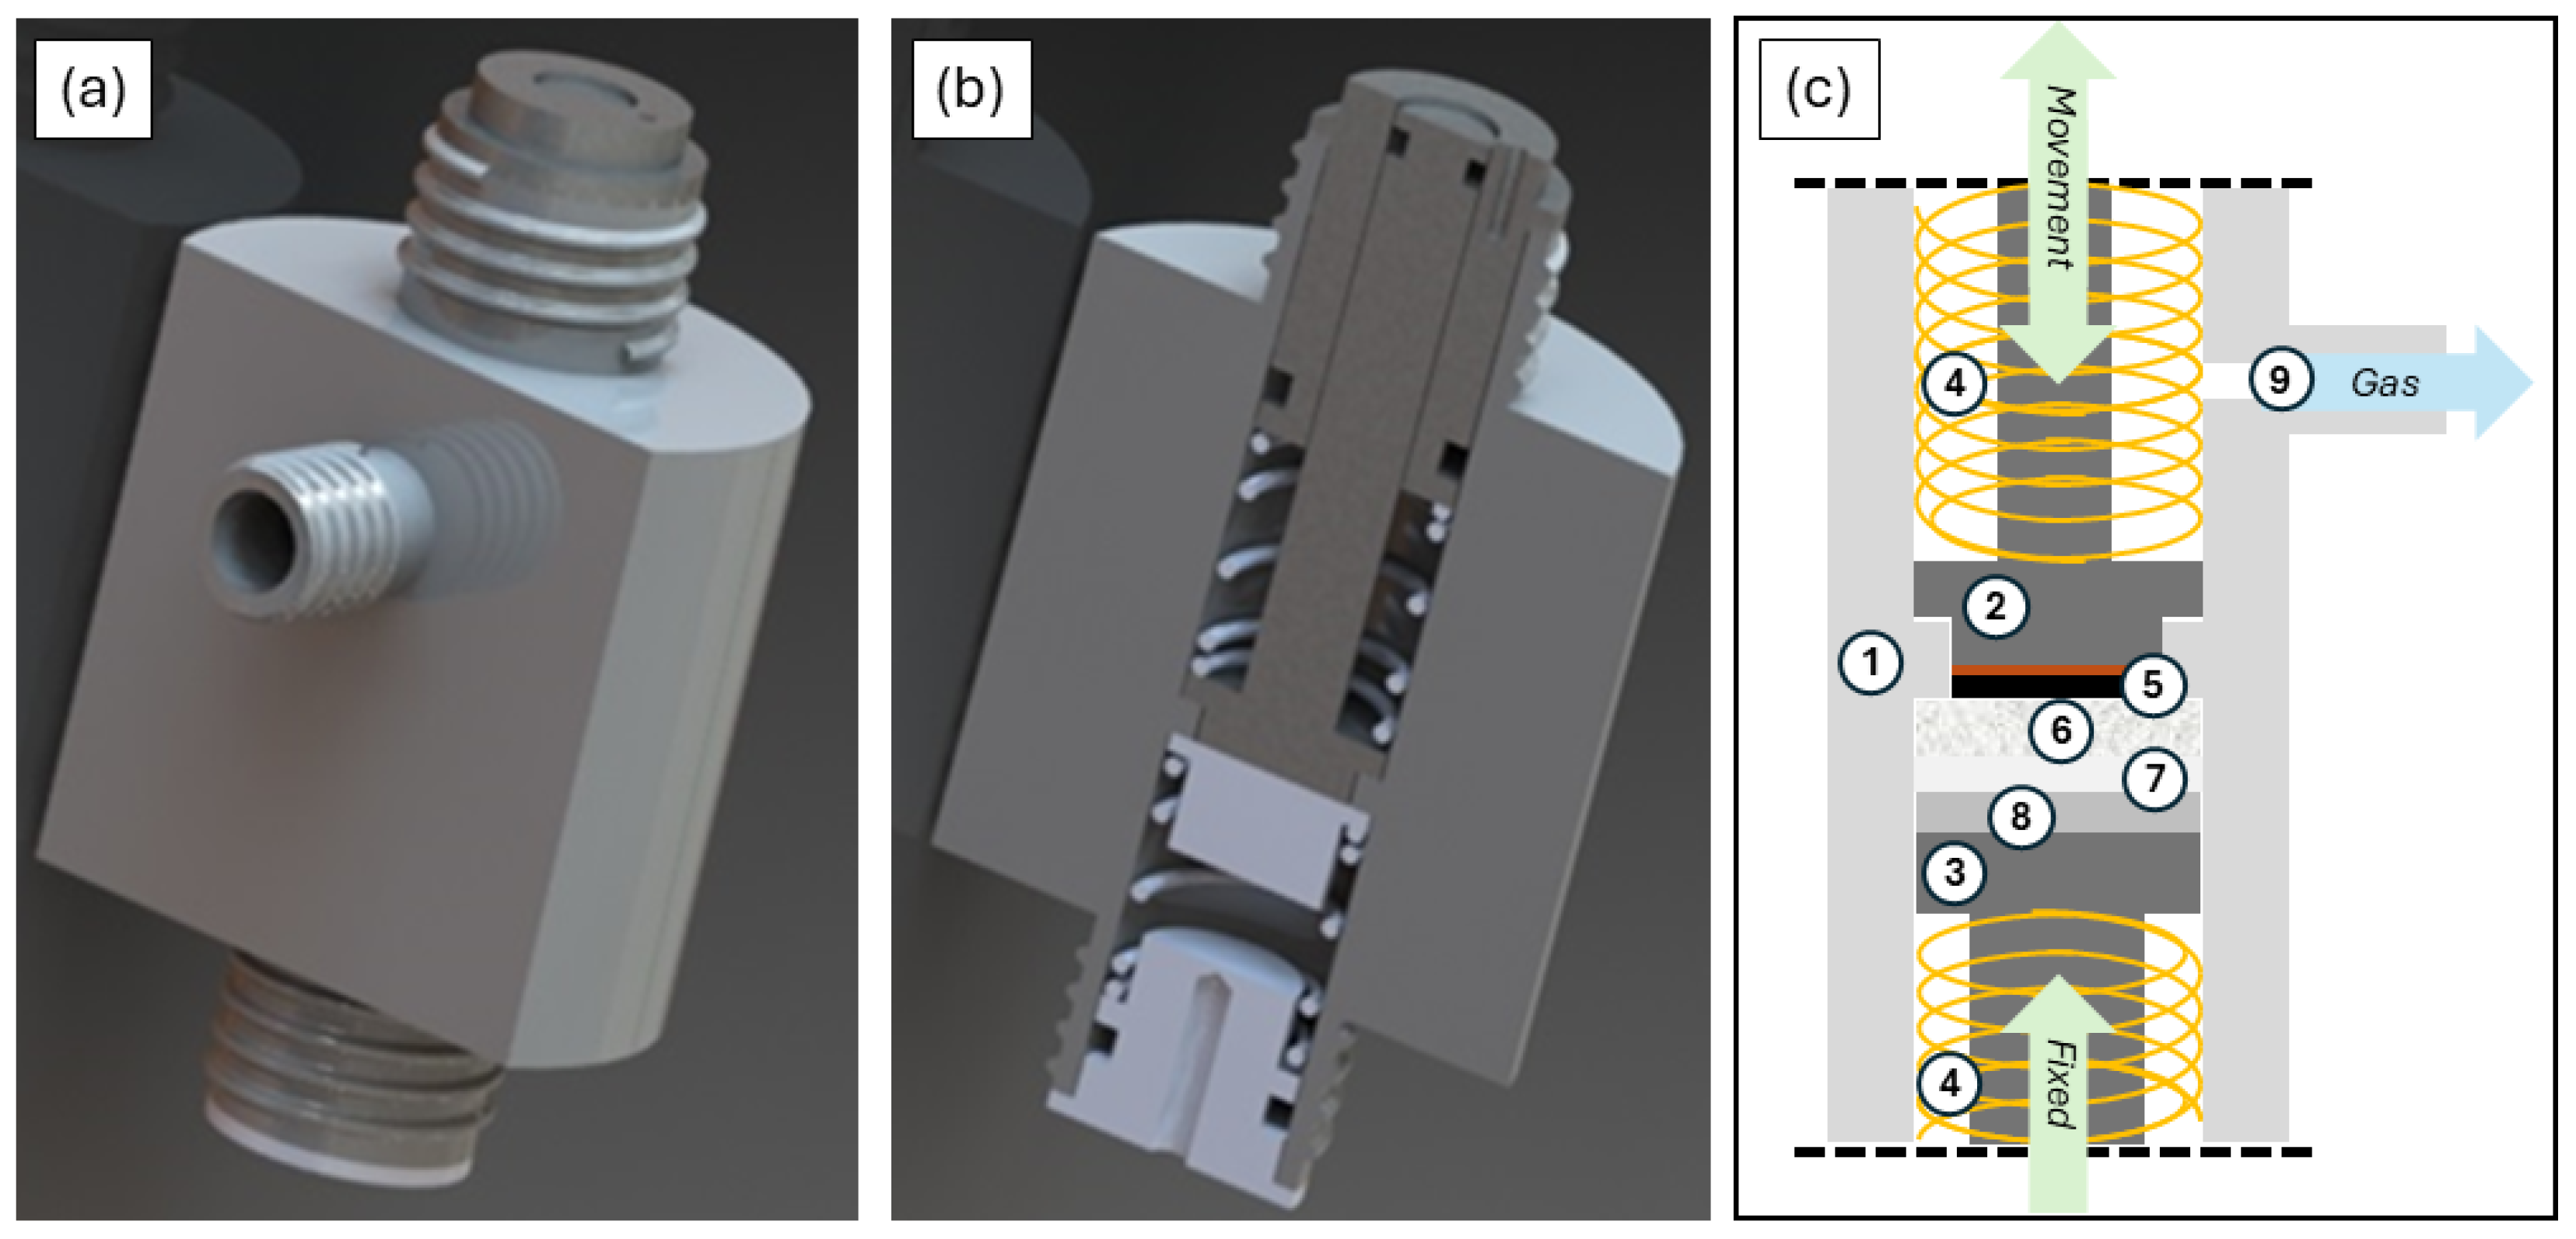
Figure 1. Rendered 3D drawing of the combined measurement cell. Exterior with gas connection port (a) and sectional view of the cell interior (b). The sketch in (c) shows a detailed overview with all relevant components of the setup.
Batteries 10 00445 g001
Figure 2. In-house developed multifunctional operando test setup and specifically designed combined test cell with MS capillary and LVDT sensor for advanced characterization.
Batteries 10 00445 g002
Figure 3. Combined operando measurement of a Li|graphite half cell with 1.0 M LiPF6 in EC:DMC (50:50 by weight). The potential curve in gray is plotted on the left y-axis and the thickness change in red as well as the ion current of the respective mass signals are plotted on the right y-axis, all over time on the x-axis. Each mass signal of interest is indicated by a different color.
Batteries 10 00445 g003
Figure 4. Thickness change in the investigated graphite anode during six full cycles. In black, on the left y-axis, the potential is plotted, whereas on the right y-axis in red, the thickness change is plotted, both over time.
Batteries 10 00445 g004
Figure 5. First cycle of Figure 4 in detail, separated in lithiation (a) and delithiation (b). On the left y-axis, the potential in gray is plotted, and on the right y-axis, the differential voltage in dashed gray as well as the thickness change in red is plotted all over the state of charge (SOC) of the respective half-cycle.
Batteries 10 00445 g005
Figure 6. Potential curves and operando MS analysis of selected masses with simultaneous thickness change. Single mass courses of m/z = 2 (a), m/z = 26 (b), m/z = 39 (c) and m/z = 85 (d). Plotted are on the left y-axis the potential in gray and on the right y-axis the thickness change in red as well as the ion current of the corresponding mass signal, each over time on the x-axis. Different colors are shown for each mass signal.
Batteries 10 00445 g006
Figure 7. Gas chromatogram total ion current (TIC) spectrum (6.00 min to 13.50 min) of the extracted gas sample after six full cycles (300 h). Light blue backed substances origin from solvent products, whereas light red backed substances are known conductive salt decomposition substances. White backed components are of unclear origin to the authors.
Batteries 10 00445 g007
Table 1. Test plan used for the electrochemical measurements with Basytec CTS battery test system.
CommandParameter Termination Comment
Pause t > 27 hSettle time
Cycle-Start
DischargeI = −0.05 CU = 10 mVCC Discharge (Lithiation)
DischargeU = 10 mV
I = −0.05 C
I > −0.01 C
t > 10 h
CV Discharge (Lithiation)
ChargeI = 0.05 CU = 1.0 VCC Charge (Delithiation)
ChargeU = 1.0 V
I = 0.05 C
I < 0.01 C
t > 10 h
CV Charge (Delithiation)
Cycle-EndCount = 6 Repeat for 6 cycles
Pause t > 5 min
Table 2. Gas chromatogram compound table of the extracted gas sample after six full cycles.
Peak NumberRetention Time [min]Compound Name
16.55Phosphonic difluoride
28.251,1-Diethoxyopentane
38.38n-Hexane
49.65Dimethyl carbonate (DMC)
510.47Benzene
611.39Ethyl methyl carbonate (EMC)
712.89Diethyl carbonate (DEC)
Disclaimer/Publisher’s Note: The statements, opinions and data contained in all publications are solely those of the individual author(s) and contributor(s) and not of MDPI and/or the editor(s). MDPI and/or the editor(s) disclaim responsibility for any injury to people or property resulting from any ideas, methods, instructions or products referred to in the content.