Article

Spherical Graphite Anodes: Influence of Particle Size Distribution and Multilayer Structuring in Lithium-Ion Battery Cells

1
Institute for Particle Technology, TU Braunschweig, 38104 Braunschweig, Germany
2
Battery LabFactory Braunschweig, TU Braunschweig, 38106 Braunschweig, Germany
*
Author to whom correspondence should be addressed.
Batteries 2024, 10(2), 40; https://doi.org/10.3390/batteries10020040
Submission received: 22 December 2023 / Revised: 12 January 2024 / Accepted: 19 January 2024 / Published: 23 January 2024

Abstract

:
Current research focuses on lithium-ion battery cells with a high energy density and efficient fast-charging capabilities. However, transport limitations, and, therefore, the uniform diffusion of lithium-ions across the electrode layers, remain a challenge and could lead to reduced cell performance. One approach to overcome these transport challenges is the use of subsequently produced two-layer anodes with the particle size variation of spherical graphite (x50 = 18 µm; x50 = 11 µm). Thereby, a defined pore network is created, which reduces the ionic resistance and ensuring improved fast charging capabilities. The analysis focuses on the evaluation of electrode properties and the electrochemical performance. By examining the pore size distribution of the anodes, it has been found that during the manufacturing of the two-layer anodes, carbon black and binder particles are transported into the existing microstructure of the lower layer, resulting in localized densification between the anode layers. This could also be supported by color measurements. This effect also extends to electrochemical investigations, with electrochemical impedance spectroscopy showing significantly lower ionic resistances in all two-layer anodes. Reduced ionic resistance and tortuosity near the separator due to absorption effects enhance the ion diffusion and have a direct impact on anode performance. Cell ageing analysis showed a significant capacity decrease of almost 15 mAh g −1 in the single-layer references only, in contrast to the stability of the two-layer anodes. This could also be attributed to the reduced ionic resistance and active counteraction of binder migration. In conclusion, this study highlights how subsequently produced two-layer anodes significantly shape the electrode properties and cell performance of lithium-ion batteries.

1. Introduction

The demand for lithium-ion batteries (LIBs) continues to grow due to the ongoing climate crisis as well as the decreasing reserves of fossil fuels [1,2,3]. The transport sector is a major contributor to greenhouse gas emissions, making electric vehicles (EVs) and research in the field of LIB cells increasingly important for the future [4]. Thereby, the electrochemical performance depends significantly on the active materials [5].
While lithium metal oxides are conventionally used as the active material on the cathode side, the current material of choice on the anode side is graphite (Gr). Although new anode active materials are being continuously developed [6,7,8,9,10], Gr remains the most widely used material due to its many advantages. These include a high Li+ uptake and release reversibility, good cycle stability, high gravimetric capacity of (theoretically) 372 mAh g−1, and a relatively low cost [11,12,13,14]. With a few exceptions, Gr consists of polycrystalline particles, meaning that each particle is made up of numerous single crystals. Currently, there are two main types of graphite used in advanced LIBs—natural graphite (NG) and synthetic or artificial graphite (SG) [15]. While in NG these single crystals are oriented in a particular direction, in SG, this orientation is more irregular [16]. A crystal consists of several graphene layers, which are mainly arranged in a thermodynamically stable ABAB sequence with a hexagonal symmetry, and linked to each other by weak van der Waals forces [17]. This specific form is presented in numerous publications [15,16,17,18].
NG, a naturally abundant mineral, offers advantages such as a flat and low voltage range and low cost, while having a flake-like morphology [17,19]. However, irreversible capacity losses and a relatively poor cycle life have remained problems with the widespread use of NG anodes in LIBs [20,21,22]. An alternative to NG is the application of SG. As the name implies, SG first has to undergo a complex formation process and is exposed to high temperatures of 2.500 to 3.000 °C to enable graphitization [23,24]. Nevertheless, this complex production process is beneficial as the electrochemical performance of SG is better than that of NG, meaning it can be used in high-power applications in particular [25,26]. However, in order to meet the growing demand for advanced LIBs for electric vehicles, further improvements in the electrochemical performance even of SG will be necessary.
For both NG and SG, the composition of graphite particles can be divided into two different planes: While the basal planes generally run parallel to the graphene layers, the edge planes are located at the end face of the graphene layers. As intercalation and deintercalation take place only at the edges of the graphite layers, the number of active sites is limited and the morphology of graphite needs to be further improved to enable a fast-charging capability [17,27]. Therefore, in recent years, various different types of SG materials (carbon nanofibers, mesocarbon micro balls (MCMBs), graphene, etc.) have been studied for their application in high-performance lithium-ion batteries [28,29,30,31,32,33]. In particular, the development of spherical Gr as an active anode material has been proven to be very promising and is, therefore, one focus of this publication [18,34].
The spheroidization of flake-shaped Gr particles into spherical particles is performed to obtain an isotropic characteristic of the particles [24,35,36]. The shape of the Gr flakes is thereby changed through stressing within mills so that they become spherical by “rolling them up”. These materials, known as “potato-shaped graphite”, are then cleaned by a leaching process and the surface is coated with conductive carbon [36]. Overall, the goal is to improve the particle intercalation by providing an additional surface area for intercalation into the edges of the Gr layers and improving the charge and discharge performance. Thereby, the spherical shape increases the rate capability and long-term stability due to reduced ion diffusion resistance and thus tortuosity, which actively counteracts diffusion limitations while simultaneously increasing the energy density [18,24,35,37,38].
Another promising approach to overcome diffusion limitations is the manufacturing of multilayered anodes. Multilayered anodes consist of two or more layers, each of which has a different set of properties. This creates a specific microstructure that can positively influence various properties of the electrode, such as preventing binder migration [39,40,41], creating a specific porosity, and improving its fast-charging capability while reducing the ionic resistance and inactive material amount [40,42,43,44]. Within this work, spherical Gr particles are used in two-layer structured anodes and a comprehensive study on the impact of the particle size distribution on performance is conducted. Therefore, two spherical Gr with different particle sizes were used to create a distinct pore structure within the anodes: Gr with a median particle size x50 of 18 µm (Gr 18) and Gr with a median particle size x50 of 11 µm (Gr 11). The structure of six of the multilayer anodes produced is shown schematically below (Figure 1).
The single-layer reference (a) consists only of Gr 18, the single-layer reference (c) consists only of Gr 11, and the anode (b) is a mixture of Gr 18 and Gr 11 in equal amounts. The two layer anodes (d–f) all have a constant composition of Gr 18 in the upper layer, which is intended to ensure high porosity in the layer close to the separator, allowing fast diffusion into the lower layer of the anode and high ionic conductivity. The only difference of the multilayer anodes is, therefore, the composition of the lower layer: anode (d) consists only of Gr 18 in the lower layer, anode (e) is a mixture of Gr 18 and Gr 11 in equal proportions (50:50), and anode (f) consists only of the small-particle-type Gr 11 in the lower layer. Furthermore, additional one- and two-layer anodes (not shown here) with a ratio of Gr 18/75+11/25 and Gr 18/25+11/75 were produced and considered for the evaluation of the adhesion strength and electrical conductivity. All anodes have the same areal capacity of 4 mAh cm−2, with 2 mAh cm−2 for each layer of the two layer anodes.

2. Materials and Methods

Electrodes and LIB cells are produced to study the effect of two spherical Gr with different particle sizes on electrode properties as well as the electrochemical behavior.

2.1. Slurry Preparation and Manufacturing of the Electrodes

In this chapter, the materials and methods used for the production of these (two-layer) anodes are described and explained. A summary of the different Gr specifications according to manufacturer is given in Table 1. A conductive carbon black was used as a conductivity additive. The binders used are a combination of Na-CMC, a sodium carboxymethyl cellulose, and SBR, a styrene–butadiene rubber. Distilled water was used as the solvent.
To calculate the theoretical specific surface area of the blended electrodes, the specific surface areas of G 18 and G 11 from Table 1 are used. An example calculation is the anode with a mixture of Gr 18/50+11/50: (1.9 m2 g−1 × 0.5) + (2.35 m2 g−1 × 0.5) = 2.125 m2 g−1.
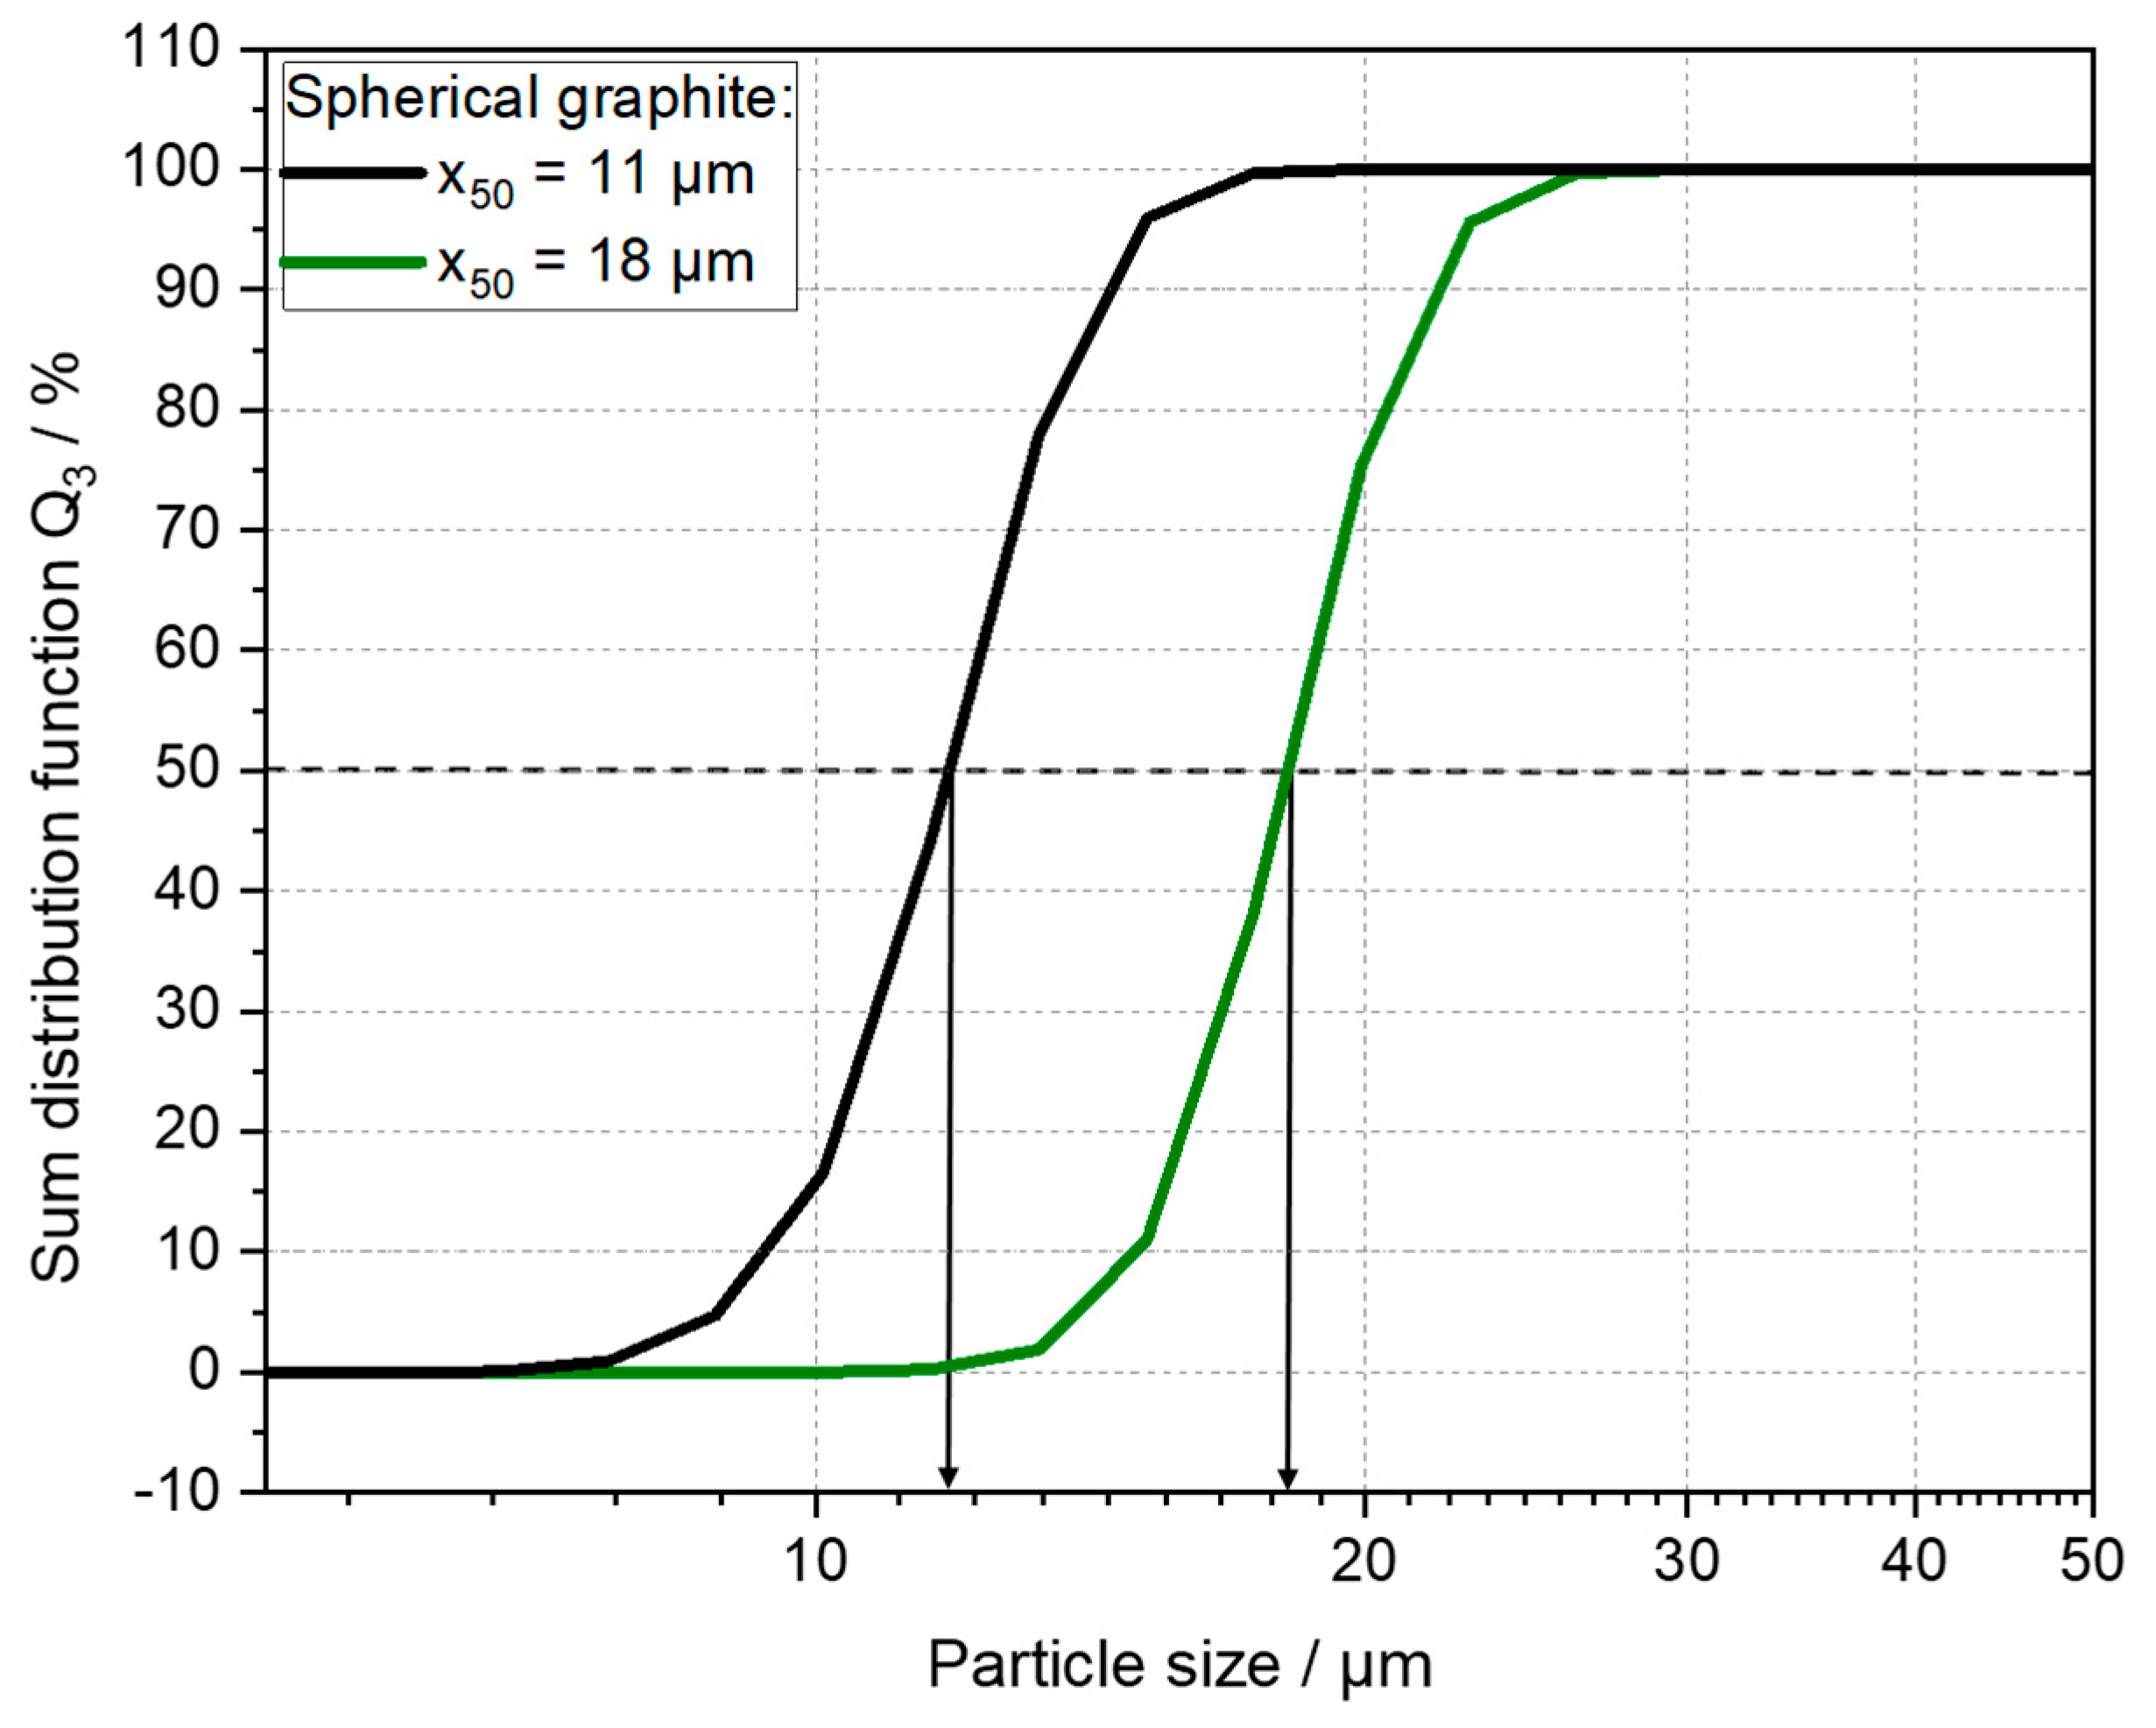
In order to verify the manufacturer’s specifications, the two different graphites were also measured by laser diffraction using a LA960 particle size analyzer from Horiba Ltd. (Kyoto, Japan) (Figure 2).
By determining the x50 value for each material, the median particle size for Gr 18 was 18.2 µm and the median particle size for Gr 11 was 11.6 µm, generally in line with the manufacturer’s specifications.
Table 2 shows the formulation of the produced slurries for the one-layered references as well as the two-layered anodes.
While the solid concentration was kept constant at 50 wt. % in all slurries, the difference between the slurries was the relative amount and type of the two graphites used. Either, the electrodes consisting of 100% of the large or small particles were produced (Suspension 1 and 5), or the percentage of the two graphites was split 25:75, 50:50, or 75:25 (Suspension 2, 3, and 4). The slurry preparation as well as the coating of the anodes was performed according to Gottschalk et al. using a dissolver (DISPERMAT®, VMA-Getzmann, Reichshof, Germany) [42]. After dispersing, a laboratory coater (ZAA 2300, Zehntner, Sissach, Switzerland) was used to coat the final paste of the one-layer reference anodes on a copper foil (10 µm, 8.9 mg cm−2). The areal capacity of the all-produced one-layered anodes was 4 mAh cm−2. The lower layer with an areal capacity of 2 mAh cm−2 was applied to the copper foil for the two-layer anodes. After a short drying period (60 °C for 5 min), the second (top) layer was applied on top of the first, again with an areal capacity of 2 mAh cm−2. For all two-layer anodes, the formulation of the upper layer was held constant with 100% Gr 18, while the formulation of the lower layer near the substrate was varied. An overview of the anodes produced as well as their properties after manufacturing is shown in Table 3.
A conventional NCM622 was used to manufacture the cathode. Polyvinylidene fluoride (PVDF) was chosen as the binder, while conductive graphite and carbon black were used to improve the conductivity of the cathode. N-methyl-2-pyrrolidone (NMP) was chosen as the solvent. An overview of the slurry composition is given in Table 4.
A detailed description of the dispersion process can be found in Gottschalk et al. [42]. The resulting paste was then coated on 15 µm-thick aluminum foil with a target areal capacity of 3.6 mAh cm−2 using a lab coater (Zehntner’s ZAA 2300 laboratory coater). Drying was carried out at 80 °C. Once the coating was dry, the electrode was compacted to a density of 3.0 g cm−3 using a two-roller compactor (GKL 400 MS, Saueressig GmbH Co. KG, Vreden, Germany) [45].

2.2. Mechanical, Electrical, and Structural Characterization of the Anode

A defined electrode structure is targeted by combining graphite with different particle sizes in the lower layer. To evaluate the effects of such material and structural changes, a comprehensive analysis of the electrodes was carried out. This characterization focused on the mechanical, electrical, and structural behavior.

2.2.1. SEM Analysis

A scanning electron microscope (Phenom XL SEM, ThermoFisher Scientific, Waltham, MA, USA) was used to analyze the electrode structure by image analysis. To prepare the electrode cross sections, the electrode sample was torn diagonally to the coating and placed on a sample holder. The recorded magnification was 1500× for each sample, a secondary electron detector was used, and the acceleration voltage was 5 kV.

2.2.2. Adhesion Strength

The adhesion strength was measured using a pull-off test using a materials testing machine (Z020, Zwick, Germany), according to Haselrieder et al. [46]. Thereby, 1.13 cm2 samples were pressed between two punches with a force of 0.6 MPa for 30 s. After 30 s, the upper stamp was slowly removed at a specific speed. The adhesive strength of the sample was determined by analyzing the peak force achieved. Each electrode was analyzed using 10 samples.

2.2.3. Electrical Conductivity

Using the method of Westphal et al. [47], the electrical resistance of the anodes was measured. The 1.13 cm2 anode sample was compressed between a lower and an upper punch at a defined pressure of 0.354 MPa to reduce unwanted resistances. A current of 10 mA was applied during compression for the measurement of the resistance of the sample. The measured resistance and electrode thickness were used to calculate the specific conductivity. Ten samples were analyzed for each variation.

2.2.4. Pore Size Distribution and Porosity

To investigate the changes in the pore structure of the electrode caused by the different anode compositions, mercury intrusion measurements were carried out. For this purpose, according to Froboese et al. [48], small fragments of 40 cm2 electrode samples were cut and analyzed using an intrusion porosimeter (PoreMaster GT 60, Quantachrome Instruments, Boynton Beach, FL, USA). The density of the electrode was divided by the theoretical density of the material blends to calculate the theoretical porosity. The density of the blended materials was calculated based on their weight percentage.

2.3. Color Measurement by Spectrophotometry

The color values were measured by the SPH 900 colorimeter from ColorLite GmbH with a 45°/0° geometry. The sample is illuminated with the integrated LED (standard illuminant D65), and the adsorption is measured in a wavelength area from 400 nm to 700 nm. The resulting absorption spectrum is used to calculate the CIE-L*a*b color space.
Within this color space, brightness and color information are evaluated individually. The L*-value indicates the brightness of the sample, with 0 representing black and 100 representing white, while the a*-value (−170 green < a < 100 red) and b*-value (−100 blue < b < 150 yellow) provide information on the object’s actual color. The measurement process follows the methodology outlined by Weber et al. [49], where the measurement head is placed on the dried electrode to determine the color.

2.4. Battery Cell Production and Electrochemical Characterization

The electrochemical performance was evaluated in a (full) LIB cell (anode vs. cathode) with a lithium metal reference using a three-electrode configuration (EL-Cell; PAT-Cell, Hamburg, Germany). The cell assembly was performed in a glove box under a regulated argon atmosphere. The fabricated anodes and counter-cathode were punched into 18 mm die-cuts and separated by a double-layer separator (FS-5P, Freudenberg Viledon FS 2226E + Lydall Solupor 5P09B). The cells were then filled with 150 µL of LP57 electrolyte (1 M LiPF6 in EC/EMC 3:7 w/w with 2 w/w VC) and sealed.

2.4.1. Charge-Rate Test and Cell Ageing

Several types of electrochemical tests were carried out to characterize the electrochemical performance of the SG multilayer anodes. To investigate the fast-charging capability of the anodes, a charge rate test was performed. Cells were cycled in a Basytec GmbH CTS-Lab cell tester at a constant temperature of 20 °C. The cycling procedure consists of three formation steps at 0.1 C, with the third step acting as a capacity check. After the capacity check, a C-rate test was carried out. The charge rates varied from 0.2 C to 3 C (0.2 C, 0.5 C, 1 C, 2 C, and 3 C) with a constant current (CC) in both the charge and discharge directions. All cells were discharged at a constant rate of 0.2 C. After the C-rate test, two relaxation/capacity check cycles were performed at 0.1 C charge/discharge (CC). To test cell stability and ageing, the relaxation cycles were subsequently followed by 50 cycles at a constant 1 C charge/discharge (CC) rate. To test the remaining capacity of the cells, they were then cycled two more times at 0.1 C. Cells were tested within a voltage window between 2.9 V and 4.2 V during cycling.

2.4.2. Electrochemical Impedance Spectroscopy and Ionic Resistance

Electrochemical impedance spectra (EIS) were recorded using a Zahner Zennium Pro instrument to measure the ionic resistance of the anode in a symmetrical-cell setup, following the method described in the publication by Landesfeind et al. [50]. The measurements were carried out at 20 °C under blocking conditions using 10 mM Tetrabutylammonium perchlorate (TBACIO4) as an electrolyte additive. The conductivity of the electrolyte at 20 °C was determined to be 0.374 mS cm−1. Three cells were tested for each measurement to ensure statistical reliability. To calculate the ionic resistance, the low-frequency line extended to the x axis was used. Therefore, the impedance spectra were analyzed and fitted with an adapted transmission line model to calculate the ionic resistance using impedance analysis software (RelaxIS 3, rhd Instruments, Darmstadt, Germany). A further description of the method, as well as its limitations, can be found in Landesfeind et al. and Morasch et al. [50,51].

3. Results and Discussion

This study aims to investigate the benefits of using two-layer anodes containing different particle sizes of spherical graphite. In particular, the investigation will focus on the mechanical, electrical, and electrochemical performance of these anodes.

3.1. SEM Analysis Results

Scanning electron microscope (SEM) images were taken to provide a visual representation of the anodes with different formulations of spherical graphite. Therefore, Figure 3 shows exemplary cross-section images of the manufactured one-layered (a–c) and two-layered (d–f) anodes.
All anodes show a homogeneous distribution of the graphite particles within the electrode. When looking at the single-layer anodes (Figure 3a–c), the rounding of the graphite particles and the so-called “potato-shaped” structure can be clearly observed. There are also significant optical differences between the two different particle sizes of graphite. The anode containing Gr 11/100 (Figure 3c) appears to be denser than the single-layer anode containing Gr 18/100 (Figure 3a).
However, the successful two-layered application becomes clear when looking at the anodes in Figure 3d–f. The top layer, which contains only Gr 18/100 for all three two-layer anodes, can be clearly distinguished from the bottom layer of the anodes in case a proportion of smaller particles of Gr 11/100 is used (Figure 3f). Furthermore, when comparing the single-layer anode of Figure 3a, which contains only Gr 18/100, with the two-layer anode of Figure 3d, which has the same homogeneous composition of Gr 18/100 in both layers, there is no visible loss of contact within the two-layer anode. The one- and two-layer anodes with the composition Gr 18/75+11/25 and Gr 18/25+11/75 show no significant new findings compared to the anodes already shown in Figure 3 and are, therefore, shown in the supporting information.

3.2. Mechanical Properties of Two-Layer Anodes

In this chapter, the mechanical properties of the manufactured anodes are shown and discussed. Figure 4 shows the adhesion strength of the one-layer anodes (a) as well as the two-layer anodes (b) depending on the specific surface area of the anodes.
The adhesion strength is a mechanical parameter that can be used to predict the stability of the electrode in a subsequent cell assembly step. Looking first at the one-layer anodes in Figure 4a, there is a significant decrease in the adhesion strength with the increasing specific surface area. Thereby, the Gr 18/100 anode exhibits the highest adhesion strength of all the one-layer anodes with a value of 1.64 MPa at a specific surface area of 1.9 m2 g−1. The adhesion strength of the anodes with mixtures of Gr 18 and Gr 11 decreases as the proportion of smaller particles, and, therefore, the specific surface area, increases. Consequently, the anode Gr 11/100 shows the lowest adhesion strength (1.25 MPa) of all of the one-layer anodes with the highest specific surface area of 2.35 m2 g−1. A similar trend can be observed for the two-layer anodes, where the adhesion strength also decreases with the increasing specific surface area. As the formulation of the top layer was kept the same in all two-layer anodes (Gr 18/100), the variable formulation of the layer near the current collector is the determining factor of the mechanical behavior.
Overall, the presented results show that the adhesion strength can be directly attributed to the specific surface area. As the carbon black and binder content was kept constant in all electrodes (one-layer and two-layer), a change in the surface area can, therefore, be directly related to the particle size of the active material used. For example, the electrode with 100% Gr 11 particles has the highest surface area and the lowest adhesion strength. One explanation for this is that the ratio of the binder to the surface area is decreasing, and thus less binder is available between the particle surfaces and current collector. A similar correlation between the surface area and adhesion strength was also found by Marks et al. [52]. On the other hand, an increase in surface area does not have to be accompanied by a reduction in adhesion. As Weber et al. have already shown, the adhesion of the electrode can be improved by the addition of CB. Therefore, it can also be assumed that the CB is critical for the high mechanical integrity of the electrode due to the cross-linking points. Due to the formulation used, the amount of CB in the formulation is relatively low compared to the surface area of the SG, resulting in limited cross-linking.
The slightly lower overall adhesion of the two-layer anodes (~0.1–0.15 MPa lower) may contribute to the interface between the two layers, causing additional cohesive failure. However, neither cohesive failure nor failure at the interface between the two layers was optically observed for the one-layer and two-layer anodes; instead, the coating detached from the current collector under the tensile stress and adhesive failure dominated (Figure 4c). Similar results have already been observed in a prior publication [42]. Overall, however, the adhesion strength is more likely to be used for a statement about the structure and handling properties of the anodes and a direct correlation with the resulting electrochemical performance is not likely.

3.3. Structural Properties of the Multilayer Anodes

In order to gain a better understanding of the structural properties of the two-layer anodes, the pore size distribution (Figure 5a) as well as the impedance spectra (Figure 5b) were measured. Furthermore, the ionic resistance was calculated. In Figure 5, the focus was on the electrodes with Gr 18/100, Gr 11/100, and Gr 18/100+11/50. This also applies to the two-layer anodes with the corresponding formulation in the lower layer. In order to avoid overcrowding, the following diagrams, the one- and two-layer anodes Gr 18/25+11/75 and Gr 18/75+11/25, will not be discussed further in the structural and electrochemical analyses.
Figure 5a shows the pore size distributions of the one-layer and two-layer anodes. Porosity in general and the pore size distribution in particular can provide important information about the microstructure of the electrodes and, ultimately, can provide a prediction of the electrochemical performance [53]. Looking first at the one-layer reference anodes, clear differences can be observed between the anodes with different particle sizes. While Gr 11/100 has the smallest pore diameter (~2.9 µm), the largest pore diameter of ~4.8 µm is exhibited by the Gr 18/100 anode. Gr 18/50+11/50 corresponds to a value of ~3.5 µm between the two anodes. This can be explained by the fact that Gr 18/100 has a significantly lower electrode density and higher porosity than the other anodes, as already shown in Table 3 (0.95 g cm−3 compared to 1.01 g cm−3 for Gr 18/50+11/50 and 1.03 g cm−3 for Gr 11/100). In addition, Gr 18/100 also has the highest total porosity of 57% (Gr 18/50+11/50: 55%, Gr 11/100: 54%). In contrast to all one-layer anodes, which display a monomodal distribution, the pore size distribution of the two-layer anodes with Gr 18/50+11/50 and Gr 11/100 in the lower layer is bimodal. Similar results have been observed by Wood et al. [54]. It is assumed that the two peaks of the bimodal distribution correspond to the two different layers of the anode. As the right peak of both two-layer anodes is located at a pore diameter of about 4.7–4.8 µm, and, therefore, is almost identical to the peak of the one-layer anode Gr 18/100, this peak corresponds to the formulation of the upper layer (note, the formulation of the upper layer is 100% Gr 18 for all two-layer anodes). Hence, it can be assumed that the left peak represents the composition of the lower layer. Thereby, in contrast to the corresponding one-layer anode with the same composition, the left peak of both two-layer anodes is slightly shifted to the peak towards smaller pore diameters. An explanation for this can be provided by the coating process, as described in Section 2.1. First, the lower layer is applied to the collector and dried. The upper layer is then coated directly on top of the dried layer. As the microstructure of the lower layer has already formed, the carbon black/binder domain of the applied liquid suspension infiltrates into the cavities of the lower layer. Thereby, a region of locally higher electrode density, which is recorded by the porosimetry as the narrowed pore entrance diameter, is formed at the interface between the two layers. This may also be observed in the decreasing layer thickness of the two-layer anodes compared to the one-layer anodes (~decrease of approx. 5 µm, see Table 3). An exception is the two-layer anode with Gr 18/100 in the lower layer. Since the composition of the lower layer is identical to that of the upper layer, only one peak can be observed here; however, the infiltration of the carbon black/binder domain can also be observed here by a shift of the pore sizes of the peak to the left. A similar effect has been observed by Neidhart et al. [55] who witnessed the same effect of the lighter carbon black/binder particles migrating from the top layer and then occupying the cavities in the bottom layer of aqueous cathodes.
A further insight into the formed microstructure of the anodes can be obtained by looking at the impedance spectra, as shown in Figure 5b. An example spectrum of a symmetrical cell is shown for each of the anodes analyzed, although the spectra are only example spectra and, therefore, do not fully reflect the results of the ionic resistance. Furthermore, the ionic resistance (Figure 5c) provides a measure of the rate at which lithium-ions can diffuse through the electrolyte. Thus, a lower resistance means shorter transport pathways and, therefore, usually a better fast-charging capability [56,57,58]. According to the publication by Landesfeind et al. and Morasch et al., the ionic resistance can be calculated from the recorded spectra, even for gradient electrodes [50,51]. Thereby, the extension of the low-frequency line to the x axis results in a third of the ionic resistance within the pores, as previously discussed by Ogihara et al. for the transmission line model [59]. An example spectrum of G 11, which graphically illustrates the manual determination of the extension of the low-frequency line to the x axis, is provided in the Supplementary Information (Figure S2).
Clear differences between the one-layer and the two-layer anodes can be observed: While all one-layer anodes show higher resistances, meaning a shift to a higher real part, the two-layer anodes are found further to the left in the region of lower ionic resistances. Hence, the areal ionic resistance of the two-layer anodes is approximately 325–343 Ohm cm2 and the areal ionic resistance of the one-layer references is significantly higher in the range of 568 (Gr 18/100) to 778 Ohm cm2 (Gr 11/100) (Figure 5c). One explanation could be that the developed pore structure and the bimodal pore size distribution of the two-layer anodes has a beneficial effect on the porosity distribution as well as diffusion pathways of the two layers. However, it does not explain the effect that the above-mentioned assumption of local densification at the interface might have on ionic diffusion.
Morasch et al. discovered that the tortuosity in the region of the separator is crucial for the transport of ions through the electrode [51]. Tortuosity is an inherent characteristic of a porous medium, usually defined as the ratio of the effective path length to the straight distance between the two ends of the path [60]. A high tortuosity (>>1) is therefore associated with long transport distances and a high ionic resistance. In the case of the two-layer anodes, this means that a low tortuosity close to the separator is advantageous, since binder and carbon black are infiltrated in the region of the interface, forming free pores close to the separator. Another factor to consider is the electrode thickness, which was found to have a significant impact on ionic resistance in a previous study [61]. As the thickness of the two-layer anodes is approximately 5 µm less than that of the one-layer anodes, this could result in shorter diffusion paths, which in turn would reduce the ionic resistance as well.
In order to confirm the theory of the infiltration of the carbon black (CB)/binder region in two-layer anodes, color measurements were carried out with the one-layer anode Gr 18/100 and the two-layer anode with Gr 18/100 in both layers, as described in Section 2.3 (Figure 6).
The one-layer anode Gr 18/100 is used as a reference for the tests carried out and to establish an expected limit for the L* value (the color value of CB on the electrode surface) of the given formulation (L* value 0 wt. % CB = 41.5; L* value 0.7 wt. % CB = 39.93; L* value 1.4 wt. % CB = 37.9). As already described by Weber et al., an increase in carbon black leads to a decrease in the L* value, i.e., a darkening of the electrode surface [49]. This effect is also observed here for the one-layer anodes with different amounts of CB (0 wt. % and 1.4 wt. %). In the two-layer electrodes used for these special color measurements, the first layer was exceptionally applied without carbon black, while the top layer contained 1.4 wt. % carbon black, which corresponds to the standard formulation of the electrodes. The thickness of the top layer was varied as the effect of infiltration is expected to be stronger when the ratio between the thickness of the top layer and the thickness of the bottom layer is relatively small.
It can be observed that the L*-value for the top layer decreases slowly and does not approach the expected value of 37.9 (1.4 wt. % CB) until a layer thickness of 150 µm is reached. This counteracts the usual segregation effects and underlines the assumptions, described above, that the CB content on the surface is reduced due to the infiltration of CB/binder into the cavities of the lower layer, which becomes especially apparent at lower film thicknesses. If this described infiltration effect was not present, the color of the top layer would have to correspond to that of the reference test (L*-value 1.4 wt. % CB = 37.9). Therefore, the brightness decrease with the increasing coating weight or film thickness, respectively, would correspond to a linear relationship [49]. Thus, with the help of the reference tests, an estimation of the remaining carbon black content on the surface of the electrodes can be done. Upon observation, it is evident that the CB content has been decreased approximately by 0.76 wt. % with a top layer thickness of 20 µm. An increase in the CB content on the surface is only observed at a layer thickness above 75 µm. Since the infiltration of the lighter CB/binder particles into the cavities of the microstructure of the lower layer prevents the undesired migration of the particles to the electrode surface, this also has an effect on the CB distribution in the anode and thus on the electrical conductivity (Figure 6b). Here, it can be observed that in a direct comparison between the corresponding one-layer and two-layer anodes, the two-layer anodes always exhibit higher electrical conductivity. This also indicates a more homogeneous distribution of the carbon black particles within the electrode layer, as the segregation effect is significantly reduced. The differences in the electrical conductivity between G 11 and G 18, both with one- and two-layer anodes, cannot be conclusively explained and require further investigation. However, it is believed that smaller particles, due to the resulting lower electrode porosity, have more particle–particle contacts and, therefore, exhibit higher contact resistances, which reduces the electrical conductivity. Overall, there is also relatively little CB in the formulation, which could lead to lower conductivity, especially with a larger specific surface area, such as G 11.

3.4. Electrochemical Characterization of Multilayer Anodes

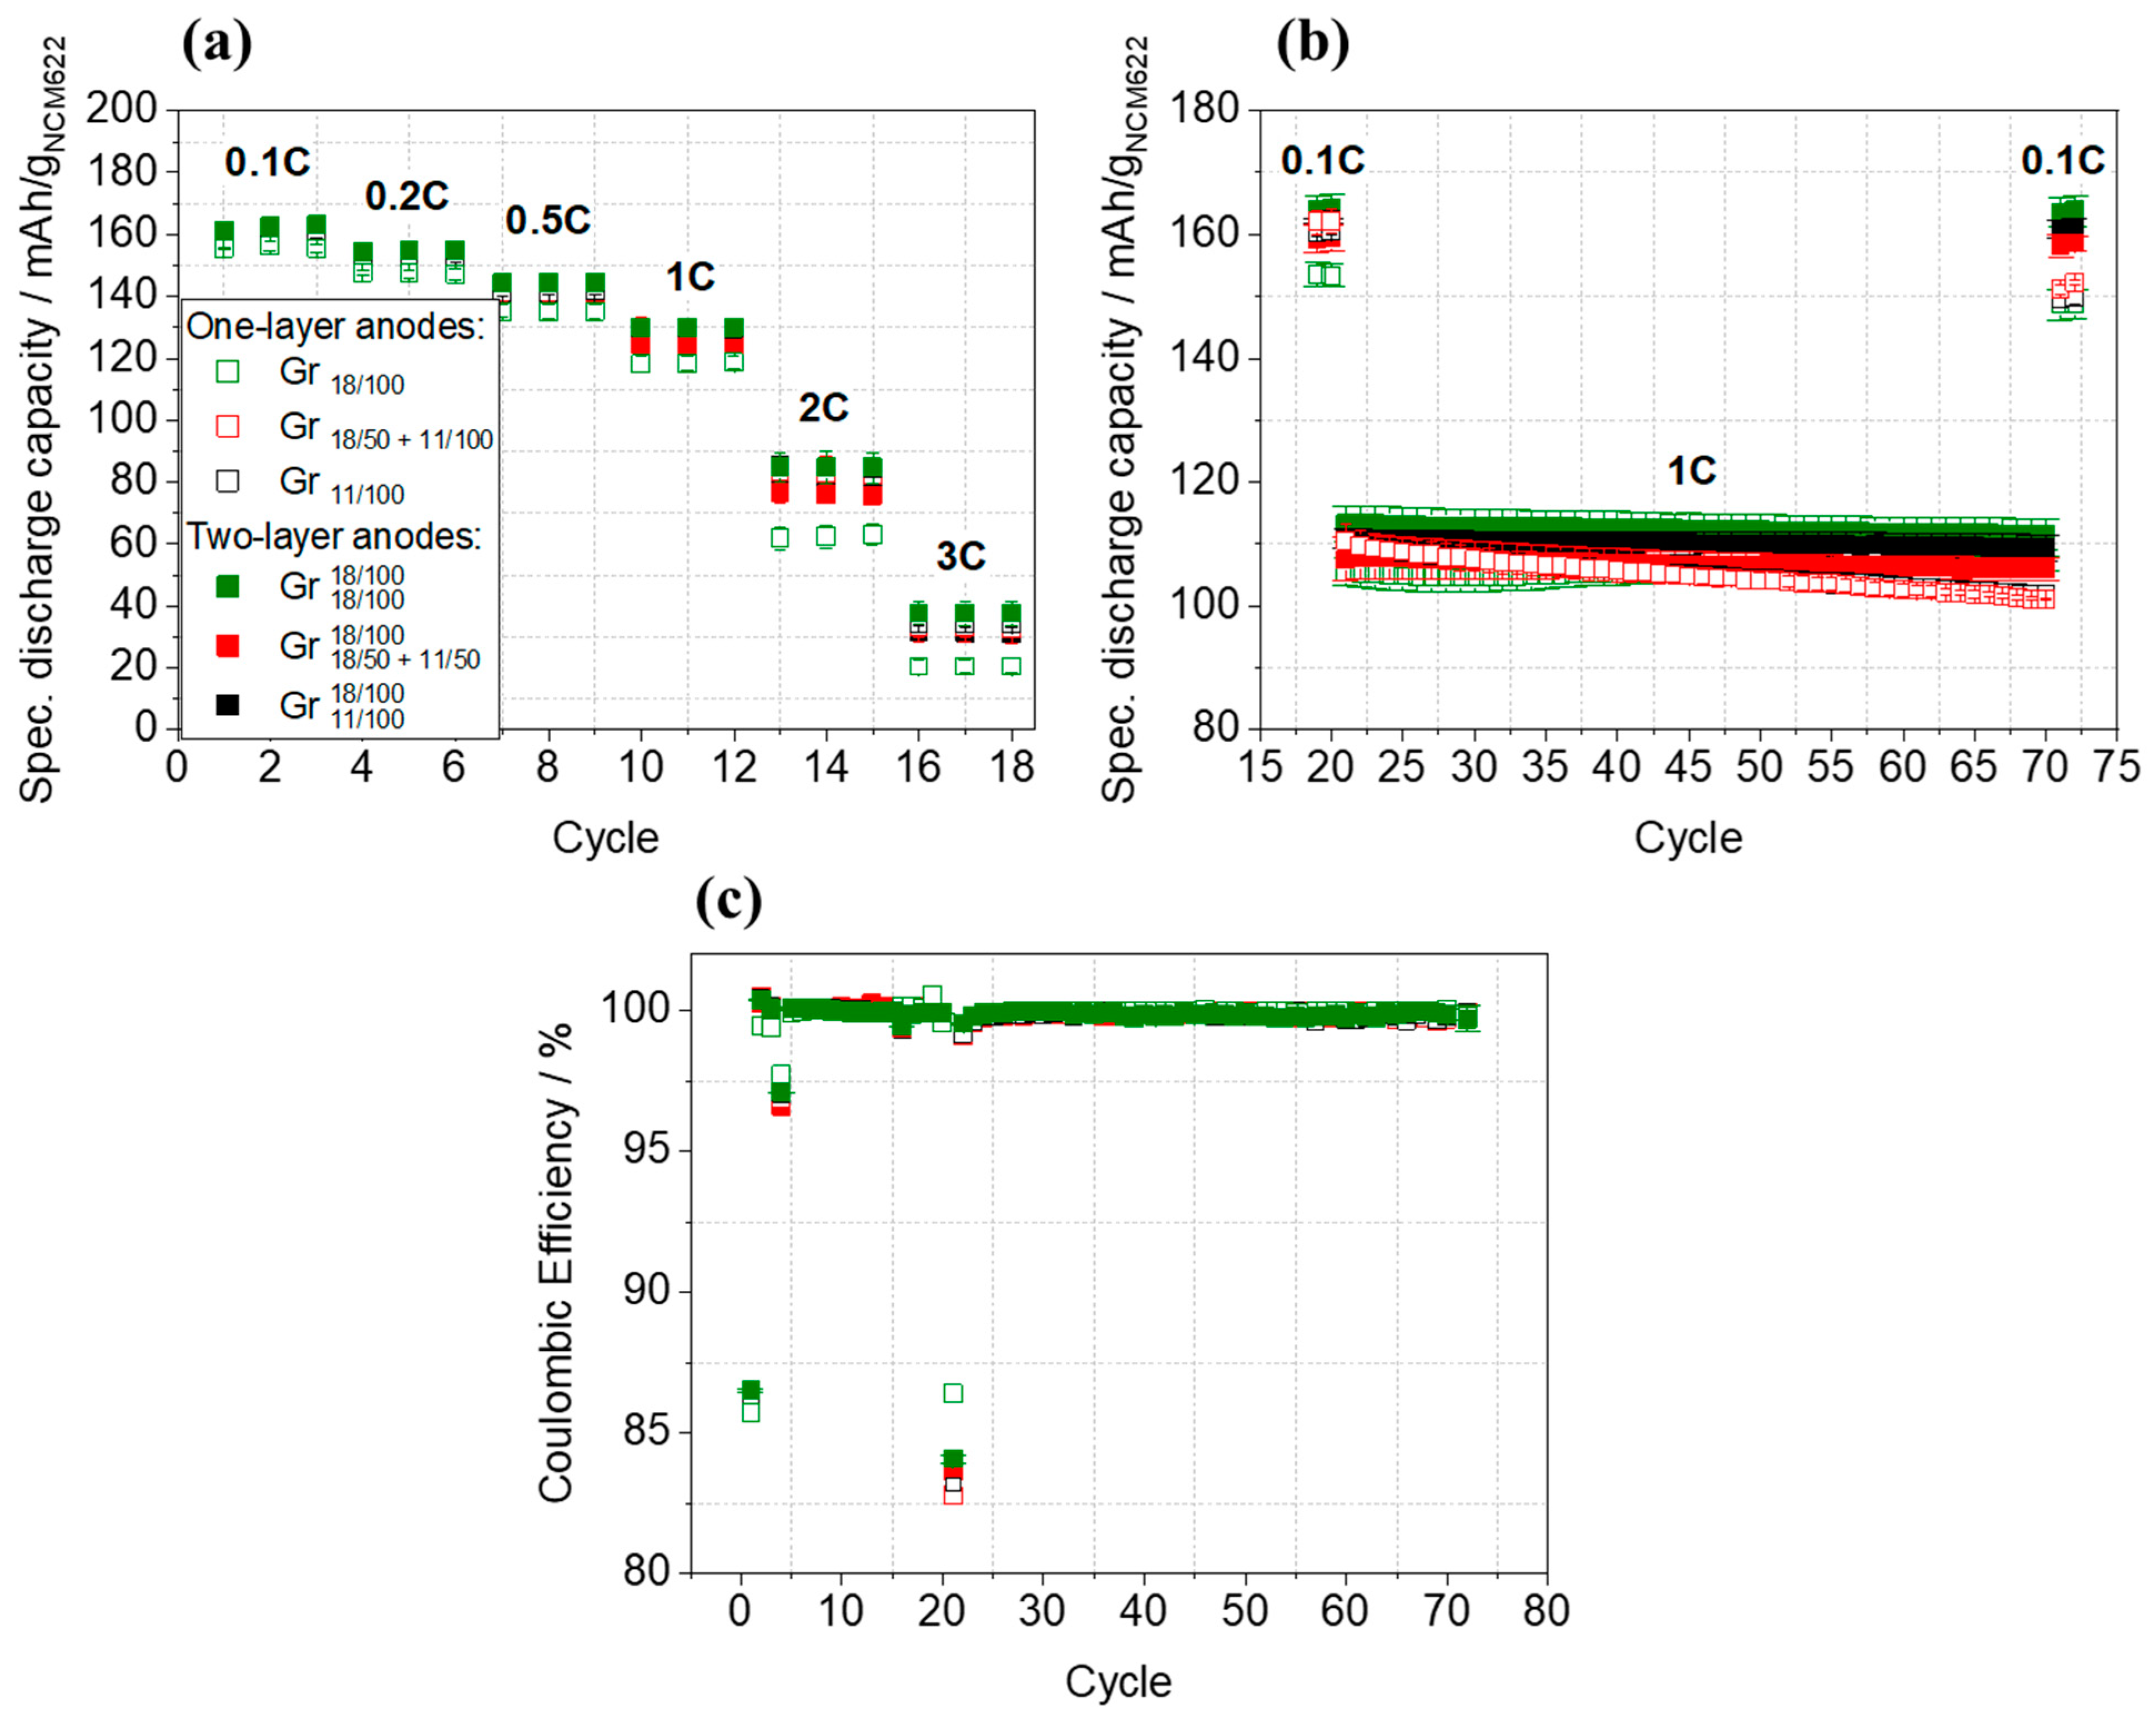
In order to gain a more in-depth understanding of the microstructure and the relation between the material morphology, structural effects, and the cell performance, in the next step, the electrochemical performance of the manufactured anodes is investigated (Figure 7).
Looking at the rate test in the charging direction (Figure 7a), there are no significant differences in the initial capacity between the one-layer and two-layer anodes (163 mAh g−1) except for Gr 18/100, which has a slightly lower initial capacity of 155 mAh g−1. At low C-rates, there are no major differences between the one-layer and two-layer anodes. At higher currents (≥2 C), the differences become more obvious. However, it is noticeable that the capacity of the single-layer anode Gr 18/100 is significantly lower at all C-rates (about 10–15 mAh g−1) and especially at higher C-rates. One explanation for the lower capacity of Gr 18/100 during the rate test could be the longer time required for the lithium-ions to diffuse into the particle and move to the corresponding ionic sites within the particle. In comparison, with the smaller particle size of the Gr 11/100 anode, the ion sites are more easily and more quickly accessible from the surface of the material due to the shorter distances [62]. In addition, the coulombic efficiencies (CE) of the different anodes were compared (Figure 7c). Thereby, a high initial CE of about 85–86% for all anodes were measured in the first formation cycle. All anodes then reached a CE of above 99% in the second cycle. Fluctuations of the CE can be attributed to the C-rate changes within the test procedure. Overall, all two-layer anodes (again with the exception of Gr 18/100 with 65 mAh g−1) still achieve around an 84 mAh g−1 specific capacity at a high C-rate of 2 C. This still corresponds to 54% of the initial capacity, and thereby shows the high fast-charging capability of the two-layer anodes.
In Figure 7b, the relaxation at 0.1 C after the rate test is shown. Cell ageing was then investigated, followed again by a relaxation after applying a current of 1 C for 50 cycles. Clear differences can be observed between the one-layer and the two-layer anodes: During the first recovery cycles after the rate test, all anodes regained, approximately, their initial capacity and thus showed little ageing behavior. On the other hand, after 50 cycles, all the one-layer anodes aged severely, losing approximately 12 mAh g−1 of their specific capacity, which corresponds to nearly 8–10% of their initial capacity. As discussed and confirmed in Figure 6, this is due to the effect of the significantly reduced CB/binder content in the upper layer of the two-layer anodes, caused by the infiltration of the lighter particles in deeper regions of the lower layer. This in turn leads to the advantageous low tortuosity near the separator, as already discussed in Section 3.3 and shown in Figure 5b with regard to the ionic resistance. Here, the resistance is significantly lower for the two-layer anodes, which is particularly important for the ionic transport within the electrode layer. As shown by Huber et al., there is a strong correlation between porosity and tortuosity as well as between porosity and the fast-charging limit. They could demonstrate that the increased tortuosity of the anode leads to an earlier onset of lithium plating as well as stronger lithium plating [62]. This suggests that the one-layer anodes, which have a significantly higher ionic resistance and, therefore, higher tortuosity, especially near the separator, are more susceptible to lithium plating and therefore age faster, as confirmed in Figure 7b. Exemplary discharge curves of the one-layer anode Gr 18/100 and the two-layer anode consisting of Gr 18/100 in both layers confirm this finding and are shown in the Supplementary Information (Figure S3). Furthermore, the two-layer application appears to actively counteract the challenge of binder migration to the top of the anode surface, which prevents an inhomogeneous electrode distribution and, therefore, poor adhesion strength which could lead to severe ageing [63].

4. Conclusions

In this research study, two-layer anodes with a varying particle size (x50 = 18 µm (Gr 18); x50 = 11 µm (Gr 11)) of spherical Gr have been investigated. The two-layer anodes all have a fixed composition of Gr 18 in the upper layer and, therefore, differ only in the composition of the lower layer. The produced anodes were thoroughly studied and compared, both with each other as well as with corresponding one-layer references. The analysis focused on evaluating their electrode properties and electrochemical performance. To gain deeper insight into the electrode properties, the adhesion strength, pore size distributions, and ionic resistances were measured. In addition, the electrochemical performance in a lithium-ion battery full cell was investigated by evaluating the fast-charging capability and long-term stability.
Looking first at the electrode properties, the direct influence of the particle size distribution of the spherical graphite on the adhesion strength could be demonstrated. More precisely, a linear relationship between the adhesion strength and the specific surface area was shown for both the single-layer and the two-layer anodes. One explanation for this could be that the ratio of the binder to surface area is decreasing due to a lack of binder. Alternatively, there may be insufficient CB in the formulation due to the increase in the surface area caused by the active material, resulting in limited or insufficient cross-linking. When the pore size distribution was examined, two peaks were found, each corresponding to a particular layer. The left peak, corresponding to the lower layer of the two-layer anodes (the layer that was varied), is slightly shifted towards smaller pore diameters. This led to the hypothesis that due to the specific manufacturing method of the two-layer anodes (the application of the first slurry, drying, and then the application of the second slurry on top of the dried first layer), the infiltration of the light carbon black and binder particles into the already-formed microstructure of the lower layer takes place. Thus forming the local densification between the two layers of the anodes. In order to confirm this hypothesis, specific studies were then carried out using color measurements on a two-layer anode and a corresponding single-layer reference. It could be demonstrated that significantly less carbon black could be detected on the surface of the two-layer anodes, particularly with a thin top layer. This confirms the above-mentioned hypothesis of the densification of the two-layer electrode at the layer interface.
This effect could also be observed in the electrochemical investigations. Looking first at the results of the electrochemical impedance spectroscopy, significantly lower ionic resistances were observed for all two-layer anodes. This can be attributed to a lower ionic resistance and thus more free pores and lower tortuosity near the separator due to the observed infiltration effects. As this is particularly crucial for ion diffusion through the electrode layer, it directly manifests in the electrochemical performance of the anodes.
In the rate test, a high fast-charging capability was observed with a capacity retention of, still, 52.5% at 2 C (84 mAh g−1 specific capacity) for all anodes. While only minor differences were identified between the two-layer and single-layer anodes, a clear ageing effect of the single-layer reference anodes became apparent after investigating 50 cycles at 1 C. In contrast to the two-layer anodes, the one-layered anodes experience a significant decrease in the specific capacity of nearly 15 mAh g−1. This can be attributed, on the one hand, to the lower ionic resistance of the two-layer anodes, but also to the active counteraction of binder migration, as described by the color measurements. Both are supposed to decrease the probability of lithium plating. Thereby, the color measurements have already provided an initial insight into the evolving microstructure and hence the advantageous electrochemical properties of the two-layer anodes. Nevertheless, further detailed investigations of non-simultaneous coating should be carried out to better understand how the microstructure affects the electrochemical properties, as well as the influence of the chosen coating approach (non-simultaneous coating vs simultaneous multilayer coating). Here, factors such as the influence of the binder and the drying of the two-layer anodes should be considered.
In conclusion, this research highlights the important role of formulation and manufacturing methods in shaping the electrode properties and cell performance of lithium-ion batteries, particularly by the use of two-layer anodes. While particle size may not have a significant influence on the electrochemical properties, it proves to be a key factor in determining crucial properties such as the anode adhesion strength and pore size distribution. Furthermore, the sequential manufacturing process of the two-layer anodes shows promising improvements in the microstructure. Thus, this study provides a very encouraging basis for the further exploration of non-simultaneous coating techniques and highlights the importance of the further investigation of factors such as binder influence and drying in optimizing these improved anode structures.

Supplementary Materials

The following supporting information can be downloaded at: https://www.mdpi.com/article/10.3390/batteries10020040/s1, Figure S1: SEM images of the one-layered and two-layered anodes with different ratios of spherical Gr 11 and Gr 18. One-layered anodes: (a) Gr 18/25+11/75 and (b) Gr 18/75+11/25. Two-layered anodes: (c) Gr 18/25+11/75 in the lower layer and (d) Gr 18/75+11/25 in the lower layer. All two-layered anodes consist of Gr 18/100 in the upper layer. The images show the cross-section of the anodes. All images were taken with a magnification of 1500×; Figure S2. Exemplary impedance spectra of G11. The red dotted lines represent the manual determination of the extension of the low-frequency line to the x axis. If the point of intersection is multiplied by the x axis times 3 and related to the area of the anode, the result is an areal ionic resistance of about ~810 Ohm cm². [According to the methodology of Ogihara et al. [59]; Figure S3. Discharge curves of one-layer electrode Gr 18/100 (a) as well as the two-layer anode Gr   18   /   100 18   /   100 (b) are shown. Thereby, the discharge curves after formation after rate-test and after the cell-ageing is shown.

Author Contributions

Conceptualization, L.G.; methodology, L.G., J.M. and A.S.; validation, L.G.; formal analysis, L.G.; investigation, L.G., J.M., A.S. and E.B.; data curation, L.G.; writing—original draft preparation, L.G.; writing—review and editing, J.M., A.S. and A.K.; visualization, L.G.; supervision, A.K.; project administration, A.K.; funding acquisition, A.K. All authors have read and agreed to the published version of the manuscript.

Funding

The authors gratefully acknowledge the Federal Ministry of Education and Research (BMBF) and “Projektträger Jülich” (PTJ) for giving the base for the here-demonstrated results within the project “HiStructures” (03XP0243B; TU Braunschweig).

Data Availability Statement

The data presented in this study are available in this manuscript and the accompanying supplementary material.

Acknowledgments

The authors would thank all participating colleagues for their valuable assistance as well as all the technicians of the Battery LabFactory for their help in performing the experiments.

Conflicts of Interest

The authors declare no conflicts of interest.

References

  1. Hannan, M.A.; Lipu, M.S.H.; Hussain, A.; Mohamed, A. A review of lithium-ion battery state of charge estimation and management system in electric vehicle applications: Challenges and recommendations. Renew. Sustain. Energy Rev. 2017, 78, 834–854. [Google Scholar] [CrossRef]
  2. Ku, T.-T.; Li, C.-S. Implementation of Battery Energy Storage System for an Island Microgrid with High PV Penetration. IEEE Trans. Ind. Appl. 2021, 57, 3416–3424. [Google Scholar] [CrossRef]
  3. Eftekhari, A. Lithium Batteries for Electric Vehicles: From Economy to Research Strategy. ACS Sustain. Chem. Eng. 2019, 7, 5602–5613. [Google Scholar] [CrossRef]
  4. European Environment Agency. Greenhouse Gas Emissions from Transport in Europe. Available online: https://www.eea.europa.eu/ims/greenhouse-gas-emissions-from-transport (accessed on 22 May 2023).
  5. Casimir, A.; Zhang, H.; Ogoke, O.; Amine, J.C.; Lu, J.; Wu, G. Silicon-based anodes for lithium-ion batteries: Effectiveness of materials synthesis and electrode preparation. Nano Energy 2016, 27, 359–376. [Google Scholar] [CrossRef]
  6. Azam, M.A.; Safie, N.E.; Ahmad, A.S.; Yuza, N.A.; Zulkifli, N.S.A. Recent advances of silicon, carbon composites and tin oxide as new anode materials for lithium-ion battery: A comprehensive review. J. Energy Storage 2021, 33, 102096. [Google Scholar] [CrossRef]
  7. Wu, J.; Cao, Y.; Zhao, H.; Mao, J.; Guo, Z. The critical role of carbon in marrying silicon and graphite anodes for high-energy lithium-ion batteries. Carbon Energy 2019, 1, 57–76. [Google Scholar] [CrossRef]
  8. Larcher, D.; Beattie, S.; Morcrette, M.; Edström, K.; Jumas, J.-C.; Tarascon, J.-M. Recent findings and prospects in the field of pure metals as negative electrodes for Li-ion batteries. J. Mater. Chem. 2007, 17, 3759. [Google Scholar] [CrossRef]
  9. Naoki, N.; Gleb, Y. High-Capacity Anode Materials for Lithium-Ion Batteries: Choice of Elements and Structures for Active Particles. Part. Part. Syst. Charact. 2014, 31, 317–336. [Google Scholar] [CrossRef]
  10. Zhang, L.; Liu, X.; Zhao, Q.; Dou, S.; Liu, H.; Huang, Y.; Hu, X. Si-containing precursors for Si-based anode materials of Li-ion batteries: A review. Energy Storage Mater. 2016, 4, 92–102. [Google Scholar] [CrossRef]
  11. Buqa, H.; Goers, D.; Holzapfel, M.; Spahr, M.E.; Novák, P. High Rate Capability of Graphite Negative Electrodes for Lithium-Ion Batteries. J. Power Sources 2005, 152, A474. [Google Scholar] [CrossRef]
  12. Simon, B.; Flandrois, S.; Guerin, K.; Fevrier-Bouvier, A.; Teulat, I.; Biensan, P. On the choice of graphite for lithium ion batteries. J. Power Sources 1999, 81–82, 312–316. [Google Scholar] [CrossRef]
  13. Yazami, R.; Touzain, P. A reversible graphite-lithium negative electrode for electrochemical generators. J. Power Sources 1983, 9, 365–371. [Google Scholar] [CrossRef]
  14. Han, Y.-J.; Kim, J.; Yeo, J.-S.; An, J.C.; Hong, I.-P.; Nakabayashi, K.; Miyawaki, J.; Jung, J.-D.; Yoon, S.-H. Coating of graphite anode with coal tar pitch as an effective precursor for enhancing the rate performance in Li-ion batteries: Effects of composition and softening points of coal tar pitch. Carbon 2015, 94, 432–438. [Google Scholar] [CrossRef]
  15. Asenbauer, J.; Eisenmann, T.; Kuenzel, M.; Kazzazi, A.; Chen, Z.; Bresser, D. The success story of graphite as a lithium-ion anode material—Fundamentals, remaining challenges, and recent developments including silicon (oxide) composites. Sustain. Energy Fuels 2020, 4, 5387–5416. [Google Scholar] [CrossRef]
  16. Wissler, M. Graphite and carbon powders for electrochemical applications. J. Power Sources 2006, 156, 142–150. [Google Scholar] [CrossRef]
  17. Zhang, H.; Yang, Y.; Ren, D.; Wang, L.; He, X. Graphite as anode materials: Fundamental mechanism, recent progress and advances. Energy Storage Mater. 2021, 36, 147–170. [Google Scholar] [CrossRef]
  18. Yoshio, M.; Wang, H.; Fukuda, K.; Umeno, T.; Abe, T.; Ogumi, Z. Improvement of natural graphite as a lithium-ion battery anode material, from raw flake to carbon-coated sphere. J. Mater. Chem. 2004, 14, 1754–1758. [Google Scholar] [CrossRef]
  19. Anthony, J.W.; Bideaux, R.A.; Bladh, K.W.; Nichols, M.C. Nichols, Handbook of Mineralogy: Volume I. Elements, Sulfides, Sulfosalts. Tucson, Arizona (Mineral Data Publishing), 1990. viii + 588 pp. Price $82.50 + $5.00 shipping and handling. Mineral. Mag. 1991, 55, 146–147. [Google Scholar] [CrossRef]
  20. Wu, Y.P.; Rahm, E.; Holze, R. Carbon anode materials for lithium ion batteries. J. Power Sources 2003, 114, 228–236. [Google Scholar] [CrossRef]
  21. Wu, Y.P.; Jiang, C.; Wan, C.; Holze, R. Anode materials for lithium ion batteries by oxidative treatment of common natural graphite. Solid State Ion. 2003, 156, 283–290. [Google Scholar] [CrossRef]
  22. Yoshio, M.; Wang, H.; Fukuda, K.; Hara, Y.; Adachi, Y. Effect of Carbon Coating on Electrochemical Performance of Treated Natural Graphite as Lithium-Ion Battery Anode Material. J. Electrochem. Soc. 2000, 147, 1245. [Google Scholar] [CrossRef]
  23. Ma, C.; Zhao, Y.; Li, J.; Song, Y.; Shi, J.; Guo, Q.; Liu, L. Synthesis and electrochemical properties of artificial graphite as an anode for high-performance lithium-ion batteries. Carbon 2013, 64, 553–556. [Google Scholar] [CrossRef]
  24. Zaghib, K.; Song, X.; Guerfi, A.; Rioux, R.; Kinoshita, K. Purification process of natural graphite as anode for Li-ion batteries: Chemical versus thermal. J. Power Sources 2003, 119–121, 8–15. [Google Scholar] [CrossRef]
  25. Park, J.B.; Lee, K.H.; Jeon, Y.J.; Lim, S.H.; Lee, S.M. Si/C composite lithium-ion battery anodes synthesized using silicon nanoparticles from porous silicon. Electrochim. Acta 2014, 133, 73–81. [Google Scholar] [CrossRef]
  26. Endo, M.; Kim, C.; Nishimura, K.; Fujino, T.; Miyashita, K. Recent development of carbon materials for Li ion batteries. Carbon 2000, 38, 183–197. [Google Scholar] [CrossRef]
  27. Pierson, H.O. Handbook of Carbon, Graphite, Diamonds and Fullerenes: Processing, Properties and Applications; William Andrew: Norwich, NY, USA, 2012; ISBN 9780815517399. [Google Scholar]
  28. Xing, B.; Zhang, C.; Cao, Y.; Huang, G.; Liu, Q.; Zhang, C.; Chen, Z.; Yi, G.; Chen, L.; Yu, J. Preparation of synthetic graphite from bituminous coal as anode materials for high performance lithium-ion batteries. Fuel Process. Technol. 2018, 172, 162–171. [Google Scholar] [CrossRef]
  29. Yan, L.; Fang, Y.; Deng, J.; Zhu, Y.; Zhang, Y.; Cheng, J.; Zhao, X. Preparation and Characterization of Mesocarbon Microbeads by the Co-Polycondensation of High-Temperature Coal Tar Pitch and Coal Pyrolytic Extracts. Materials 2022, 15, 5136. [Google Scholar] [CrossRef]
  30. Chen, Y.; Li, X.; Park, K.; Song, J.; Hong, J.; Zhou, L.; Mai, Y.-W.; Huang, H.; Goodenough, J.B. Hollow carbon-nanotube/carbon-nanofiber hybrid anodes for Li-ion batteries. J. Am. Chem. Soc. 2013, 135, 16280–16283. [Google Scholar] [CrossRef]
  31. Park, T.-H.; Yeo, J.-S.; Seo, M.-H.; Miyawaki, J.; Mochida, I.; Yoon, S.-H. Enhancing the rate performance of graphite anodes through addition of natural graphite/carbon nanofibers in lithium-ion batteries. Electrochim. Acta 2013, 93, 236–240. [Google Scholar] [CrossRef]
  32. Kim, A.R.; Vinothkannan, M.; Ramakrishnan, S.; Park, B.-H.; Han, M.-K.; Yoo, D.J. Enhanced electrochemical performance and long-term durability of composite membranes through a binary interface with sulfonated unzipped graphite nanofibers for polymer electrolyte fuel cells operating under low relative humidity. Appl. Surf. Sci. 2022, 593, 153407. [Google Scholar] [CrossRef]
  33. Kucinskis, G.; Bajars, G.; Kleperis, J. Graphene in lithium ion battery cathode materials: A review. J. Power Sources 2013, 240, 66–79. [Google Scholar] [CrossRef]
  34. Yoshio, M.; Wang, H.; Fukuda, K. Spherical carbon-coated natural graphite as a lithium-ion battery-anode material. Angew. Chem. Int. Ed Engl. 2003, 42, 4203–4206. [Google Scholar] [CrossRef] [PubMed]
  35. Fischer, S.; Doose, S.; Müller, J.; Höfels, C.; Kwade, A. Impact of Spheroidization of Natural Graphite on Fast-Charging Capability of Anodes for LIB. Batteries 2023, 9, 305. [Google Scholar] [CrossRef]
  36. Lämmerer, W.; Flachberger, H. Wissenswertes zur Charakterisierung und Aufbereitung von Rohgrafiten. Berg. Huettenmaenn. Monatsh. 2017, 162, 336–344. [Google Scholar] [CrossRef]
  37. Jara, A.D.; Betemariam, A.; Woldetinsae, G.; Kim, J.Y. Purification, application and current market trend of natural graphite: A review. Int. J. Min. Sci. Technol. 2019, 29, 671–689. [Google Scholar] [CrossRef]
  38. Wang, H.; Ikeda, T.; Fukuda, K.; Yoshio, M. Effect of milling on the electrochemical performance of natural graphite as an anode material for lithium-ion battery. J. Power Sources 1999, 83, 141–147. [Google Scholar] [CrossRef]
  39. Diehm, R.; Kumberg, J.; Dörrer, C.; Müller, M.; Bauer, W.; Scharfer, P.; Schabel, W. In-Situ Investigations of Simultaneous Two-Layer Slot Die Coating of Component Graded Anodes for improved High Energy Li-Ion Batteries. Energy Technol. 2020, 8, 1901251. [Google Scholar] [CrossRef]
  40. Kumberg, J.; Müller, M.; Diehm, R.; Spiegel, S.; Wachsmann, C.; Bauer, W.; Scharfer, P.; Schabel, W. Drying of Lithium-Ion Battery Anodes for Use in High-Energy Cells: Influence of Electrode Thickness on Drying Time, Adhesion, and Crack Formation. Energy Technol. 2019, 7, 1900722. [Google Scholar] [CrossRef]
  41. Chen, L.-C.; Liu, D.; Liu, T.-J.; Tiu, C.; Yang, C.-R.; Chu, W.-B.; Wan, C.-C. Improvement of lithium-ion battery performance using a two-layered cathode by simultaneous slot-die coating. J. Energy Storage 2016, 5, 156–162. [Google Scholar] [CrossRef]
  42. Gottschalk, L.; Oertel, C.; Strzelczyk, N.; Müller, J.; Krüger, J.; Haselrieder, W.; Kwade, A. Improving the Performance of Lithium-Ion Batteries Using a Two-Layer, Hard Carbon-Containing Silicon Anode for Use in High-Energy Electrodes. Energy Technol. 2022, 5, 2200858. [Google Scholar] [CrossRef]
  43. Zheng, H.; Li, J.; Song, X.; Liu, G.; Battaglia, V.S. A comprehensive understanding of electrode thickness effects on the electrochemical performances of Li-ion battery cathodes. Electrochim. Acta 2012, 71, 258–265. [Google Scholar] [CrossRef]
  44. Wood, D.L.; Li, J.; Daniel, C. Prospects for reducing the processing cost of lithium ion batteries. J. Power Sources 2015, 275, 234–242. [Google Scholar] [CrossRef]
  45. Meyer, C.; Bockholt, H.; Haselrieder, W.; Kwade, A. Characterization of the calendering process for compaction of electrodes for lithium-ion batteries. J. Mater. Process. Technol. 2017, 249, 172–178. [Google Scholar] [CrossRef]
  46. Haselrieder, W.; Westphal, B.; Bockholt, H.; Diener, A.; Höft, S.; Kwade, A. Measuring the coating adhesion strength of electrodes for lithium-ion batteries. Int. J. Adhes. Adhes. 2015, 60, 1–8. [Google Scholar] [CrossRef]
  47. Westphal, B.G.; Mainusch, N.; Meyer, C.; Haselrieder, W.; Indrikova, M.; Titscher, P.; Bockholt, H.; Viöl, W.; Kwade, A. Influence of high intensive dry mixing and calendering on relative electrode resistivity determined via an advanced two point approach. J. Energy Storage 2017, 11, 76–85. [Google Scholar] [CrossRef]
  48. Froboese, L.; Titscher, P.; Westphal, B.; Haselrieder, W.; Kwade, A. Mercury intrusion for ion- and conversion-based battery electrodes—Structure and diffusion coefficient determination. Mater. Charact. 2017, 133, 102–111. [Google Scholar] [CrossRef]
  49. Weber, M.; Schoo, A.; Sander, M.; Mayer, J.K.; Kwade, A. Introducing Spectrophotometry for Quality Control in Lithium-Ion-Battery Electrode Manufacturing. Energy Technol. 2023, 11, 57. [Google Scholar] [CrossRef]
  50. Landesfeind, J.; Hattendorff, J.; Ehrl, A.; Wall, W.A.; Gasteiger, H.A. Tortuosity Determination of Battery Electrodes and Separators by Impedance Spectroscopy. J. Electrochem. Soc. 2016, 163, A1373–A1387. [Google Scholar] [CrossRef]
  51. Morasch, R.; Landesfeind, J.; Suthar, B.; Gasteiger, H.A. Detection of Binder Gradients Using Impedance Spectroscopy and Their Influence on the Tortuosity of Li-Ion Battery Graphite Electrodes. J. Electrochem. Soc. 2018, 165, A3459–A3467. [Google Scholar] [CrossRef]
  52. Marks, T.; Trussler, S.; Smith, A.J.; Xiong, D.; Dahn, J.R. A Guide to Li-Ion Coin-Cell Electrode Making for Academic Researchers. J. Electrochem. Soc. 2011, 158, A51. [Google Scholar] [CrossRef]
  53. Laue, V.; Röder, F.; Krewer, U. Joint structural and electrochemical modeling: Impact of porosity on lithium-ion battery performance. Electrochim. Acta 2019, 314, 20–31. [Google Scholar] [CrossRef]
  54. Wood, M.; Li, J.; Du, Z.; Daniel, C.; Dunlop, A.R.; Polzin, B.J.; Jansen, A.N.; Krumdick, G.K.; Wood, D.L. Impact of secondary particle size and two-layer architectures on the high-rate performance of thick electrodes in lithium-ion battery pouch cells. J. Power Sources 2021, 515, 230429. [Google Scholar] [CrossRef]
  55. Neidhart, L.; Fröhlich, K.; Eshraghi, N.; Cupid, D.; Winter, F.; Jahn, M. Aqueous Manufacturing of Defect-Free Thick Multi-Layer NMC811 Electrodes. Nanomaterials 2022, 12, 317. [Google Scholar] [CrossRef] [PubMed]
  56. Liu, Y.; Zhu, Y.; Cui, Y. Challenges and opportunities towards fast-charging battery materials. Nat. Energy 2019, 4, 540–550. [Google Scholar] [CrossRef]
  57. Parikh, D.; Christensen, T.; Li, J. Correlating the influence of porosity, tortuosity, and mass loading on the energy density of LiNi0.6Mn0.2Co0.2O2 cathodes under extreme fast charging (XFC) conditions. J. Power Sources 2020, 474, 228601. [Google Scholar] [CrossRef]
  58. Parikh, D.; Christensen, T.; Hsieh, C.-T.; Li, J. Elucidation of Separator Effect on Energy Density of Li-Ion Batteries. J. Electrochem. Soc. 2019, 166, A3377–A3383. [Google Scholar] [CrossRef]
  59. Ogihara, N.; Kawauchi, S.; Okuda, C.; Itou, Y.; Takeuchi, Y.; Ukyo, Y. Theoretical and Experimental Analysis of Porous Electrodes for Lithium-Ion Batteries by Electrochemical Impedance Spectroscopy Using a Symmetric Cell. J. Electrochem. Soc. 2012, 159, A1034–A1039. [Google Scholar] [CrossRef]
  60. da Silva, M.T.Q.S.; do Rocio Cardoso, M.; Veronese, C.M.P.; Mazer, W. Tortuosity: A brief review. Mater. Today Proc. 2022, 58, 1344–1349. [Google Scholar] [CrossRef]
  61. Gottschalk, L.; Strzelczyk, N.; Adam, A.; Kwade, A. Influence of different anode active materials and blends on the performance and fast-charging capability of lithium-ion battery cells. J. Energy Storage 2023, 68, 107706. [Google Scholar] [CrossRef]
  62. Huber, K.; Adam, A.; Grießl, D.; Kwade, A. Understanding slurry mixing effects on the fast charging capability of lithium-ion battery cells: Methodology and case study. J. Power Sources 2022, 536, 231455. [Google Scholar] [CrossRef]
  63. Boyce, A.M.; Cumming, D.J.; Huang, C.; Zankowski, S.P.; Grant, P.S.; Brett, D.J.L.; Shearing, P.R. Design of Scalable, Next-Generation Thick Electrodes: Opportunities and Challenges. ACS Nano 2021, 15, 18624–18632. [Google Scholar] [CrossRef] [PubMed]
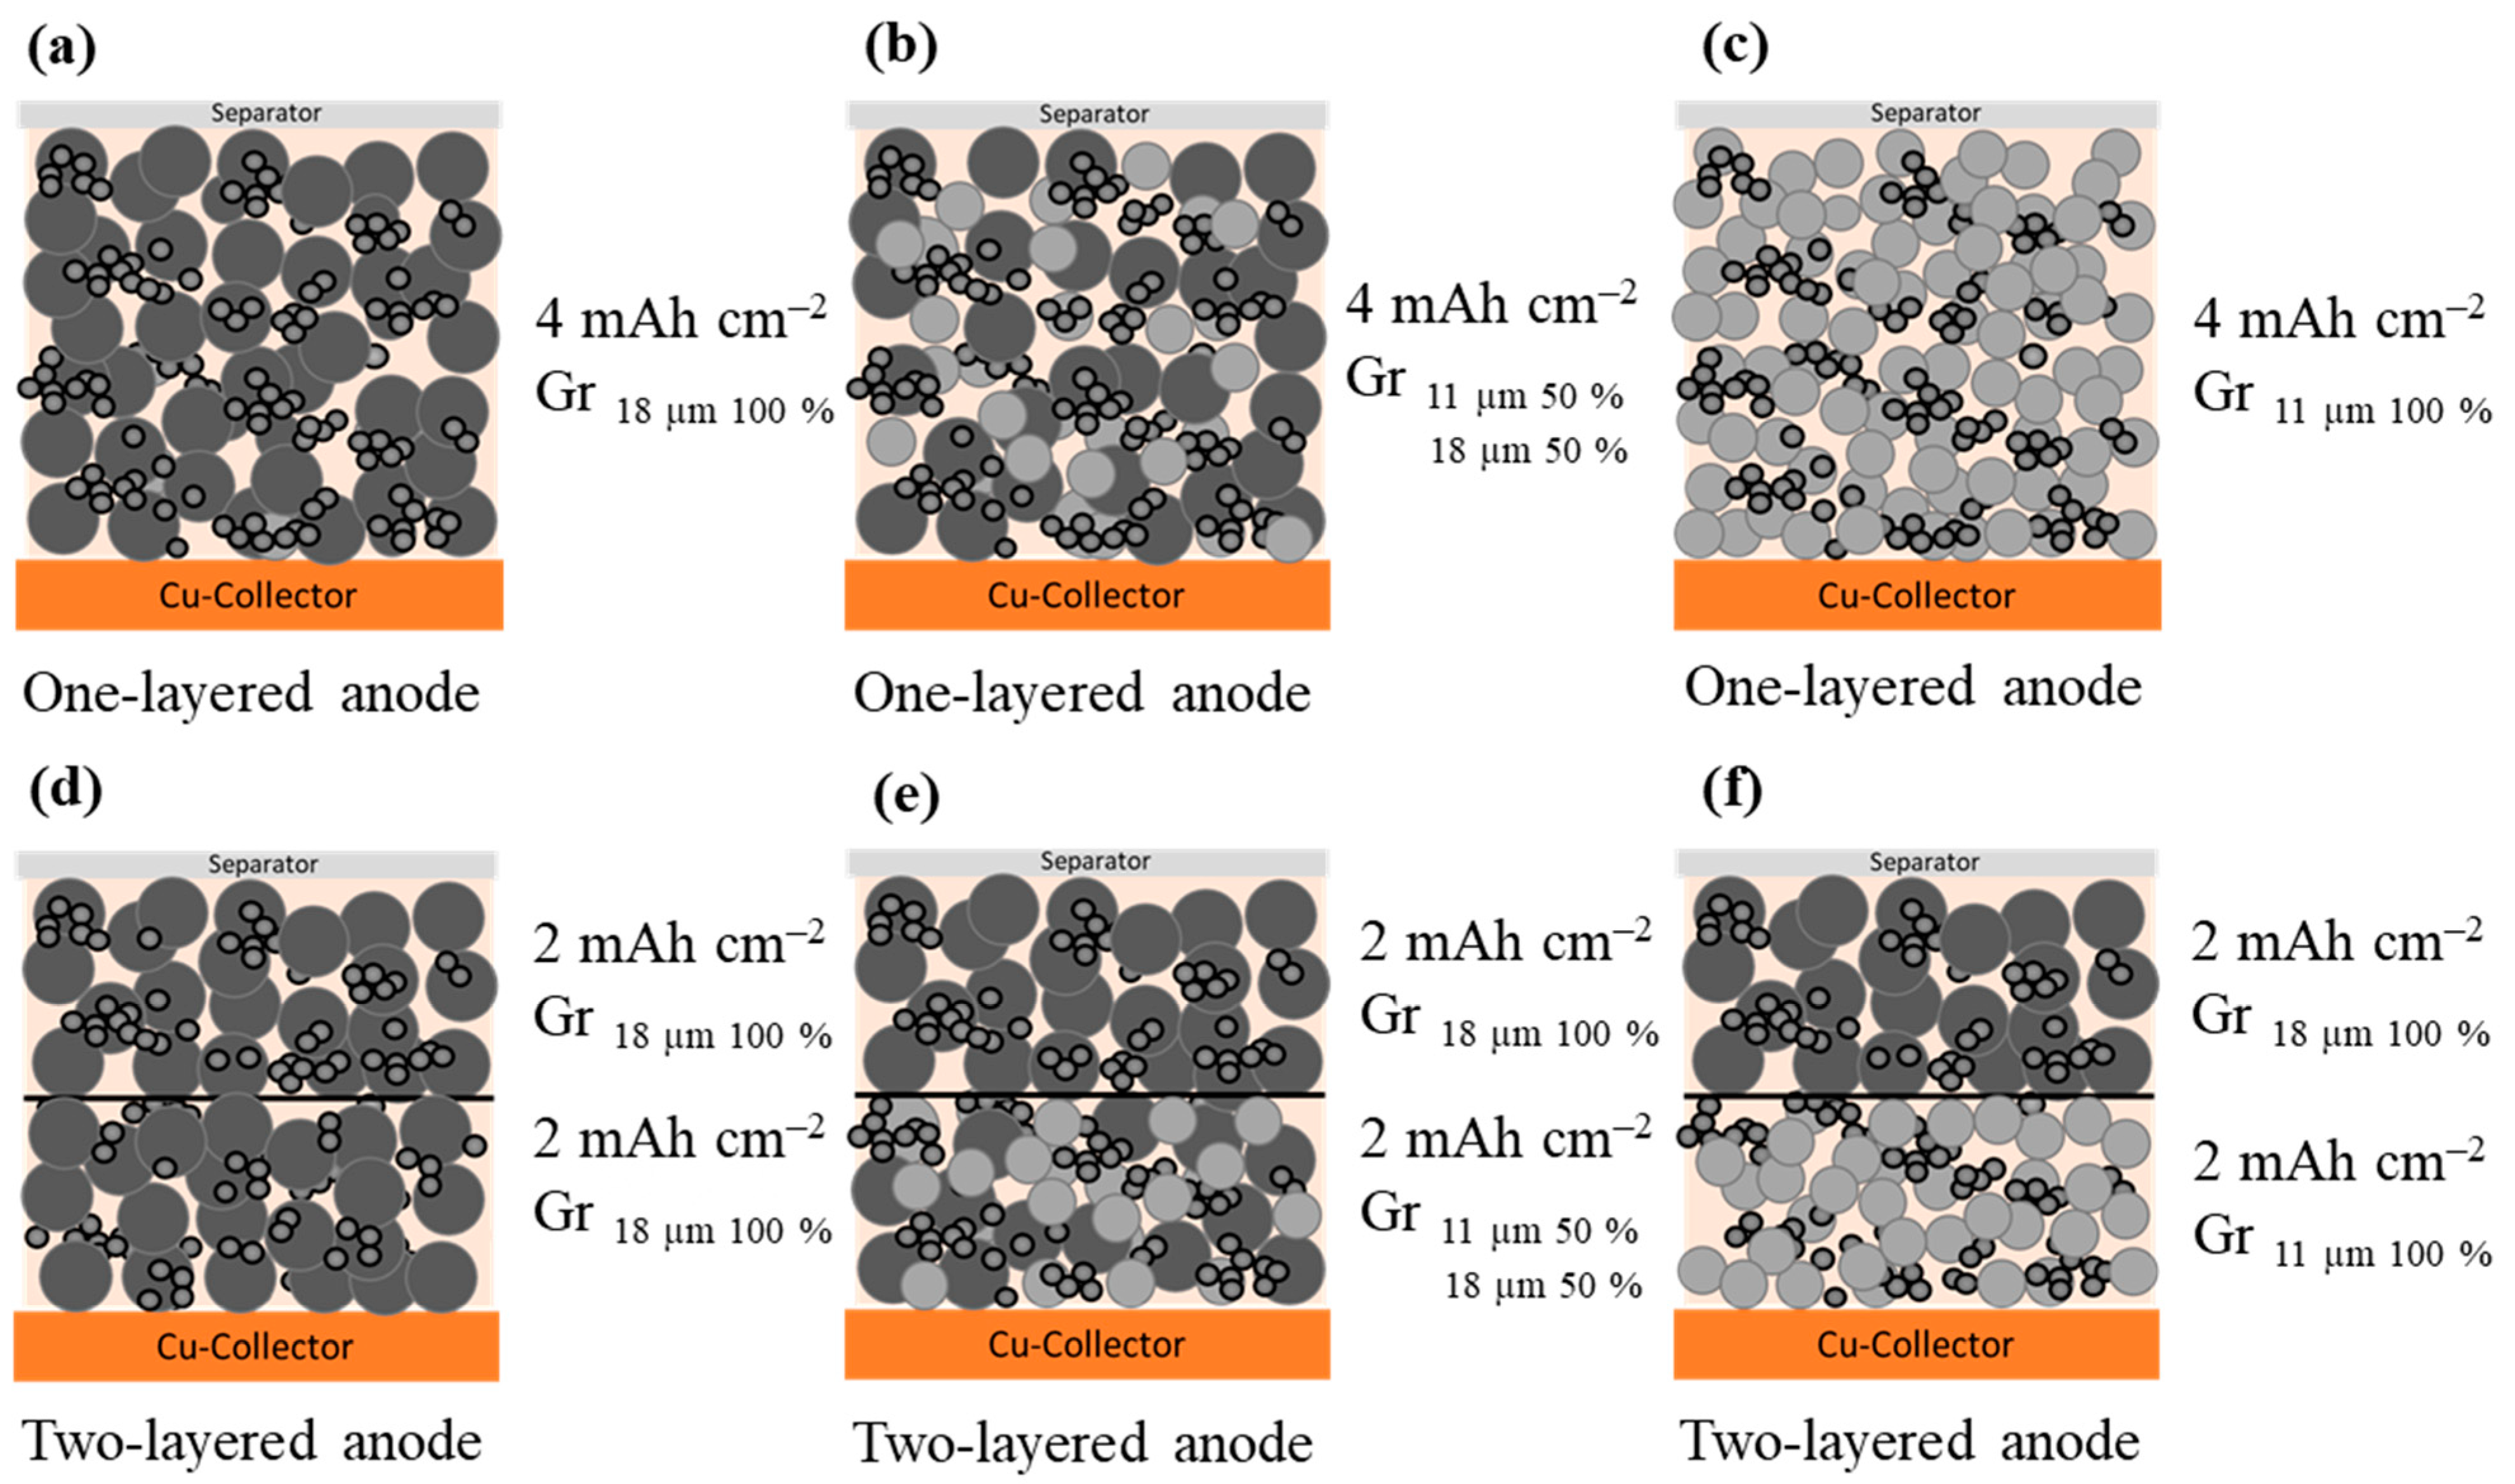
Figure 1. Simplified diagram of the anodes that are produced: (ac) one-layered reference anodes with different particle size distribution of spherical Gr and (df) two-layered anodes containing different particle sizes of graphite in the lower layer and only the Gr 18 in the upper layer. The light grey circles stand for the smaller particles (Gr 11, x50 = 11 µm) and the dark circles the larger particles (Gr 18, x50 = 18 µm).
Batteries 10 00040 g001
Figure 2. Cumulative particle size distributions of spherical graphite with x50 = 18 µm (Gr 18, green line) and x50 = 11 µm (Gr 11, black line).
Batteries 10 00040 g002
Figure 3. SEM images of the one-layered and two-layered anodes with different ratios of spherical Gr 11 and Gr 18. One-layered anodes: (a) Gr 18/100, (b) Gr 18/50+11/50, and (c) Gr 11/100. Two-layered anodes: (d) Gr 18/100 in the lower layer, (e) Gr 18/50+11/50 in the lower layer, and (f) Gr 11/100 in the lower layer. All two-layered anodes consist of Gr 18/100 in the upper layer. The images show the cross-section of the anodes. All images were taken with a magnification of 1500×.
Batteries 10 00040 g003
Figure 4. Adhesion strength of one-layer anodes (a) as well as two-layer anodes (b) with different amounts of spherical graphite particle sizes depending on the specific surface area. (c) Exemplary pull-off test of a one-layer anode containing Gr 11/100.
Batteries 10 00040 g004
Figure 5. Pore size distribution (a), exemplary Nyquist plot in a symmetrical cell setup using a non-intercalating electrolyte (b), and areal ionic resistance (c) of the manufactured two-layer anodes as well as the one-layer references.
Batteries 10 00040 g005
Figure 6. Electrode color value and carbon black (CB) amount on the electrode surface as a function of the thickness of the upper anode layer (a) and electrical conductivity in dependency of the Gr 18 amount in the one-layer anodes as well as in the lower layer of the two-layer anodes (b).
Batteries 10 00040 g006
Figure 7. Charge rate test (a), long-term cycling (b), and coulomb efficiency (CE) (c) of the manufactured one-layer and two-layer anodes.
Batteries 10 00040 g007
Table 1. Different spherical graphites used for the two-layered anodes.
Anode
Active Material
AbbreviationParticle Size x50 [µm]Surface Area
[m2/g]
Density [g/cm ³]Capacity 1 [mAh/g]
Graphite x50 = 18 µmGr 18 17.61.92.20364.8
Graphite x50 = 11 µmGr 11 10.82.352.24363.3
1 The capacity shown in Table 1 represents a manufacturer’s specification before the first cycle.
Table 2. Different slurry compositions of one-layer and two-layer reference anodes.
NameRatio
Gr 18:Gr 11 [%]
Gr 18 [wt. %]Gr 11 [wt. %]Carbon Black [wt. %]Binder (Na-CMC + SBR) [wt. %]
Gr 18/100100:093.00-1.405.60
Gr 18/75+11/2575:2569.7523.251.405.60
Gr 18/50+11/5050:5046.5046.501.405.60
Gr 18/25+11/7575:2523.2569.751.405.60
Gr 11/1000:100-93.001.405.60
Table 3. Manufactured one-layered and two-layered electrodes and their properties after manufacturing.
AnodeOne-LayeredAnode Thickness
[µm]
Anode Density
[g/cm³]
Theoretical
Porosity
[%]
Gr 18/100One-layered1350.9557
Gr 18/75+11/25One-layered1271.0254
Gr 18/50+11/50One-layered1281.0155
Gr 18/25+11/75One-layered1261.0354
Gr 11/100One-layered1251.0354
A n o d e   L o w e r   l a y e r U p p e r   l a y e r Two-LayeredAnode Thickness
[µm]
Anode density
[g/cm³]
Theoretical
Porosity
[%]
Gr   18   /   100 18   /   100 Two-layered1300.9955
Gr   18   /   75 + 18   /   25 18   /   100 Two-layered1261.0354
Gr   18   /   50 + 11   /   50 18   /   100 Two-layered1231.0553
Gr   18   /   25 + 11   /   75 18   /   100 Two-layered1221.0652
Gr   11   /   100 18   /   100 Two-layered1221.0354
Table 4. Slurry compositions of the cathode.
ElectrodeNCM622
[wt. %]
Conductive Graphite [wt. %]Carbon Black [wt. %]Binder (PVDF) [wt. %]
Cathode95.50.751.52.25
Disclaimer/Publisher’s Note: The statements, opinions and data contained in all publications are solely those of the individual author(s) and contributor(s) and not of MDPI and/or the editor(s). MDPI and/or the editor(s) disclaim responsibility for any injury to people or property resulting from any ideas, methods, instructions or products referred to in the content.