Article

Comparative Analysis of Lithium-Ion Batteries for Urban Electric/Hybrid Electric Vehicles

1
Institute of Mechanics—Bulgarian Academy of Sciences, 1000 Sofia, Bulgaria
2
Department of Electrical Measurement Systems, Technical University—Sofia, 1000 Sofia, Bulgaria
3
Department of Power Electronics, Technical University—Sofia, 1000 Sofia, Bulgaria
*
Author to whom correspondence should be addressed.
Batteries 2024, 10(6), 186; https://doi.org/10.3390/batteries10060186
Submission received: 15 April 2024 / Revised: 20 May 2024 / Accepted: 23 May 2024 / Published: 29 May 2024

Abstract

:
This paper presents an experimental comparison of two types of Li-ion battery stacks for low-voltage energy storage in small urban Electric or Hybrid Electric Vehicles (EVs/HEVs). These systems are a combination of lithium battery cells, a battery management system (BMS), and a central control circuit—a lithium energy storage and management system (LESMS). Li-Ion cells are assembled with two different active cathode materials, nickel–cobalt–aluminum (NCA) and lithium iron phosphate (LFP), both with an integrated decentralized BMS. Based on experiments conducted on the two assembled LESMSs, this paper suggests that although LFP batteries have inferior characteristics in terms of energy and power density, they have great capacity for improvement.

1. Introduction

Electromobility is the process of using electric vehicles as a way to reduce emissions of carbon dioxide and other pollutants that are common to traditional vehicles with internal combustion engines. This term generally includes both passenger cars and heavy-duty vehicles that use electric power. The main goal of electromobility is to create a cleaner, more efficient, and sustainable transport system. Urban electric and hybrid vehicles (EVs and HEVs) have become popular choices for modern urban transportation due to their environmental and operational advantages. However, like any technological product, they also have their drawbacks. The following is a summary of their main advantages and disadvantages [1,2,3]:
  • Advantages:
    -
    Reduced carbon dioxide emissions—EVs and HEVs emit significantly less or no carbon dioxide into the atmosphere compared to conventional cars, making them more environmentally friendly.
    -
    Savings on fuel costs—Using electricity as the main or partial source of energy can significantly reduce fuel costs.
    -
    Low operating costs—Electric motors require less maintenance than conventional internal combustion engines because they have fewer moving parts.
    -
    Quiet operation—EVs are significantly quieter than vehicles with internal combustion engines, reducing noise pollution in urban environments.
    -
    Support from public and public funds—Many governments offer tax breaks, subsidies, and other incentives for the purchase and use of EVs and HEVs.
  • Disadvantages:
    -
    Limited range—Many electric vehicles still have a relatively limited range per charge compared to gasoline-powered cars.
    -
    Charging time—Charging an EV battery can take significantly longer than filling up a traditional car with fuel.
    -
    Insufficient charging infrastructure—Many cities still lack a sufficiently developed infrastructure for the fast and convenient charging of electric vehicles.
    -
    A high initial cost—Despite declining prices over time, EVs and HEVs often have higher purchase prices than conventional cars.
    -
    The environmental issues of batteries and other elements of these vehicles—The production and disposal of lithium-ion batteries bring environmental risks and challenges, including the mining of rare metals and waste management.
Choosing an urban EV or HEV can be influenced by many factors, including personal preference, the availability of charging infrastructure, and government policies.
Lithium-ion batteries are the main source of energy for electric and hybrid vehicles, including those intended for urban use. They have a number of advantages that make them the best choice for this type of transport [4,5,6]:
-
Compactness and lightness—For an urban vehicle, it is important that the battery occupies a minimum amount of space and adds as little weight as possible to the vehicle. Lithium-ion batteries are lighter and smaller in size than other types of batteries, which make them suitable for inclusion in the construction of small and maneuverable city cars.
-
Modularity—Batteries can be designed into modular systems, allowing them to be easily added or removed from the vehicle for maintenance purposes or capacity upgrades.
-
Thermal management—Urban vehicles often operate in stop/start conditions, which can cause the battery temperature to rise. Effective temperature management systems are critical to maintaining optimal performance and extending battery life.
-
Fast and flexible charging—Lithium-ion batteries usually support fast charging, which is important for urban vehicles, as they can be quickly recharged during short interruptions in service. Also, batteries are often compatible with different types of charging stations, offering flexibility in urbanized areas with diverse charging infrastructure.
-
Durability and reliability—In an urbanized environment where vehicles are used intensively, it is important that batteries have high durability and can withstand multiple charging cycles without a significant reduction in their efficiency.
-
Environmental sustainability—Given the increasing regulations to reduce emissions and increase sustainability, lithium-ion batteries offer an environmentally friendly solution, as they do not require the burning of fuels and are less polluting than traditional car batteries.
These characteristics of lithium-ion batteries make them suitable for use in urban electric and hybrid vehicles, providing them with reliability, efficiency, and flexibility in energy management.
Thus, lithium-ion (Li-Ion) batteries are currently the best energy storage technology for EVs/HEVs and, as such, have been widely investigated in the literature [7,8]. The focus of previous studies ranges from determining the batteries’ carbon footprint and energy consumption during production [9,10,11] to conducting numerous experiments designed to obtain electric equivalent circuit models based on charging/discharging characteristics with different types of current waveforms or impedance measurements. These current profiles are important because the typical characteristics of cells in a datasheet are given for a constant current, which is not the case in EV/HEV applications. The potential advantages and disadvantages of the most popular types of cells for such applications, namely nickel–manganese–cobalt (NMC) and nickel–cobalt–aluminum (NCA), are widely available, and these are the ones that are primarily used in EVs [1,12,13]. There are, however, fewer equivalent studies covering LFP batteries, as these are considered suboptimal both in energy and power density [12].
On the other hand, batteries for hybrid and electric cars differ in several important characteristics depending on the specific requirements and purposes of these vehicles. The main differences between them are as follows [4,7]:
  • Capacity and energy density
HEV: Hybrid car batteries have lower capacity and energy density than electric car batteries. They are designed to assist the internal combustion engine during acceleration, provide short-term electric traction, and store the energy generated during regenerative braking.
EV: The batteries of electric cars have significantly higher capacity and energy density as they must provide the main source of energy for driving the car. They are designed to allow for a longer mileage on a single charge.
2.
Size and weight
HEV: Hybrid car batteries are smaller and lighter because they do not need to provide a large amount of energy for an extended period. This helps keep the overall weight of the vehicle lower.
EV: Electric vehicle batteries are larger and heavier due to the greater capacity required to provide a longer range. This results in an increase in the overall weight of the vehicle, which, in turn, necessitates the use of lighter materials in other components of the vehicle to compensate.
3.
Type and chemical composition
HEVs: Hybrid electric vehicles use nickel–metal hydride (NiMH) batteries or lithium-ion batteries. NiMH batteries are cheaper and more reliable but have a lower energy density than Li-ion batteries.
EV: Electric vehicles mainly use lithium-ion batteries due to their high energy density, long life, and relatively low weight. Recently, other types of batteries have been developed, such as solid-state batteries, which promise better performance.
4.
Charge and Use Cycles
HEV: Hybrid car batteries are used for short periods and are charged and discharged frequently, but in smaller cycles. They must withstand numerous short charge and discharge cycles.
EV: Electric car batteries are used for longer periods and charged less frequently but require longer charging times. They must withstand greater and longer charge and discharge cycles.
5.
Terms of use
HEVs: HEVs operate in smaller temperature and load ranges because the battery is not the only source of energy.
EVs: EVs must function efficiently in a wide range of conditions, including extreme temperatures and high loads, as the battery is the main source of energy that drives the vehicle.
Batteries for hybrid and electric cars have specific characteristics that reflect the different requirements and uses of these vehicles. Hybrid batteries are smaller, lighter, and designed for short charge and discharge cycles, while electric car batteries have a larger capacity and are designed to provide long ranges on a single charge and can therefore operate under more severe operating conditions.
Recent developments in battery management system (BMS) software have led to the creation of efficient algorithms for accurate state of charge (SOC) and state of health (SOH) estimations and the balancing of individual cells when part of a pack, as is the case in an LESMS. The balancing methods used are generally based on active and passive balancing techniques, but methods based on a Kalman filter (KF) also exist [14,15,16]. These studies allowed for the implementation of intelligent BMSs in high-voltage Li-ion packs used in energy storage systems based on NMC or NCA types of batteries. However, there has been a recent trend among all EV manufacturers to try LFP cells in EVs as they have a significantly lower price because they do not require rare earth materials despite having a lower energy density. These cells can be assembled as a stack with a combined energy greater than 100 kWh [17,18]. As this trend is recent, there are not many direct comparisons between implementing an LESMS based on NCA or NMC cells and implementing LFP cells to reduce costs.
These applications do not need to use a high-voltage bus (400–800 V) as they typically have a voltage around 48–96 V, leading to a smaller number of cells and a smaller final volume. To implement such systems, conducting additional research on low-voltage systems is an important step [19,20]. This is the primary motivation for this paper, where direct comparisons are made between an LFP and NCA system with the same energy, working with voltages under 100 V. The experimental data are gathered from real conditions using a mechatronic system that is mounted on a test vehicle [21].
Recent advances in battery technology for urban EVs/HEVs are aimed at improving the energy density, extending the battery life, increasing safety, and reducing costs. These innovations will continue to support the growth and spread of electric and hybrid vehicles, making them more affordable and efficient for consumers. Some of the main innovations and achievements made are as follows [6,9,13]:
  • Solid-State Batteries
Solid-state batteries are one of the most promising new technologies. They use solid electrolytes instead of liquid ones, which increases the energy density and safety of the batteries. These batteries are less prone to overheating, and the possibilities of short circuits are greatly reduced. Examples of progress in this area include developments from companies such as Toyota and QuantumScape.
2.
Lithium–sulfur (Li-S) batteries
Lithium–sulfur batteries offer significantly higher energy density than traditional lithium-ion batteries. They use sulfur as the cathode material, which reduces costs and increases capacity. Although there are still challenges related to cycle life and stability, advances in materials science and engineering technology continue.
3.
Improvements in electrode materials
The development of new anode and cathode materials, such as silicon anodes and nickel–cobalt–manganese (NCM) cathodes, is helping to increase battery capacity and life. Silicon anodes, for example, can store more lithium ions than traditional graphite anodes.
4.
Fast charging
New technologies and methods of accelerated charging allow a significant reduction in battery charging time. An example of this is the development of new electrolytes and improved thermal management methods that allow rapid charging without overheating the batteries.
5.
Intelligent Battery Management Systems (BMSs)
Battery management systems are becoming increasingly intelligent, using machine learning algorithms and artificial intelligence to optimize charging and discharging, monitor battery health, and extend battery life. These systems can predict and prevent potential problems, thereby increasing the safety and efficiency of batteries.
6.
Recycling and sustainability
The sustainable production and recycling of batteries is becoming increasingly important. New recycling methods enable the extraction and reuse of valuable metals, such as lithium, cobalt, and nickel, reducing dependence on raw material extraction and minimizing the environmental footprint.
7.
Thermal management systems
Improvements in thermal management systems help maintain the optimal operating temperature of batteries, increasing their efficiency and life. The use of new cooling materials and passive and active cooling methods reduces the risk of overheating and increases safety.

2. Goals

The goal of this study is to conduct basic tests on low-voltage LESMSs for use in low-range urban EVs/HEVs. Two experimental systems are built—one using NCA cells and the other using LFP cells. These are integrated in a test vehicle to collect data during real driving cycles. The collected data allow us to make direct comparisons between the two systems and to draw conclusions about their potential for uses in low-cost urban EVs/HEVs and in other possible applications such as off-grid PV systems. In this way, we can fill the gap in the literature on the subject related to the testing of energy storage elements in real operating conditions related to their use for urban transport vehicles.

3. Materials and Methods

For a proper comparison between NCA and LFP cells, the characteristics of both cells themselves and the assembled battery packs must be examined. These should be established by using appropriate instrumentation to assemble and provide long-lasting energy storage and management systems (LESMSs) with high power, safe low voltage and operation, zero carbon emissions, and low costs [22,23].

3.1. Types of Li-Ion Cells Used in EVs/HEVs

Only two types of Li-ion cell chemistries have stood the test of time and are widely used for energy storage in EVs/HEVs [4,13]:
  • Lithium–nickel–manganese–cobalt (NMC). The active cathode material is LiCoNiMnO2. The nominal voltage of one cell is in the range of 3.6–3.7 V [24].
  • Lithium–cobalt–nickel–aluminum (NCA). The active cathode material is LiCoNiAlO2. The nominal voltage is in the range of 3.6–3.7 V [25].
These are lithium cells that are based on cobalt and have high energy density, and as such, they are widely used in modern EV/HEV battery stacks. Their charge characteristics are almost identical. They have a relatively low flash point at 215 °C and are inclined to the “thermal runaway” effect, which warrants additional protection circuits [26,27,28]. The NCA-type cell has a higher relative energy density in comparison to the NMC-type cell, but it is more expensive.
Relatively recently, some vehicle manufacturers tried using an LFP cell for energy storage:
  • Lithium–iron–phosphate (LFP). The active cathode material is LiFePO4. The charging voltage is in the range of 2.1–3.65 V, but it can be up to 3.9 V if doped with yttrium—whose active cathode material is LiFeYPO4. The nominal voltage is in the range of 3.2–3.35 V [24]. These cells have a flash point of 270 °C and, as such, are harder to ignite than NMC or NCA in the case of improper charging or mechanical damage.
The anode material of all cells is graphite.
A comparison of the cells used is given in Table 1. It should be noted that due to the smaller capacity and energy of an individual NCA cell, a comparison is made between 26 cells in parallel. This way, the cells are compared with relatively the same energy. The data are from the manufacturers [24,29].

3.2. Stack Assembly

The battery stack is made using serial combinations of cells. Parameters of individual cells are given in Table 1.
  • Li-ion battery consisting of 24 series connected prismatic LFP cells with chemistry
LiFeYPO4 has a nominal size of 150 × 180 × 70 mm, a capacity 100 Ah, and a nominal voltage of 3.33 V. The open-circuit voltage (OCV) of the battery is −79.2 V, and the energy of the stack is 7.92 kWh [29].
  • Li-ion battery stack consisting of 676 cylindrical NCA cells with chemistry
For LiNiCoAlO2, the nominal size of each cell is 18 × 65 mm, the capacity 3.5 Ah, and the nominal voltage 3.65 V [2]. The cells are combined in 26p (26 cells in parallel) with OCV − 3.65 V and a capacity of ~91 Ah. With this combination, one 26P combination NCA cells is approximately equal in capacity to one LFP cell. The final assembly is 26P × 26S (26 of the individual parallel cells are combined in series), the OCV is 96.4 V, and the energy is 8 kWh. A 10 A fuse is connected in series with each cell for additional protection and to reduce the chance of “thermal runaway” of the battery in the case of a fire [19,28,30]. Both cell stacks have approximately the same energy −LFP − 7.92 kWh and NCA − 8 kWh. The data of the used battery are summarized in Table 2.

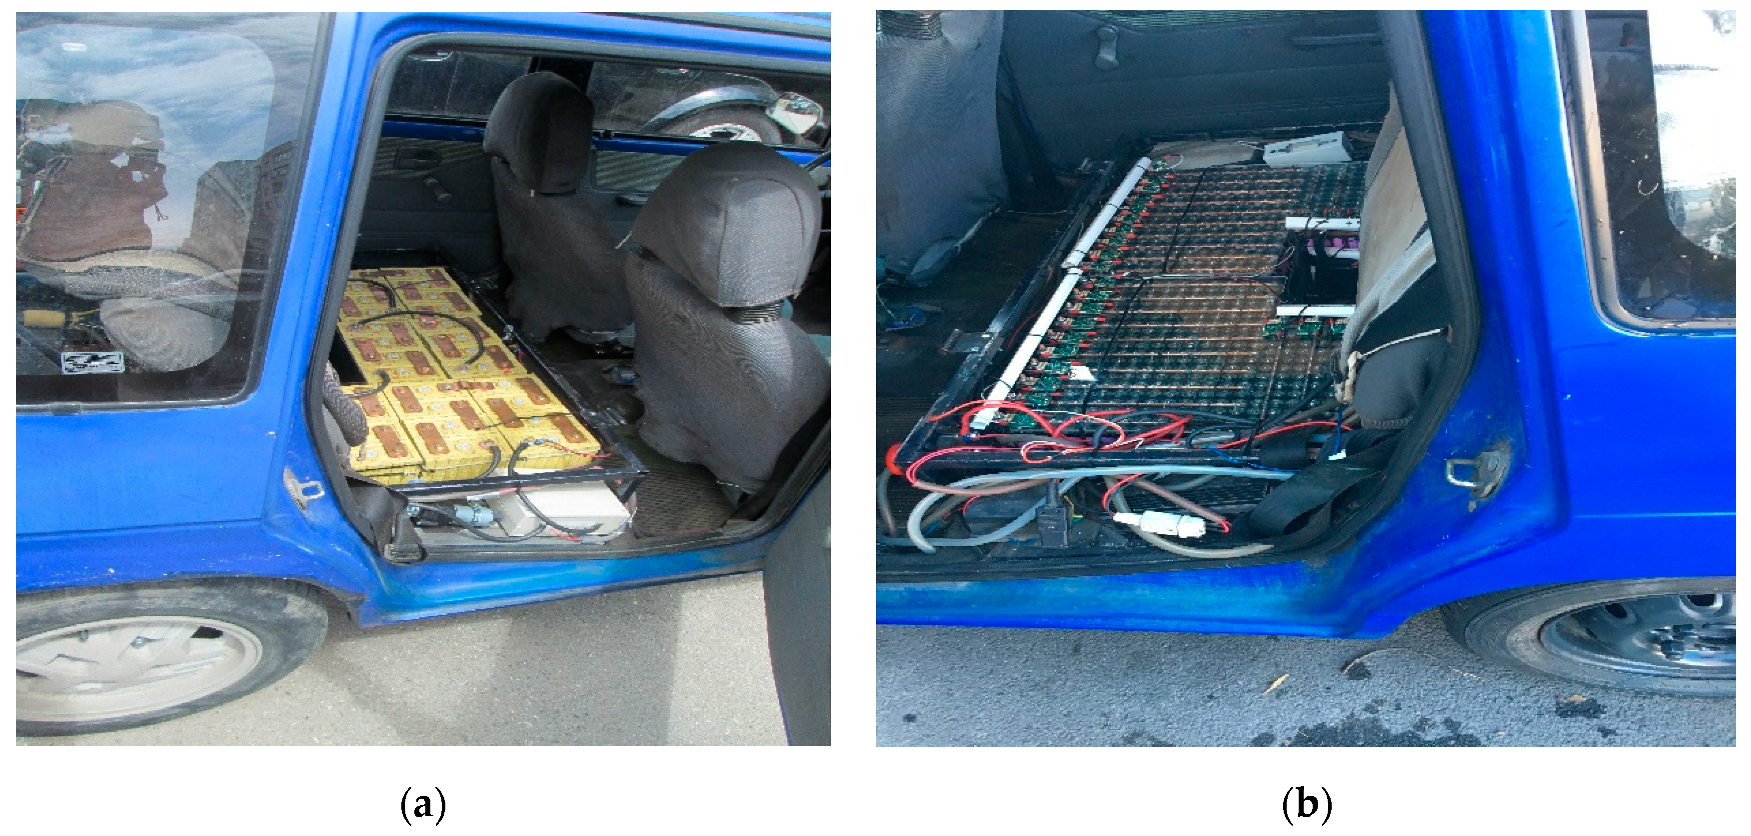
3.3. Experimental Vehicle

The assembled cells, alongside an intelligent BMS, are integrated in a test vehicle. The vehicle has an integrated mechatronic system for collecting the data during the charge/discharge process of the battery in a real environment. This system was thoroughly presented in [21]. Figure 1a,b shows how the cells are integrated in the back seat of the vehicle.
The mechatronic system has various types of data acquisition devices and sensors; for impedance measurements, the data acquisition device used was LabJack—U3 (LabJack Corp., Lakewood, CO, USA) with a programmable battery charger and indicator blocks. The system has a graphical user interface (GUI) for the automatic acquisition and analysis of key data while driving. This interface was developed in LabVIEW 2024 Q1 [21], and a block diagram is shown in Figure 2.

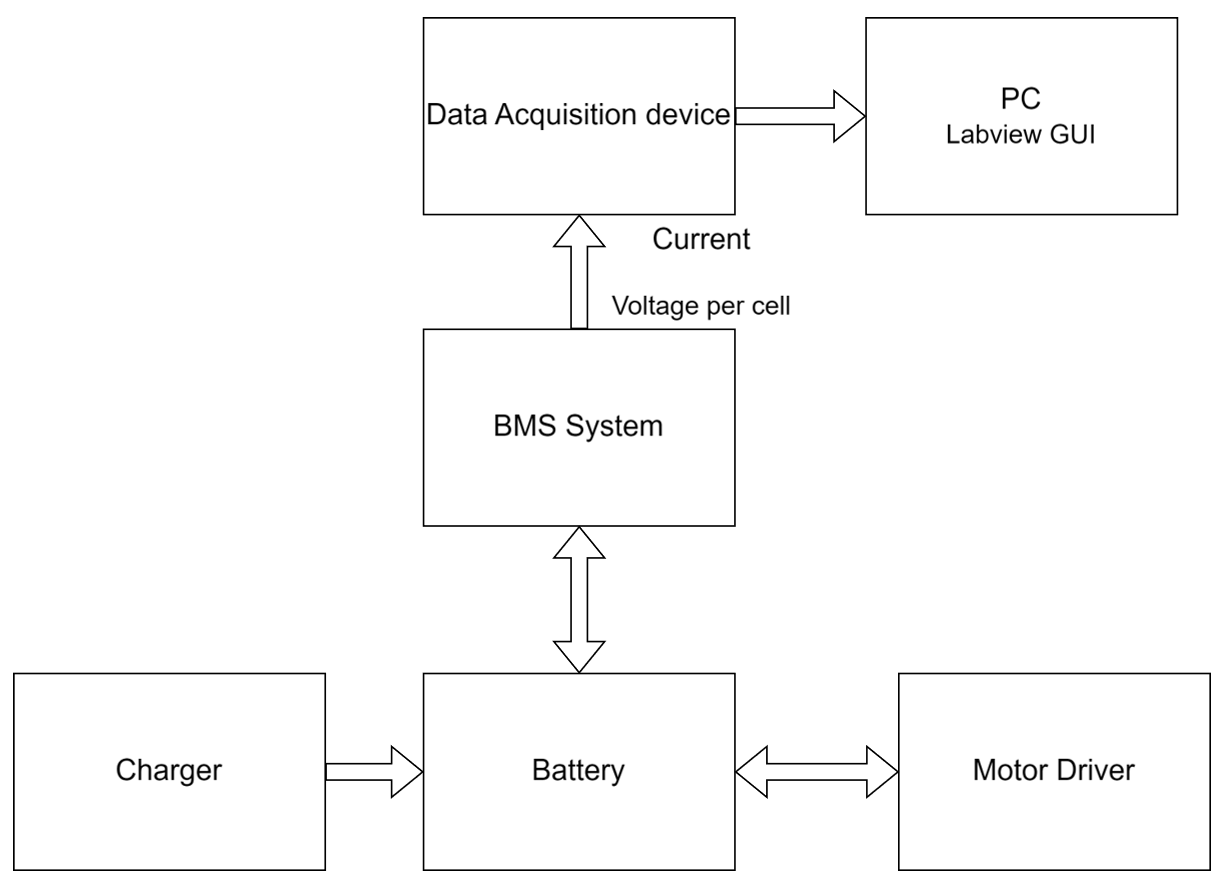
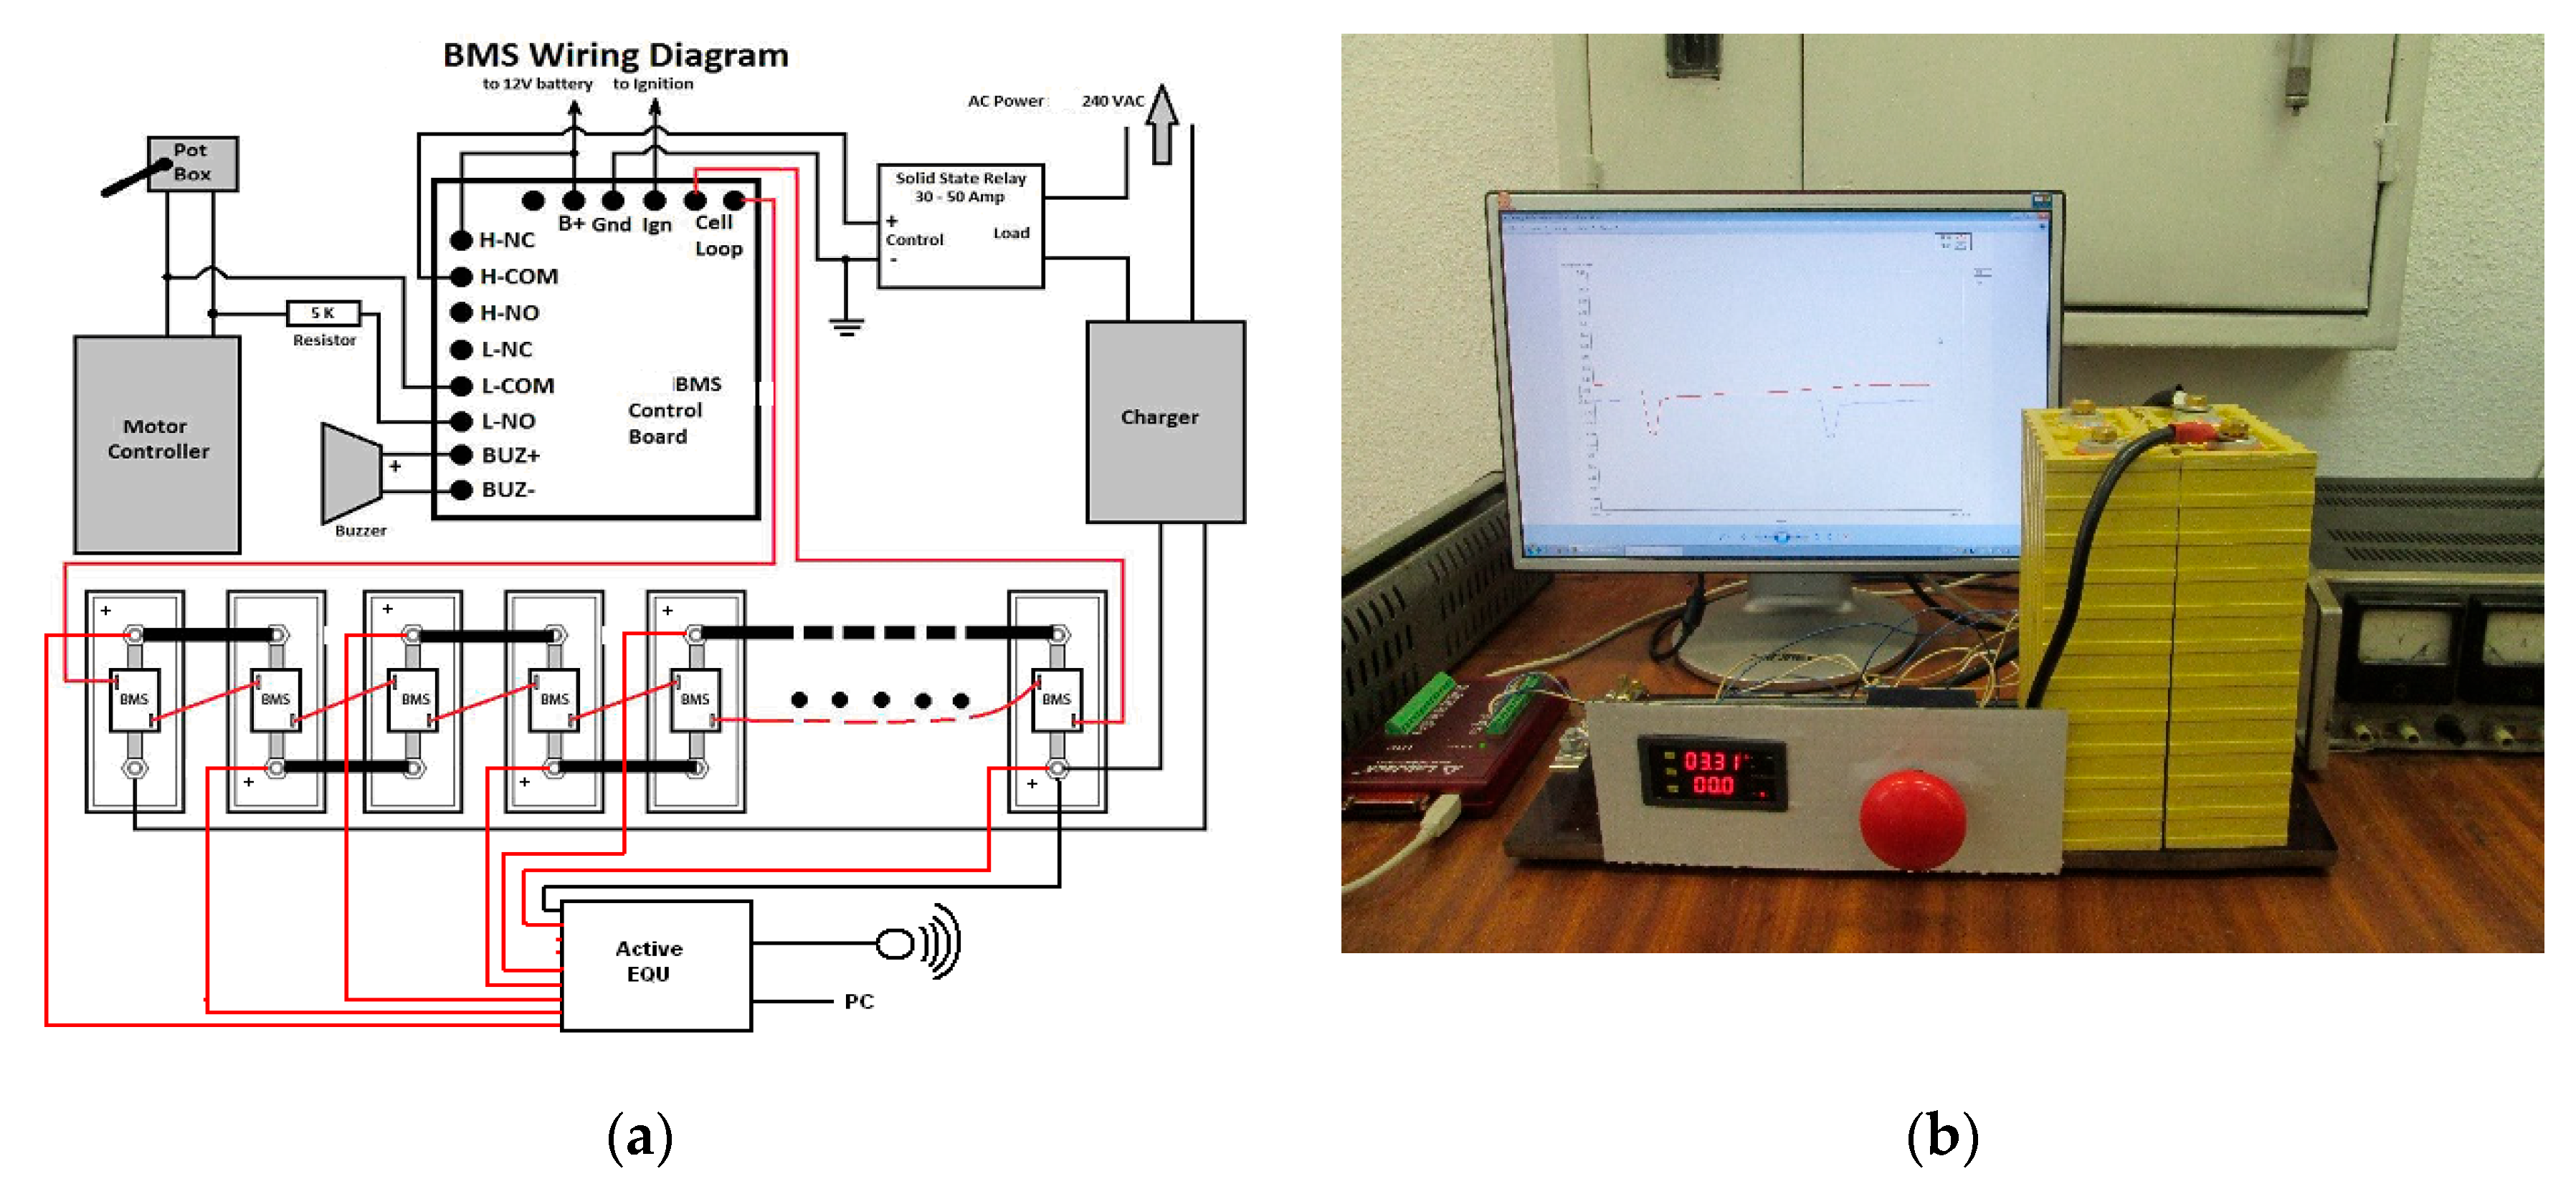
3.4. Intelligent Module System for Battery Control—BMS

There are three main objectives that are common for every type of BMS:
  • To protect the individual cells from damage due to over discharge or overcharge.
  • To prolong the life of the battery by optimally equilibrizing the charge in each cell of the battery.
  • To keep the battery in a state which allows for its optimal use.
The developed BMS measures the voltage and current of each cell during operation. The modules for each cell are decentralized and provide serial communication to a master device. When the battery is not in use, the BMS enters a low-power economy mode. When charging, the cell balancing function is performed automatically. The schematic diagram of the decentralized BMS is shown in Figure 3a. On each LFP-type cell (or on each NCA type module) of the battery packs, a local BMS module is installed, which consists of one electronic control unit (ECU) and one passive equalizer EQU, where the ECU controls the EQU and communicates with the central microcontroller of the BMS. Local BMS modules send signals to the BMS control panel on a central processor or computer. Active balancing of the cells is performed with an intelligent module with active EQUs, which is connected to the central processor, to a smartphone, or to a computer [31]. The algorithm of the modular BMS is designed with the main functions shown below.
  • Voltage measurement. Each ECU in the local BMS modules is shown in Figure 3a. Circuits are used for precise voltage measurement, and they are sent through an interface to the central microprocessor in the control panel.
  • Current and state of charge (SOC) measurement. A resistive shunt measures the current though the cells. A counter counts the charge accumulated/extracted for a certain time interval, which is known as CC (Coulomb counting) [27,32,33]. The SOC measured in this way is obtained by very accurately integrating the measured current in the circuit to avoid many of the errors. The algorithm used for determining the current to actively balance the battery packs uses Formula (1):
IB [A] = C [Ah]/t [h],
where IB—balancing current; C—battery capacity; t—time for gross balancing.
As with the voltage measurement from the local modules, the current measurement is pre-calibrated and periodically automatically corrected. The SOC is defined as the percentage of capacity available inside the battery [15,27]. The ratio of available capacity to maximum capacity can be expressed as the SOC, which is calculated using Formula (2):
S O C = 1 i d t C n
where i—the measured current depending on the gross balancing time t; Cn—the internal capacity of the battery.
An evaluation of the SOC is carried out according to the dynamic CC method (Coulomb counting— Δ Q ) [15,32,34]. For example, if the initial state is S O C 0 , using 1 A current to charge the battery for t hours, they will add I·t Ah of charge to the battery. Also, if the battery capacity is C, then the final SOC can be calculated using Formula (3):
S O C t = S O C 0 + I   ·   t C
The charge level is measured by integrating the current I over time t:
Δ S O C = Δ Q C = t 1 t 2 I d t C
Therefore, this method calculates the SOC based on the cell current and capacity over time t, i.e.,
SOC = f(I, t, C)
Battery capacity is calculated by integrating the current flowing to or from the battery over time (4). Although the Coulomb counting method is widely used, the error caused by the current or time deviation of the measurements is usually cumulative and can grow to be very large, unless there is a way to recalibrate the SOC regularly. This can be carried out, for example, by resetting the SOC to 100% when the battery is fully charged. As seen in the tests visualized in Figure 4b, in the charge/discharge cycle of the LFP, there is a capacity deviation of up to 1.2 Ah in the calculated value. At a higher discharge current, the difference is even greater. It is necessary to calculate the capacitance measurement error according to Formula (4). An inaccurate initial time base cannot estimate the difference between the charge/discharge capacity of the cell within a single test cycle because the discharge/charge capacity does not equalize. LabVIEW battery current measurement errors show a maximum error compensation of ΔI = 50 mA. The total time tdischarge to discharge is 4 h, but the total time tcharge to charge is 4.7 h due to the decreasing current towards the end of the charge. Pause times are subtracted from the above values because current is not measured during pauses. The total difference in the measured capacitance Ccalc, compensated by these errors, can now be calculated as follows:
Ccalc = 4 h × 50 mA + 4.7 h × 50 mA = 4.50 + 4.7 × 50 = 0.435Ah,
Therefore, systematic measurement errors alone cannot explain this difference of 0.43 Ah between charge and discharge. Other factors, for example, differences in test conditions such as the temperature, mechanical connections, etc., should be considered as causes of this random error. To remove these errors in the SOC determination algorithm for LFP-type cells, a correction factor (k = 2.8) is introduced to periodically correct the capacity measurement. We assume that Ccalc = ± Δ Ccalc k.
Figure 4. (a) Discharge curve of a large LFP cell and a small NCA cell, (b) Charge discharge with pause for large LFP and small NCA cell.
Batteries 10 00186 g004
Furthermore, in functional tests, voltages and currents depending on the SOC are continuously measured without pauses; periodically, the SOC is corrected with Ccalc; and the accuracy error for SOC determination is about 2%. Similar accuracy calculations are made with NCA-type cells where k = 1.5. For each BMS function described above, graphical algorithms that are necessary for the system software have been developed. The integrated current and voltage measurement signals are fed into the BMS control panel via a graphical user interface (GUI) for processing and analysis.
  • Cell balancing. The purpose of cell balancing is to increase the battery’s performance without overcharging or over-discharging it. Its essence is to make the SOC levels of the cells closer to each other. In the developed smart BMS, a combined passive and active cell balancing method is selected with a decentralized arrangement of the modular BMS, as shown in Figure 3a. The purpose of using passive equalizers is to achieve fast SOC equalization during charging by applying charge shunting to the fastest charging cells until their voltages are within ±0.01 V of the normal cells’ OCV voltage, V. Balancing with active EQUs works during battery charging and discharging as well as in standby mode, actively transferring a current of up to 1 A from the higher voltage cells to the lower voltage cells until the voltages equalize. Through the GUI, modules with local passive and active EQUs signal the problems to the central BMS module, where a decision will be made about when to start balancing with the EQU and accurately report the state of charge (SOC) [14,16,17,35].

4. Methods for Testing Battery Systems (LESMSs)

4.1. Preliminary Tests

Preliminary tests are conducted to obtain data on the electrochemistry behavior of the corresponding Li-ion cells during discharging and charging. The findings from these initial tests are then used to develop qualification tests for specific purposes in the battery pack, for example, to detect a “weak” cell, to accurately determine the SOC, to determine the current balance of cells in battery packs, etc.
Identification of weak cells. This is determined by measuring the internal resistance. Figure 3b shows a photo of the device, which is used to measure the resistance of prismatic LFP cells. For the test, a pulsed current of 1.5 C is applied for a time of 2 s. Using a 2 s time for the pulse is sufficient to allow the cell voltage to relax, but it has a negligible effect on the SOC. In this case, the pulse current for LFP cells is 150 A, and the current for NCA cells is 5 A, respectively. The current from the battery is measured by a Hall effect current sensor with the current output. The ratio between the secondary current and primary current is 1:5000. Putting a resistor with the Rc value across its output and measuring its voltage, Vcurrent, leads to Formula (7).
1 5000 = ( r a t i o ) = V c u r r e n t / R c I
  • The internal resistance of the LFP is calculated according to Formula (8) [4,36]:
R i n = V c e l l I , I = 150   A
where Rc—the resistance of a resistor to form a pulsed current; V c e l l —open-circuit cell voltage (OCV); V c u r r e n t —impulse current voltage across Rc; I—impulse current thoroughout the battery; Rin—the internal resistance of the battery. The ratio is the gain factor of the Hall sensor used for the current measurements.
Figure 5a,b shows the results of the measured voltage drop ΔVcell for two different LFP and NCA cells during the internal resistance test.
  • Discharge characteristics of NCA and LFP cells. One fully charged LFP and NCA.
Charged cells from LFP and NCA are subjected to a continuous discharge with a current of 0.25 C (LFP—with 25 A; NCA—with 0.85 A), where C is the battery capacity taken from the manufacturer’s data. This discharge allows for the identification of a usable voltage range, the SOC lookup table generation based on voltage, and the comparison to typical discharge curves given by the manufacturer. The results are shown in Figure 4a.
  • Full charge/discharge cycle with 0.25 C. Every charge cycle could be separated into 4 different phases: discharge, pauses, charging, and pauses. By applying the LabVIEW graphical program, we can control the phase change boundary condition.
In Figure 4b, cell voltage curves during a preliminary test cycle with a 25 A charge/discharge current with pauses of a large LFP cell and a 0.85 A charge/discharge current of a small NCA cell are shown depending on the SOC.
Determining the SOC of LFP-type stacks. As can be seen in Figure 4b, the voltage slope of LFP cells is very small. This fact complicates the software algorithm’s ability to accurately determine the SOC, unlike NCA type cells, where the curve is sufficiently steep, and the SOC is easily determined by measuring the voltage alone. Therefore, it is necessary to test the LFP to investigate the accuracy of determining the SOC rate measured by the capacity during the full discharge/charge cycle test according to Formula (4).

4.2. Qualification Tests

Qualification tests are designed to determine whether an LESMS consisting of a battery pack and BMS is fit for the application. They are conducted after the mandatory preliminary procedures and tests of the respective cells. The LESMS must be tested with a compatible charger so that we are confident that the batteries have not been inadvertently overcharged or damaged [21]. The technique of the qualification tests is close to the real operating conditions because the LESMSs are tested together for compatibility with the main components of EVs/HEVs—electric motors, a mechanical transmission, and running wheels [21]. The dynamic tests are carried out with the mechatronic system in real conditions (on a test site) and in busy city traffic (Figure 6a,b). The main qualification tests are the following:
  • Initial charging of the system. Only after the cells are balanced on the same voltage level and after checking the internal resistance and technical characteristics is it possible to assemble them together with the BMS into a functional LESMS.
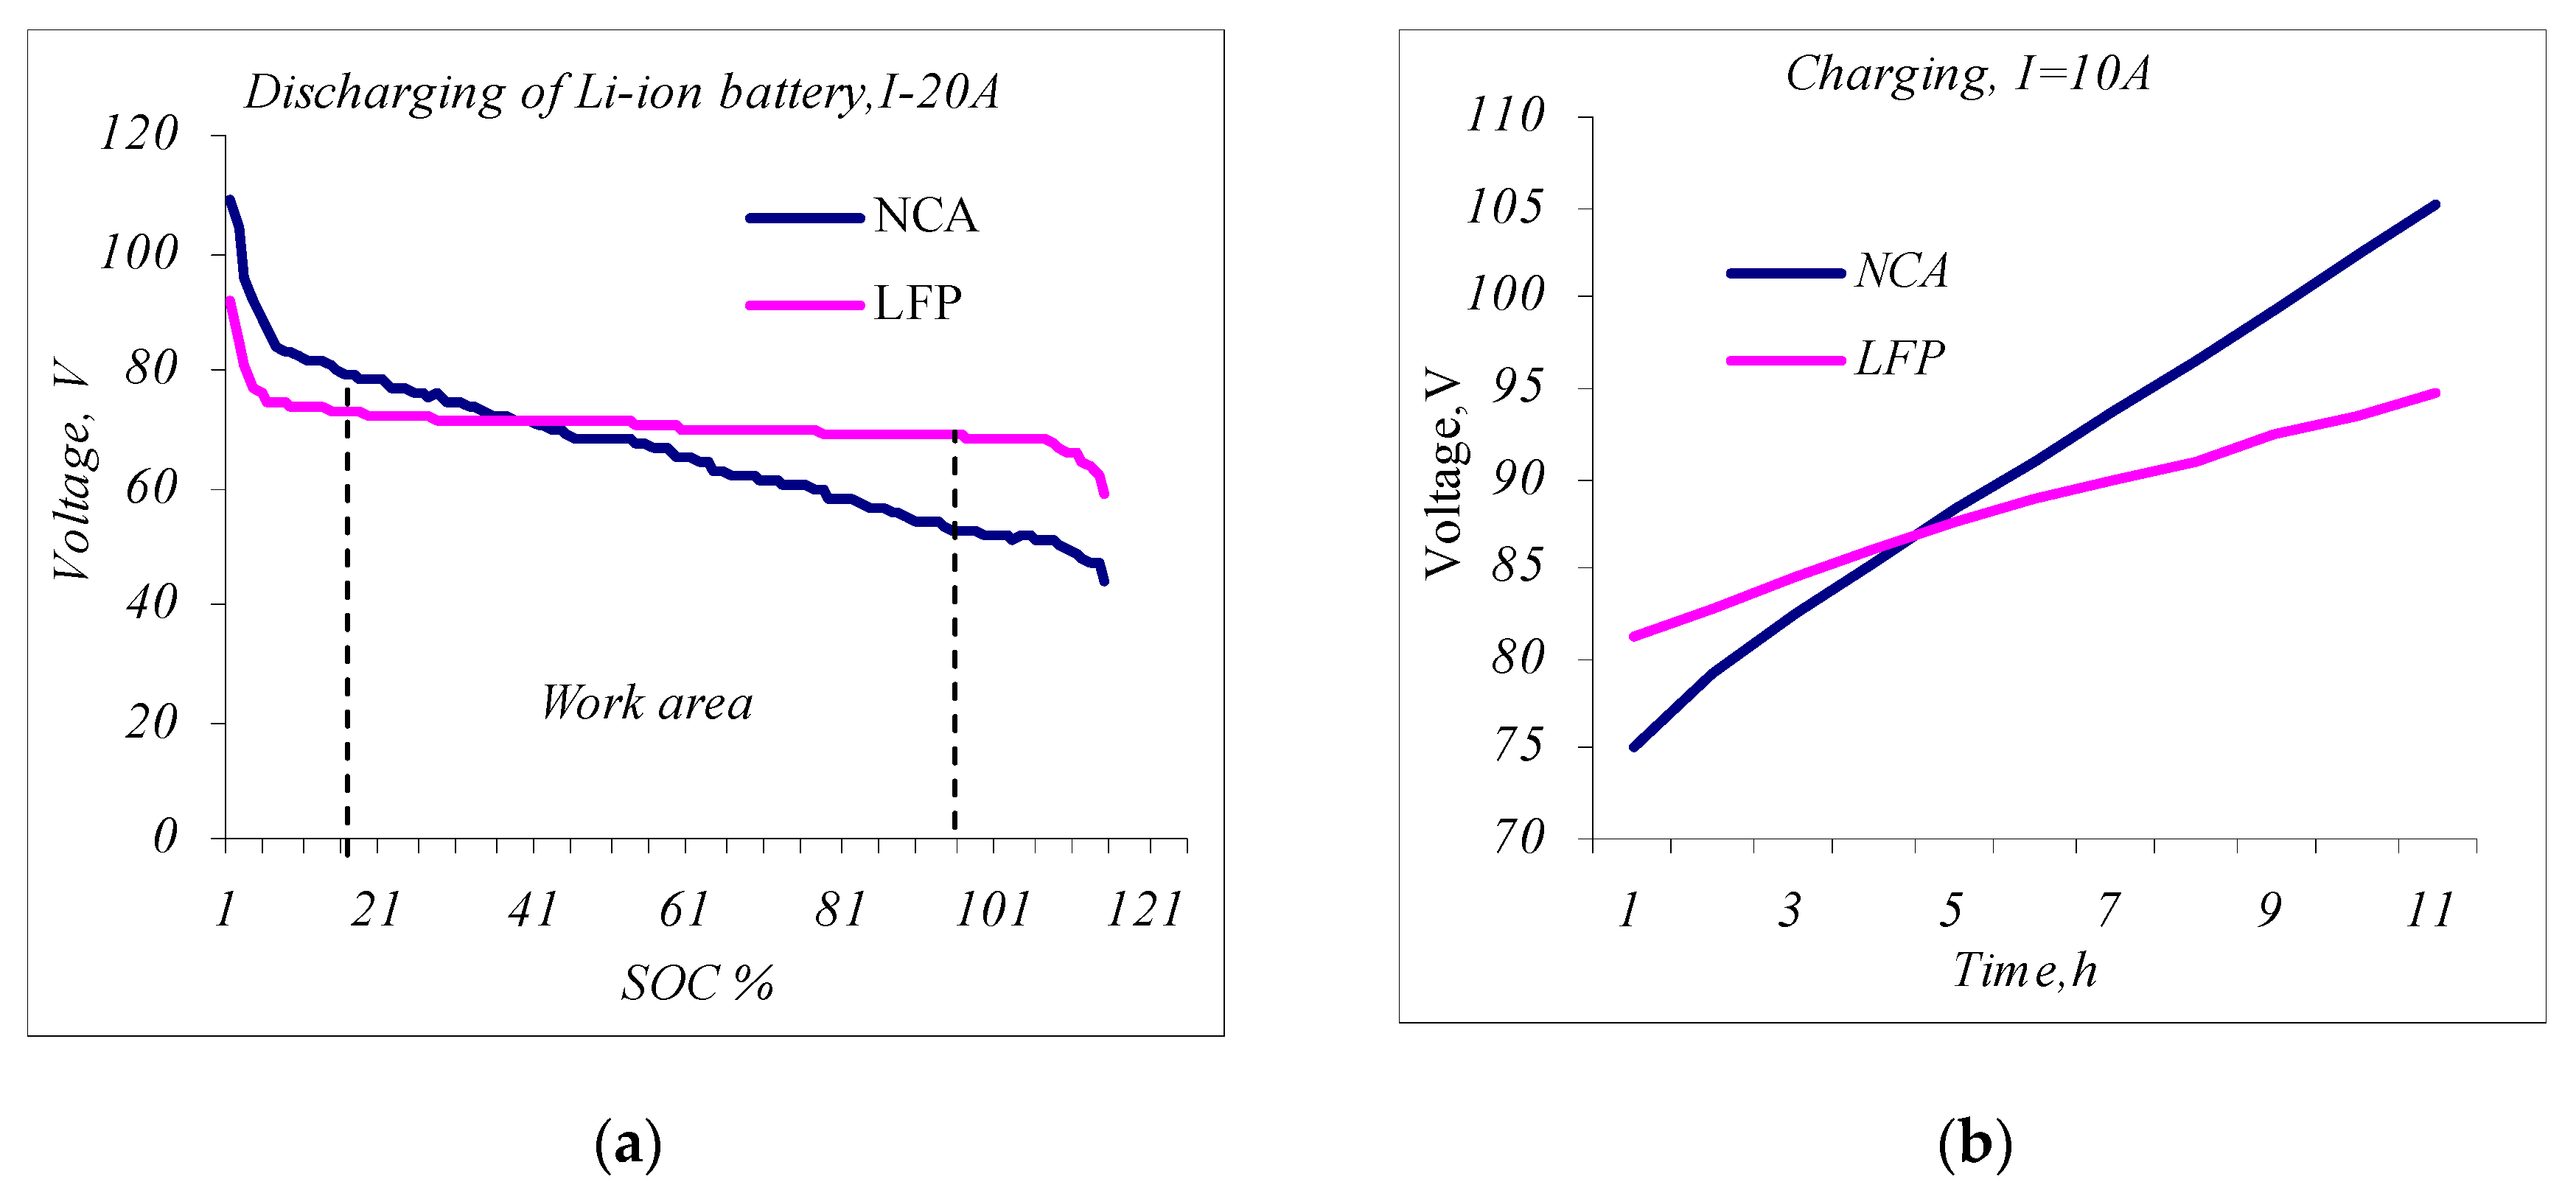
  • Constant current discharge. Fully charged LESMSs undergo a constant current discharge with current I~0.25 C depending on the SOC, where C is the capacity of the LESMS—in the case for both systems, the current is, on average, about 20 A. They are discharged to establish the characteristics of the discharge curves and the operating zones of the systems (Figure 7a).
  • Weak cell identification in LFP or weak module in NCA. With the BMS, the general EQU operations of LFP or NCA cells can be counted, and this information can be used to identify the weak cell (module). A weak cell always requires more EQU operations regardless of whether it is in the process of charging or discharging. The LESMS is only loaded to the levels of the weak cell LFP (or the weak module NCA, respectively) to prevent overcharging and degradation.
  • Testing under a constant load. A test is carried out to verify that the LESMS can deliver the specified power under a load when required. The load is usually representative of the expected conditions under which the system may be used (Figure 7b).
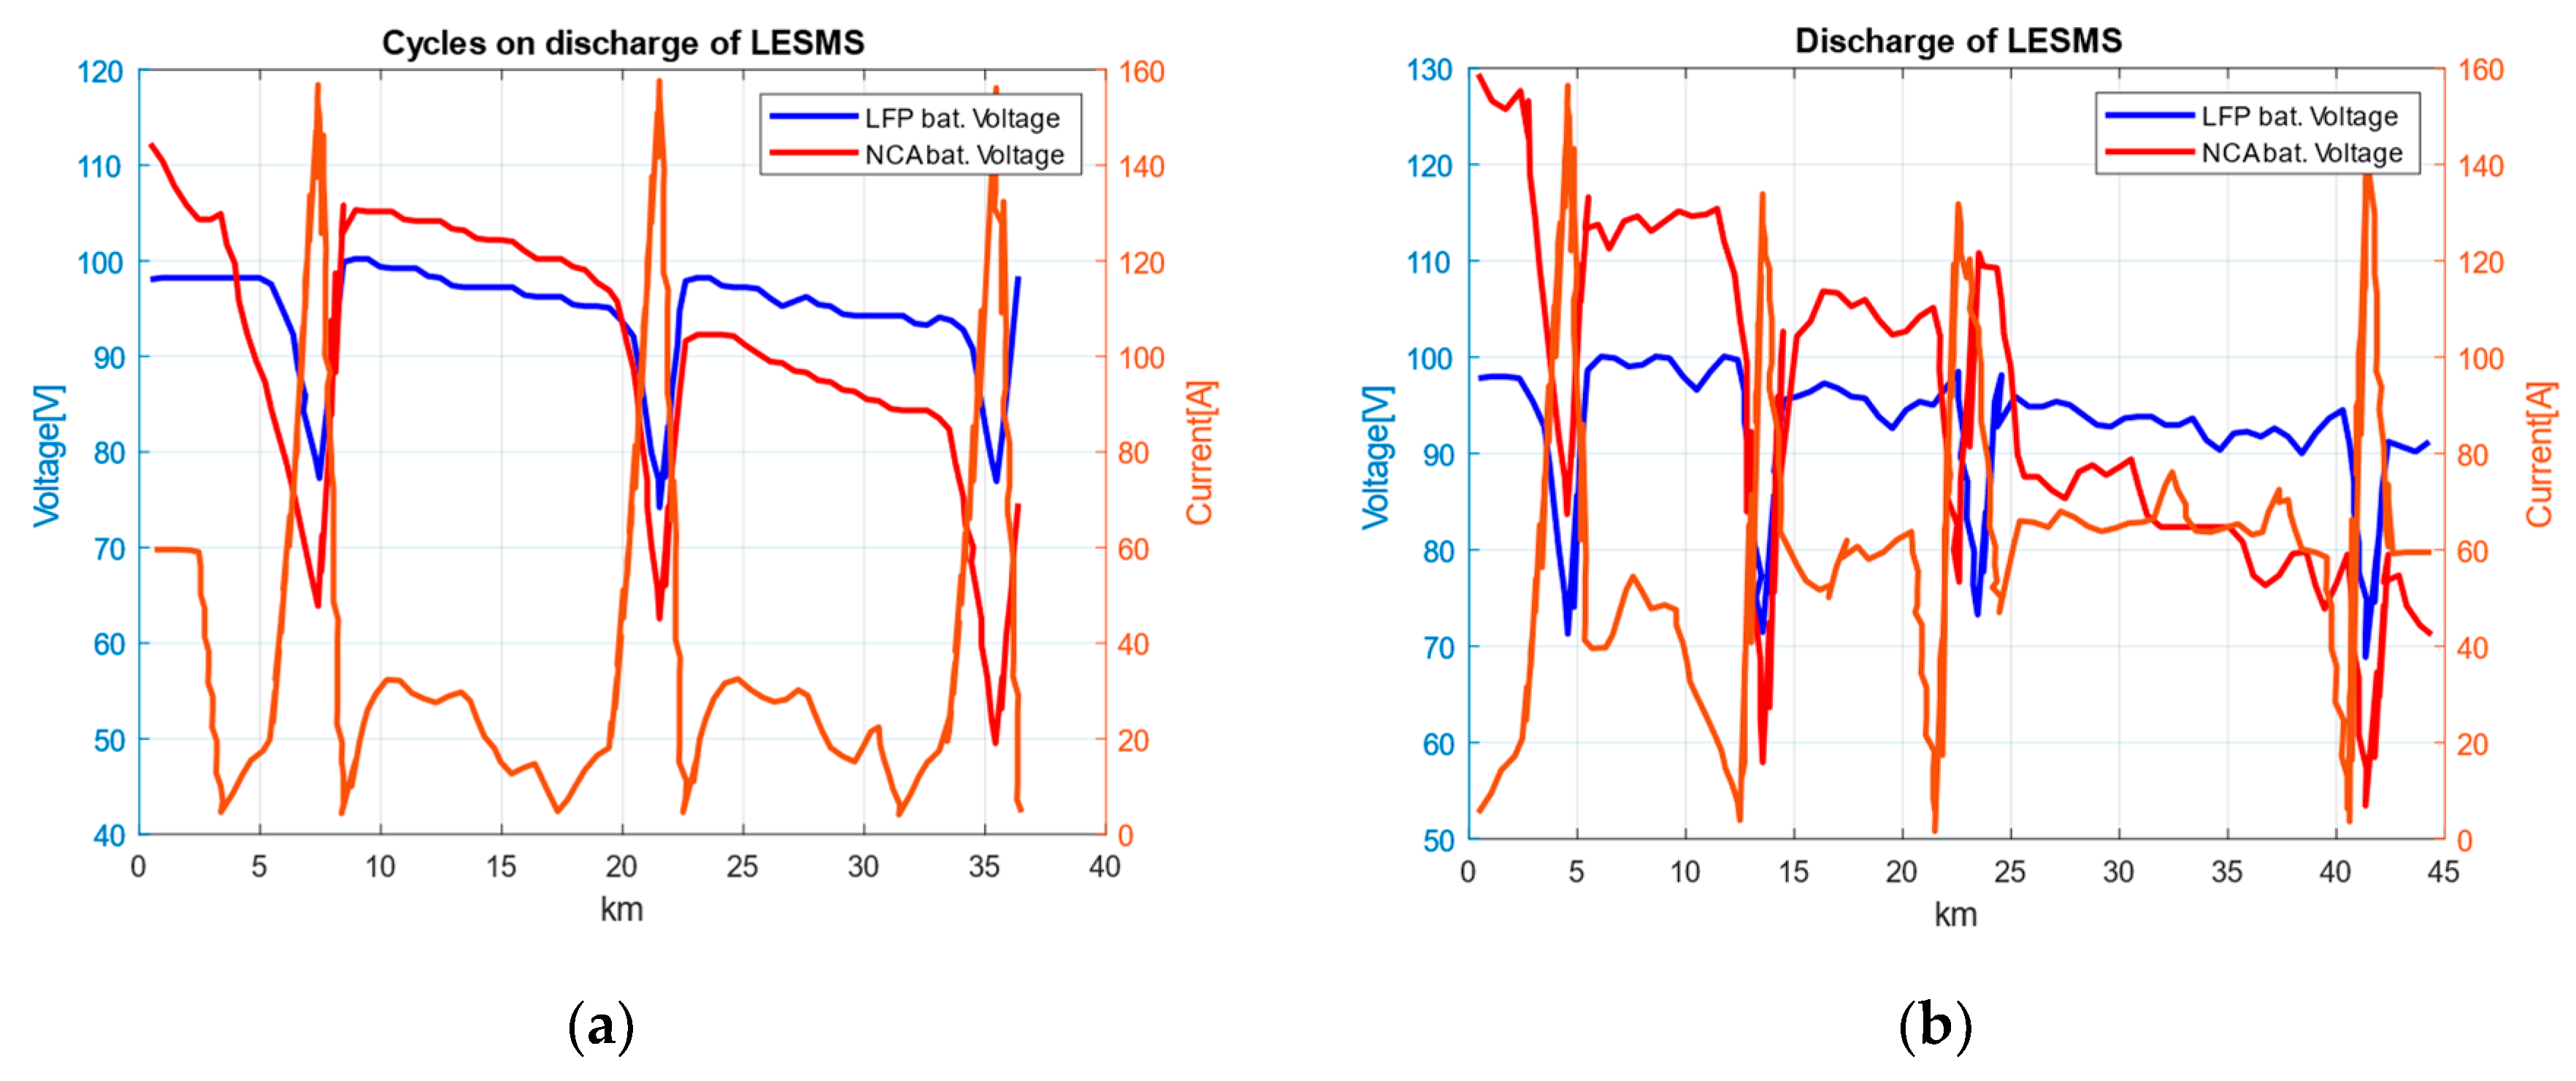
  • Testing under a dynamic load. The tests for cyclic and dynamically changing loads are performed with the test vehicle. For simplicity in testing, no recovery is applied. The operation of a “pure” electric car under different road conditions is simulated. For cyclic loading, the test car’s movement on a test site with simulated stopping and starting actions at a traffic light at a certain distance is carried out in order to establish the suitability of the components for application in joint operation (Figure 6a). Figure 6b presents a graph of the current and voltage under a dynamic load of LESMS at a 50 km mileage with a maximum speed of 60 km/h in real urban conditions typical of an urban EV/HEV.
Figure 6. (a) The current and voltage under cyclic discharge of the LESMS for LFP and NCA. (b) The current and voltage of the system when using LFP and NCA under a max speed of 60 km/h.
Batteries 10 00186 g006

5. Experimental Results and Discussion

5.1. The Advantages and Disadvantages of the System

Compared to standard BMSs, the new modular system provides dramatic reductions in cost, size, and weight, all of which are critical for budget and urban EV/HEV applications. Another advantage is that decentralized BMS modules allow the system to be applied to a large number of cells (over 32 cells connected in series) that are easily repaired or replaced, unlike complex BMSs of high-voltage systems for standard EVs. A disadvantage is the vulnerability of this BMS to moisture, dust, and short-circuiting, which is why the entire LESMS needs to be sealed to increase durability and safety. Recently, pressurized competitive intelligent BMSs [32] have appeared on the market, but unfortunately, they still cannot offer the management of series-connected cells above 24 cells (24 S is up to 72 V), which is insufficient for ESBMSs for urban EV/HEV applications, where the control of 32 cells connected in series (32 S to 96 V) is required.

5.2. Results and Discussion of Preliminary Testing

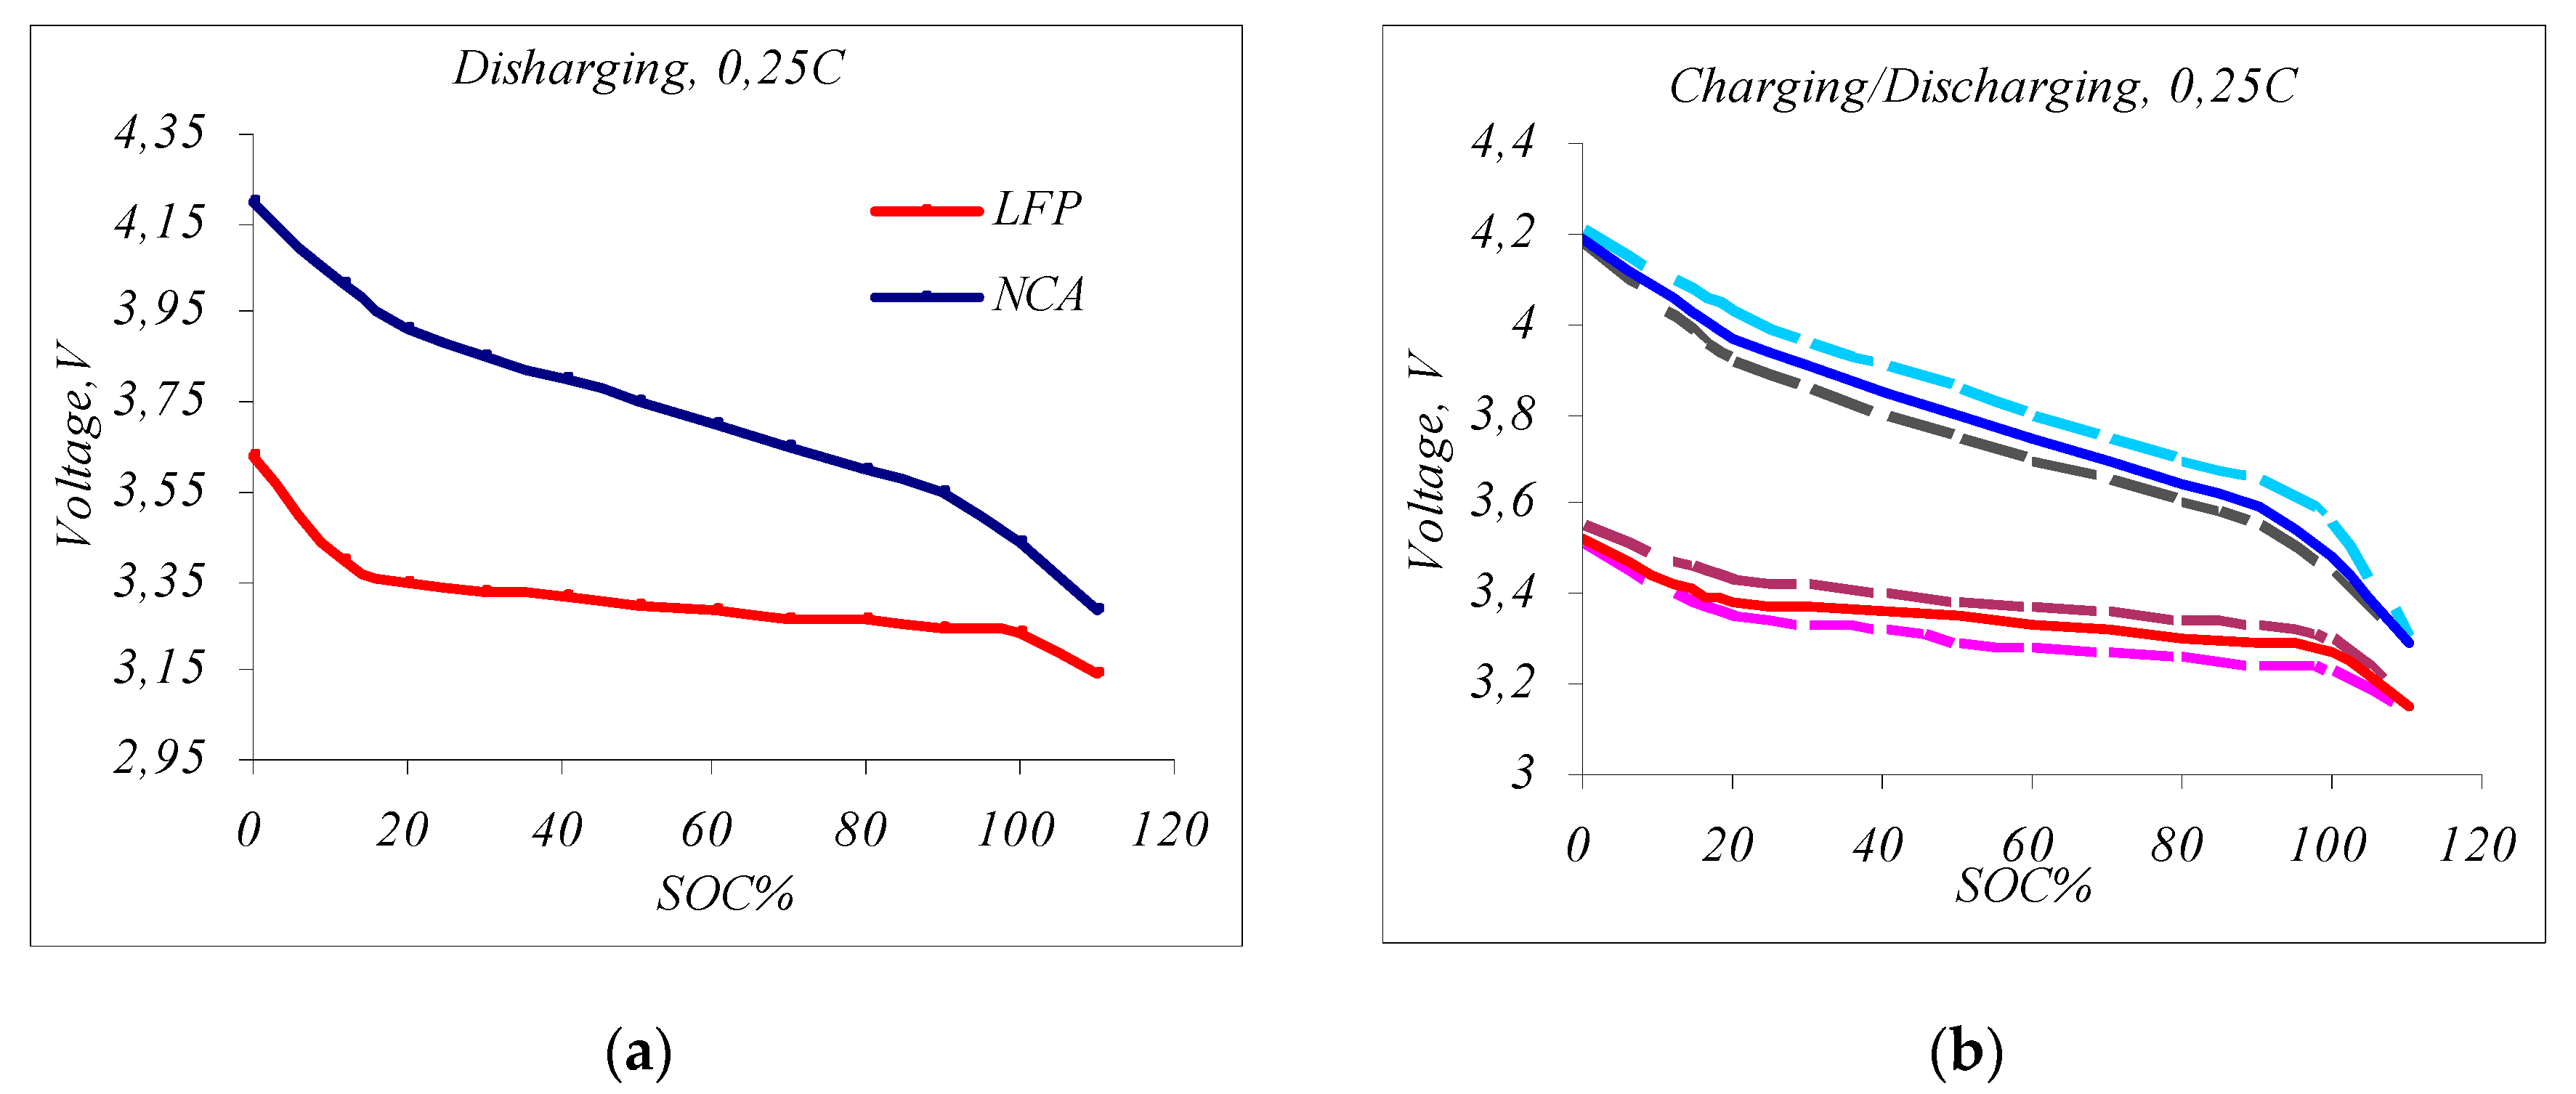
  • Weak cell identification. Figure 5a shows the voltage ΔVcell of two fully charged LFP cells, and Figure 5b shows the same ΔVcell of two fully charged NCA cells during the internal impedance measurement according to Formulas (7) and (8). In Figure 5a, the slower OCV relaxation is seen in one of the LFP-type cells; therefore, it has a higher internal resistance. This cell was identified as being weaker than the normal LFP cell. In the two tested cells of the NCA type, the ΔVcell pulses and the voltage, V, at OCV are the same; therefore, both cells have a normal capacity (Figure 5b).
  • Discharge and full charge/discharge cycle of LFP and NCA cells. Figure 5a shows the graphs of the discharge voltage versus the SOC. The discharge graph of the small cylindrical NCA cell type is marked with a blue line, and the discharge graph of a large prismatic LFP cell type is constructed with a red line. The voltage difference of the NCA cell at the end and the beginning of the working area is 0.65 V, and the voltage difference of the LFP cell is 0.25 V. Therefore, the electrochemical characteristics of the two cells differ. For example, estimating the state of charge in NCA-type cells becomes much easier by measuring only the voltage at the OCV, while in LFP-type cells, due to the small slope of the discharge curve, estimating the SOC by only measuring the voltage is not a precise enough method. Therefore, in the SOC determination algorithms, for LFP-type cells, it is also necessary to measure the amount of electricity Q (CC) or apply the Kalman filter [15,27,33,35]. In Figure 4b, LFP-type and NCA-type cell voltages are shown as a function of the SOC during the charge/discharge process with 0.25 C current pauses. This allows for a direct comparison of the voltage levels between charge and discharge at the same states of charge. The charging and discharging times are stopped for a short time after every 10% change in capacity to measure and analyze the stress relaxation at the OCV. The upper dashed curves of the cycles represent charging (light blue for the NCA cell and brown for the LFP cell), and the lower dashed curves (black for NCA and light red for LFP, respectively) represent their discharge with 1 min cut-off pauses when the OCV is read. Cell voltage measurements during the test cycle show that the cells do not reach equilibrium at the end of the pauses if the response step has a pause of 1 min, which is very small. Therefore, the equilibrium voltage at the OCV cannot be directly measured at this pause. For full relaxation to the OCV level (equilibrium voltage), longer pauses are required, especially at higher charge/discharge currents and at large LFP cell formats (of the order of 10–15 min). This makes the test difficult and pointless because it extends the time taken to conduct the test cycle to several days. It is necessary to speed up the execution time of the cycle. For this purpose, the continuous averages represent an interpolation between the voltage levels at the end of the 1 min breaks. The blue and red solid curves in the center of the cycles are the averages of this region. Initially, the true equilibrium is assumed to be the OCV. We assume that this approach of estimating the OCV by calculating the average value of the voltage is accurate enough for the charge/discharge cycle with a current in the 0.25–1 C range, where the current most often varies in small city EV/HEV applications; therefore, the continuous curves represent the actual discharge/charge characteristics of the respective Li-ion battery types, and no breaks are required during the test.

5.3. Results and Discussion on Qualification Testing

  • The constant current discharge of the LESMS. Fully charged LESMS stacks are discharged with a constant current of I~0.25 C—this equals 20 A, on average, for both cells. In Figure 7a, the discharge curves of the two LESMSs are shown as a function of the SOC. The blue line is the discharge curve of the NCA-type LESMS, and the red line is the discharge curve of the LFP-type system. The visualization of Figure 7a makes it possible to determine the OCV voltage operating zones of the two systems required for the following functional tests. The operating range of the SOC should be between 15% and 90% for NCA and between 10 and 100% for LFP.
  • Constant load tests. For this test, the LESMS is loaded with a constant load to verify its use for the application. The LESMSs are charged and then discharged with a constant current of 10 A ranging from 15% to 90% SOC. In Figure 7b, the charging diagram of the two LESMSs is given in the operating range of 15% to 90% SOC for a time of 10 h, as determined by the control system. The visualization shows the higher energy efficiency and steeper curve of the LESMS based on NCA cells (the blue line). Therefore, the NCA system was found to have a higher specific energy of up to 260 Wh/kg, and the LFP-type system was found to have a specific energy of 90 Wh/kg [23,36].
  • Cyclic load testing. Figure 6a shows the results of a few cycles with the dynamic discharge of the system composed of LFP and NCA cells. A diagram of the changes in the current and voltage of the two systems under cyclic loads for a certain distance traveled (on a test site) is presented. In Figure 6b, the variations in the current and voltage of the LFP- and NCA-type LESMSs under a load in real urban conditions at a distance of 50 km with a maximum speed of 60 km/h are presented. The currents and voltages are recorded directly from the motor controller via a graphical user interface (GUI) and the LabVIEW graphical program.
As seen in the functional dynamic testing results presented in Figure 6a,b showing the current and voltage variations at a test site and under real urban conditions with an LFP-type LESMS and NCA-type system, it was found that the general thermal and electrical condition of batteries, BMSs, electric motors, and controllers are normal and compatible in different test cycles and there is no difference between them.

5.4. Comparative Analysis

  • A comparison of the characteristics of the two types of LESMSs (volume, geometric dimensions, costs, and prices of components and systems). At approximately the same power (~8 kWh), the geometric dimensions of the LFP-type LESMS are approximately twice the size and weight of those of the NCA-type LESMS; therefore, it has twice the energy density and energy efficiency. The assembly costs and the cost of the components (except for the cost of the Li-ion cells) and BMS are about the same for both LESMSs. Recently, in view of the high current price increase for cobalt, nickel, and manganese LFP-type cells, regardless of their lower energy efficiency and complex SOC determination algorithm, they are also starting to be implemented in EV/NEV applications [18,37]. Due to reasons of a modern geopolitical nature, the metals used to manufacture NMC and NCA cells—nickel, cobalt, manganese, and aluminum—have risen sharply in price, and from there, the prices of high-voltage battery systems based on nickel and cobalt have risen sharply [23]. Therefore, for example, “Tesla has announced that it is switching to LFP batteries for its standard range models such as Model 3 and Model Y” [18,37]. The main arguments for the implementation of LFP batteries are the availability of cheap cathode material and the competitive price [23]. Phosphate is much easier to obtain and, for now, reliably cheaper. This means that iron phosphate LESMSs can be much cheaper than cobalt-type NMS and NCA systems and, in addition to solar PV systems, they can successfully displace them in low-cost and urban EV/HEV applications [18,20].
  • A comparison based on the preliminary test. It was found that there are significant differences in the electrochemical characteristics of the tested cells, for example, the operating area of the discharge/charge characteristic curve of the NCA-type cells has a greater slope than the almost flat characteristic curve in the operating area of the LFP-type cell (Figure 4a). This means that the SOC estimation of the NCA-type cell is more accurate than that of the LFP-type cell. Correctly calculating the remaining battery capacity is significantly more difficult with LFP cells due to their flatter discharge/charge voltage characteristic. For this reason, it is recommended that LFP-type cells are periodically charged to a 100% SOC so that the BMS can accurately calculate the battery capacity by measuring the amount of electricity, Q, through the remaining capacity, CC, rather than relying solely on the voltage measurement. For NCA-type cells, the voltage measurement is sufficient to estimate the SOC and the remaining capacity. From tests to determine the internal resistance of the cells, it was found that at a 100% SOC, the normal internal resistance of the tested LFP cells was 0.39Ω, and that of the small NCA cells was 0.035Ω. NCA cells have been found to last for 500 to 1000 full charge/discharge cycles, while LFP cells last for 2000 to 6000 full cycles without degrading [24,29]. A disadvantage of LFP cells is their low energy efficiency compared to NCA cells and the difficulty in determining their state of charge (SOC). These problems can be solved during the development and implementation of intelligent control systems with a more complex algorithm, including, in addition to the voltage measurement, the integration of the amount of electricity (Q) through the CC or through an algorithm based on the Kalman filter (KF) [15]. Cells with a higher OCV voltage that reached full charge faster were also found to have higher internal resistance or not be well balanced.
  • A comparison based on real exploration tests. The voltage of a no-load current (OCV) of an LESMS is not a reliable measure of its ability to deliver a current. As the battery ages or degrades due to improper use, its internal resistance increases. This reduces the ability to accept and hold a charge, but the OCV idle voltage will still show as normal despite the reduced battery capacity. Comparing the actual internal resistance to the internal resistance of a new battery will show any deterioration in battery functionality; therefore, the internal resistance should be measured and compared periodically.
The correct calculation of an LESMS’s residual capacity is significantly more difficult with an LFP cell type due to its flatter discharge voltage–remaining charge curve. For this reason, it is recommended that they are regularly charged to a 100% SOC so that the BMS can calculate the remaining capacity by measuring the amount of electricity through the CC rather than relying solely on the voltage measurement.
The SOC determination accuracy with the developed intelligent BMS in both LESMSs is 2.5%, which is very good for EVs and good for HEVs, where an additional error is introduced by the recuperation when the electric motor works as a generator and charges the battery when driving at work with the internal combustion engine (ICE). This accuracy is achieved by frequently updating the SOC value by the BMS, especially in LFP, to avoid the accumulated error from dynamic operation in real conditions.
Fast charging may reduce the maximum capacity, but this mainly depends on the BMS algorithm and the type of LESMS cells. In the systems tested, especially in the case of the LESMS with LFP-type cells, fast charging to an 80% SOC in 30 min is not possible because forced cooling is required due to the large heat release. The reason for this is that the electrodes of LFP-type prismatic cells are embedded in a heat-insulating plastic housing, which is difficult to cool. With the LESMS with NCA-type cylindrical cells, fast charging is possible because one electrode (anode) is the metal body itself, which can easily be cooled when assembled with a suitable cooling system.
  • Suggestions for integration. Recently, low-voltage LESMSs with LFP-type cells, in addition to a solar PV, can also be successfully implemented in low-budget urban vehicles—such as rickshaws, micro EVs, or HEVs—in the conversion of vintage cars weighing up to 750 kg (Citroen 2CV, Renault 4, Suzuki Alto, Trabant 601, etc.). The LESMS with an NCA type cell is recommended for mini urban EVs, and if there is a need for fast charging from charging stations, it can be assembled with a cooling system.

6. Conclusions

The functional testing of the two LESMSs confirmed their suitability for operation in real-world conditions, where they showed equally good operational performance.
LESMSs with cells alloyed with nickel, cobalt, manganese, and aluminum (NCA and NMC types) are at the limits of their refinement and development. The goals of developing LESMSs to acquire more power and achieve a lower price (the goal is to achieve a price lower than USD 100 per kWh) will not be achieved soon. With the envisioned larger market share of electric cars and solar PV systems, the development of NCA and NMC cells will be blocked by environmental requirements for disposal due to the health hazards of the materials used for their manufacture and the geopolitical reasons for the large increase in the prices of raw materials—namely nickel, manganese, cobalt, and aluminum.
LESMSs with batteries based on iron and other phosphates (LFP type) have a great capacity for improvement due to their environmental friendliness because they are not made with poisonous materials that are dangerous to human health. The raw materials used for their manufacture are widely available, and due to their mass production for solar PV systems, their prices will continue to fall [37]. Efforts to improve systems with LFP cells should be primarily focused on increasing their energy density and energy efficiency through the development of innovative technologies and new designs.
The future of battery technology for electric and hybrid vehicles is aimed at achieving higher energy density, accelerated charging, extended life, and improved safety and sustainability. This is achieved by using new materials for their production; developing ultra-fast charging technologies that can charge batteries up to 80% in 10–15 min; using nanomaterials to improve structural stability and extend battery life; using smart BMSs with the implementation of machine learning and artificial intelligence algorithms for charge and discharge optimization, condition monitoring, and problem prevention; using decentralized BMSs containing control systems that can function autonomously for each individual battery module; carrying out efficient recycling with the application of new methods for the extraction and reuse of valuable metals, such as lithium, cobalt, and nickel, and using environmentally friendly and sustainable materials in the production of batteries; and integration with energy storage systems, including using spent batteries from EVs and HEVs for stationary energy storage systems.
With these improvements, electric and hybrid cars will become increasingly efficient, affordable, and environmentally friendly, contributing to the faster adoption of these technologies and reducing the dependence on fossil fuels.

Author Contributions

B.V., B.D., V.D. and N.H. were involved in the full process of producing this paper, including conceptualization, methodology, modeling, validation, visualization, and preparing the manuscript. All authors have read and agreed to the published version of the manuscript.

Funding

This study was financed by the European Union—NextGenerationEU, through the National Recovery and Resilience Plan of the Republic of Bulgaria, project № BG-RRP-2.004-0005.

Data Availability Statement

Data are contained within the article.

Acknowledgments

This research was supported by the European Union—NextGenerationEU through the National Recovery and Resilience Plan of the Republic of Bulgaria, project № BG-RRP-2.004-0005.

Conflicts of Interest

The authors declare no conflicts of interest.

Abbreviations

The following abbreviations are used in this manuscript:
BMSBattery management system
CCapacity of cells
CC methodCoulomb counting method
ECUElectronic control unit
EV/HEVElectric vehicle/hybrid electric vehicle
GUIGraphical user interface
LFPLithium–iron–phosphate
LESMSLithium-ion energy storage and management system
NCALithium–cobalt–nickel–aluminum oxide
NMCNickel–manganese–cobalt
NCANickel–cobalt–aluminum
OCVOpen-circuit voltage
SOCState of charge
SOHState of health

References

  1. Saldaña, G.; Martín, J.I.S.; Zamora, I.; Asensio, F.J.; Oñederra, O. Analysis of the Current Electric Battery Models for Electric Vehicle Simulation. Energies 2019, 12, 2750. [Google Scholar] [CrossRef]
  2. Ribeiro, P.J.G.; Dias, G.; Mendes, J.F.G. Public Transport Decarbonization: An Exploratory Approach to Bus Electrification. World Electr. Veh. J. 2024, 15, 81. [Google Scholar] [CrossRef]
  3. Poggio, A.E.; Balest, J.; Zubaryeva, A.; Sparber, W. Monitored Data and Social Perceptions Analysis of Battery Electric and Hydrogen Fuelled Buses in Urban and Suburban Areas. J. Energy Storage 2023, 72, 108411. [Google Scholar] [CrossRef]
  4. Velev, B. Comparative analysis of lithium-ion batteries for EV/HEV applications. Ind. 4.0 2018, 3, 73–76. [Google Scholar]
  5. Blomgren, G.E. The Development and Future of Lithium Ion Batteries. J. Electrochem. Soc. 2016, 164, A5019–A5025. [Google Scholar] [CrossRef]
  6. Rangarajan, S.S.; Sunddararaj, S.P.; Sudhakar, A.; Shiva, C.K.; Subramaniam, U.; Collins, E.R.; Senjyu, T. Lithium-Ion Batteries—The Crux of Electric Vehicles with Opportunities and Challenges. Clean Technol. 2022, 4, 908–930. [Google Scholar] [CrossRef]
  7. Lu, L.; Han, X.; Li, J.; Hua, J.; Ouyang, M. A review on the key issues for lithium-ion battery management in electric vehicles. J. Power Sources 2013, 226, 272–288. [Google Scholar] [CrossRef]
  8. Elmahallawy, M.; Elfouly, T.; Alouani, A.; Massoud, A.M. A Comprehensive Review of Lithium-Ion Batteries Modeling, and State of Health and Remaining Useful Lifetime Prediction. IEEE Access 2022, 10, 119040–119070. [Google Scholar] [CrossRef]
  9. Yang, X.; Adair, K.R.; Gao, X.; Sun, X. Recent advances and perspectives on thin electrolytes for high-energy-density solid-state lithium batteries. Energy Environ. Sci. 2020, 14, 643–671. [Google Scholar] [CrossRef]
  10. Aichberger, C.; Jungmeier, G. Environmental Life Cycle Impacts of Automotive Batteries Based on a Literature Review. Energies 2020, 13, 6345. [Google Scholar] [CrossRef]
  11. Preger, Y.; Barkholtz, H.M.; Fresquez, A.; Campbell, D.L.; Juba, B.W.; Romàn-Kustas, J.; Ferreira, S.R.; Chalamala, B.R. Degradation of Commercial Lithium-Ion Cells as a Function of Chemistry and Cycling Conditions. J. Electrochem. Soc. 2020, 167, 120532. [Google Scholar] [CrossRef]
  12. Tran, M.-K.; DaCosta, A.; Mevawalla, A.; Panchal, S.; Fowler, M. Comparative Study of Equivalent Circuit Models Performance in Four Common Lithium-Ion Batteries: LFP, NMC, LMO, NCA. Batteries 2021, 7, 51. [Google Scholar] [CrossRef]
  13. Reddy, M.V.; Mauger, A.; Julien, C.M.; Paolella, A.; Zaghib, K. Brief History of Early Lithium-Battery Development. Materials 2020, 13, 1884. [Google Scholar] [CrossRef] [PubMed]
  14. Fu, S.; Liu, W.; Luo, W.; Zhang, Z.; Zhang, M.; Wu, L.; Luo, C.; Lv, T.; Xie, J. State of charge estimation of lithium-ion phosphate battery based on weighted multi-innovation cubature Kalman filter. J. Energy Storage 2022, 50, 104175. [Google Scholar] [CrossRef]
  15. Plett, G. Extended kalman filtering for battery management systems of LiPB-based HEV battery packs part 2 State and parameter estimation. J. Power Sources 2004, 134, 277–292. [Google Scholar] [CrossRef]
  16. Zhang, Y.; Liu, Z.; Chen, Z. Smart-Leader-Based Distributed Charging Control of Battery Energy Storage Systems Considering SoC Balance. Batteries 2023, 9, 18. [Google Scholar] [CrossRef]
  17. Hassan, M.; Jawad, M.; Saleem, N.; Raza, A.; Zaidi, K.; Rafiq, N. Solar Power Assisted Passive and Active Cell Balancing System: A Comprehensive Analysis. In Proceedings of the 2021 International Conference on Frontiers of Information Technology, FIT, Islamabad, Pakistan, 13–14 December 2021; pp. 224–229. [Google Scholar] [CrossRef]
  18. LFP Battery in Your Next EV? Tesla, Ford Rivian Say Yes. (n.d.). Available online: https://www.recurrentauto.com/research/lfp-battery-in-your-next-ev-tesla-and-others-say-yes (accessed on 13 April 2024).
  19. Premchand, M.; Gudey, S.K. Electric vehicle operation modes with reactive power support using SMC in distribution generation. J. Energy Syst. 2020, 4, 96–120. [Google Scholar] [CrossRef]
  20. Sepúlveda, F.J.; Montero, I.; Barrena, F.; Miranda, M.T.; Arranz, J.I. Design and Energy Analysis of Photovoltaic-Battery Prototype Considering Different Voltage Levels. Batteries 2023, 9, 16. [Google Scholar] [CrossRef]
  21. Velev, B.G.; Ivanov, I.S.; Kamenov, V.V. Experimental Study and Thermal Analysis of Cooling Systems for Brushless Motors with Double Stator and Axial Gap. SJEE 2021, 18, 333–349. [Google Scholar] [CrossRef]
  22. Geisbauer, C.; Woehrl, K.; Mittmann, C.; Schweiger, H.-G. Review-Review of Safety Aspects of Calendar Aged Lithium Ion Batteries. J. Electrochem. Soc. 2020, 167, 090523. [Google Scholar] [CrossRef]
  23. Whitlock, R. Lithium-Ion Battery Pack Prices Increase due to Rising Costs of Materials and Components. Available online: https://www.renewableenergymagazine.com/storage/lithiumion-battery-pack-prices-increase-due-to-20221206 (accessed on 6 December 2022).
  24. Samsung INR18650-30Q 3000 mAh 20 A. (n.d.). Available online: https://www.dcpower.eu/accu-rechargeable/lithium-ion-batteries/accu-industrial/samsung-sdi/samsung-inr18650-30q (accessed on 13 April 2024).
  25. Available online: http://www.batteryexpert.org/produkt/samsung-inr18650-35e-3500mah-8a/ (accessed on 10 March 2024).
  26. Nickel Fuse 2P-6P Wide Continuous Roll by the Foot! 18650 Cell Level F—Battery Hookup. (n.d.). Available online: https://batteryhookup.com/products/nickel-fuse-2p-wide-continuous-roll-by-the-foot-18650-cell-level-fusing (accessed on 13 April 2024).
  27. Xing, Y.; Ma, E.W.M.; Tsui, K.L.; Pecht, M. Battery Management Systems in Electric and Hybrid Vehicles. Energies 2011, 4, 1840–1857. [Google Scholar] [CrossRef]
  28. Wang, M.; Le, A.V.; Noelle, D.J.; Shi, Y.; Yoon, H.; Zhang, M.; Meng, Y.S.; Qiao, Y. Effects of electrode pattern on thermal runaway of lithium-ion battery. Int. J. Damage Mech. 2018, 27, 74–81. [Google Scholar] [CrossRef]
  29. Winston WB-LYP100AHA—3.3 V/100 Ah Tall LiFeYPO4 Lithium—LiFeYPO4. (n.d.). Available online: https://masori.de/en/products/wb-lyp100aha-3-3v-100ah-tall-lifeypo4 (accessed on 13 April 2024).
  30. Hibms Smart Bms Active Balancer|Smart Bms 4s Lifepo4 Bluetooth—Smart Bms Balancer—Aliexpress. (n.d.). Available online: https://www.aliexpress.com/i/1005004603727710.html (accessed on 13 April 2024).
  31. Zhu, W. A Smart Battery Management System for Large Format Lithium Ion Cells. Ph.D. Thesis, University of Toledo, Toledo, OH, USA, 2011. [Google Scholar]
  32. Babu, P.S.; Ilango, K. Comparative Analysis of Passive and Active Cell Balancing of Li Ion Batteries. In Proceedings of the 2022 3rd International Conference on Intelligent Computing, Instrumentation and Control Technologies: Computational Intelligence for Smart Systems, ICICICT 2022, Kannur, India, 11–12 August 2022; pp. 711–716. [Google Scholar] [CrossRef]
  33. Ng, K.S.; Moo, C.-S.; Chen, Y.-P.; Hsieh, Y.-C. Enhanced coulomb counting method for estimating state-of-charge and state-of-health of lithium-ion batteries. Appl. Energy 2009, 86, 1506–1511. [Google Scholar] [CrossRef]
  34. Çarkit, T.; Alçi, M. Comparison of the performances of heuristic optimization algorithms PSO, ABC and GA for parameter estimation in the discharge processes of Li-NMC battery. J. Energy Syst. 2022, 6, 387–400. [Google Scholar] [CrossRef]
  35. Docimo, D.J. Estimation and balancing of multi-state differences between lithium-ion cells within a battery pack. J. Energy Storage 2022, 50, 104264. [Google Scholar] [CrossRef]
  36. Aimo, C.; Schmidhalter, I.; Aguirre, P. Multi-objective optimization of a lithium cell design operating in a cyclic process. J. Energy Storage 2023, 57, 106256. [Google Scholar] [CrossRef]
  37. Wentker, M.; Greenwood, M.; Leker, J. A Bottom-Up Approach to Lithium-Ion Battery Cost Modeling with a Focus on Cathode Active Materials. Energies 2019, 12, 504. [Google Scholar] [CrossRef]
Figure 1. Test vehicle with assembled battery stacks for conducting test. (a) LFP type; (b) NCA type.
Batteries 10 00186 g001
Figure 2. A block diagram of the developed system.
Batteries 10 00186 g002
Figure 3. (a) A block diagram of the intelligent BMS. (b) The experimental setup for measuring the internal resistance of LPF cells.
Batteries 10 00186 g003
Figure 5. (a) The pulses of the V c e l l during the internal resistance test of the two LFP cells. (b) The pulses of V c e l l during the internal resistance test of the two NCA cells.
Batteries 10 00186 g005
Figure 7. (a) Charging LESMS with constant current of 20 A. (b) Discharging LESMS with constant current of 10 A in working voltage area.
Batteries 10 00186 g007
Table 1. The key parameters of the used cells.
Cell
Chemistry
Capacity C [Ah]Dimensions of One Cell [mm]Nominal
Voltage
[V]
Weight
[kg]
Energy
[Wh]
LFP100150 × 180 × 703.33330
NCA91 (26p)18 × 653.651.3332
Table 2. Battery stack comparison.
Cell ChemistryCapacity @ 1C [Ah]Series ConnectionsNominal TotalEnergy
[kWh]
Total Cell Only Weight
[kg]
LFP1002479.27.9272
NCA91 (26p)2696.4834.8
Disclaimer/Publisher’s Note: The statements, opinions and data contained in all publications are solely those of the individual author(s) and contributor(s) and not of MDPI and/or the editor(s). MDPI and/or the editor(s) disclaim responsibility for any injury to people or property resulting from any ideas, methods, instructions or products referred to in the content.

