Abstract
Partial state of charge (PSOC) is an important use case for lead–acid batteries. Charging times in lead–acid cells and batteries can be variable, and when used in PSOC operation, the manufacturer’s recommended charge times for single-cycle use are not necessarily applicable. Knowing how long charging will take and what the variability in time required is allows for better planning of operations and algorithm creation for battery energy storage system (BESS) manufacturers. This paper details and demonstrates a procedure for identifying the charging time of cells when different charge throughputs occur prior to reaching full charge. The results showed that the charging time in PSOC operations was highly variable when a charge-factor-controlled full-charge procedure was used. Also noted were that higher voltages for the same state of charge were reached as the number of cycles following reaching full charge increased. None of the regimes tested in this paper caused any significant capacity degradation, which demonstrates that PSOC operations can be performed even on cells not specifically designed for them, provided the correct regime is chosen.
1. Introduction
Lead–acid batteries can be used in various battery energy storage system (BESS) scenarios, for example, the more traditional and well-established uninterruptible power supply (UPS) use case or standby emergency reserve, where the battery is kept at 100% SOC and maintained by float voltage [1,2,3,4,5]. In this case, the battery may be infrequently discharged and slowly recharged to full over the course of days or weeks. However, emerging use cases for batteries include those of home energy storage, off-grid use, load levelling, and micro-grids [6,7,8,9]. In these scenarios, the battery is cycled far more frequently and is generally operated at intermediate states of charge in a partial-state-of-charge (PSOC) regime [5,10,11,12]. Whether the battery fully charges can be dependent on weather, energy prices, and household loads [13], as such, the full charges are irregular. The battery pack is a significant part of the total cost of a BESS [8,10,13,14] and so it should be kept in good condition to maintaining capacity, usability, and to allow a long duration of use and economic viability.
Lead–acid PSOC operation is relatively unexplored in the literature and rarely mentioned in datasheets. The purpose of the investigation detailed in this paper was to gain an understanding of PSOC performance and to find appropriate recharge and cyclic regimes for PSOC use that avoid overly long recharge times without serious capacity degradation. Manufacturers do not generally specify procedures for PSOC operations, and so this had to be determined experimentally.
Periodically fully charging a lead–acid battery is essential to maintain capacity and usability. In traditional UPS or cyclic use, full recharge normally occurs following any discharge. This is in contrast to partial-state-of-charge use. In this use case, multiple shallow cycles of less than 50% of the battery capacity occur before a full charge. Partial-state-of-charge operation has the advantage of a reduction in time spent at low charge rates and, in fact, allows greater charge rates to occur due to the greater charge acceptance that occurs at lower states of charge [15]. There is far more material to convert when the battery is not at very high or very low states of charge, and so maximum charging rates can be higher at low states of charge and discharge rates can be higher at higher states of charge. The general equation for a lead–acid battery is the same for the three main types of lead–acid batteries, flooded, absorbed glass mat (AGM), and gel, and is shown [16] in Equation (1), with the fully charged state shown on the left and the fully discharged state on the right.
The structural differences between the three types of cell constructions are the methods of electrolyte retention, with flooded cells having free liquid electrolyte that is held in place by gravity and AGM holding the electrolyte in a glass mat, whilst in gel batteries, the electrolyte is set using silica gel to form a hard solid electrolyte. Each method has advantages and disadvantages, such as temperature stability, gas emissions, longevity, etc.
The manufacturer’s guidelines typically give the time at a constant voltage as a guide for the termination of full charge. However, this assumes that the internal resistance of the cell does not change; the internal resistance increases as the cell is cycled under PSOC [17]. It is important to distinguish that this internal resistance is non-ohmic, varies with the current, and is due to the electrochemical parameters in the cell. Most of the internal resistance increase is due to the sulphation of the negative active material. The factor limiting the charging speed of lead–acid batteries is often the dissolution of the sulphate crystals in the negative active mass. This greater resistance means that the cell reaches the constant-voltage stage at a lower state of charge. As such, the cell needs longer in the constant-voltage stage to reach a full state of charge. A full state of charge can be defined as being achieved when almost all of the lead sulphate crystals have returned to lead, lead oxide, and sulphuric acid. Because of the increased resistance due to PSOC cycling, the manufacturer’s guidelines are often not applicable when batteries are used in PSOC duty. There is a balance in BESS use between operational goals and battery maintenance: recharge too frequently or with too much charge, and the BESS degrades due to excessive overcharging and absorbing charge too frequently at a slow rate. Overcharge causes water to split through the electrolysis, and not all is recombined to form water.
2. Materials and Methods
There are three main types of lead–acid cells: AGM, flooded, and gel. Absorbed glass mat cells have advantages over gel due to lower internal resistance and advantages over flooded cells such as greatly reduced hydrogen emissions, lower stratification tendency [18], and no free acid that could spill [19]. Enersys Cyclon 4.5 Ah VRLA (valve-regulated lead–acid) AGM spiral wound cells were used to test the regimes. Upon receipt, the “as delivered” voltage of the cells was logged, as was the impedance at 1 kHz, which was measured using a handheld Fluke BT521 battery analyser. The initial readings are shown in Table 1. The cells were placed in a thermal chamber set to 25 °C and connected to a calibrated Digatron 10 A cell cycler. The initial capacity was found by charging at 630 mA until 2.50 V was reached, which was maintained for 24 h, and then discharging at 630 mA until 1.75 V was reached. In prior testing on the same type of cells, multiple capacity tests and constant-voltage (CV) steps longer than 24 h did not affect the extra initial capacity in any significant way, and so to reduce deleterious effects of capacity testing, for this test, only one initial capacity test was performed. The recharge following the capacity test was the same 630 mA charge until 2.50 V and then a 24 h CV step.

Table 1.
As-delivered voltage and impedance of four Enersys 4.5 Ah Cyclon cells. (Cells are written in coloured font to match the charge time graphs).
The as-delivered voltage of the cells showed only small variation, and the capacity showed little variation as shown in Table 1, though all cells fell short of the 4.5 Ah nominal capacity. One cell that had not been used arrived with a voltage of around 1.75 V and was excluded from further testing. Capacity loss in storage is common and partly recoverable with charging [20]. What was known is that the cells tested in the experiment arrived at the supplier six months prior to arrival at the university, although the exact date of manufacture was unknown.
Cyclic Regime
The partial-state-of-charge cycling window was decided to be 75–50% SOC; the upper limit was chosen to minimise the chances of the cell’s charge rate becoming limited by voltage, and the lower limit was chosen to reduce the degradation associated with deep discharge. The capacity was assumed, in all cases, to be 3.8 Ah, and the same 3.8 Ah reference capacity was used throughout the tests on all cells to calculate SOC and Ah throughput for comparability.
Intervals of 2, 3, 4, and 5 cycles between full charges were chosen for these cells. This was informed by previous tests when 80–40% tests and a 10-cycle full-charge interval were unsuitable due to a collapse in voltage during the discharge and a drastic increase in charging time, starting at around 60 h in the CV step following 10 cycles, and increasing to 83, 96, and 126 h following cycles of 20, 30, and 40, respectively. This was deemed to be unsuitable, and so two parameters were changed.
The increase in charge time could have been due to negative plate undercharging, which occurred during the PSOC cycling. A lower charge interval and lower throughput were thought to reduce the likelihood of this.
With a known capacity, the number of ampere-hours needed to discharge a cell from 100% SOC to 75% SOC can be calculated, along with the 75–50% SOC ampere-hours. Equations (2)–(7) were used to find the charge to be removed from the cell to change the SOC as desired and calculate the extra charge needed to ensure the charge factor reached the 1.03 suggested by Enersys.
The cells were discharged from 100% to 75% using the charge-counting technique at 630 mA (approx. C/7). Actual BESS discharge rates vary based on battery size, inverter capacity, operational demands, etc. Thus, service discharge rates can reach as high as 4C and can be as low as C/200 [21]. C/7 was chosen to be characteristic of a BESS that is designed as an energy buffer or for load shifting.
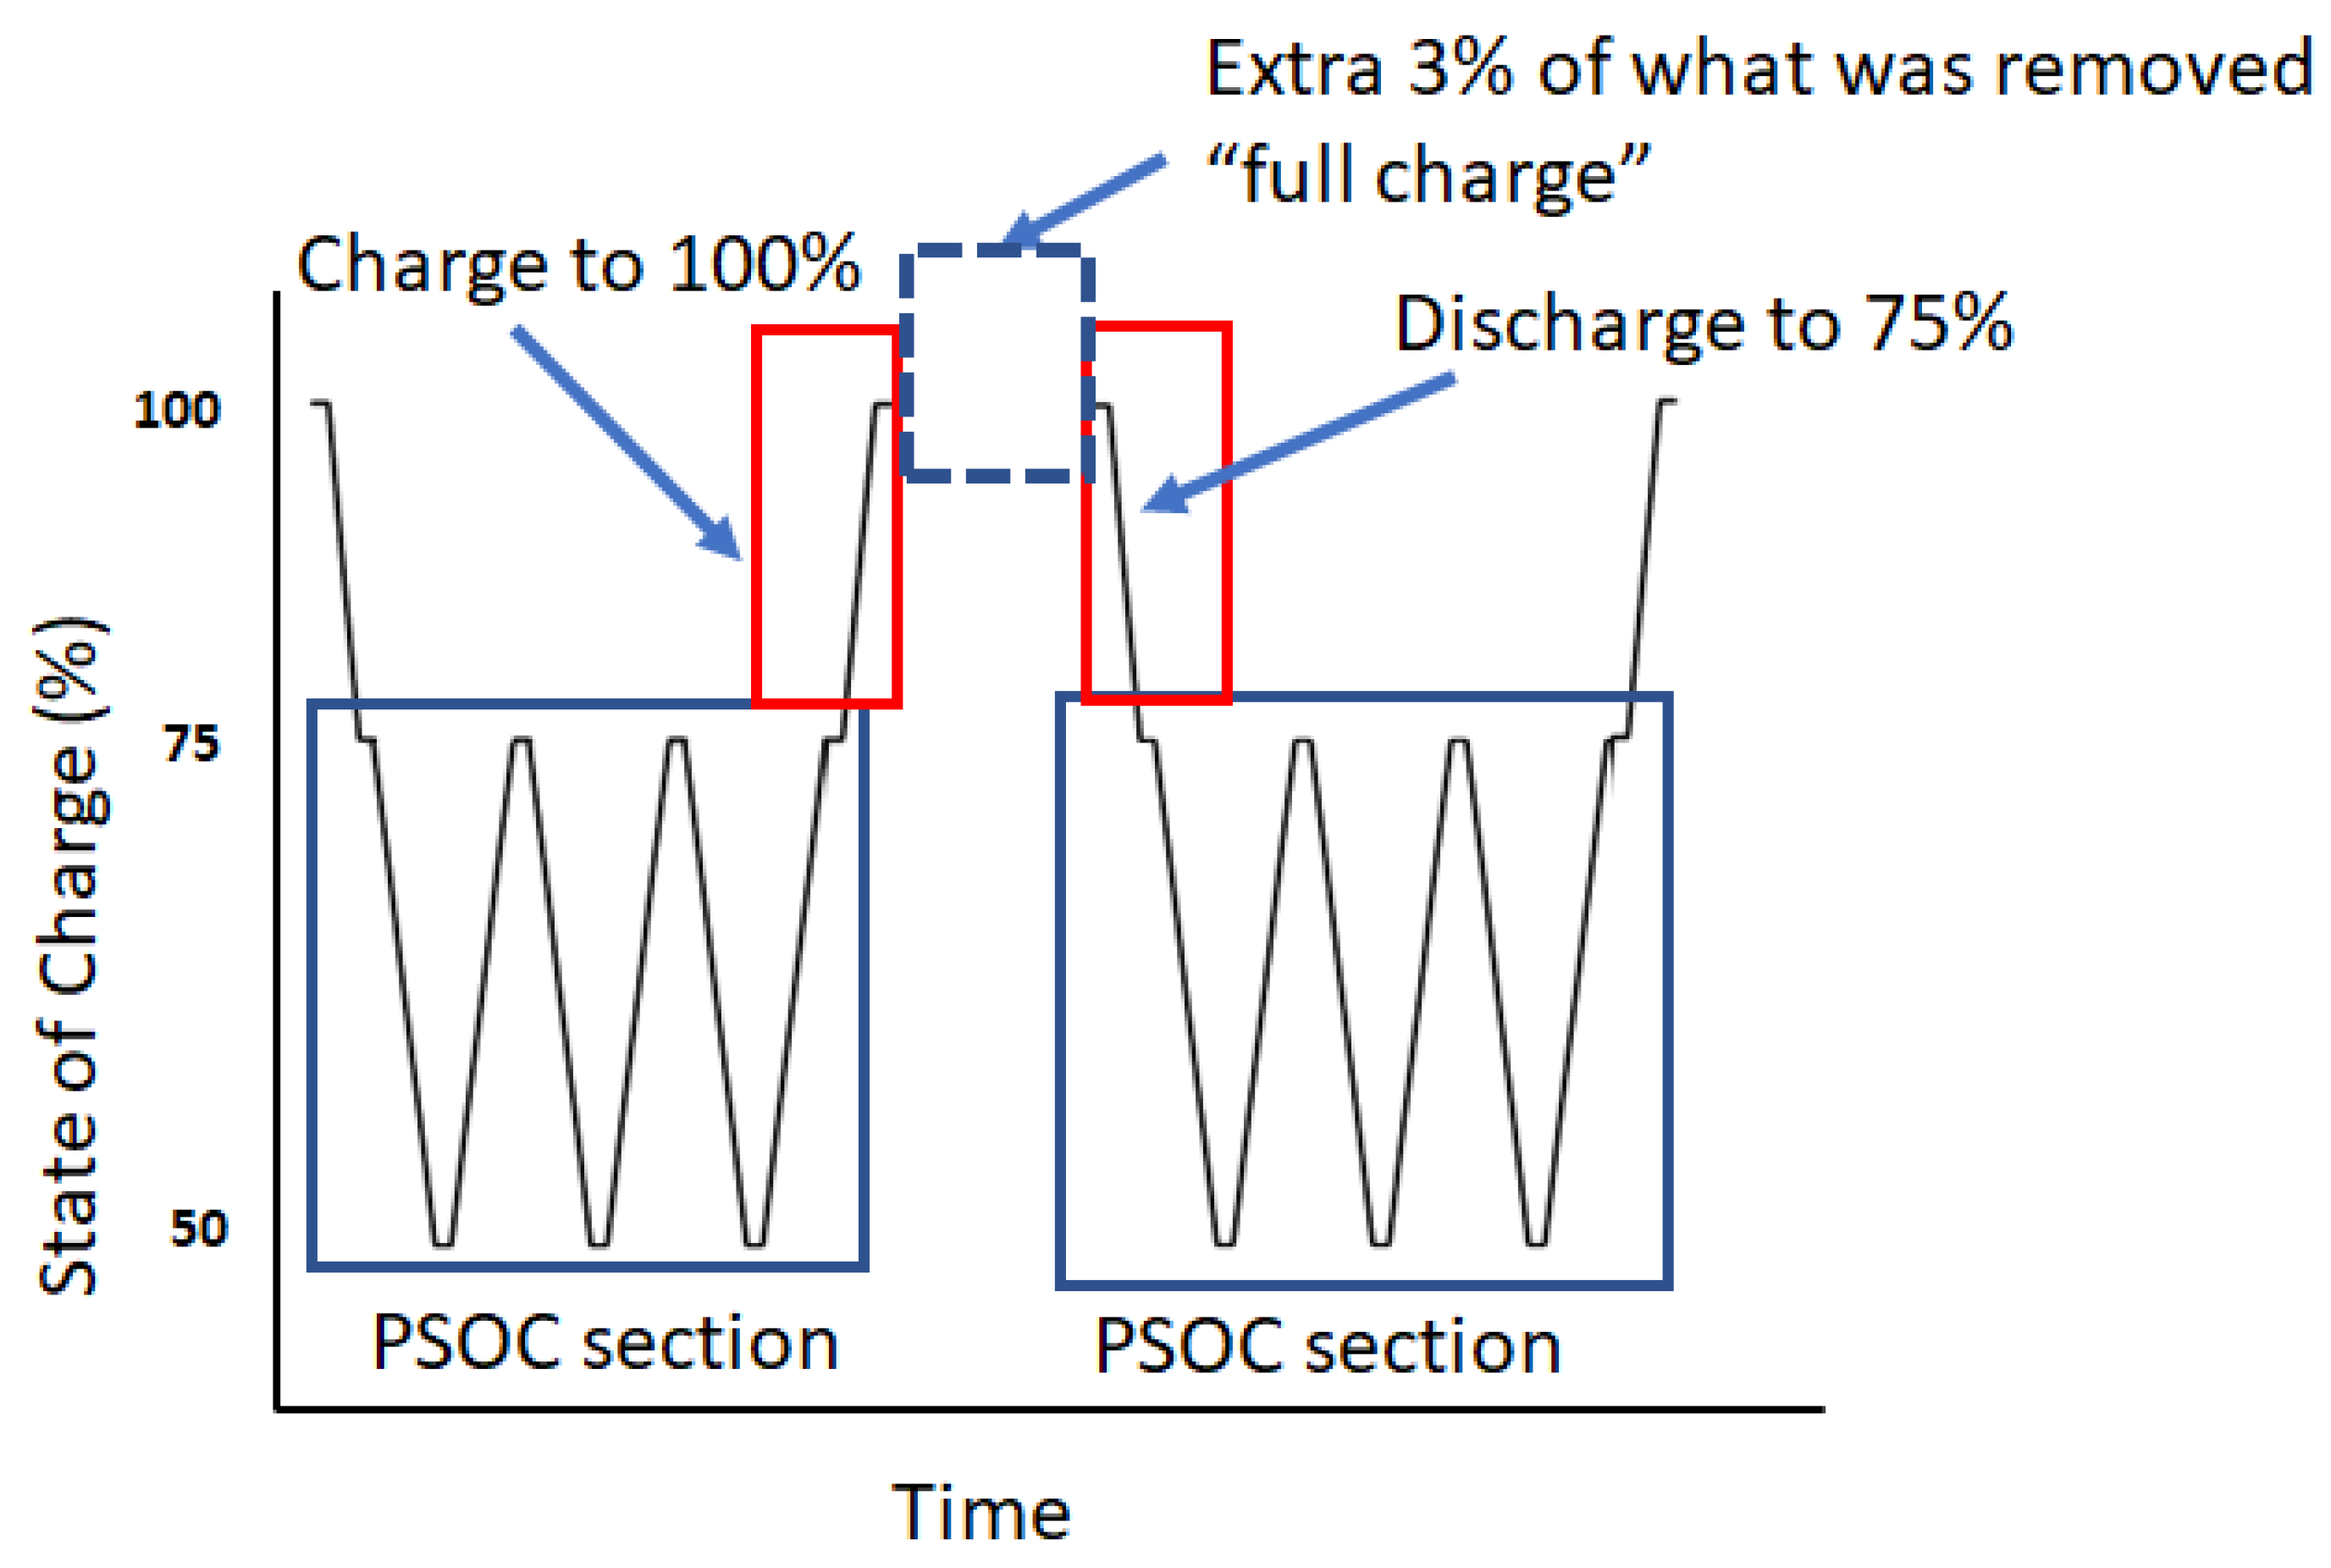
In this test, 75% was the limit for the upper state of charge during PSOC. The cell was then discharged at 630 mA from 75% to 50% and then charged back to 75% at 630 mA, and this continued until the cell was due for a full recharge. A simplified version of the cyclic regime is shown in Figure 1. The full recharge would not be time-limited but would continue until the 1.03 charge factor was reached. The full-charge interval for each cell had been decided prior to the capacity test to ensure no bias in cell selection.
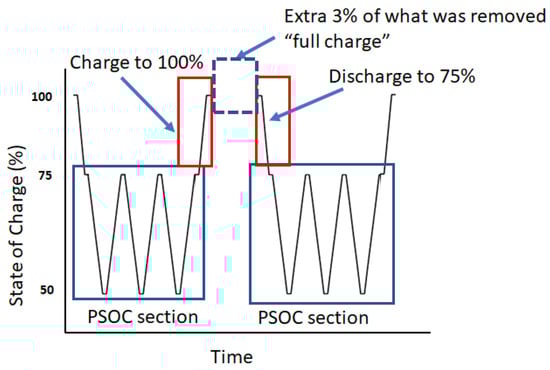
Figure 1.
SOC graph showing the partial-state-of-charge cycling section, followed by the full charge and return to partial-state-of-charge cycling. N.B. each PSOC discharge and then charge counts as one cycle.
In the experiment described in this paper, 50 cycles was the target before a capacity test. However, because not all intervals are factors of 50, some cells experienced more cycles than others, as shown in Table 2. The difference in cycles before a capacity test is not likely to be significant.
Table 2.
Cell number and the intervals at which it was fully charged.
Each cell had the same 1.03 charge factor, but because each cell had a different full-charge interval, each one required different amounts of charge to go from 75% to fully charged, as shown in Table 2. Due to the limited charge acceptance at higher SOC, the majority of the time charging from 75% to 100% SOC was at the voltage limit of 2.50 V, and the variation in charge acceptance is the determining factor in the charge speed. Applying higher voltages would be deleterious and unlikely to charge the cell faster [22].
3. Results
3.1. First 50 Cycles
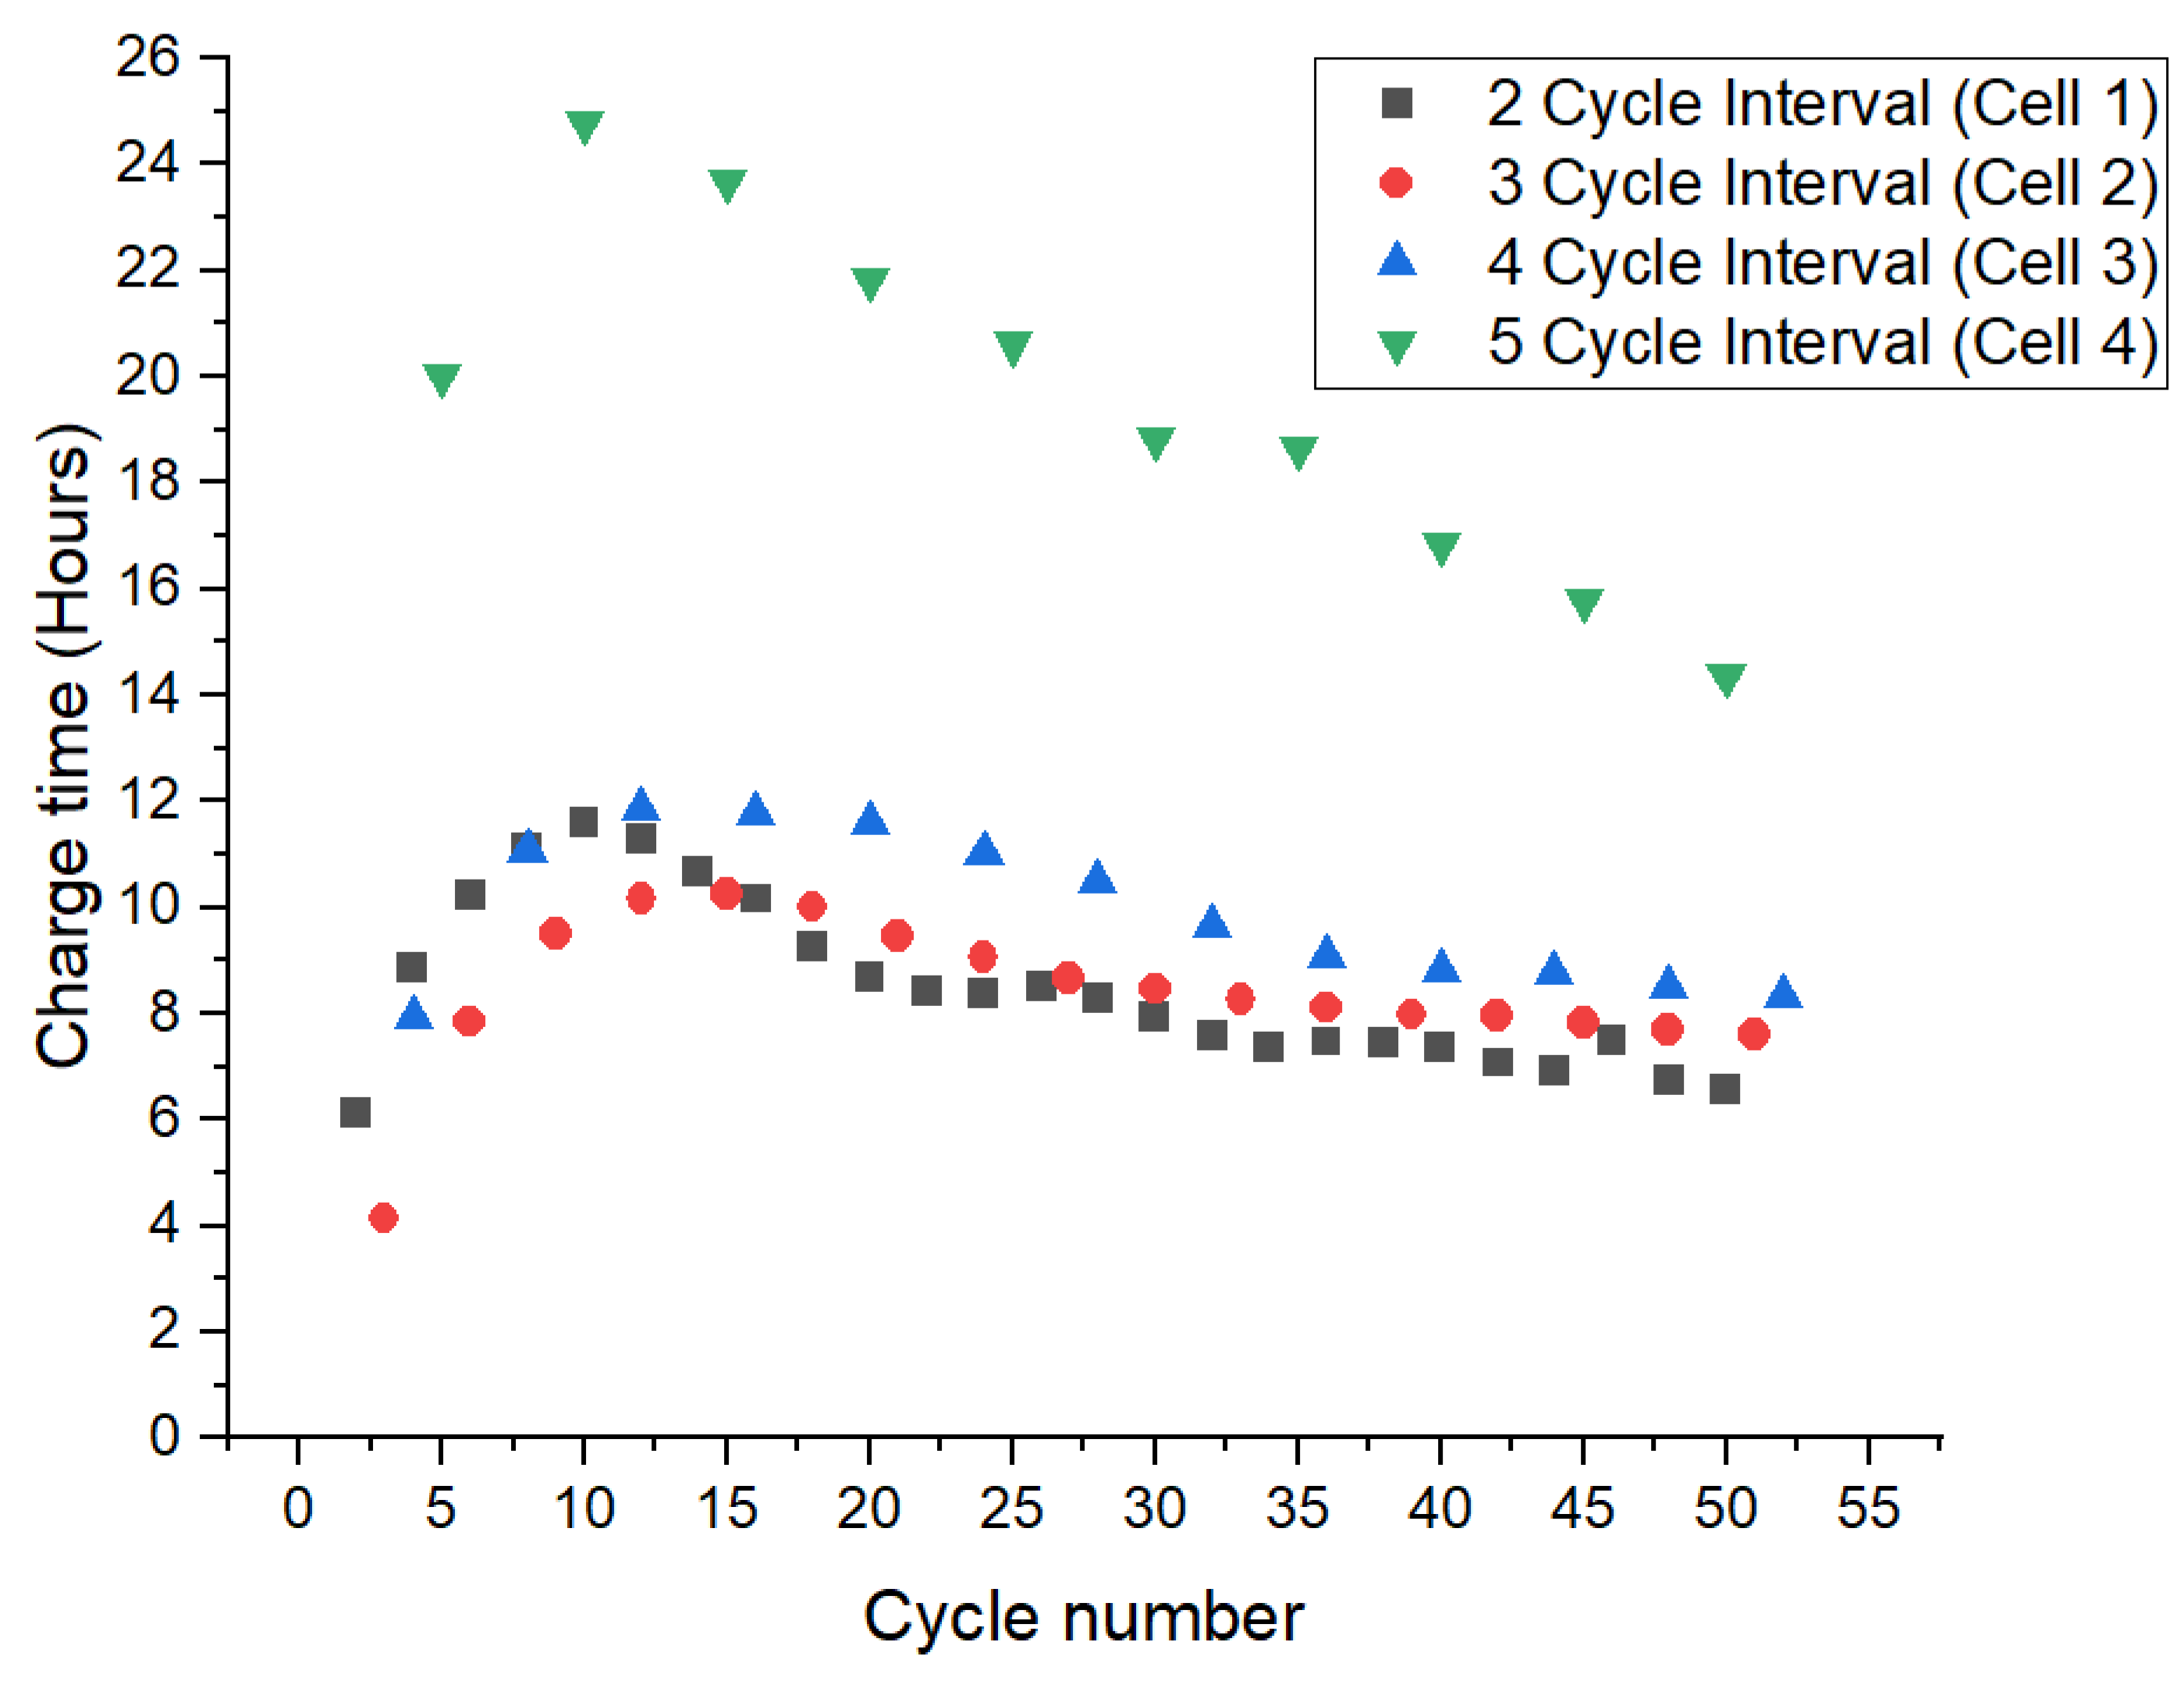
In the first 50 cycles, the charge times observed from the cells were highly variable, irrespective of the full-charge interval, and every regime required different charge times. The same pattern was seen on each cell. This was, as shown in Figure 2, the first cycles having charge times that were lower, then increasing as cycling progressed, and then showing a decreasing trend, which appears to level off towards the end. The exact cause of this is unclear; however, it is potentially due to the capacity test providing a more complete full charge than the 1.03 charge-factor-controlled full charge.
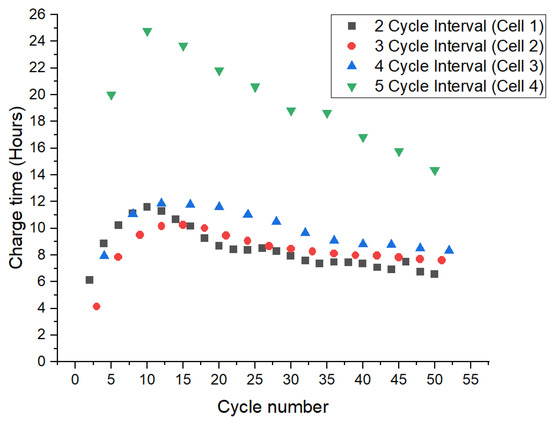
Figure 2.
Charge time of Cyclon 4.5 Ah cells under different full-charge interval PSOC regimes during the first 50 cycles.
What is noticeable is that the five-cycle-interval cell (Cell 4) appears to have a greatly increased charge time at all stages of cycling. It was unclear if this was due to the cyclic regime or a manufacturing variance in the cell. This cell (Cell 4), as shown in Table 1, did have the highest out-of-the-box 1 kHz impedance and the lowest as-delivered voltage and capacity of the cells used in this cyclic test, which would support the theory that manufacturing variance was the cause of this.
There did appear to be a slight trend towards greater charge times as the number of cycles between charges increased; however, the charge times towards the end of the two-, three-, and four-cycle intervals were around 8 h. The Cyclon manual suggests a charge time from 70% SOC to fully charged of 5 h, which is unsuitable for this particular use case due to the larger charge throughput characteristic of PSOC usage. This long charge time is in spite of the very low charge factor of 1.03 tested; a more typical 1.05 charge factor would take considerably longer considering the charge rate at charge termination has been observed to be around 10 mA in these cells.
Following the final full charge after the allotted approximately 50 cycles, a capacity test was performed. This was the same 630 mA CC discharge to 1.75 V, followed by a 630 mA constant-current charge until 2.50 V, and then a 2.50 V 24 h CV step. This capacity measured in this test was only used for comparison, and the actual Ah used for the coulomb counting in the cyclic regime remained unchanged. This did mean that the exact state of charge limits did change slightly throughout the test.
3.2. Second 50 Cycles
Three of the cells then continued cycling for another set of approximately 50 cycles. Cell 1, allocated to two-cycle intervals, which received a full charge more often, spent far longer at lower rates of charge and had a slightly higher charge throughput. These factors meant that the cell took longer to complete the allotted 50 cycles, and due to equipment availability restrictions, it was not possible to restart the cyclic test on this cell to complete a further 50 cycles. Cell 1 was fully charged as part of the 50-cycle capacity test and retained for a test detailed later.
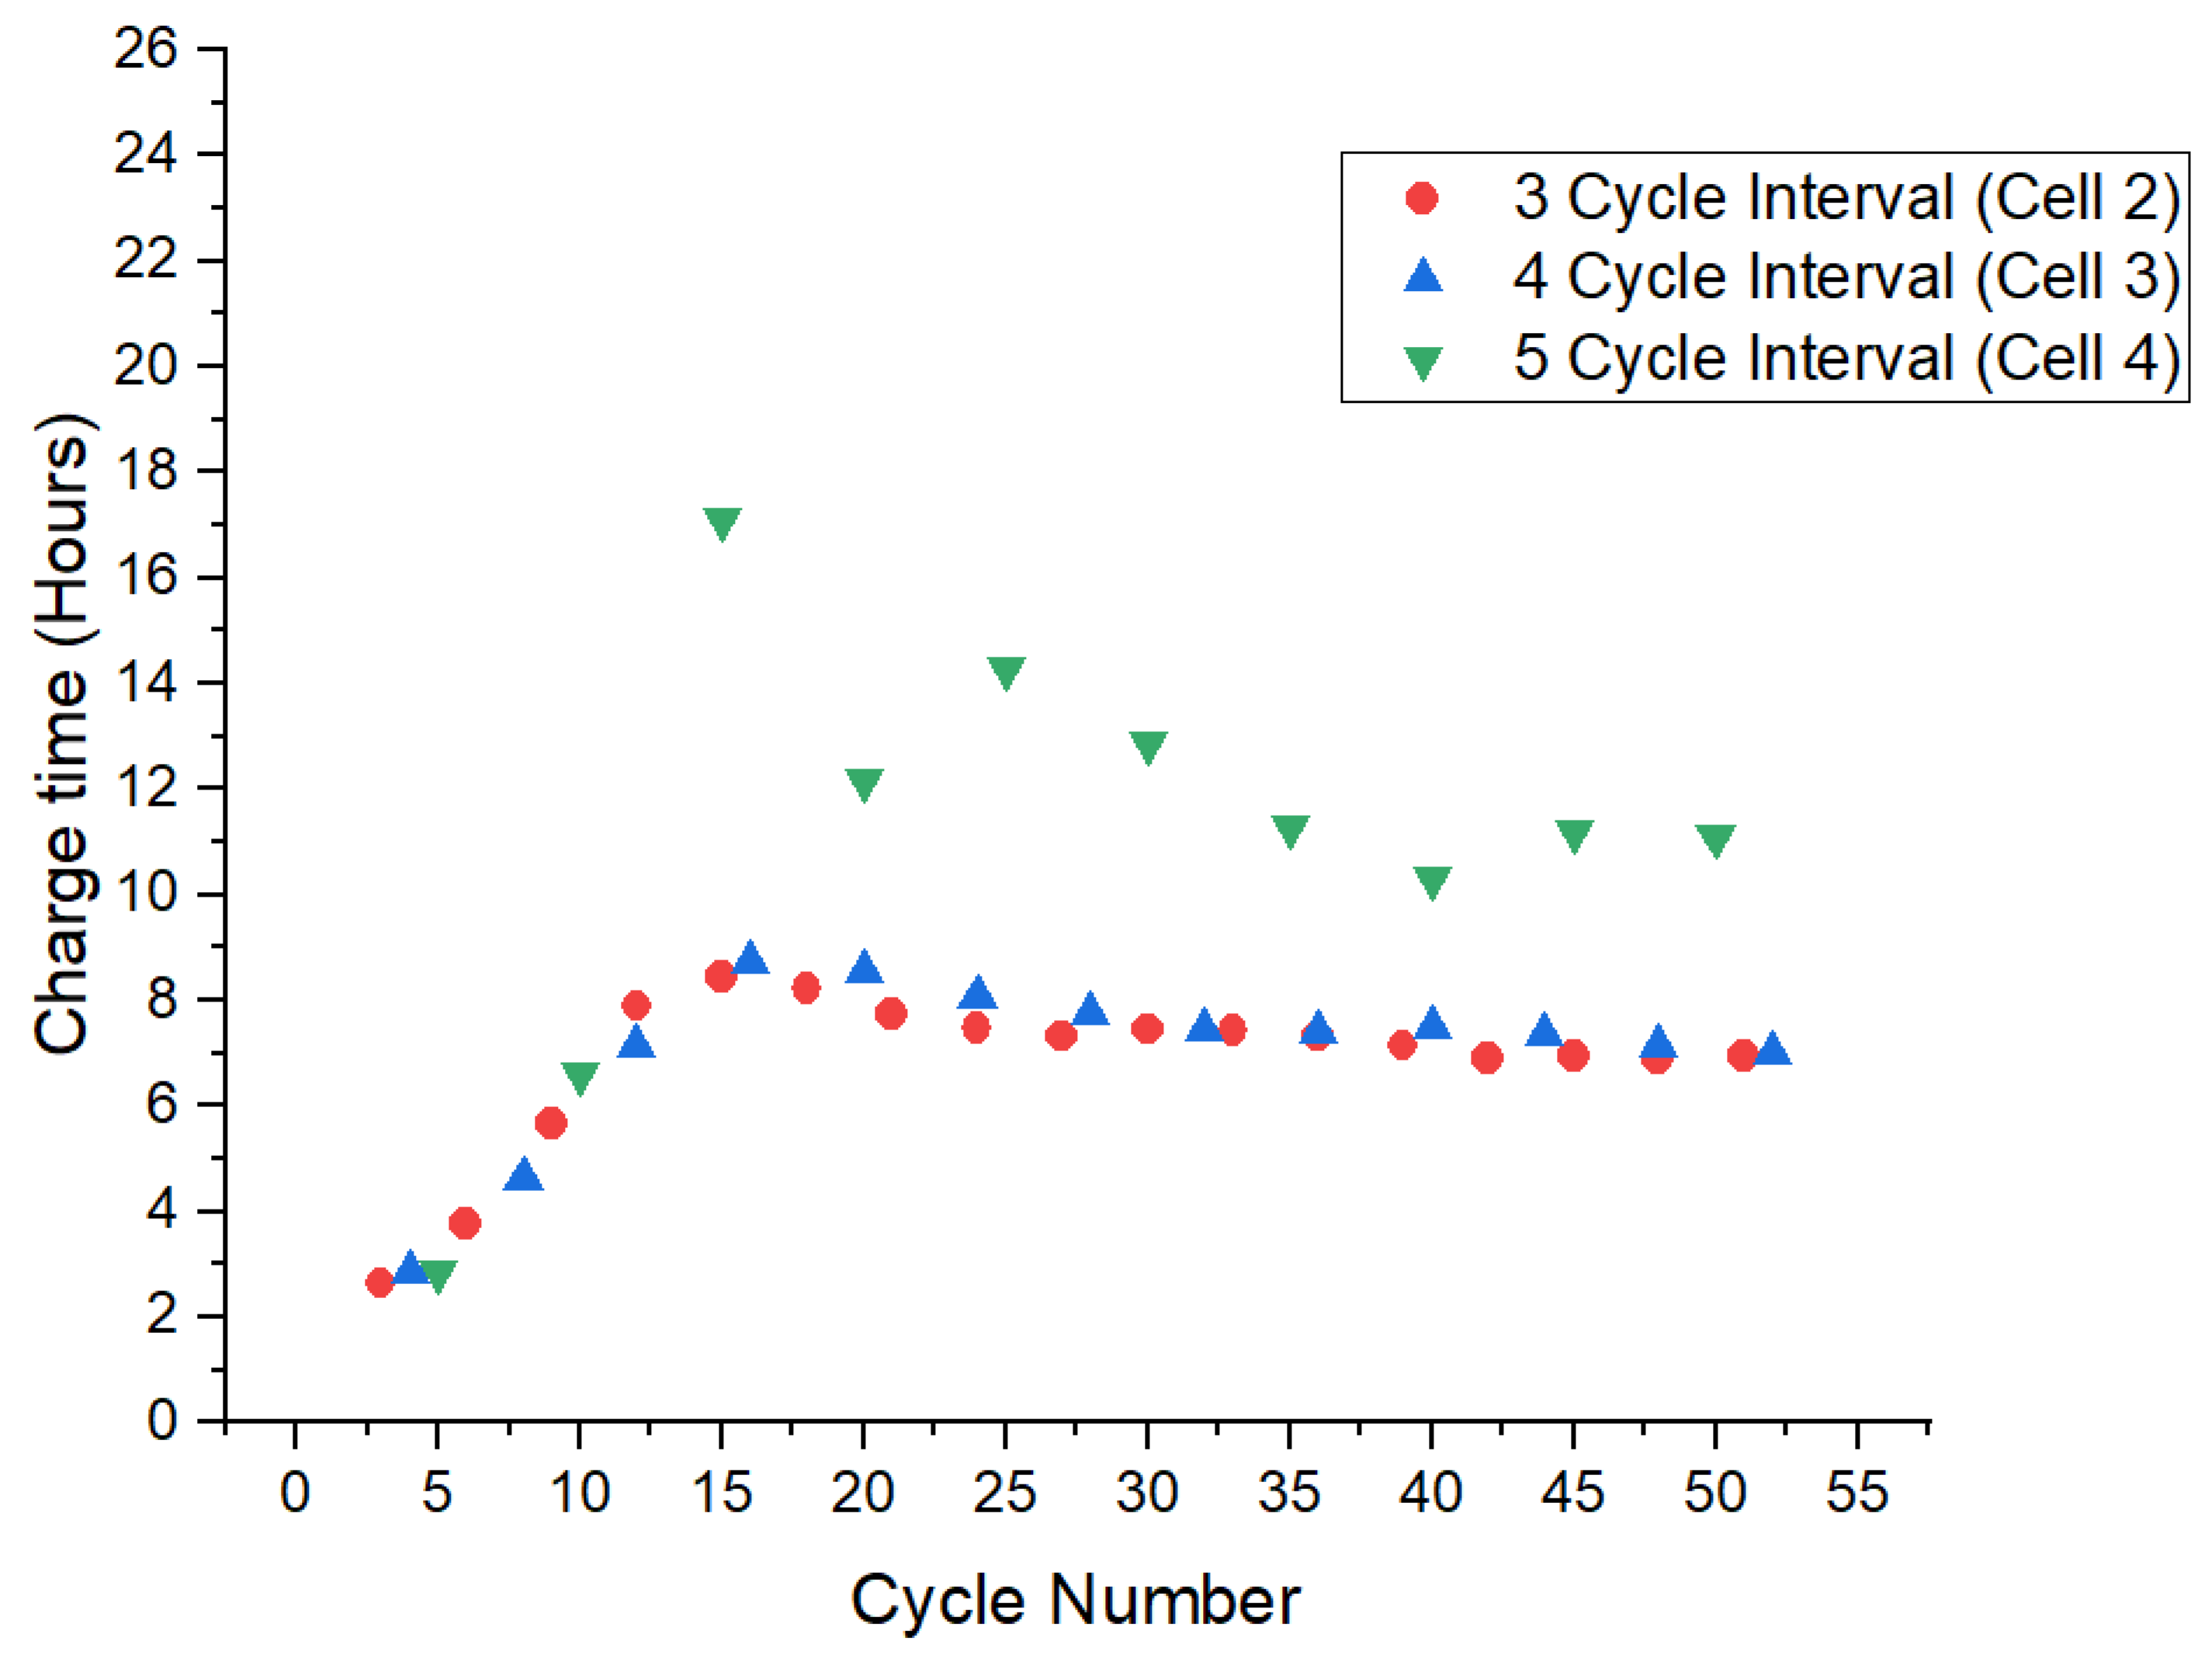
The three remaining cells continued cycling, exhibiting a similar pattern as during the first round, as shown in Figure 3, with a low initial time that rises and then reduces again. However, the five-cycle-interval cell reduced in charge time and thus increased in charge acceptance during the second round of testing, but it was still far greater than the charge times of the three- or four-cycle-interval test cells. The three- and four-cycle-interval cells also reduced in charge time in the second round of testing compared to the first. This could be due to each cycle removing passivation and sulphation from the storage period before delivery [23] or the cell beginning to dry out, allowing a greater pathway volume for oxygen to flow between the plates, which would increase the rate of the oxygen cycle [24] and in turn the current during the constant-voltage step, thus reducing the time to reach the 1.03 charge factor.
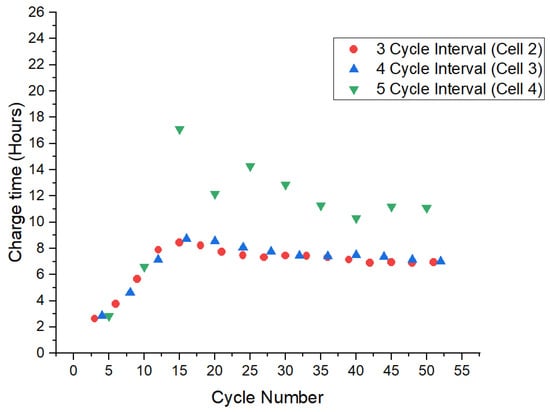
Figure 3.
Charge time of the three cells tested during the 50–100 cycle section of the experiment (the two-cycle-interval cell did not take part in this section of the experiment).
3.3. Capacity Testing
The capacities were once again tested at 100 cycles in the same way as detailed earlier and, in all cases, were higher than the initial and the 50-cycle capacity, as shown in Table 3. This shows that the tested regimes are not significantly deleterious to the cells, and partial-state-of-charge cycling can be performed in cells not specifically designed for this application, provided that the number of cycles conducted between recharging is not too great.
Table 3.
Capacity of the cells over the cycling period.
The low initial capacity of around 3.8 Ah that increased to above 4.2 Ah by 50 cycles and above 4.3 Ah by 100 cycles could be because the degradation from storage was slowly being removed by the cycling, overcharging, and capacity tests. If this were the case, a higher charge factor may have restored capacity faster; however, it would have increased the charge time. Longer charge times are often undesirable in home solar storage or general BESS use, where up-time and usability are the main goals. What is clear from the results is that the difference in charge times between two-, three-, and four-cycle charging intervals is insignificant, and so while opportunity charging can be performed if necessary or desired, the four-cycle interval appeared to be more optimal than a two-cycle interval or a three-cycle interval for minimising the total time spent at low charge rates.
The charging times of two-, three-, and four-cycle intervals appeared to be close, suggesting that, at least for the cyclic regimes tested here, the charging times are not significantly affected by the number of cycles between full charges. This is assuming that Cell 4, which experienced five cycles between full charges, was anomalous. On that assumption, it seems that there is little benefit in charging a lead–acid battery pack every two cycles to maintain charge acceptance. However, if there is an opportunity to charge using lower-cost electricity or solar power, then there is no disadvantage to fully charging other than the time taken. As mentioned earlier, lead–acid batteries need periodic full charges to maintain capacity; if these are not frequent enough, the capacity will fall. All cyclic regimes tested did not cause capacity loss, and so it is highly likely that the full charge occurrences were frequent enough. However, the exact long-term effects of the different regimes could be different.
4. Variable-Interval Testing on the Same Cell
4.1. Increasing Interval Test
In the fixed-interval test shown in Figure 3, the five-cycle-interval cell took approximately 50% longer to fully charge. This could be manufacturing variance, or it could be that five cycles before a full charge was too great. This was the point of the next test, which was a variable-interval test.
The cell originally tested on the two-cycle-interval regime, due to more frequent full charges, took longer to cycle and, as such, was not able to be restarted for the second set of 50 cycles. This was stored fully charged and open circuit for approximately 2 months and then used in a variable-interval cyclic test. Even though the cell was stored at full charge, the cell was recharged to correct any self-discharge using a 630 mA constant-current–constant-voltage (CC/CV) 2.50 V charge, time limited to 15 h, which was achieved with a Biologic SP-300 single-channel cycler.
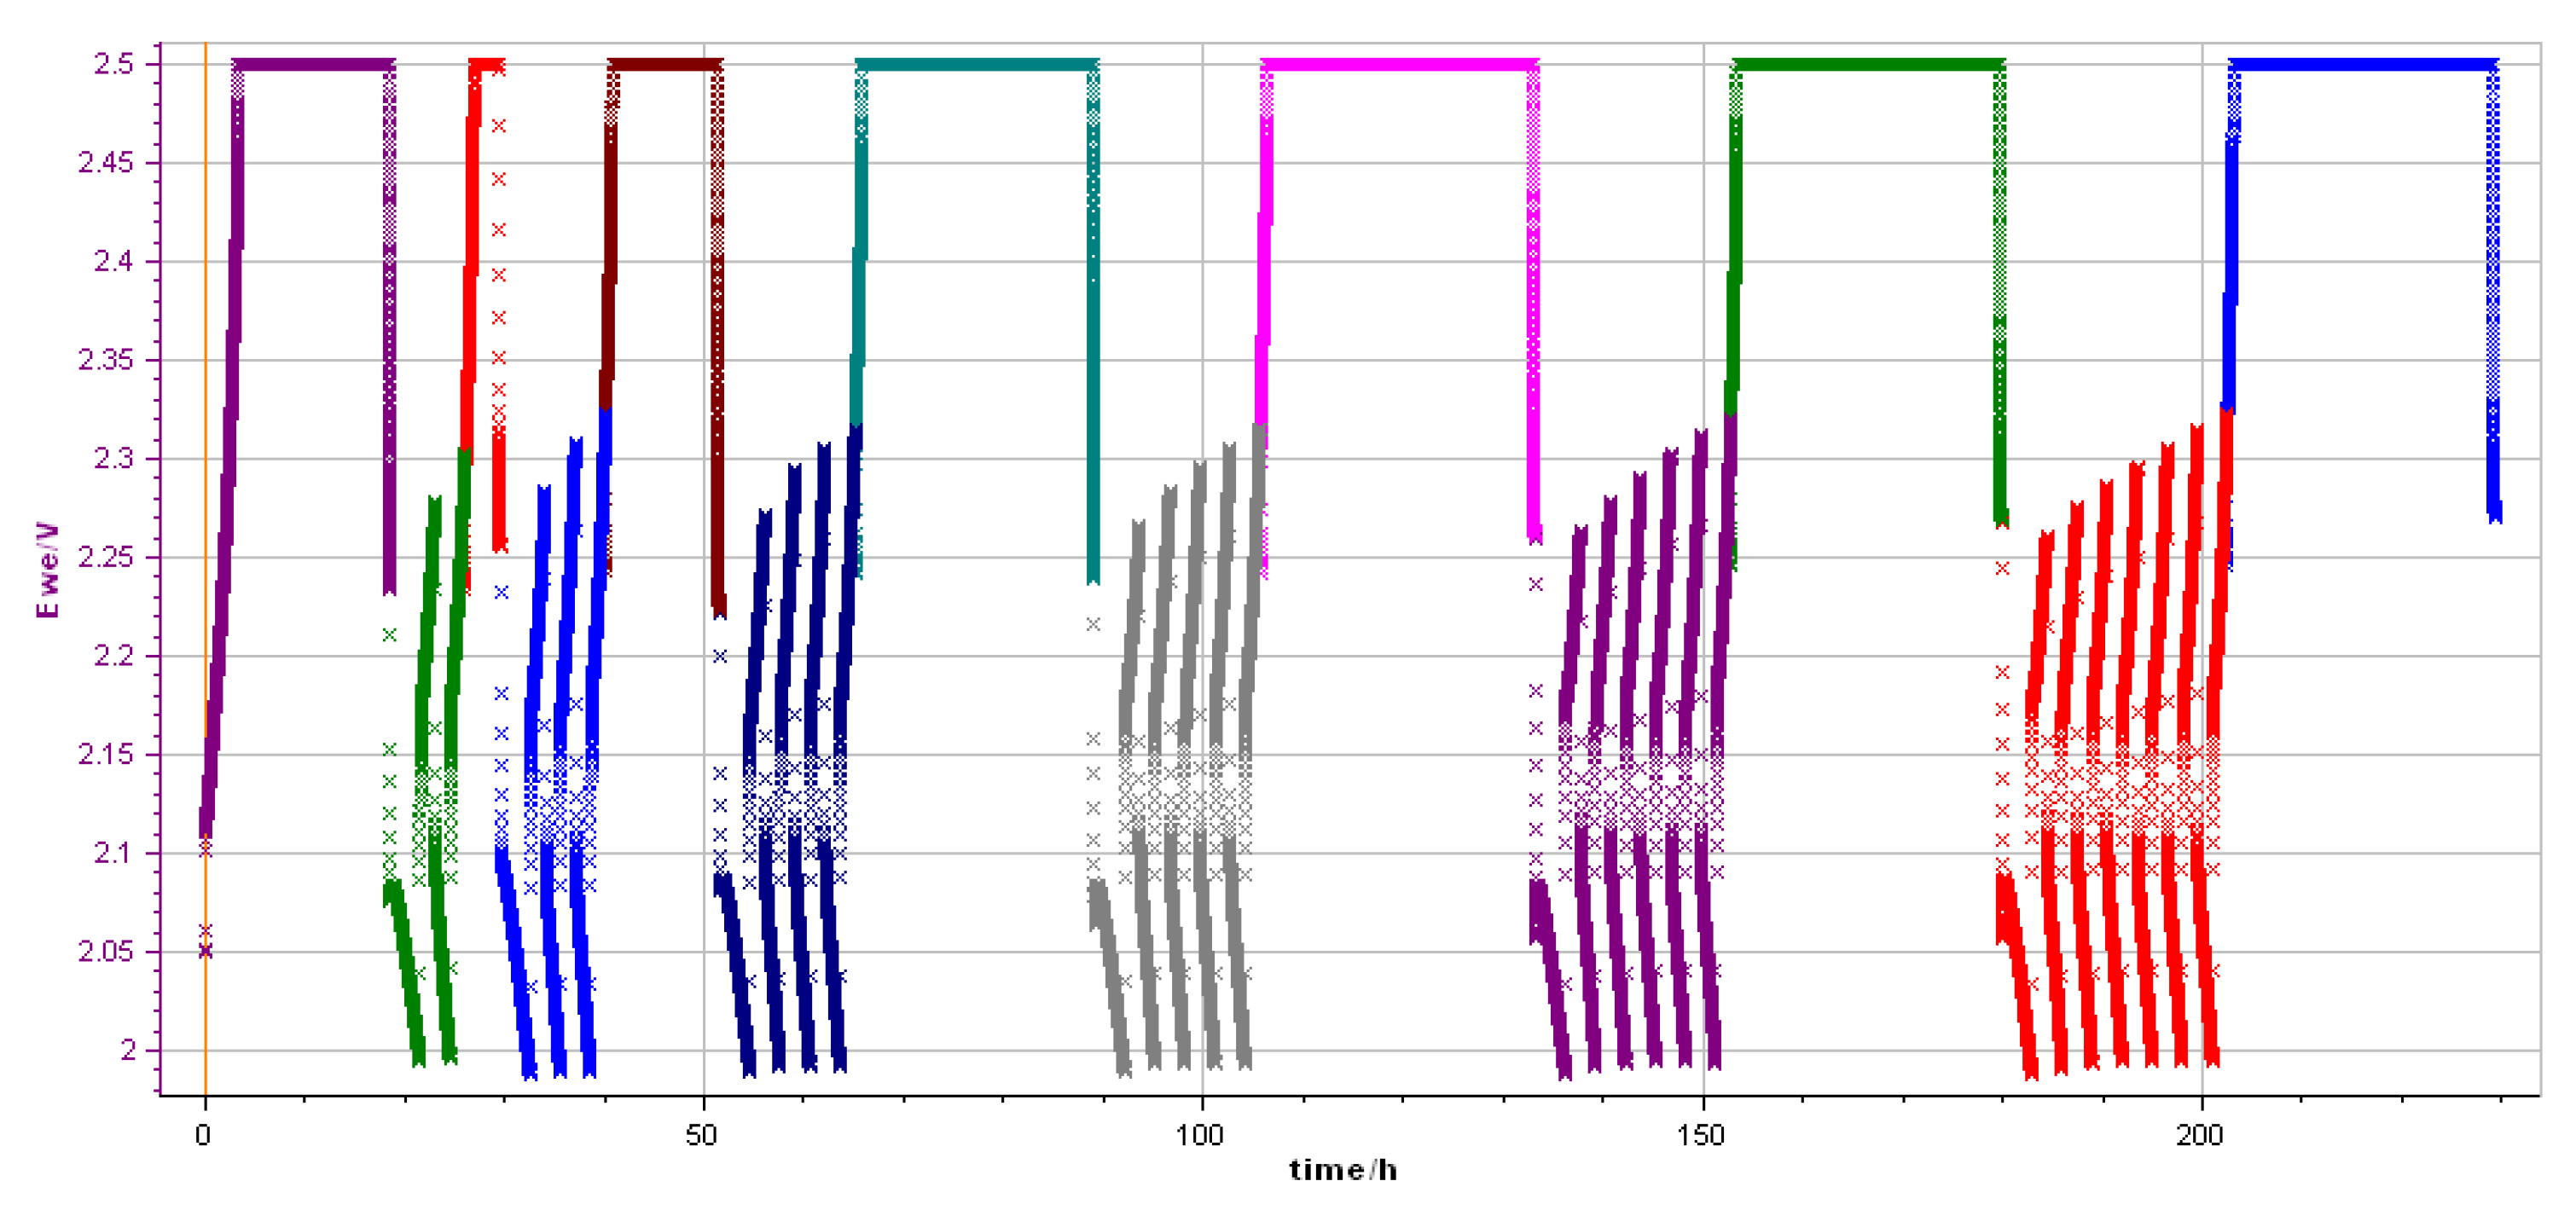
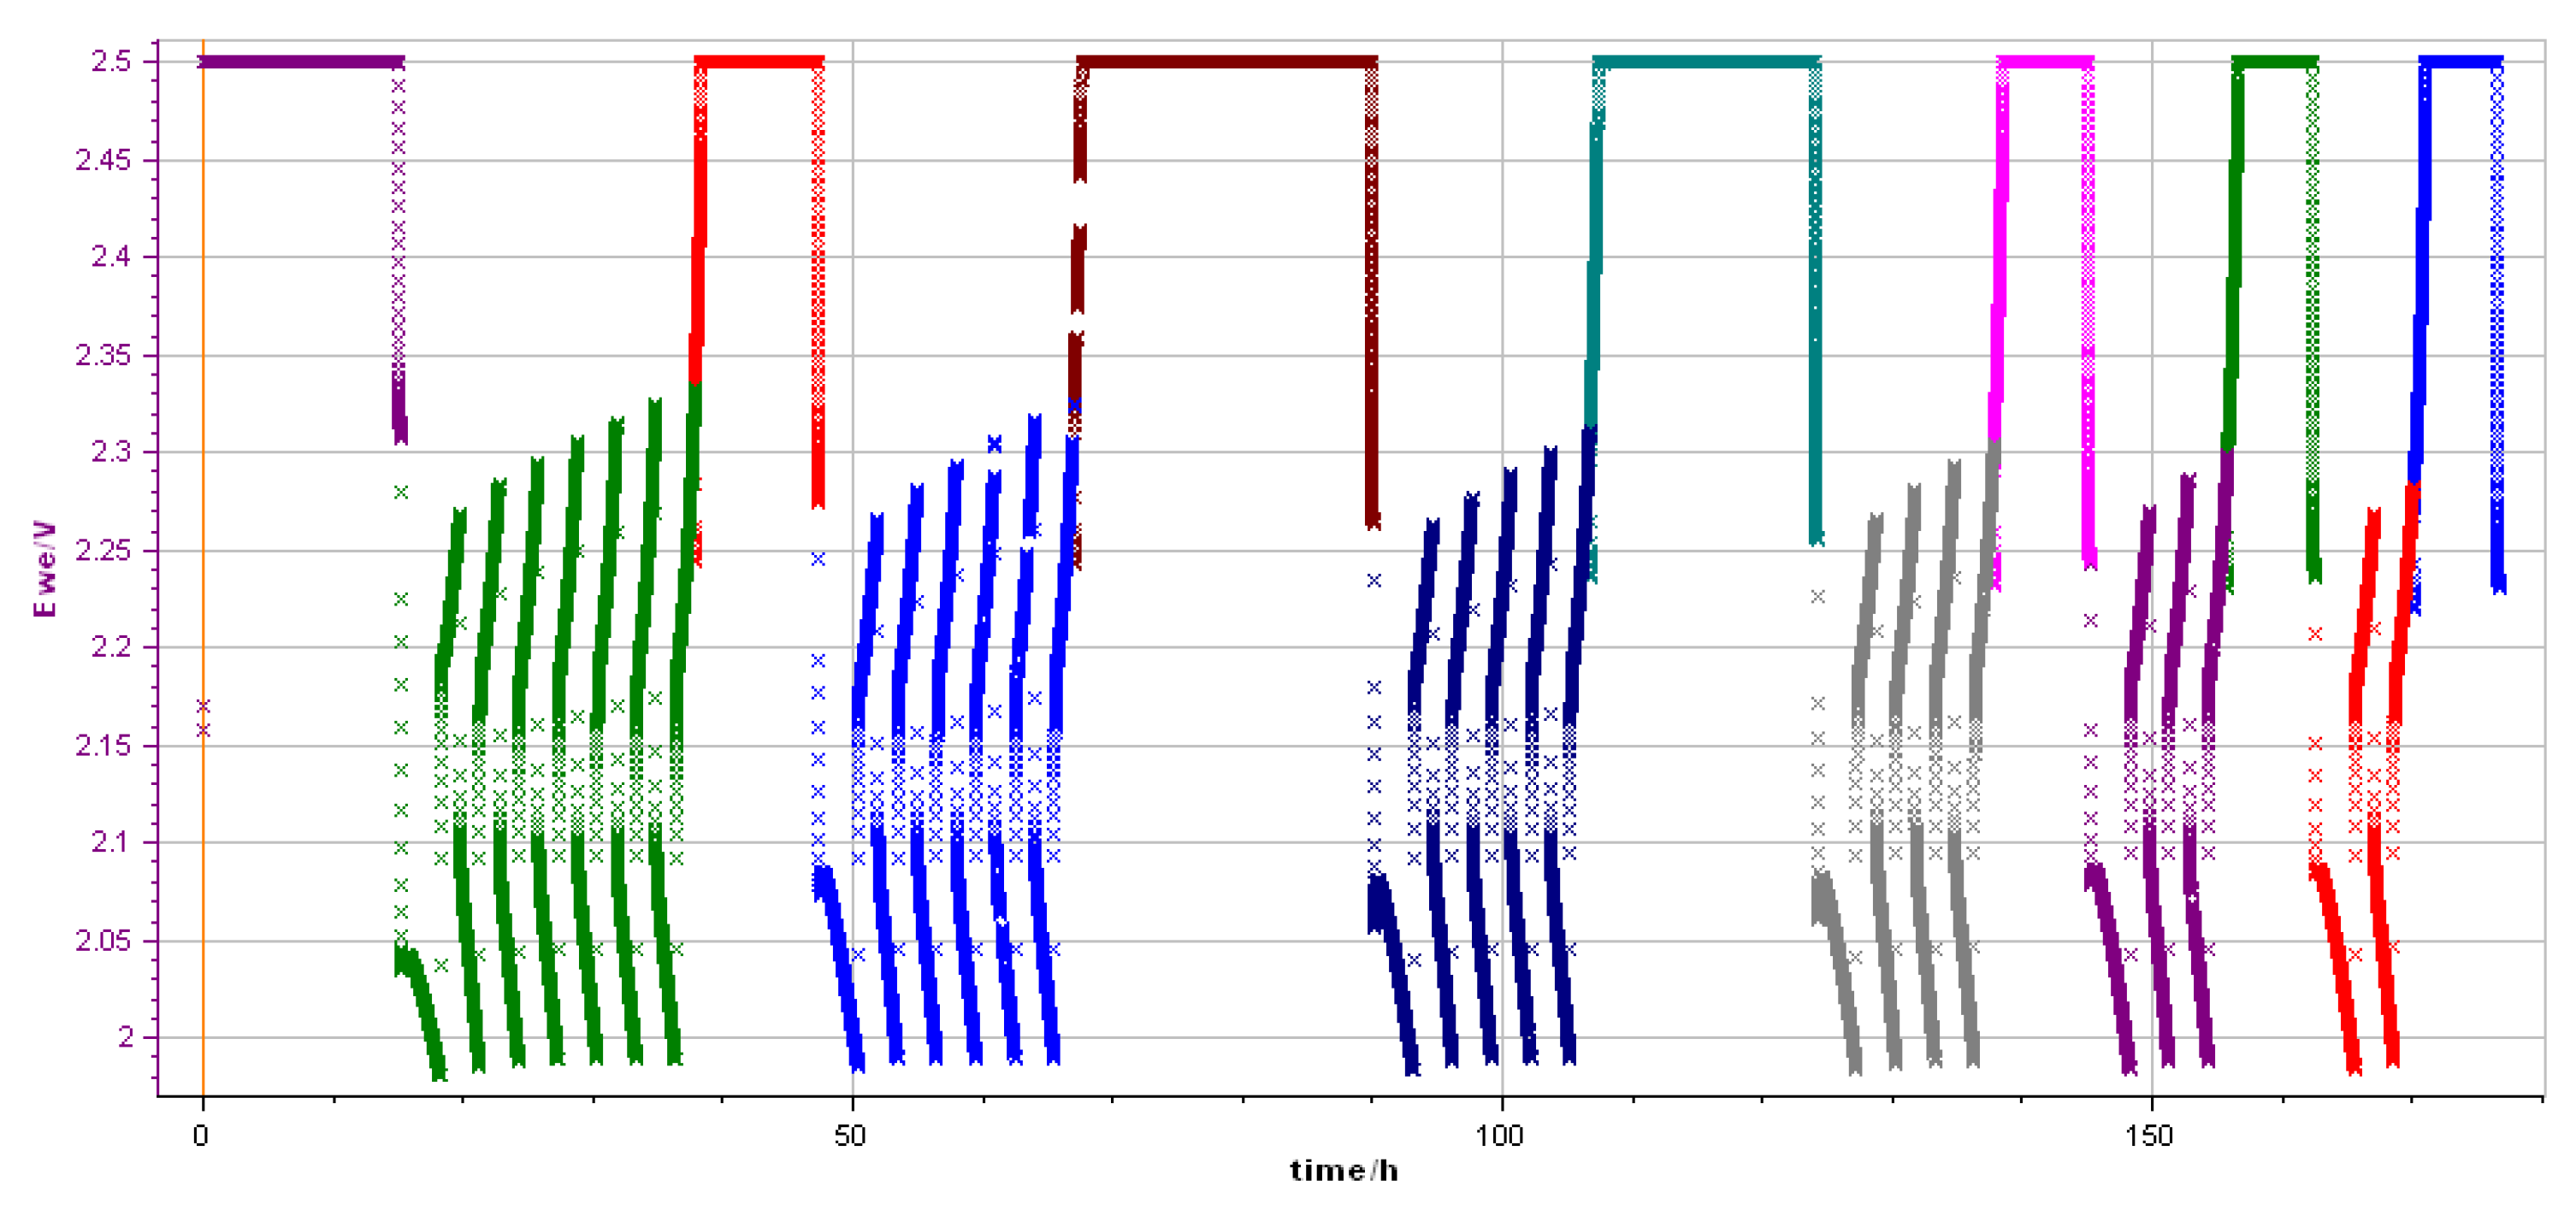
The cyclic test regime was a variable-interval regime, with two-, three-, four-, five-, six-, and seven-cycle intervals. This means that the amount of charge put in during the full-charge section increased as the cycling progressed. It can be seen in Figure 4, that the difference in charge times between four, five, six, and seven cycles was not great, suggesting that it was not the five-cycle interval that was the cause of the variability in charge times, and that it was likely manufacturing variance that caused the slow charging for the five-cycle-interval cell. Looking at the voltage profile graph shown in Figure 4, it does appear that the variability in full-charge times continues and depends on the history of the cell. A cell that has recently had an extended 2.50 V charge period will reach the 1.03 charge factor far faster than a cell that priorly experienced many coulomb-controlled cycles with charge-factor-controlled overcharge. This is a similar pattern to that experienced by the other cells in the earlier cycling experiment and shows that it is impossible to accurately predict the full-charge time of a lead–acid cell under a variable PSOC interval charging regime without knowing the exact history, and due to individual cell variability, even then this may not be possible.

Figure 4.
Voltage profile of variable charge interval test on Cell 1 (originally the two-cycle-interval cell) Different colours are used to differentiate the cyclic regime and the full charge regime.
4.2. Reverse Order Test with Reducing Full-Charge Cycling Interval
Because the history of charges clearly affected the charge times of the cell, a further test was proposed: a reverse of the above test on the same cell, starting with a seven-cycle interval and reducing to two cycles. This commenced following another open-circuit storage time of 1 month and a 15 h recharge. The voltage profile of this test is shown in Figure 5. There is a trend towards lower charge times as the cycling progresses and the number of cycles between full charges decreases. Of note is the first charge time of this test, following seven PSOC cycles, which is approximately three times faster than the full-charge time of the seven cycles experienced in the first variable-interval test.
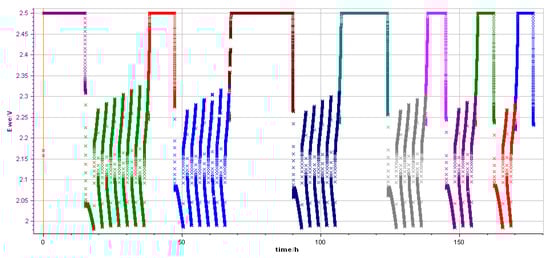
Figure 5.
Voltage profile of variable charge interval test conducted in reverse order on Cell 1 (originally the two-cycle-interval cell). Different colours are used to differentiate the cyclic regime and the full charge regime.
4.3. Charge Times
Shown in Table 4 are the charge times experienced by Cell 1 under the variable-charge-interval cycling regime. Of note is that all charge times were lower during the second test, the decreasing charge interval test, other than that of the two-cycle-interval full charge. The first two-cycle-interval full charge of the test was the first to be tested, and the second two-cycle-interval full charge was the last to be tested. The first charge of the other cells, as shown in Figure 2, was almost identical in length of time, even for the five-cycle-interval cell. So, the short charge seen following the seven-cycle test (Figure 5) fits the short charge times seen in the other cells (as shown in Figure 2 and Figure 3). The exact cause of the charge time variability is unknown.
Table 4.
Full-charge time during variable PSOC interval test in hours.
The charge time for the first three cycles of the variable-interval test was approximately 11.4 h, and the final three-cycle charge was 6.7 h. The 6.7 h charge time on the 25th cycle, following a three-cycle-interval PSOC regime, approximately matches that of the charge times seen in the earlier test, as shown in Figure 2.
It is evident that there is variability in the charge times based on the number of cycles prior to a full charge. With the exception of the first full charge of the variable regimes, it is seen that the charge time increases as the number of cycles before a full charge increases. This is important information for battery management planning in a BESS and allows better ability to schedule full charges such that enough charge is replaced without impacting the battery pack usability.
Following the two cyclic tests, the same capacity test described earlier was performed. The capacity tested was 4.14 Ah, which is lower than at 50 cycles. The capacity was not re-tested prior to recommencing cycling to avoid the extra deleterious effects of deep discharge, so it is impossible to know what contribution the 54 cycles of the test regime had compared to the storage time.
4.4. Internal Resistance
As shown in Figure 4 and Figure 5, the voltage reached at the top of the charge increases each time, with the cell reaching approximately 2.3 V at the end of the seven cycles, suggesting that the charge acceptance limit at this charging rate was being reached. However, the voltage reached upon discharge does not change significantly because the sulphation dissolution phenomenon mostly affects charging, so the creation of more and larger sulphation crystals upon discharge does not appear to have any significant impact on the terminal voltage during the regimes tested. If a greater number of cycles between full charges occurred, then it is possible that there could be a lower concentration of sulphate ions in the electrolyte and thus higher electrolyte resistance.
5. Discussion
The charging times of lead–acid cells are clearly variable, and a constant time at a constant voltage does not cover the variability in the charging times expected. While it can be said, based on the results of this test and assuming that a minimum 1.03 charge factor is the target, that around 28 h should be adequate in all cases for PSOC intervals of up to seven cycles, this approach is not ideal. In BESS use, the time out of service is the time that the user cannot offset their electricity usage or make use of variable tariffs, and while the battery pack is not technically unusable, if the battery control system is programmed such that a set time at a constant voltage is the target, this is not applicable to every usage history profile. Gathering many data points of charge times at various histories could allow a look-up table to be generated, and the battery charger could use this to find the correct time for the constant voltage.
It is clear that the variability in charging times is something that needs to be planned for in a BESS. Allowing adequate time for a full restorative charge is essential, and knowing the cyclic history of the battery pack is one key piece of data towards this. Charge-factor-controlled full charging and coulomb-controlled cycling clearly have great applicability for BESS use. Changing from coulomb control to coulomb monitoring would allow cyclic decisions to be made based on BESS demands. This necessitates high-accuracy, low-drift monitoring to enable the total charge in and out to be accurately calculated. This would allow charge-factor-controlled full charging to be accomplished.
Capacity drop was not seen, and in all cases other than Cell 1, which experienced open-circuit storage, the capacity at the end of the cycling was higher than it was at the beginning, suggesting that all constant-interval cycles and full-charge procedures were suitable for this kind of cell. There was a clear trend towards higher and higher voltages as the number of cycles progressed; at some point, this would reach or exceed voltage limits. If this became too high, the cell would need to be recharged for charge-acceptance reasons rather than capacity-degradation reasons. BESS use is a growing market area, and PSOC is an almost intrinsic part of this use case. Knowing how to evaluate charge times in a lead–acid cell is essential, and knowledge that the charge times can be highly variable is essential for charger design and operational usage parameters. This paper has demonstrated a technique for finding charge times and comparing different regimes, allowing better design decisions to be made, both in the choice of cell or battery and in operational parameter expectations. Future work could focus on cells specifically designed for energy storage and longer-term cycling tests to identify the longer-term effects of various partial-state-of-charge to full-charge intervals. Although, the regimes chosen for a long-term test would first need to be designed and tested using a similar method to that outlined in this paper.
Author Contributions
Conceptualisation, M.P.; methodology, M.P.; formal analysis, M.P.; investigation, M.P.; resources, M.P.; writing—original draft preparation, M.P.; writing—review and editing, M.P. and R.M.; supervision, R.M. All authors have read and agreed to the published version of the manuscript.
Funding
This research received no external funding.
Data Availability Statement
Data can be provided upon request.
Acknowledgments
The authors would like to thank Enersys for their contribution of the number used for the charge factor.
Conflicts of Interest
The authors declare no conflicts of interest.
Abbreviations
The following abbreviations are used in this manuscript:
| Ah | Ampere-hour |
| AGM | Absorbed glass mat |
| BESS | Battery energy storage system |
| PSOC | Partial state of charge |
| SOC | State of charge |
| UPS | Uninterruptible power supply |
| VRLA | Valve-regulated lead–acid |
References
- Berndt, D.; Teutsch, U. Float Charging of Valve-Regulated Lead-Acid Balteries: A Balancing Act Between Secondary Reactions. J. Electrochem. Soc 1996, 143, 790. [Google Scholar] [CrossRef]
- Jones, W.E.; Feder, D.O. Behavior of VRLA cells on long term float: Part 2. The effects of temperature, voltage and catalysis on gas evolution and consequent water loss. In Proceedings of the Intelec’96—International Telecommunications Energy Conference, Boston, MA, USA, 6–10 October 1996; pp. 358–366. [CrossRef]
- Badeda, J.; Kwiecien, M.; Schulte, D.; Sauer, D.U. Battery state estimation for lead-acid batteries under float charge conditions by impedance: Benchmark of common detection methods. Appl. Sci. 2018, 8, 1308. [Google Scholar] [CrossRef]
- Stewart, I.A. Automotive type batteries in long term float and ups applications. In Proceedings of the INTELEC ’86—International Telecommunications Energy Conference, Toronto, ON, Canada, 19–22 October 1986; pp. 361–364. [Google Scholar] [CrossRef]
- Szymborski, J.; Hunt, G.; Tsagalis, A.; Jungst, R. Examination of VRLA cells sampled from a battery energy storage system (BESS) after 30-months of operation. In Proceedings of the INTELEC, International Telecommunications Energy Conference (Proceedings), Phoenix, AZ, USA, 10–14 September 2000; pp. 484–492. [Google Scholar] [CrossRef]
- Barner, T.; Missouri S&T. Consortium Launches Study of Lead Battery Solar Microgrids in Homes. Available online: https://batteryinnovation.org/wp-content/uploads/2019/04/CBI-Case-Study_EcoVillage_Online_2.5.19-1.pdf (accessed on 28 May 2024).
- Chae, S.Y.; Park, J.H. Efficient Energy Management System of Smart Homes with Distributed Energy Resources. In Proceedings of the 2015 8th International Conference on Grid and Distributed Computing (GDC), Jeju, Republic of Korea, 25–28 November 2015; pp. 9–12. [Google Scholar] [CrossRef]
- Sharma, V.; Haque, M.H.; Aziz, S.M. Energy cost minimization for net zero energy homes through optimal sizing of battery storage system. Renew. Energy 2019, 141, 278–286. [Google Scholar] [CrossRef]
- Quoilin, S.; Kavvadias, K.; Mercier, A.; Pappone, I.; Zucker, A. Quantifying self-consumption linked to solar home battery systems: Statistical analysis and economic assessment. Appl. Energy 2016, 182, 58–67. [Google Scholar] [CrossRef]
- McMahon, R.; Logan, T.; Miles, J.; McMahon, N.; Ridge, A. Operational study of domestic battery energy storage system. J. Eng. 2019, 2019, 3479–3483. [Google Scholar] [CrossRef]
- Wagner, R.; Sauer, D.U. Charge strategies for valve-regulated lead/acid batteries in solar power applications. J. Power Sources 2001, 95, 141–152. [Google Scholar] [CrossRef]
- Sanz-Gorrachategui, I.; Ruiz, C.B.; Usabiaga, E.O.; Nuez, A.B.; Jesús, S.; Sevil, A.; Pérez, E.G.; Larrañaga, I.A.; María, J.; Segade, C. Partial State-of-Charge Mitigation in Standalone Photovoltaic Hybrid Storage Systems. Energies 2019, 12, 4393. [Google Scholar] [CrossRef]
- Uddin, K.; Gough, R.; Radcliffe, J.; Marco, J.; Jennings, P. Techno-economic analysis of the viability of residential photovoltaic systems using lithium-ion batteries for energy storage in the United Kingdom. Appl. Energy 2017, 206, 12–21. [Google Scholar] [CrossRef]
- McKenna, E.; McManus, M.; Cooper, S.; Thomson, M. Economic and environmental impact of lead-acid batteries in grid-connected domestic PV systems. Appl. Energy 2013, 104, 239–249. [Google Scholar] [CrossRef]
- Schaeck, S.; Stoermer, A.O.; Hockgeiger, E. Micro-hybrid electric vehicle application of valve-regulated lead-acid batteries in absorbent glass mat technology: Testing a partial-state-of-charge operation strategy. J. Power Sources 2009, 190, 173–183. [Google Scholar] [CrossRef]
- Wong, Y.; Hurley, W.; Wölfle, W. Charge regimes for valve-regulated lead-acid batteries: Performance overview inclusive of temperature compensation. J. Power Sources 2008, 183, 783–791. [Google Scholar] [CrossRef]
- Franke, M.; Kowal, J. Empirical sulfation model for valve-regulated lead-acid batteries under cycling operation. J. Power Sources 2018, 380, 76–82. [Google Scholar] [CrossRef]
- Lambert, D.W.; Greenwood, P.H.; Reed, M.C. Advances in gelled-electrolyte technology for valve-regulated lead-acid batteries. J. Power Sources 2002, 107, 173–179. [Google Scholar] [CrossRef]
- May, G.J.; Davidson, A.; Monahov, B. Lead batteries for utility energy storage: A review. J. Energy Storage 2018, 15, 145–157. [Google Scholar] [CrossRef]
- Lum, M.G.; Logan, M.W.; Annese, A.D.; Uribe-Romo, F.J. Effect of Inventory Storage on Automotive Flooded Lead-Acid Batteries. SAE International USA SAE Technical Papers 2019. 2019. Available online: https://saemobilus.sae.org/papers/effect-inventory-storage-automotive-flooded-lead-acid-batteries-2019-01-5081 (accessed on 28 May 2024).
- Cárdenas, B.; Swinfen-styles, L.; Rouse, J.; Garvey, S.D. Short-, medium-, and long-duration energy storage in a 100% renewable electricity grid: A UK case study. Energies 2021, 14, 8524. [Google Scholar] [CrossRef]
- Sauer, D.U.; Karden, E.; Fricke, B.; Blanke, H.; Thele, M.; Bohlen, O.; Schiffer, J.; Gerschler, J.B.; Kaiser, R. Charging performance of automotive batteries—An underestimated factor influencing lifetime and reliable battery operation. J. Power Sources 2007, 168, 22–30. [Google Scholar] [CrossRef]
- Iliev, V.; Pavlov, D. Self-Discharge and Passivation Phenomena in Lead-Acid Batteries during Storage. J. Electrochem. Soc 1982, 129, 458–464. [Google Scholar] [CrossRef]
- Berndt, D.; Meissner, E.; Rusch, W. Aging effects in valve-regulated lead-acid batteries. In Proceedings of the Intelec 93: 15th International Telecommunications Energy Conference, Paris, France, 27–30 September 1993; Volume 2, pp. 139–145. [Google Scholar] [CrossRef]
Disclaimer/Publisher’s Note: The statements, opinions and data contained in all publications are solely those of the individual author(s) and contributor(s) and not of MDPI and/or the editor(s). MDPI and/or the editor(s) disclaim responsibility for any injury to people or property resulting from any ideas, methods, instructions or products referred to in the content. |
© 2024 by the authors. Licensee MDPI, Basel, Switzerland. This article is an open access article distributed under the terms and conditions of the Creative Commons Attribution (CC BY) license (https://creativecommons.org/licenses/by/4.0/).