Article

Development of a Fast Running Equivalent Circuit Model with Thermal Predictions for Battery Management Applications

by
Vijayakanthan Damodaran
1,
Thiyagarajan Paramadayalan
2,
Diwakar Natarajan
1,
Ramesh Kumar C
2,
P. Rajesh Kanna
3,
Dawid Taler
4,
Tomasz Sobota
4,
Jan Taler
5,*,
Magdalena Szymkiewicz
4 and
Mohammed Jalal Ahamed
1
1
Department of Mechanical, Automotive Materials Engineering, University of Windsor, Windsor, ON N9B 3P4, Canada
2
Automotive Research Center, Vellore Institute of Technology, Vellore 632014, India
3
CO2 Research and Green Technologies Centre, Vellore Institute of Technology, Vellore 632014, India
4
Department of Thermal Processes, Air Protection and Waste Management, Cracow University of Technology, ul. Warszawska 24, 31-155 Cracow, Poland
5
Department of Energy, Cracow University of Technology, Al. Jana Pawła II 37, 31-866 Cracow, Poland
*
Author to whom correspondence should be addressed.
Batteries 2024, 10(6), 215; https://doi.org/10.3390/batteries10060215
Submission received: 29 March 2024 / Revised: 5 June 2024 / Accepted: 11 June 2024 / Published: 19 June 2024
(This article belongs to the Special Issue Towards a Smarter Battery Management System)

Abstract

:
Equivalent circuit modelling (ECM) is a powerful tool to study the dynamic and non-linear characteristics of Li-ion cells and is widely used for the development of the battery management system (BMS) of electric vehicles. The dynamic parameters described by the ECM are used by the BMS to estimate the battery state of charge (SOC), which is crucial for efficient charging/discharging, range calculations, and the overall safe operation of electric vehicles. Typically, the ECM approach represents the dynamic characteristics of the battery in a mathematical form with a limited number of unknown parameters. Then, the parameters are calculated from voltage and current information of the lithium-ion cell obtained from controlled experiments. In the current work, a faster and simplified first-order resistance–capacitance (RC) equivalent circuit model was developed for a commercial cylindrical cell (LGM50 21700). An analytical solution was developed for the equivalent circuit model incorporating SOC and temperature-dependent RC parameters. The solution to the RC circuit model was derived using multiple expressions for different components like open circuit voltage (OCV), instantaneous resistance (R0), and diffusional parameters (R1 and C1) as a function of the SOC and operating temperature. The derived parameters were validated against the virtual HPPC test results of a validated physics-based electrochemical model for the voltage behavior. Using the developed RC circuit model, a polynomial expression is derived to estimate the temperature increase of the cell including both irreversible and reversible heat generation components. The temperature predicted by the proposed RC circuit model at different battery operating temperatures is in good agreement with the values obtained from the validated physics model. The developed method can find applications in (i) onboard energy management by the BMS and (ii) quicker evaluation of cell performance early in the product development cycle.

1. Introduction

Electric vehicles powered by lithium-ion batteries are steadily becoming mainstream modes of transport, replacing conventional gasoline and diesel-powered internal combustion engines. However, the transition depends on a multitude of factors, and a critical one among them is the development of a robust battery management system (BMS). A robust battery management system provides an accurate estimate of the state of charge (SOC) and state of health (SOH) during the running of EVs [1]. This would help protect the battery’s useful life and mitigate the risks of over-charging, over-discharging, and fire hazards. The SOC is not a directly measurable parameter, and it should be estimated using the BMS. Also, the SOC varies with voltage, operating temperature, and ageing factors. There are multiple approaches to estimate the SOC, and they are broadly categorized into model-based approaches and non-model based ones. Model-based approaches primarily uses Kalman filters [2] and non-model-based ones include coulomb counting, the open circuit voltage-SOC lookup table method, and neural networks [3,4]. While each method has its own merits and demerits, often researchers attempt to combine different methods to reap added benefits. Among the model-based approaches, an electrical equivalent circuit model that describes the dynamics of the battery and evaluates the performance characteristics like the terminal voltage is used [3,5].
To capture the high degree of battery non-linearity, a higher order ECM is required, but this comes with the cost of computational complexity. Since ECMs are widely used for onboard applications, the right trade-off is to be obtained between accuracy and model complexity. Typically, equivalent circuit model parameters characterize the battery terminal voltage behavior, which includes faster and slower dynamics. Faster dynamics include ohmic resistance (R0), charge transfer resistance (R1), and double layer capacitance (C1), while slower dynamics are represented by the diffusion effects (R2 and C2) [5]. The faster dynamics happen at a faster time scale, typically less than 10 s, whereas slow dynamics occur at a larger time scale (tens or hundreds of seconds). The 2RC pair equivalent circuit model is widely used by online battery management systems [5,6,7,8,9]. A simple schematic of a lithium-ion battery is given Figure 1a, and the 2RC pair equivalent circuit model is given in Figure 1b. V0 is the open circuit voltage at a particular SOC, I is the operating current, and Vterminal indicates the terminal voltage.
The RC parameters of the equivalent circuit model are identified using the hybrid pulse power characterization (HPPC) protocol. The HPPC protocol is a widely followed practice to calculate the parameters and involves constant current pulse discharge and charge tests [3]. The parameters can be either directly calculated or obtained from data-driven optimization. The ohmic resistance R0 can be directly estimated using the instantaneous voltage response of the cell to the current pulse. However, the identification of parameters R1, C1, R2, and C2 is difficult as different time constants are involved during the transient voltage response [10]. The time constant (ζ) is defined as the product of diffusion resistance and capacitance, i.e., ζ1 = R1C1 and ζ2 = R2C2. These RC parameters are functions of the SOC and ambient temperature, and an accurate estimate of their values is crucial to build a good equivalent circuit model. Typically, these parameters are fit using the non-linear least squares method [11]. Other approaches like genetic algorithms and optimization based techniques were also used. Qiao et al. [12] directly fitted the RC parameters of a 2RC element model using the analytical solution of a terminal voltage response with a single current pulse. Shugang et al. [8] fitted a linear regression equation for the RC parameters using measured test data. All the testing data during the relaxation period of the constant current pulse charge and discharge tests were used to calculate the RC parameters with the least squared error approach. Following this work, Chao et al. [10] used an integro-differential method to linearize the equation (sum of multiple exponentials) that describes the voltage during the relaxation phase. The derived equation is linear in form with respect to parameters and is solved using the least squares method. On the thermal–electrical modelling front, Michele et al. [13] used a simplified fitting approach to fit the parameters of an electrical equivalent circuit model of a large prismatic Li-ion cell for charge/discharge behaviors. The thermal behavior was modelled using a lumped parameters approach with an estimation of core and skin temperatures. Surya, S. et al. [14] used first order and second order heat resistor–capacitor-based thermal models of lithium-ion batteries for core and surface temperature estimation. Jiayong et al. [15] fitted resistance and capacitance parameters of a 2-RC equivalent circuit model using the pulse discharge test results obtained at different ambient temperatures. With the help of the electrical–thermal coupling model, they quantitively assessed the impact of ambient temperature and discharge rates on polarization and heat generation characteristics.
The major application of the equivalent circuit model with the RC parameters is to estimate the battery state of charge and this requires prior knowledge of the relationship between the open circuit voltage and the SOC. The OCV at the battery equilibrium state (at the fully charged condition) represents the SOC and has a non-linear relationship [16]. The OCV is defined as the potential difference between positive and negative electrodes when the load current on the battery is zero with the internal electrochemical reactions in equilibrium. The battery OCV–SOC curve is influenced by the cell temperature; generally, the OCV decreases with an increase in cell temperature [3].
In the current work, a single RC network equivalent circuit model was developed with the faster instantaneous effects lumped into R0 and the slower diffusion effects are lumped into R1 and C1. The developed simple and faster analytical first-order RC model can be used for onboard control and thermal management of the battery pack of an electric vehicle. The proposed model with fewer parameters is expected to meet the demands of faster execution of real-time onboard control algorithms. In this work, using galvanostatic discharge test data obtained at different discharge C-rates (1C-rate charge/discharge means a battery is fully charged/discharged in 1 h. For example, a fully charged 10 Ah battery will provide 10A current for 1 h.) and ambient temperatures, a physics-based coupled electrochemical–thermal model was calibrated and validated [17]. Using the validated electrochemical model, virtual HPPC tests were run for different charge/discharge currents and ambient temperature conditions. From the virtual HPPC test results, the instantaneous and diffusion voltage response of the cell is extracted, and the RC parameters were calculated for a 1RC pair equivalent electrical circuit model (ECM). Then, a simplified analytical solution to the ECM was derived with the SOC and temperature-dependent RC parameters to estimate the voltage and thermal characteristics of a cell at different operating conditions. The developed thermal solution includes both reversible and irreversible components of battery heat generation during charging/discharging conditions. The voltage and temperature predicted by the proposed analytical model are in good agreement with the results of the physics-based coupled electrochemical model and test data. The developed ECM model can be used for onboard BMS applications since it is computationally efficient than the electrochemical model. It can also be used for developing the system level models for battery electric vehicles.
The paper is structured as follows, following the introduction provided in Section 1, Section 2 discusses test data and the experimental details that we obtained from the open source. The coupled thermal–electrochemical model development and the model validation are detailed in Section 3. The development of a simplified analytical model, which is the major focus of the current work, is explained in Section 4. Section 5 discusses the voltage and temperature results obtained using the proposed analytical model. Concluding remarks are given in Section 6.

2. Experimental Data Source and Details

To build and calibrate the physics-based pseudo-two-dimensional electrochemical model, the galvanostatic discharge tests were conducted by Edoardo Catenaro and Simona Onori [17] at different C-rates (0.05C, 1C, 2C, 3C and 5C) and operating temperatures (5 °C, 25 °C, and 35 °C) on the cylindrical cell (LGM50 21700). In their tests, they used the Arbin system (Arbin Instruments LBT21024 and Arbin measurement system) to supply the different discharge currents (0.025, 5, 10, 15, and 25 A) to the cell and measured the voltage and surface temperature responses. The battery is fully charged using a constant current–constant voltage (CC-CV) protocol until the voltage (2.5 V) cutoff limit is reached. The type-T thermocouples (omega) are placed at the center location to measure the battery skin temperature. The ambient temperature is controlled by the user using the thermal chamber (IncuMax IC-500R thermal chamber). The current, voltage, and temperature are sampled at a frequency of 1 s using the control software (MITS Pro software and Data Watcher). The measured values of current, voltage, and temperature at different ambient temperatures and discharge currents were used to develop the physics-based electrochemical model.

3. Numerical Model

A validated numerical cell model can be used as a virtual test bench to evaluate the battery performance for conditions for which no test data are available. This section discusses the development of the numerical model. The governing equations and boundary conditions for both electrochemical and thermal models are discussed. The developed model is validated with the test results obtained from Section 2.

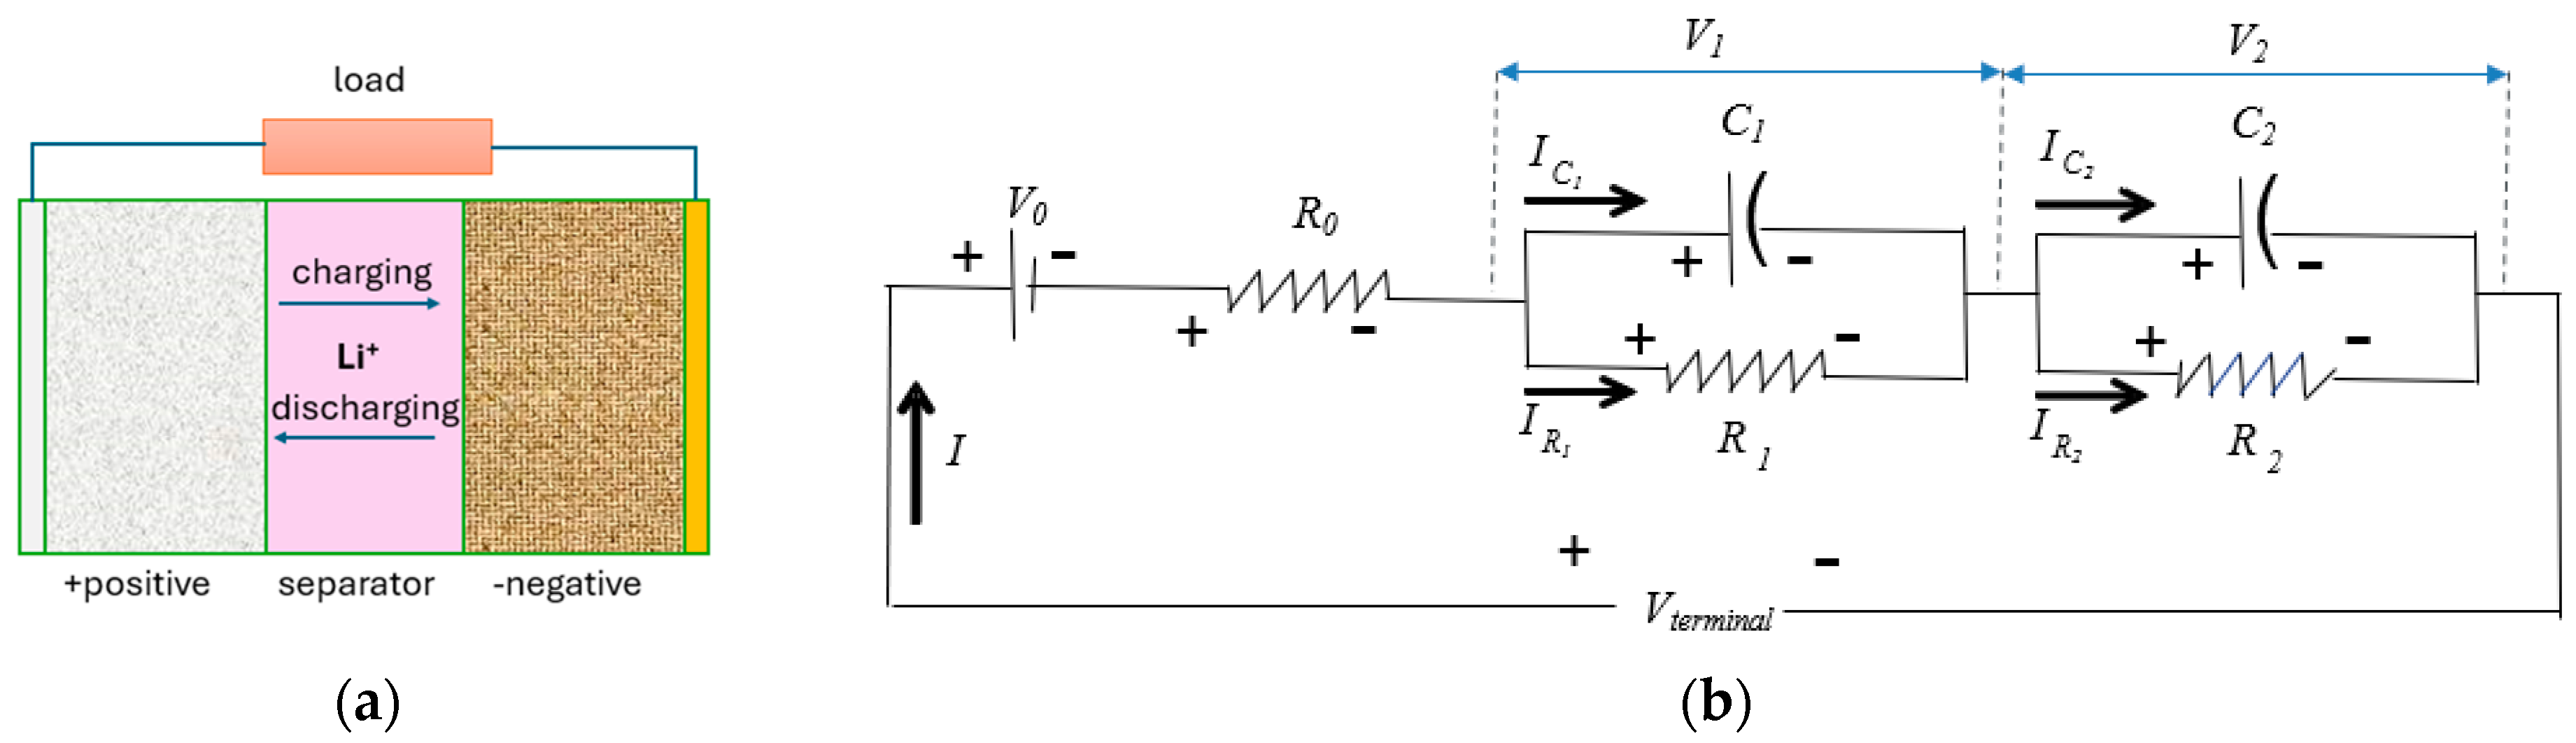
3.1. Coupled Thermal–Electrochemical Model Development

In the current paper, the LG Chem—INR21700-M50 cell with a NMC cathode is modelled. The physics-based models warrant properly estimated values of computational parameter values for predictions with reasonable accuracy [18]. For the current cell under study, for electrodes and electrolyte, the physical (overall cell/anode/cathode/separator/current-collector dimensions), chemical (composition of anode/cathode/electrolyte) and electrochemical (open circuit voltage, ionic/electronic conductivity, diffusivity, etc.) parameters are taken from the work of Chen et al. [19]. The pseudo-two-dimensional (P2D) model is used to develop the physics-based electrochemical model for the battery, and the details of the modelling technique can be found in the works of Doyle et al. [20] and Newman [21]. The model solves the lithium-ion concentration and electrical charge in the electrodes and electrolyte. The porous electrodes are assumed to be composed of spherical particles of radius r. Then the mass conservation of lithium in the electrode region, which is governed by Fick’s law of diffusion, can be written as the spherical coordinates as shown in Equation (1), where Ds is the diffusion coefficient of lithium in solid particles, and Cs is lithium concentration in solid particles. In all the following equations, subscript I = p or n represents positive and negative electrodes, respectively. Since the flux is zero at the center of the particle, the boundary condition at the center is defined by D s , i C s , i r | r = 0 = 0 , and that at the particle surface the lithium flux is equal to the rate of consumption/production of Li-ions due to the electrochemical reaction at the solid–liquid interface. The boundary condition is defined as D s , i C s , i r | r = R p = J i , where J i is the flux of Li ions away from electrodes.
C s , i t = D s , i 1 r 2 r r 2 C s , i r
The mass conservation for the Li ions in the electrolyte is given in Equation (2), where Deff is the effective diffusivity of the electrolyte, Ce is the concentration of Li ions in the electrolyte, and ai is electrode surface area per unit volume of electrode. As lithium ions do not leave or enter the cell, the boundary condition for the lithium-ion mass conservation equation is zero for mass flux at the cell boundaries [1].
ε i C e , i t = D e f f , i 2 C e , i x 2 + 1 t + 0 a i J i F
Electrode charge conservation is governed by Ohm’s law as shown in Equation (3), where φs represents the electrode potential, and σs is the conductivity of the electrode. At the interface of the current collector and positive/negative electrodes, the charge flux is equal to the applied current density to the cell, and the charge flux is zero at the interface of both the electrodes/separator. Equation (4) represents the electrolyte charge conservation, where φe represents the electrolyte potential, and σe is the effective conductivity of the electrolyte region. The charge flux is zero in the liquid phase at cell boundaries.
x σ s , i ϕ s , i x = J i
x ε i σ e , i ϕ e , i x 2 1 t + 0 R T F l o g C e , i x = J i
The charge and mass conservation laws are coupled together with the intercalation reaction model using the Butler–Volmer equation as shown in Equation (5), where Ki is the intercalation reaction rate constant, and ƞi is the overpotential of the intercalation reaction.
J i = k i C s , i , m a x C s , i , s u r f 0.5 C s , i , s u r f 0.5 c i 0.5 e x p 0.5 F R T η i e x p 0.5 F R T η i
The thermal energy conservation equation for lumped battery heat generation is shown in Equation (6) [1]. The first term on the right corresponds to irreversible losses, which result in exothermic heat generation during cell charging or discharging. The second term corresponds to the reversible losses and is recovered in a complete charge–discharge cycle. The last term corresponds to the convection heat loss to the ambient air from the cell.
ρ C p T t = I V O C V t + I T d V O C d T h A T T a m b

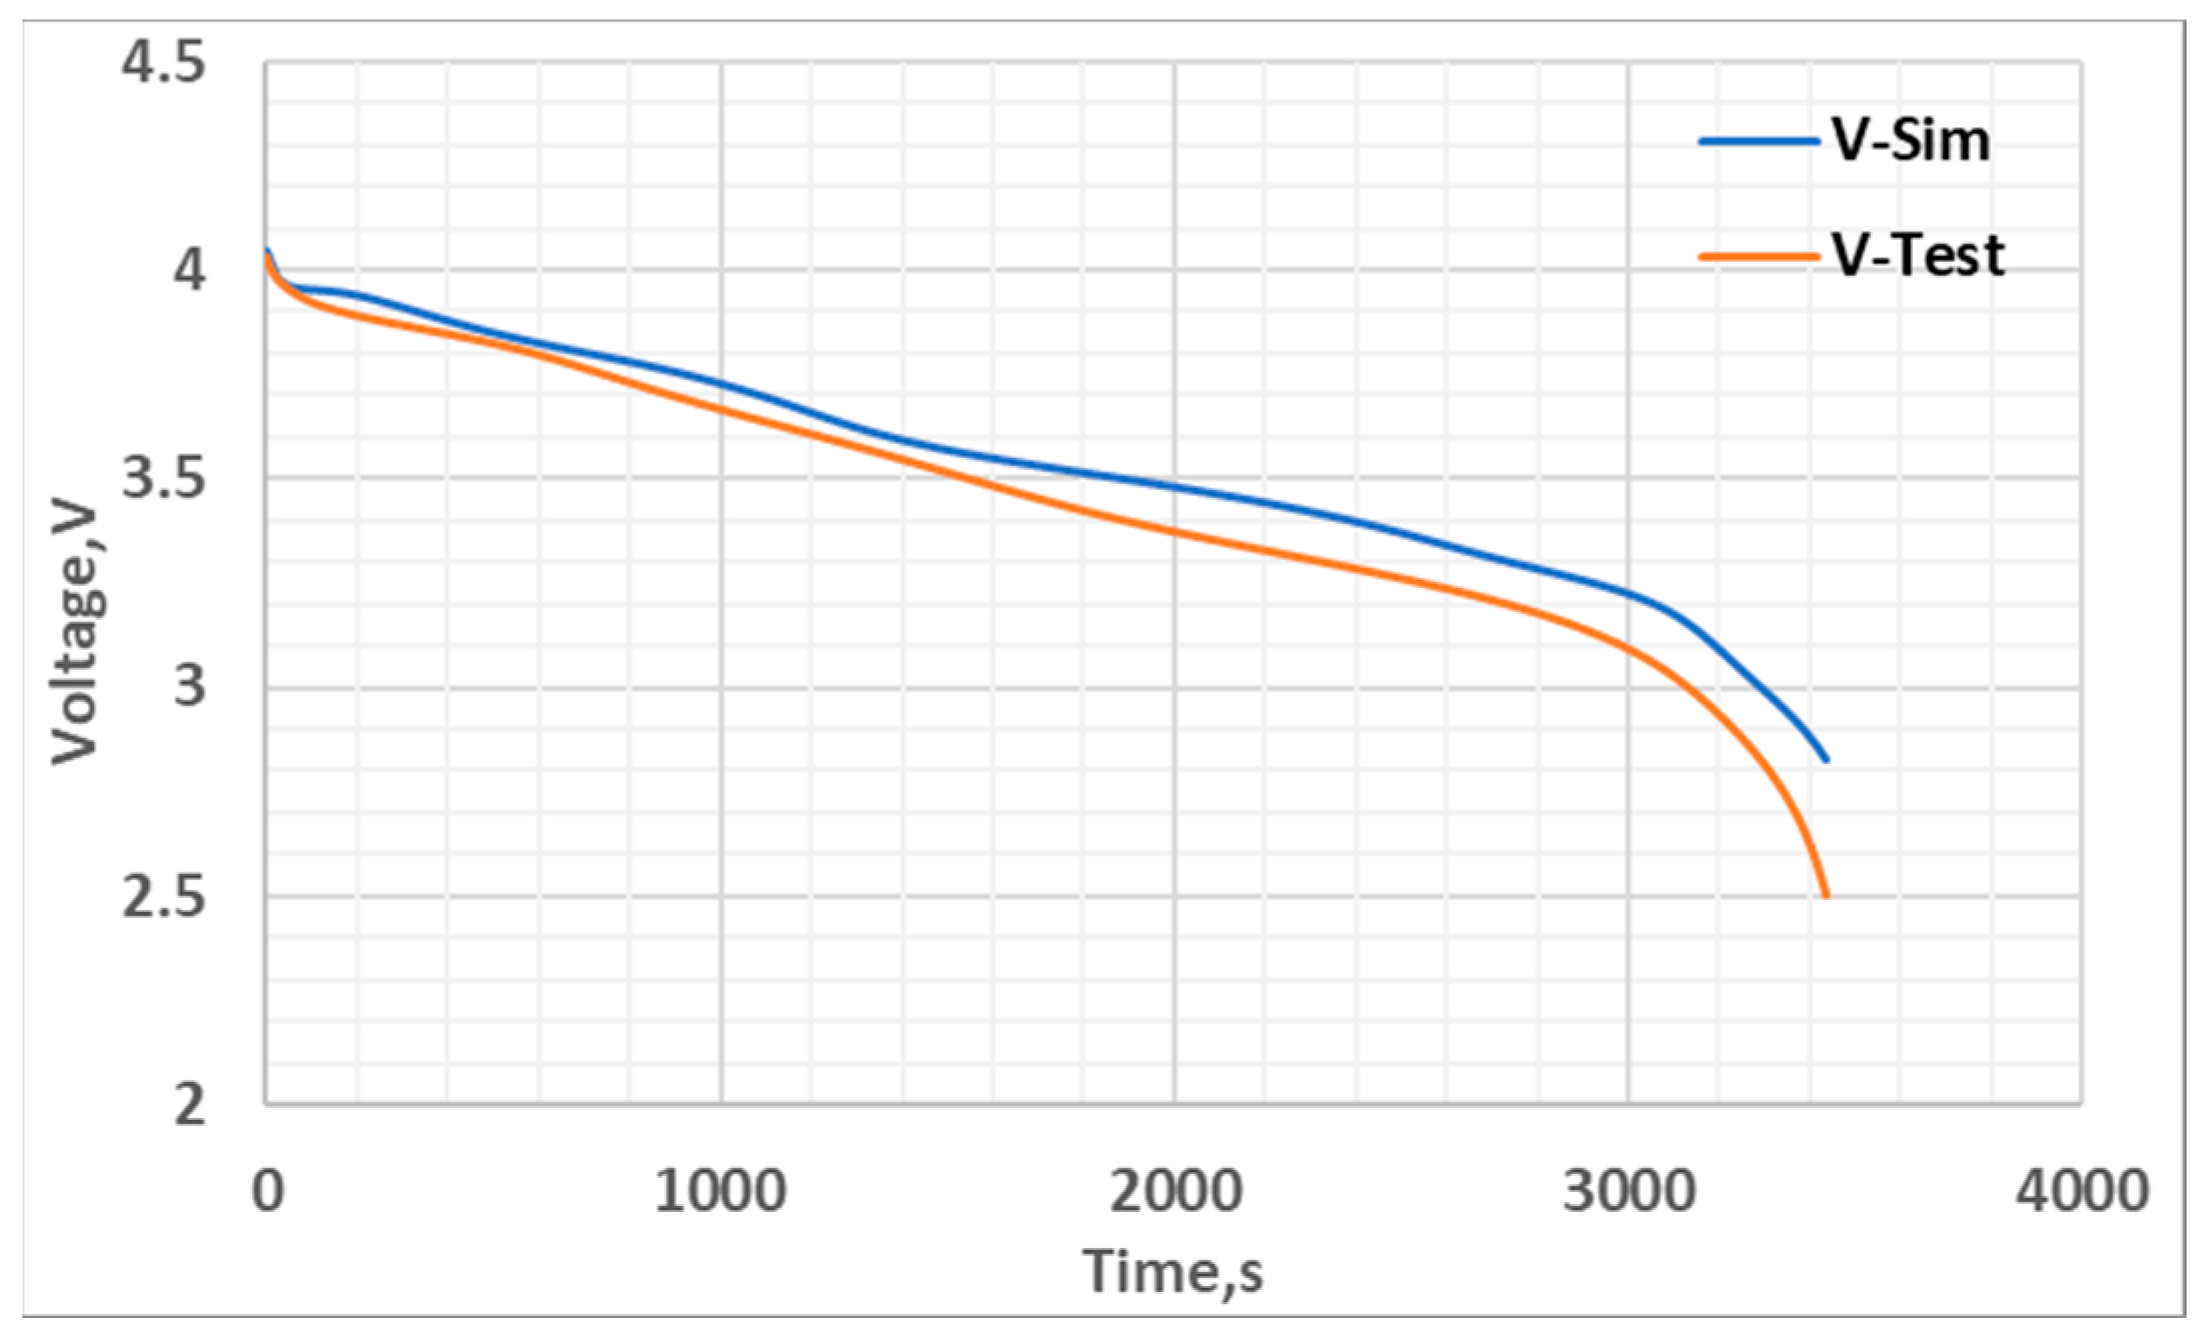
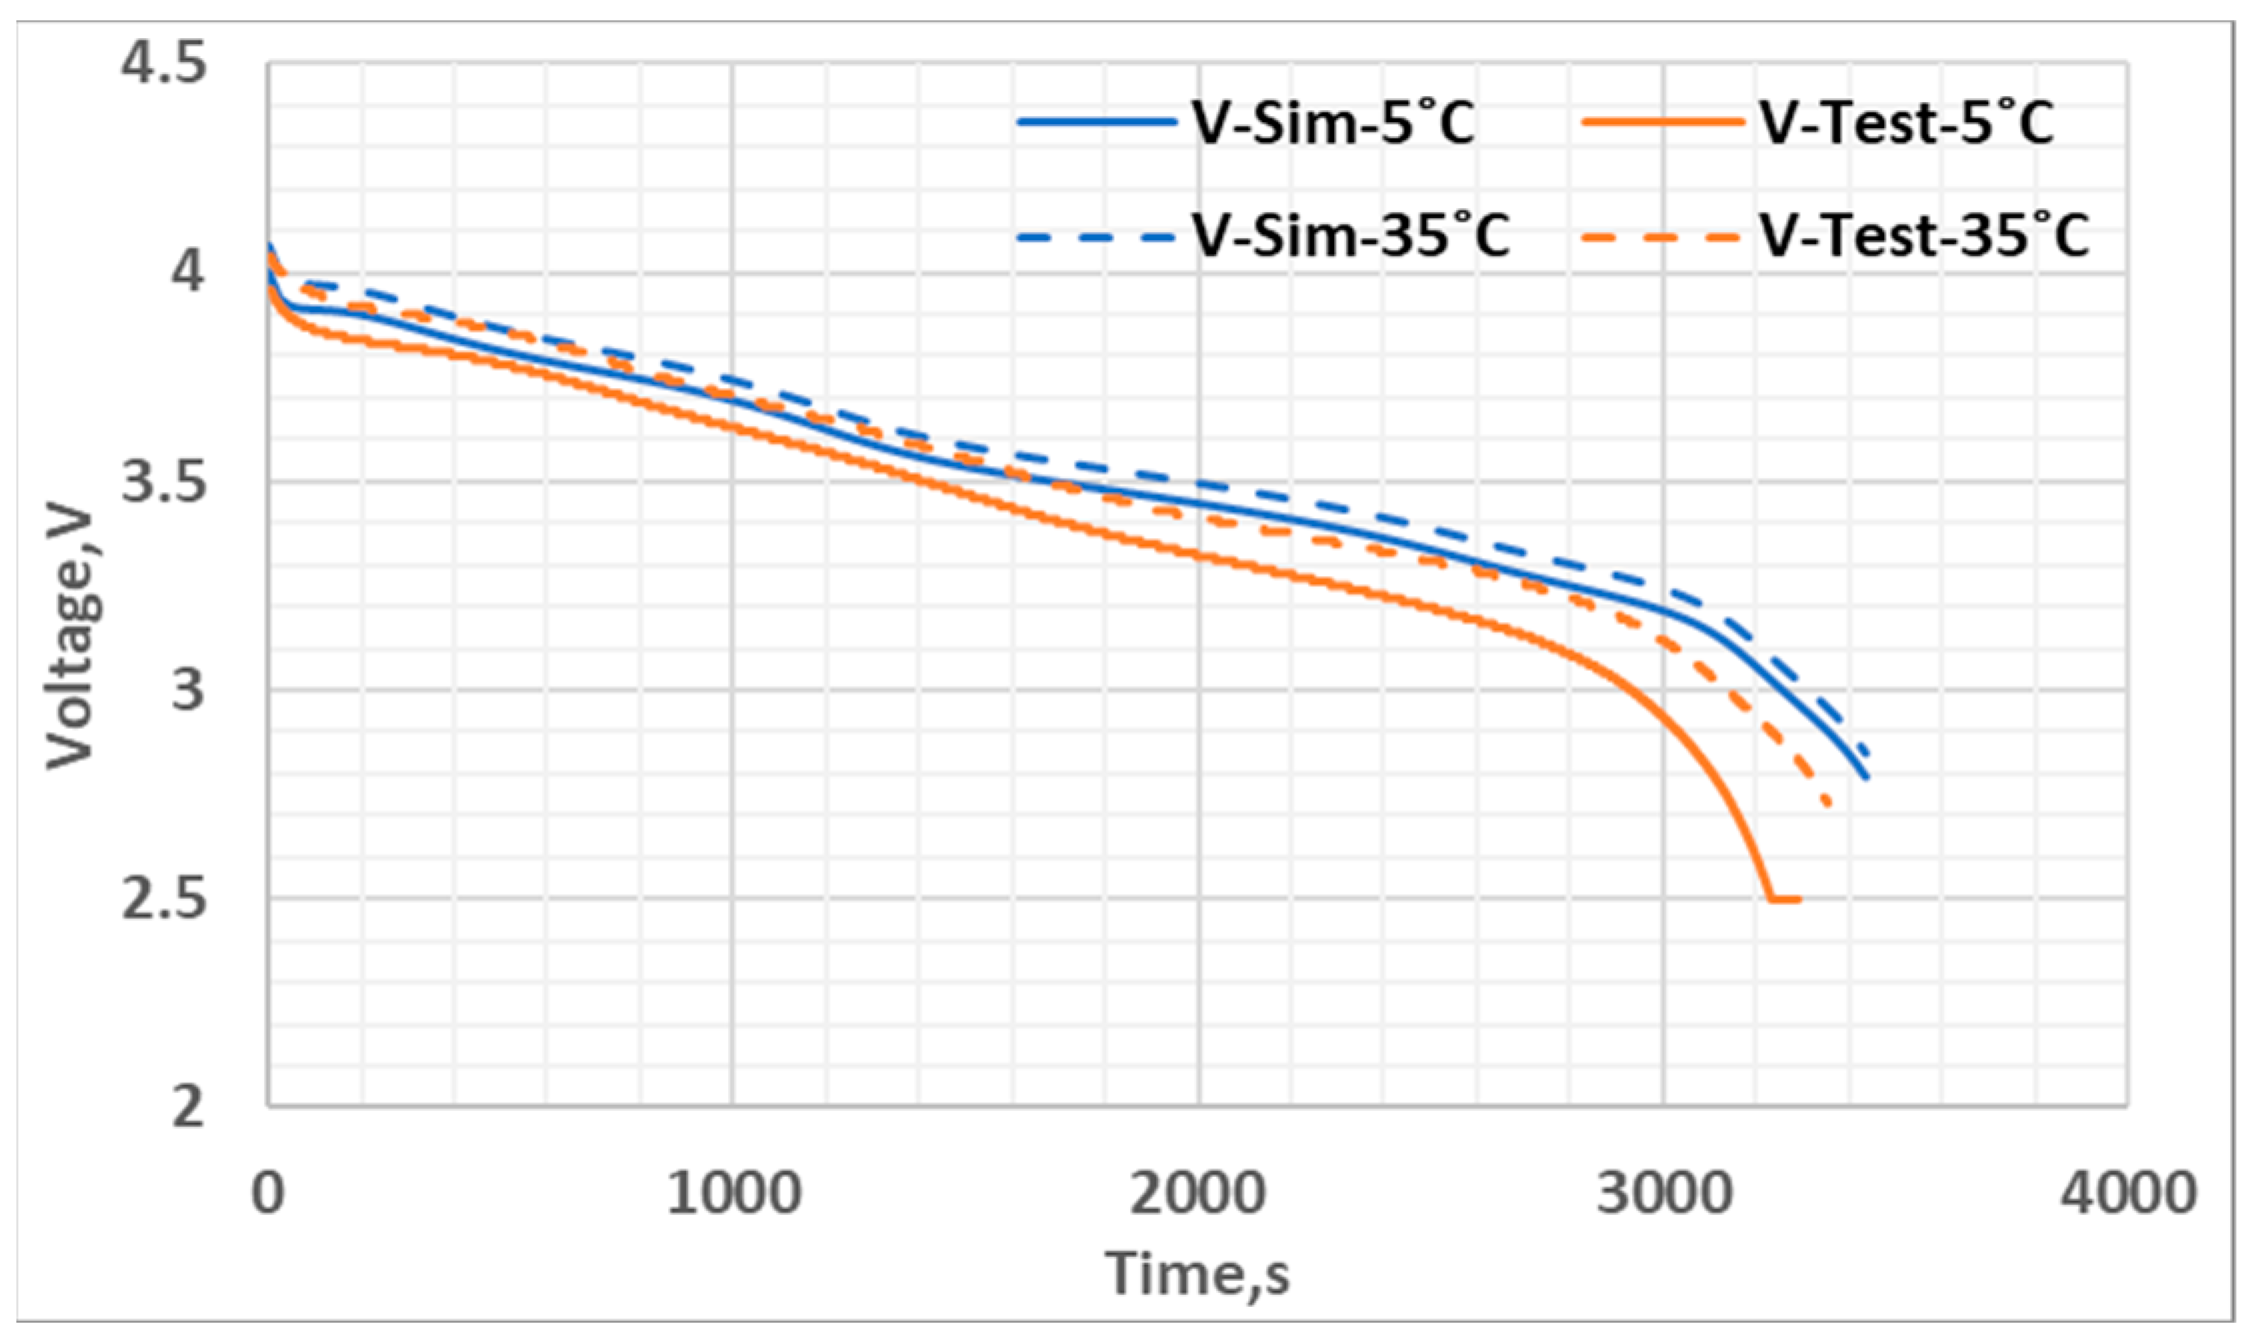
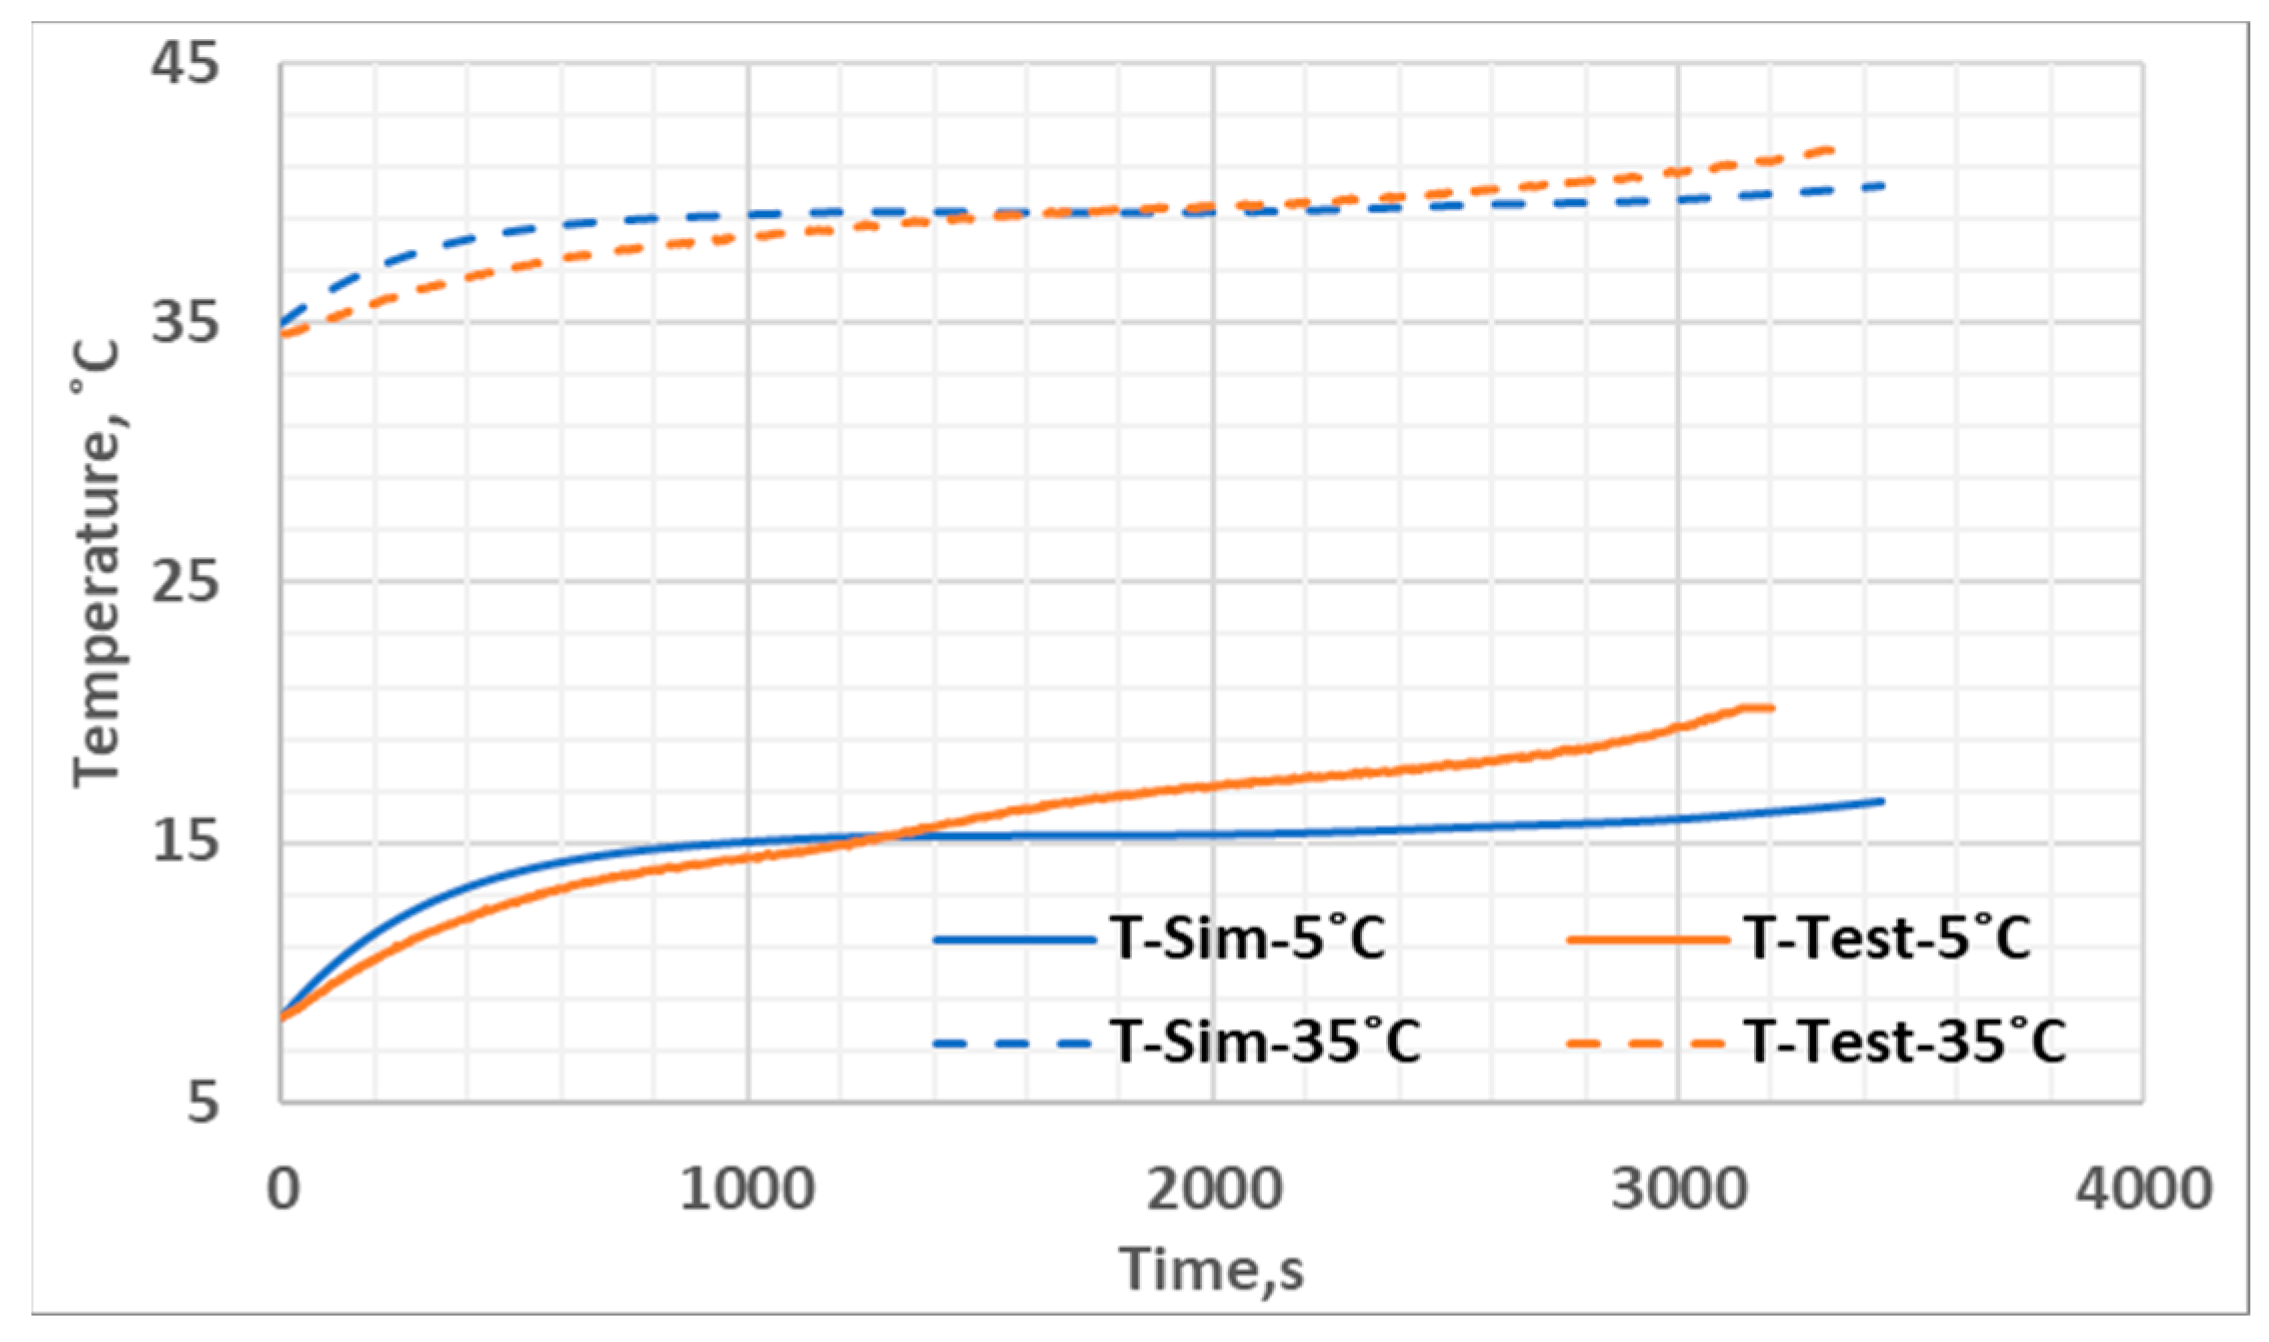
3.2. Electrochemical Model Validation

The open-source battery simulation package PyBaMM 24.1 is used to solve the P2D model governing equations detailed in Section 3. PYBaMM is a multiphysics battery modeling software package developed with the objective to accelerate battery research [22]. Once calibrated and validated with test data, this physics-based model can act as a virtual test bench to simulate multiple operating conditions for the HPPC protocol to develop equivalent circuit models. The physical, chemical, and electrochemical properties of the model were obtained from the work of Chen et al. [19]. The Doyle–Fuller–Newmann (DFN) modeling approach was used to solve the electrochemical model. The governing equations described in Section 3 are discretized in space, using a finite volume discretization approach. The discretization was done on electrodes, the separator, and particles. This gives a system of differential algebraic equations that are solved using the “CASADI” solver. The parametrization work by Chen et al. [19] experimentally determined the active material loading and electrode material composition for the cell under study. The areal capacity (mAh/cm2) of the electrode is calculated by multiplying the theoretical capacity of the electrodes with loading (g/cm2) as given below:
Capacity (mAh/g) = nF/(3600 × Molecular weight of cathode or anode) × loading
where n is number of electrons exchanged, and F is Faraday’s constant (F).
In the PYBaMM setup, the loading and capacity of the electrodes are calculated from the active solid fraction, electrolyte fraction, and electrode thickness. For the LGM50, the parameters are as given in Table 1. The simulation experienced convergence difficulty at a 3C-rate (i.e., 15 A discharge current). The solver tolerance values were relaxed to achieve the solution stability. However, the convergence issue still persisted, and the Bruggeman exponent (which quantifies the tortuosity of the cathode, separator, and anode) was reduced from the default value of 1.5. This helped solver stabilization at very low electrolyte levels. The modified values are included in Table 1. To calibrate and validate the coupled thermal–electrochemical model, the voltage and temperature behavior of the cell obtained from the tests conducted by Edoardo et al [17] were used. First, the predicted voltage profile was compared against the measured values for different C-rates. For the thermal model, a “lumped” approach was used, and the cell average temperature was fit by varying the heat transfer coefficient of the cell to the ambient condition and contact resistance. The thermal parameters are listed in Table 2. In the P2D approach, the lumped thermal model predicts the overall average temperature of the cell considering the reversible, irreversible, and ohmic losses. In the test, skin temperature in the middle of the cell was measured. Typically, the core temperature of the cylindrical cell is higher than the skin temperature. During thermal model calibration with 1C-rate test data, the model parameters are fit to slightly overpredict the temperature reflecting the real average temperature of the cell, which is higher than the skin temperature. When the thermal model was applied to other C-rates and ambient temperatures, the predicted temperature was higher than the test temperature at the beginning of test. Figure 2 and Figure 3 compare the simulation predicted voltage and cell average temperature with the test data; the results match well with an RMS error of 0.1 V and 1.28 °C and maximum error of 0.33 V and 2.24 °C, respectively. The same calibrated model was further run for two different discharge currents (10 A and 15 A) at an ambient temperature of 25 °C. Figure 4 and Figure 5 compare the simulation with test data for voltage and average cell temperatures. The electrochemical model predictions agree with tests with an RMSE of 0.13 V and 0.16 V for voltage and 1.7 °C and 2.57 °C for temperature, respectively, for 10 and 15 A discharge currents. The same model was also run for two different ambient temperatures (5 °C and 35 °C) at a 5 A discharge current. Figure 6 and Figure 7 compare the predicted voltage and cell average temperatures with the test data. As it can be seen from the figures, the predictions match with the test with an RMS error of 0.29 V and 0.04 V for voltage and 4.72 °C and 2.42 °C for temperature at 5 and 35 °C ambient temperature conditions, respectively. During the discharge process, near the end of discharge curve, increased internal resistance and the concentration polarization cause the voltage to drop rapidly. Typically, the P2D model can predict this behavior well, and the model was fit for 1C-rate conditions. However, at higher C-rates, the capacity (Ah) predictions have some limitations due to low electrolyte concentrations, and it causes some discrepancies in the non-linear portion of the voltage curve. The observed error values for different conditions give the confidence to use the PyBaMM electrochemical model as a virtual test bench for the subsequent HPPC tests and RC parameter characterization.

4. Simplified Battery Analytical Model Development

The current work focuses on developing a faster and simpler analytical model from the first-order equivalent circuit model by effectively separating the rapid and slower dynamic characteristics of the battery and lumping them into the RC parameters. Typically, in a 2 RC pair ECM model, the variables R1 and C1 represent the electrochemical polarization resistance and capacitance, R2 and C2 represent the concentration polarization resistance and capacitance. In the proposed approach, both the effects are lumped into one set of RC parameters which are functions of SOC and temperature.

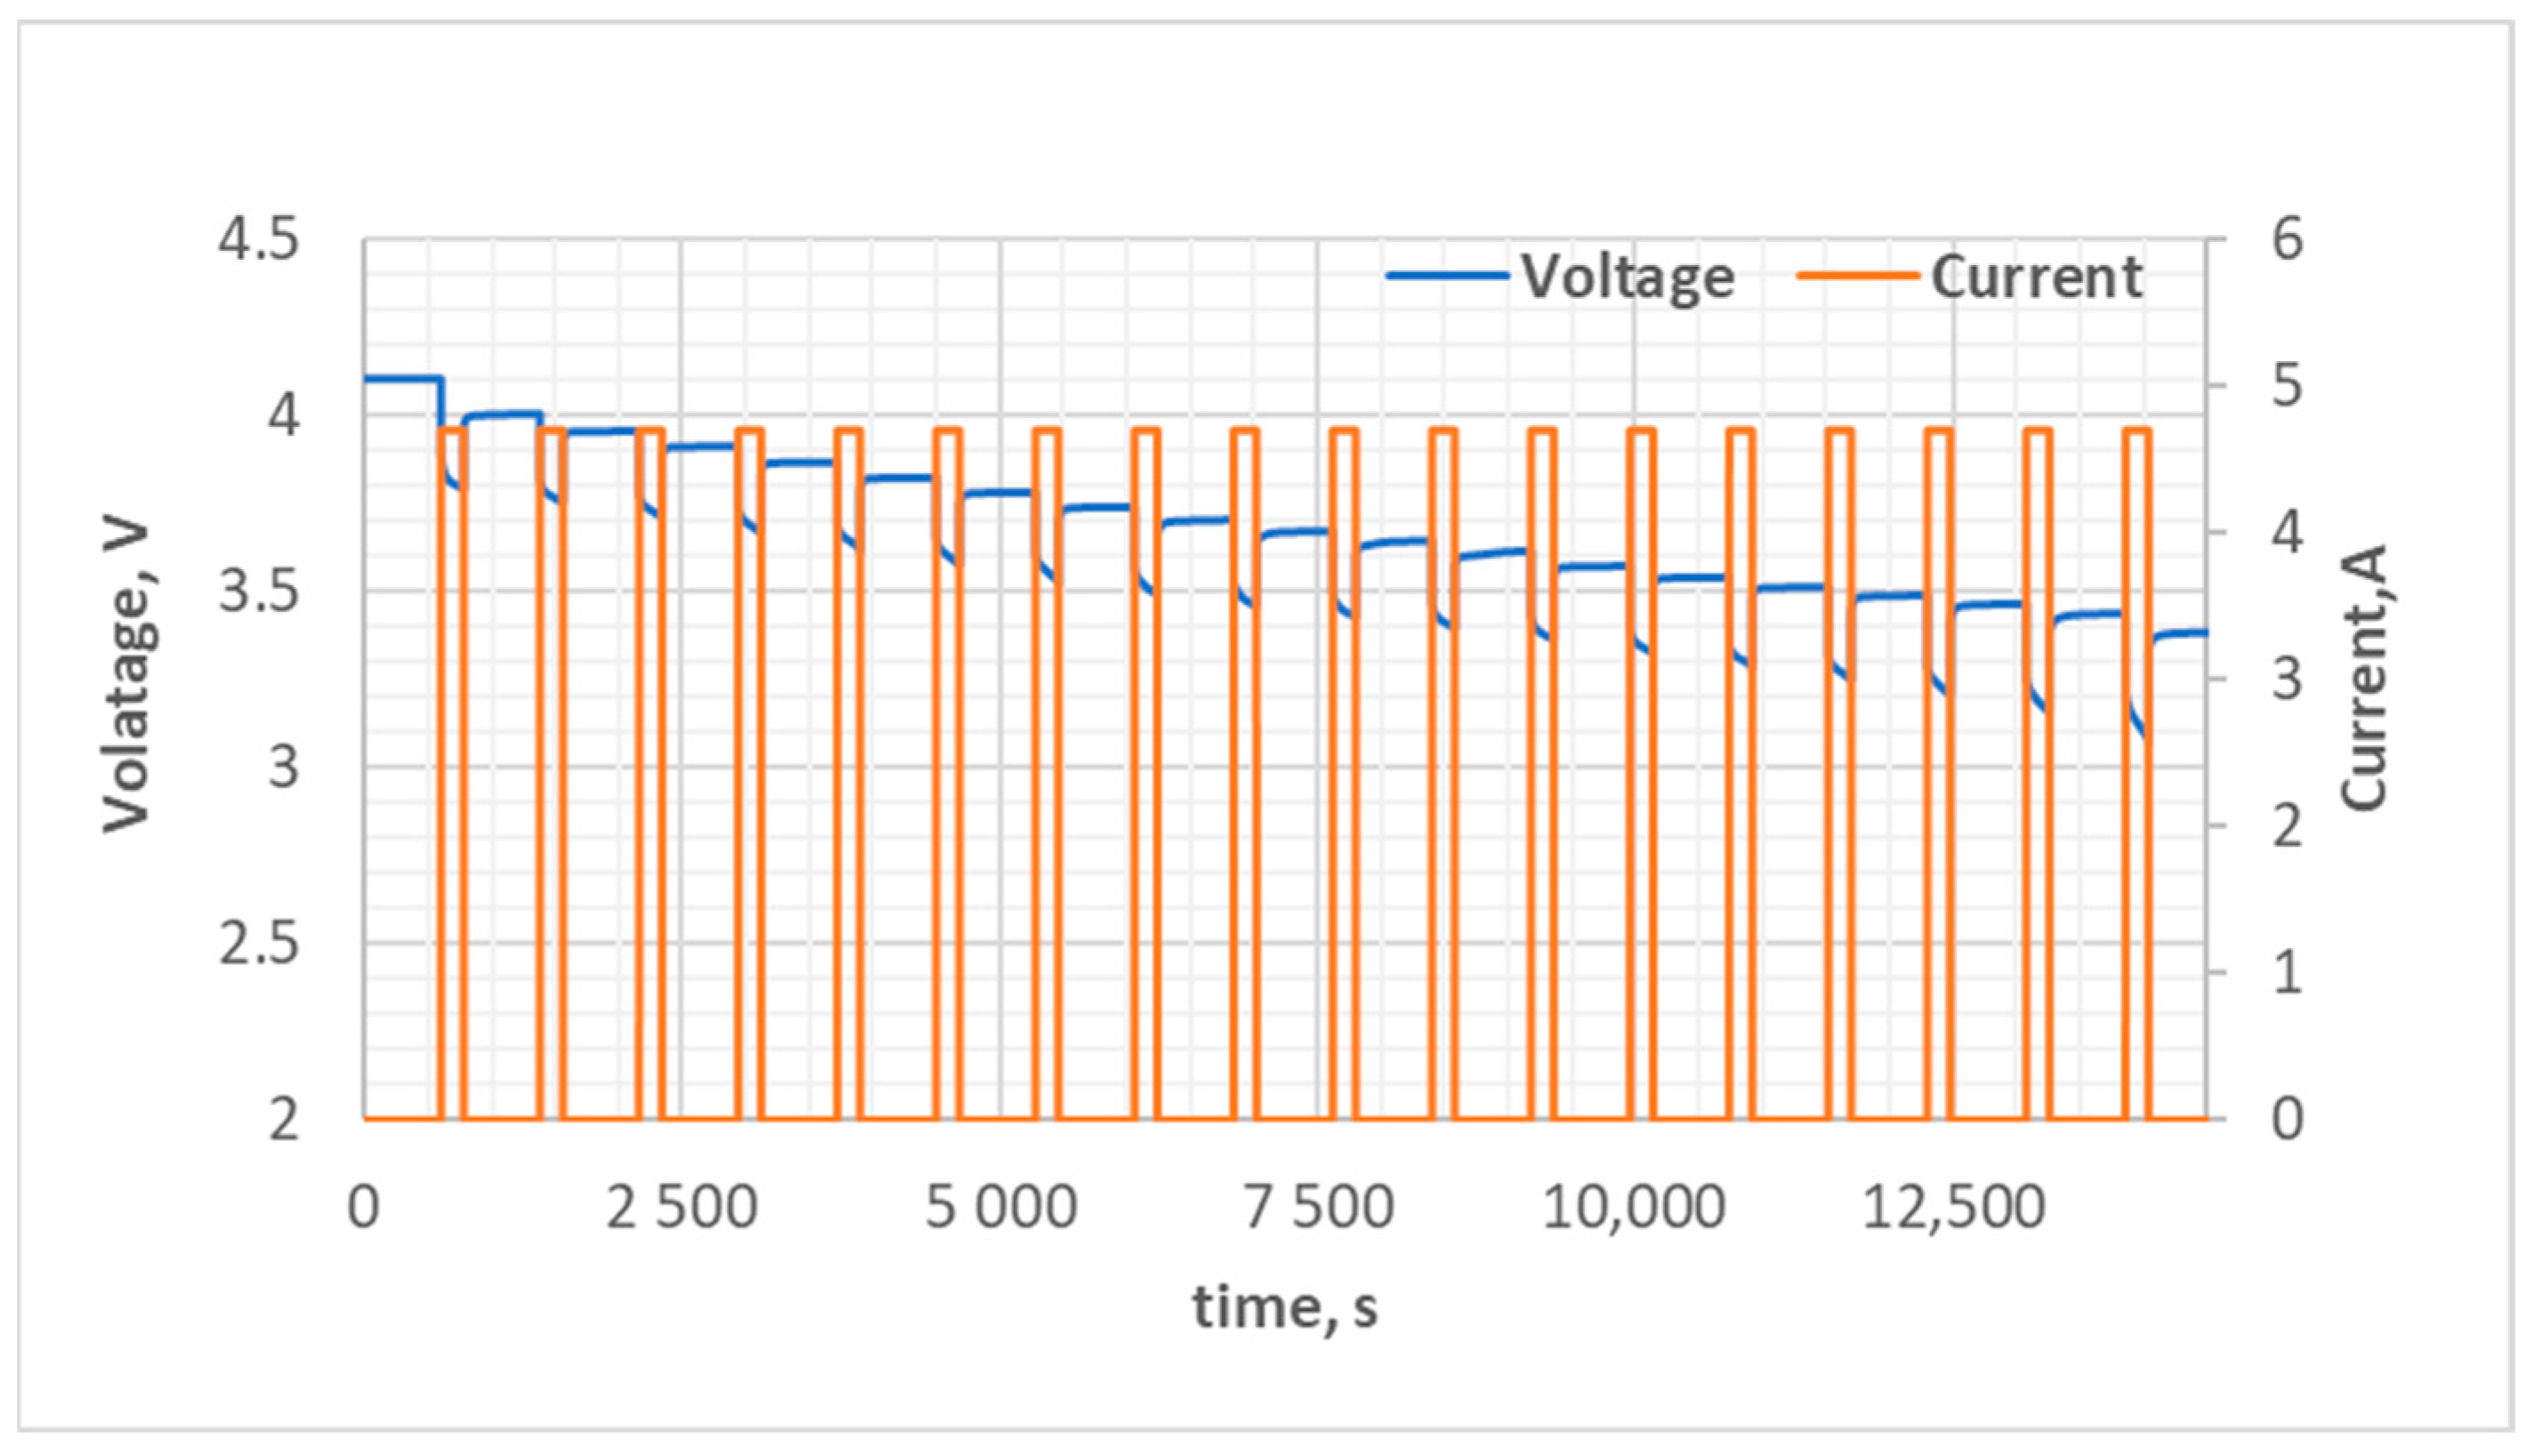
4.1. Electrical Equivalent Circuit Model Development and HPPC Testing

The first-order resistance–capacitance (RC) equivalent electric circuit model is given in Figure 8. Equations (7)–(12) show the derivation of the voltage characteristic across a single RC pair. The voltage across an RC pair is described by a first-order differential equation, the solution of which can be analytically determined using Equation (11). The terminal voltage for a 1 RC network model is computed using Equation (12).
Kirchoff’s current and voltage laws are applied as shown below in Equations (7)–(9) to obtain the voltage derivative (Equation (10)).
I = I R 1 + I C 1
I C 1 = d Q C d t
Q C = V 1 · C 1
d V 1 d t + V 1 R 1 C n = I C n
The solution to the above first-order linear differential equation is obtained using the integration factor method, and the solution is given in Equation (11).
V 1 = I R 1 1 e t R 1 C 1 + V 1 0 e t R 1 C 1
V t e r m i n a l = V o c v S O C + I R 0 + V 1
To determine the RC parameters of Equation (11), typically the hybrid pulse power characterization (HPPC) test results are used. The HPPC results comprises the dynamic performance of the cell in terms of voltage and current. HPPC test includes a series of charging or discharging constant current pulses at different SOC levels and repeated at different ambient temperatures. Then, the cell voltage response of the battery is used to characterize the RC parameters within the battery’s operating range. In the current work, instead of a physical HPPC test, a virtual HPPC test was run using the physics-based electrochemical model of the battery that was developed in Section 3. The HPPC constant current pulse discharge/charge tests were conducted at 10 °C, 25 °C, and 40 °C ambient temperatures. A constant current pulse of 4.85 A was applied for a duration of 180 s, and the subsequent relaxation was 600 s to allow the cell to attain equilibrium during both charging and discharging [10]. Figure 9 shows how the current and voltage vary during the discharge phase of a HPPC test.
To determine the R0, Rn, and Cn values for the n-RC pair model, the widely used approach is to arrange the measured transient terminal voltage in a state space construct form with a least square fitting algorithm [11]. In this work, the individual pulses at each SOC interval are studied separately to extract the parameter values. A single discharge pulse at 75% SOC and 25 °C ambient temperature is shown in Figure 10. Assuming the battery was at equilibrium at 600 s, a step change in discharge current caused an immediate drop in voltage representing ohmic resistance. Then, the drop is slow due to the slow dynamic effects. At 780 s, when the discharge current is stopped, the voltage responds with an immediate jump followed by a slow rise due to diffusional effects (slow dynamics). Eventually, the voltage reaches the OCV value at ~1380 s.

4.2. Identification of Parameters

The current section explains the identification of parameters OCV, R0, and time constant ζ1 (R1C1) for the simplified analytical model using the HPPC results obtained from the previous section. The proposed approach uses exponential and polynomial relationships to express the parameters as a function of the SOC and temperature. From the terminal voltage, an expression is developed for solving the temperature of the cell considering the reversible and irreversible heat loses. The steps are detailed below.

4.2.1. Identification of Open Circuit Voltage (OCV)

The OCV–SOC relationship was determined from the HPPC test relaxation voltage at the end of 600 s for each pulse and with initial SOC information specified. With reference to the works of Zhang et al. [16], we have applied an exponential function to express the relationship between open circuit voltage and SOC as shown in Equation (13).
V O C V = a 1 e b 1 S O C + a 2 e b 2 S O C + C · S O C 2
The coefficients a1, b1, a2, b2, and c1 are functions of temperature, and the SOC represents the state of charge. The parameters were fitted using the generalized reduced gradient (GRG) non-linear optimizer without constraints. The OCV values obtained from the physics-based electrochemical model were used as the reference, and the OCV fit is shown in Figure 11.

4.2.2. Identification of Ohmic Resistance R0

Ohmic resistance R0 is calculated from the immediate change in terminal voltage when the constant current is executed or stopped during pulse charge/discharge tests. The different factors contributing to the R0 are contact resistance, the ionic conductivity of the electrolyte solution, and overpotential at the electrode surface [23]. The immediate response in voltage is represented as IR0 as shown in Figure 10, and the value of R0 is calculated by dividing the quantity by the constant current (I). The calculation was repeated for all SOC and temperature conditions. R0 is a function of the SOC, and the values obtained at different temperatures are shown in Figure 12. R0 has a characteristic U shape against the SOC with higher R0 values at higher and lower SOC points. With respect to temperature, the value of R0 decreases with an increase in temperature as expected [3]. The R0 is expressed as a second-order polynomial with respect to SOC, and the effect of temperature is lumped into the coefficients. The R0 expression is as shown below in Equation (14), and the values of coefficients are given in Table 3.
R 0 = ( a 2 + b 2 T ) S O C 2 + ( a 1 + b 1 T ) S O C + ( a 0 + b 0 T )

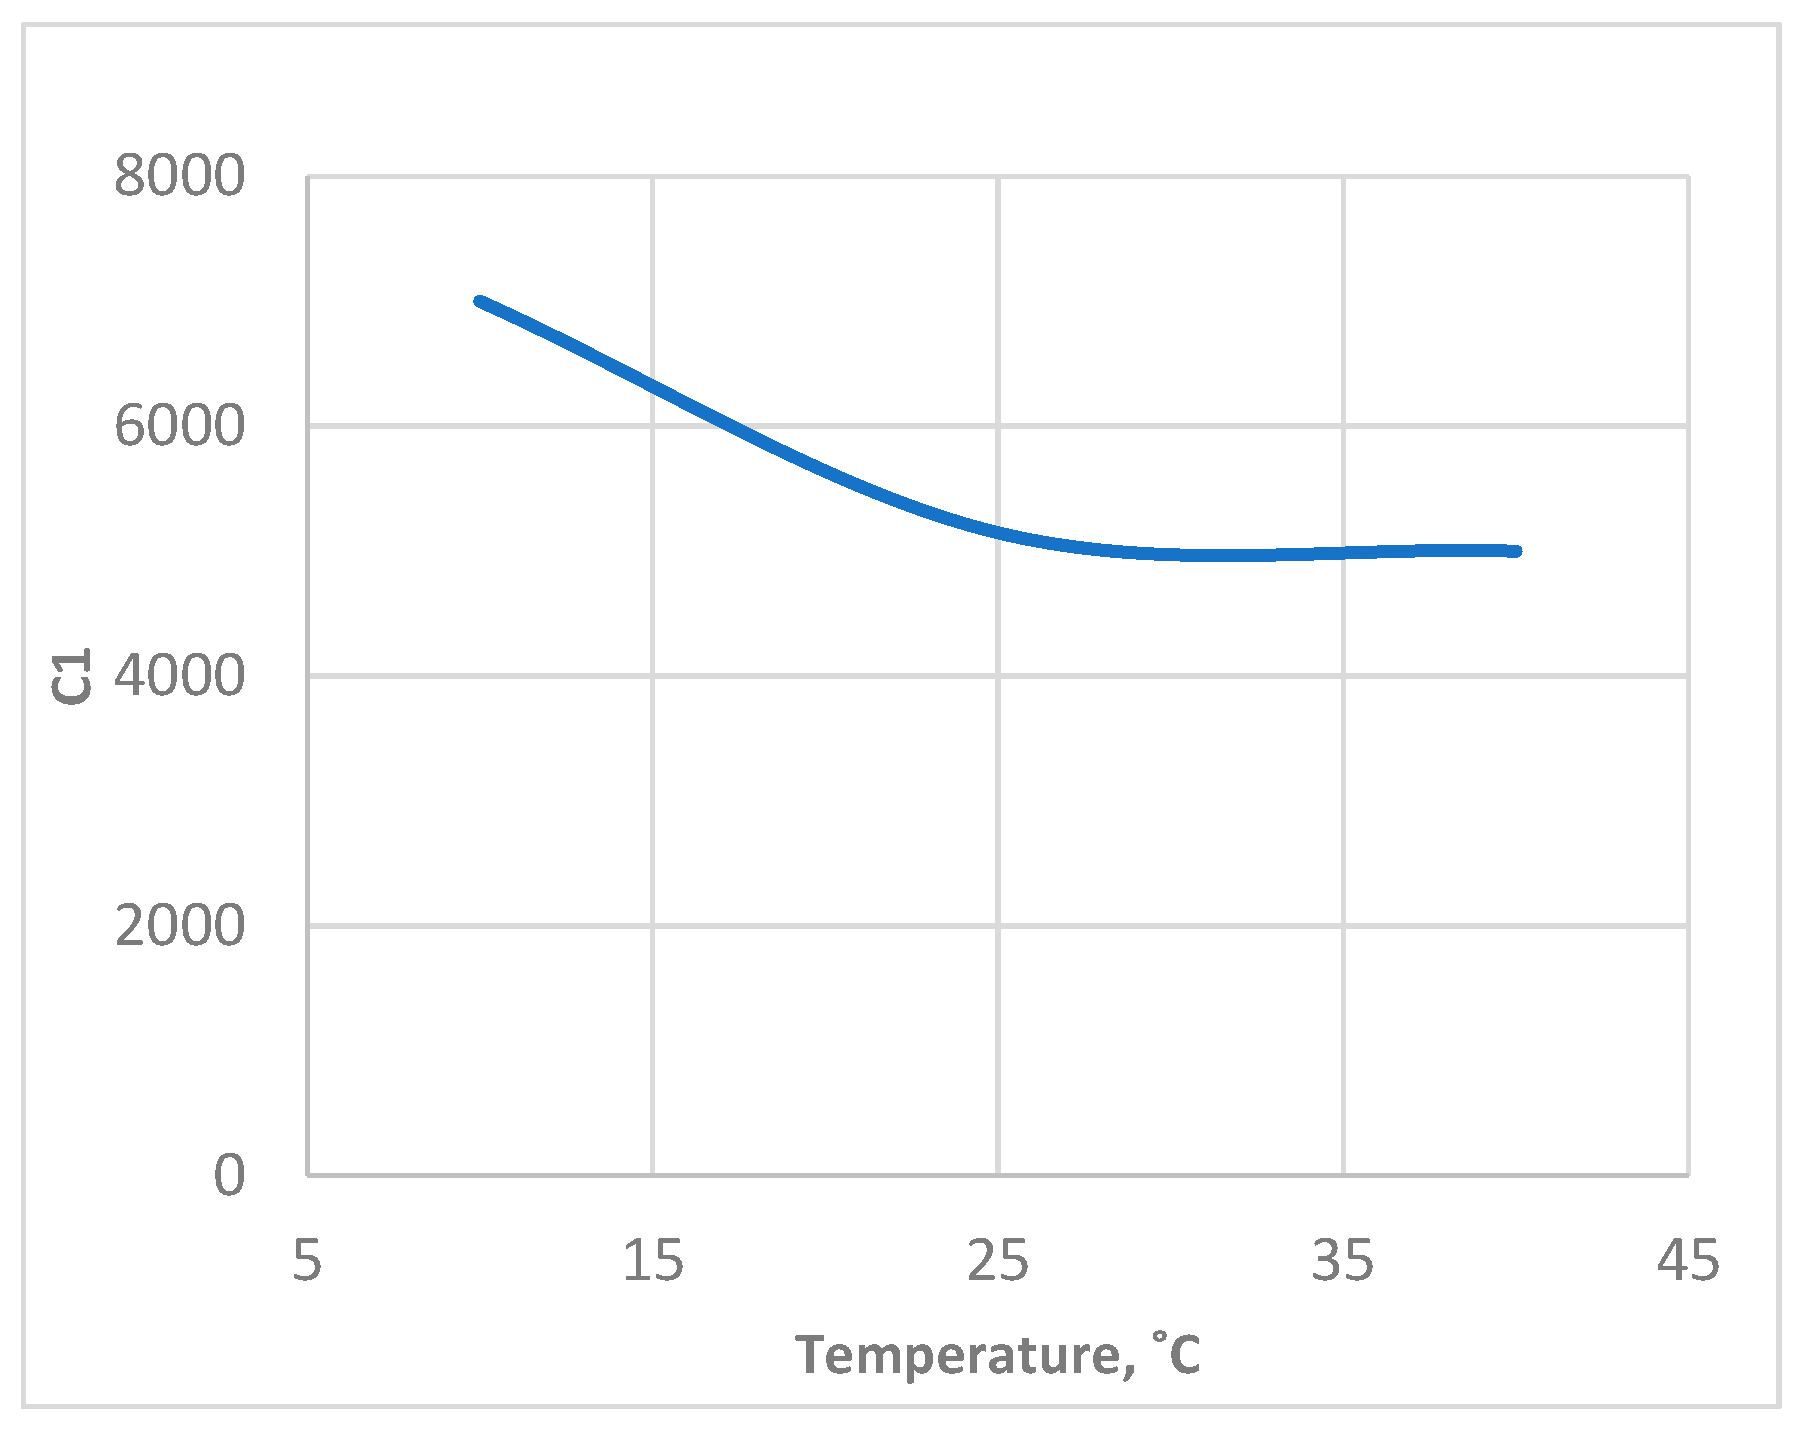
4.2.3. Identification of R1 and C1

The voltage information obtained during the cell relaxation period is used to calculate the values R1 and C1. Referring to Figure 10, the initial value of R1 was calculated from the quantity I(R0 + R1) for one SOC condition of voltage pulse response since R0 was already calculated. Then, using RC pair voltage Equation (12), the value of C1 was calculated with the help of a non-linear optimizer. The RC values were iteratively calculated until good convergence was achieved. We have repeated the calculation of R1 and C1 for all the pulses and at different ambient temperatures, and the trend was studied. As the RC parameters did not show much dependence on the SOC, R1 is assumed to be constant. In addition, C1 is specified as a function of temperature as given by Equation (16), and the profile is shown in Figure 13. The values obtained from the 2RC circuit model are combined into one set of RC parameters with the help of the optimizer.
R 1 = c o n s t
C 1 = a 2 T 2 + a 1 T + a 0
The analytical solution to calculate the cell terminal voltage using the above derived RC parameters is obtained by modifying Equation (12), as shown below.
V t = V 0 + I R 0 + I R 1 1 e t R 1 C 1 + V 1 0 e t R 1 C 1
The expressions and values of all the RC parameters derived in the previous section are given below in Table 3.

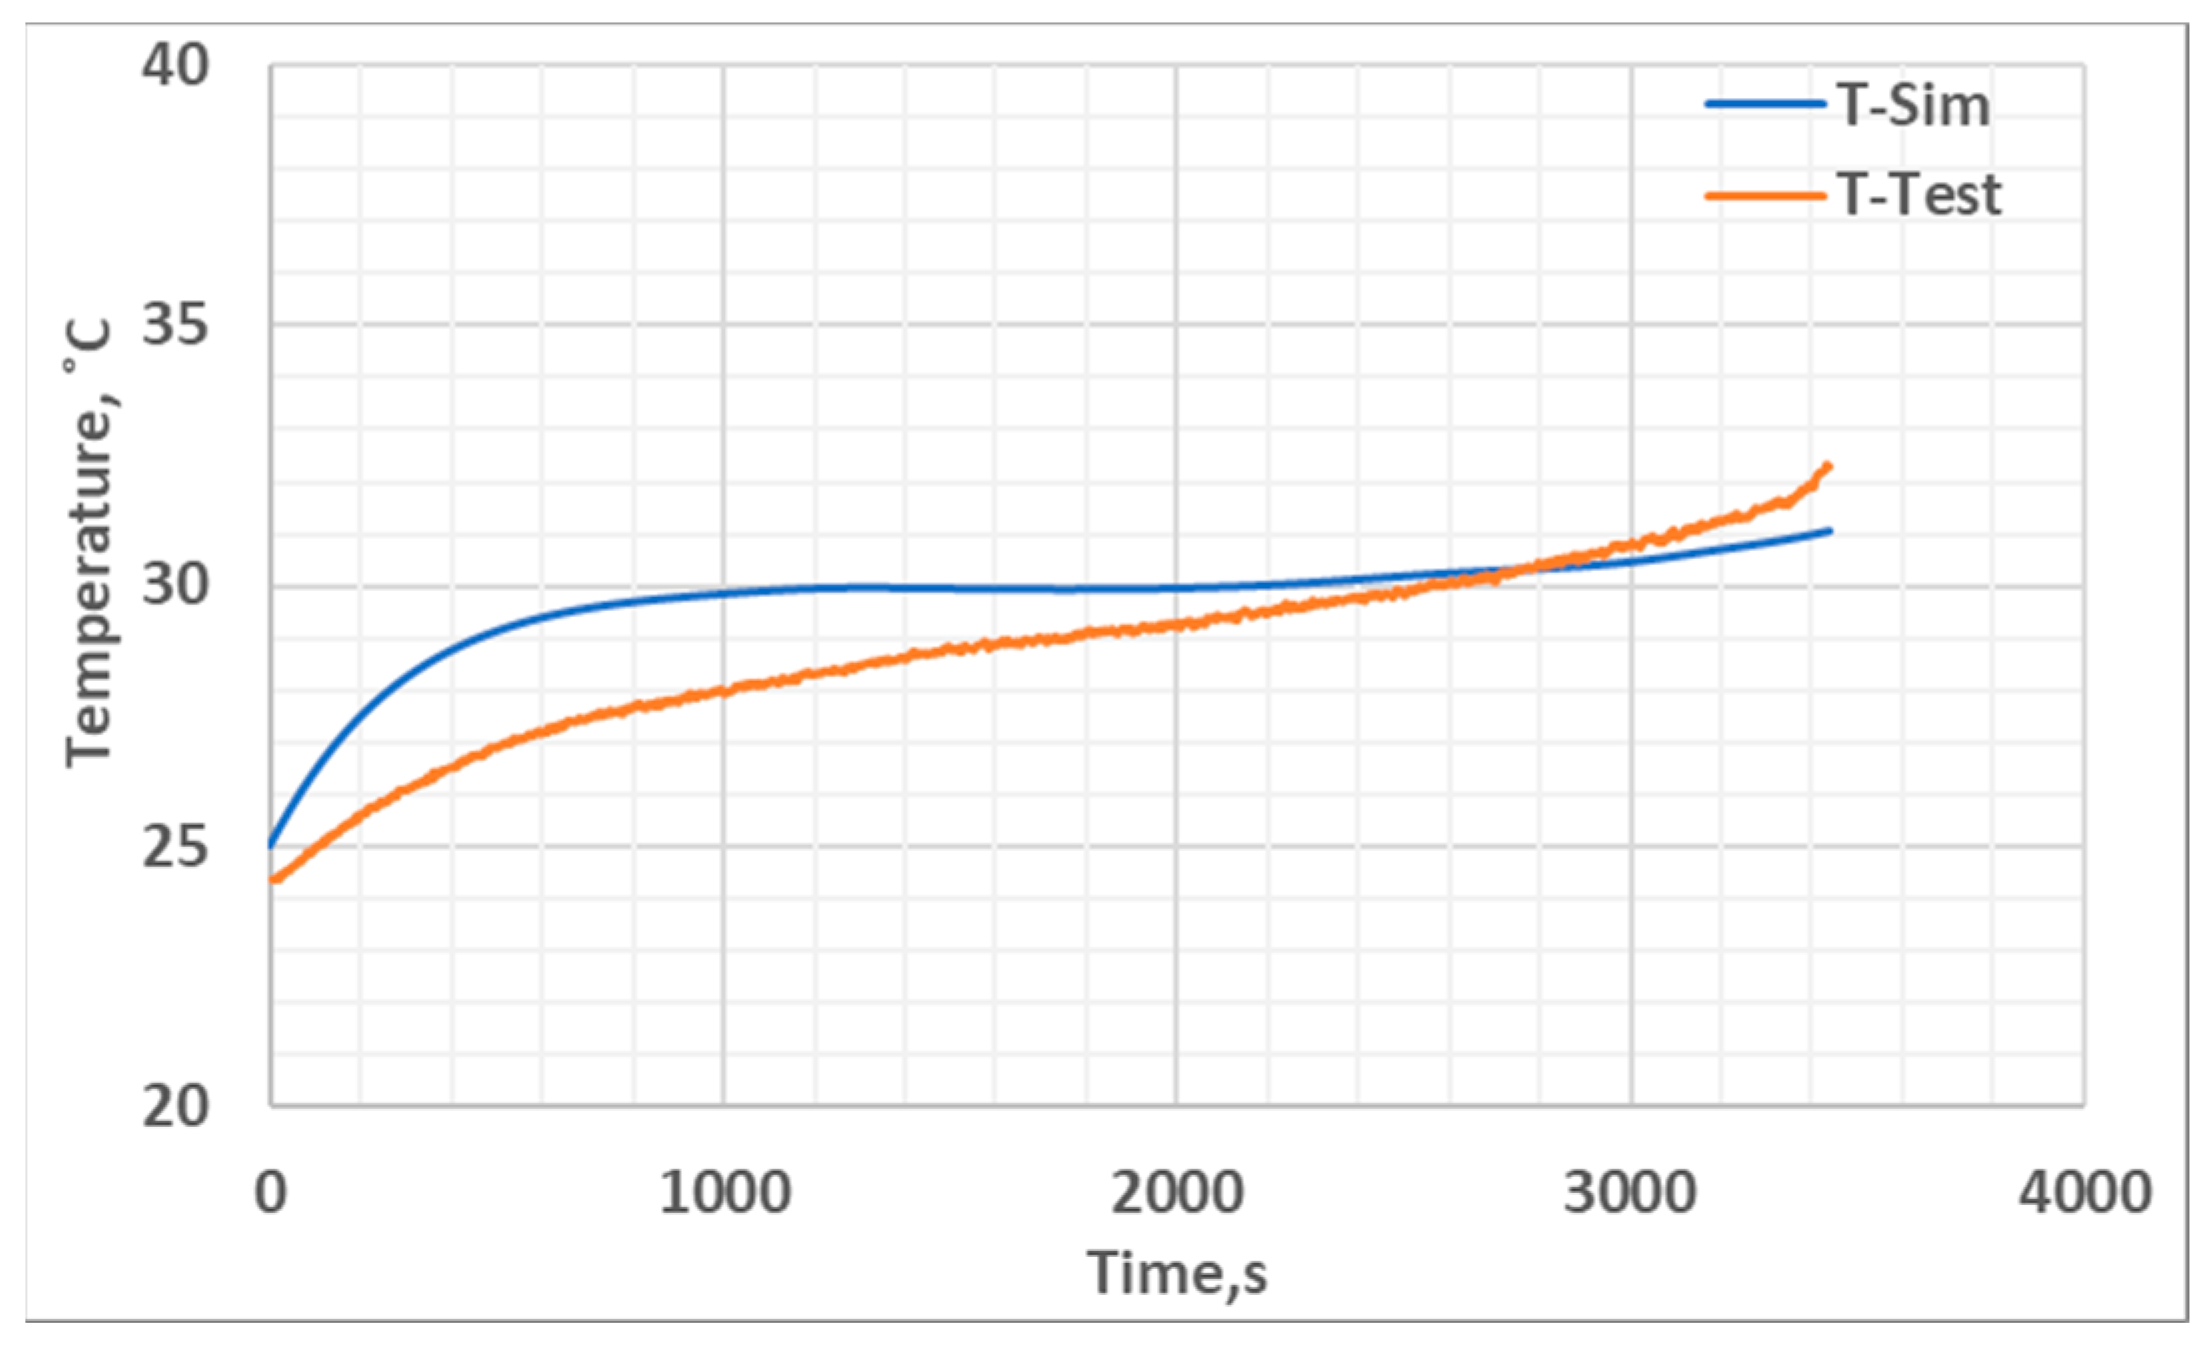
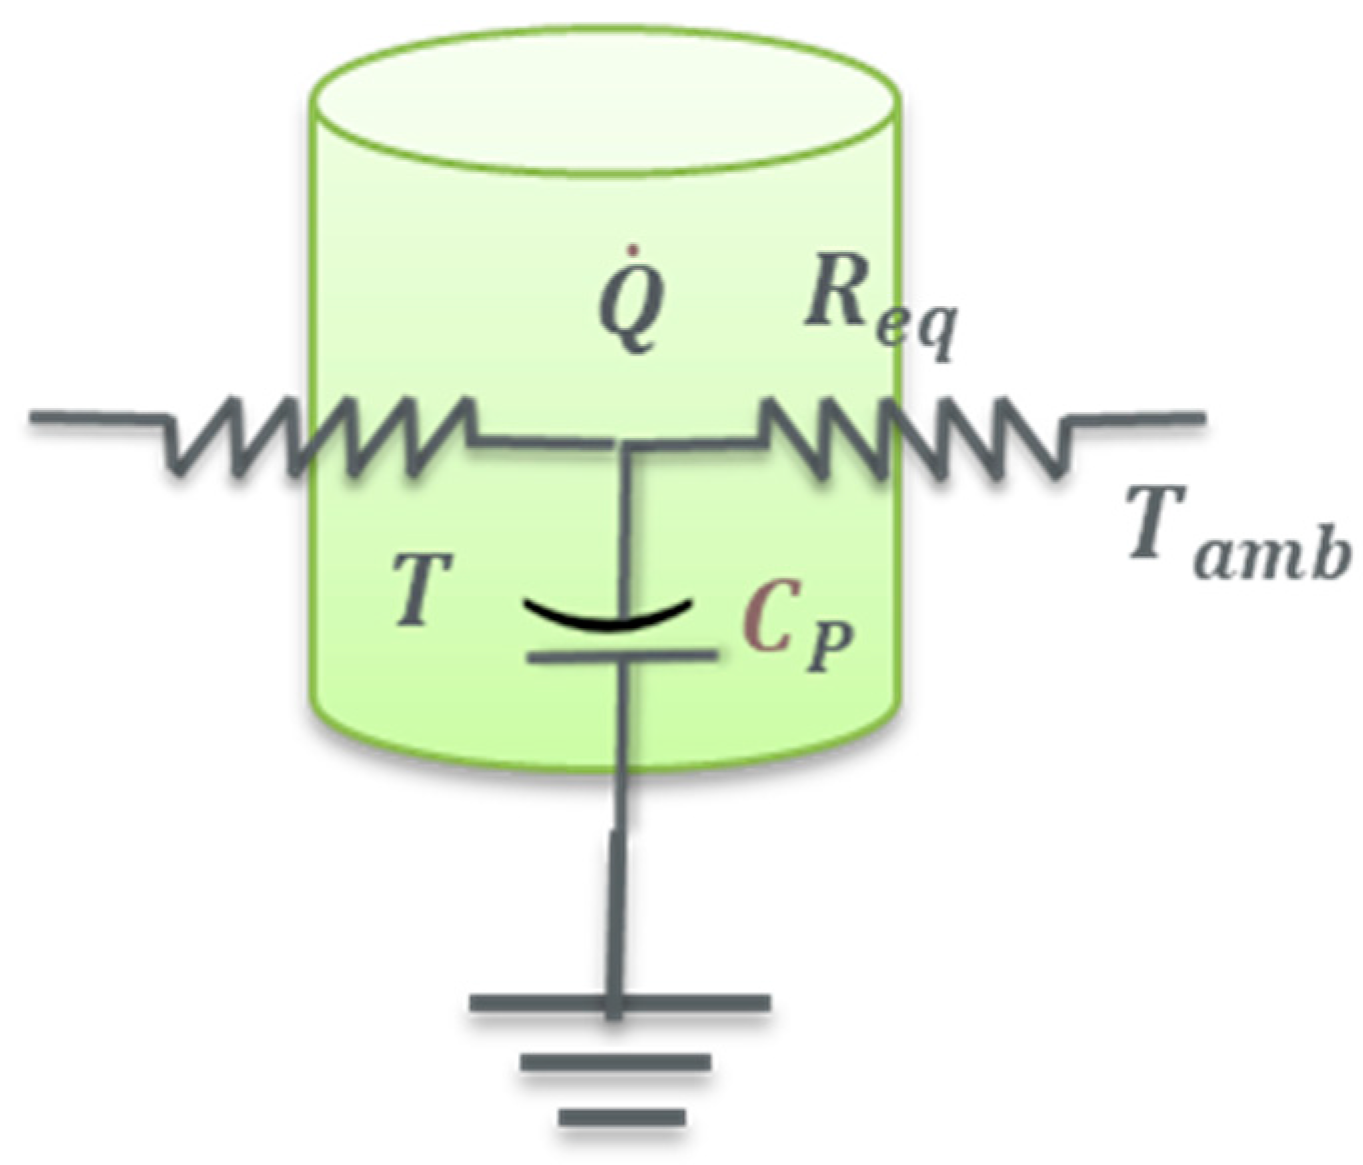
4.3. Thermal Model Development

The widely used heat generation equation for a lumped model based on Gibb’s free energy [1] is given below.
Q ˙ = I · V O C V V t + I · T · d V O C V d t
This equation represents the heat generation source terms of general energy as reported in Equation (6). The first term gives the irreversible heat loss, and the second term denotes the reversible heat loss. A lumped battery thermal system with ambient heat loss is represented in Figure 14. The energy conservation equation for the same is given below.
ρ C p T t = I · V O C V V t + I · T · d V O C V d t + h e q A ( T T a m b )
s T t = I · d V O C V d t + h e q A ρ C p · T + I · V O C V V t + h e q A T a m b ρ C p
The voltage derivative V ˙ o c v = d V O C V d t term is approximated as a function of the SOC, V ˙ o c v f ( S O C ) . The solution to Equation (20) is obtained through the integrating factor method and is given below.
T t = T + T 0 T e P t + Q P   ( 1 e P t )
The effect of contact resistance at the electrode–electrolyte interface is lumped into the equivalent heat transfer coefficient heq, and the corresponding equivalent resistance value is given by Equation (23). The expressions for P and Q from above Equation (21) are given in Equations (22)–(24).
P = R e q · A m · c p
R e q = 1 h · A I · V ˙ o c v + R c o n t a c t · c f
Q = I · V O C V V t m · c p + I · T · V ˙ o c v
The dynamic correction factor ‘Cf’ in the temperature equation was fit by matching the temperature profile of electrochemical model under a 1C-rate discharge condition with 25 °C ambient temperature. Cf is valid when the Biot number is less than 1. The other parameters represent the properties of the cell, and the same values as those in the electrochemical model were used. RContact is the contact resistance at the electrode–electrolyte interface, and ‘Area’ represents the outer surface area of the cell. The values of all the thermal parameters values are given in Table 4. These parameters typically change with battery age. For all the practical purposes, they are assumed to be constant over the shorter span of time considered for the current study.

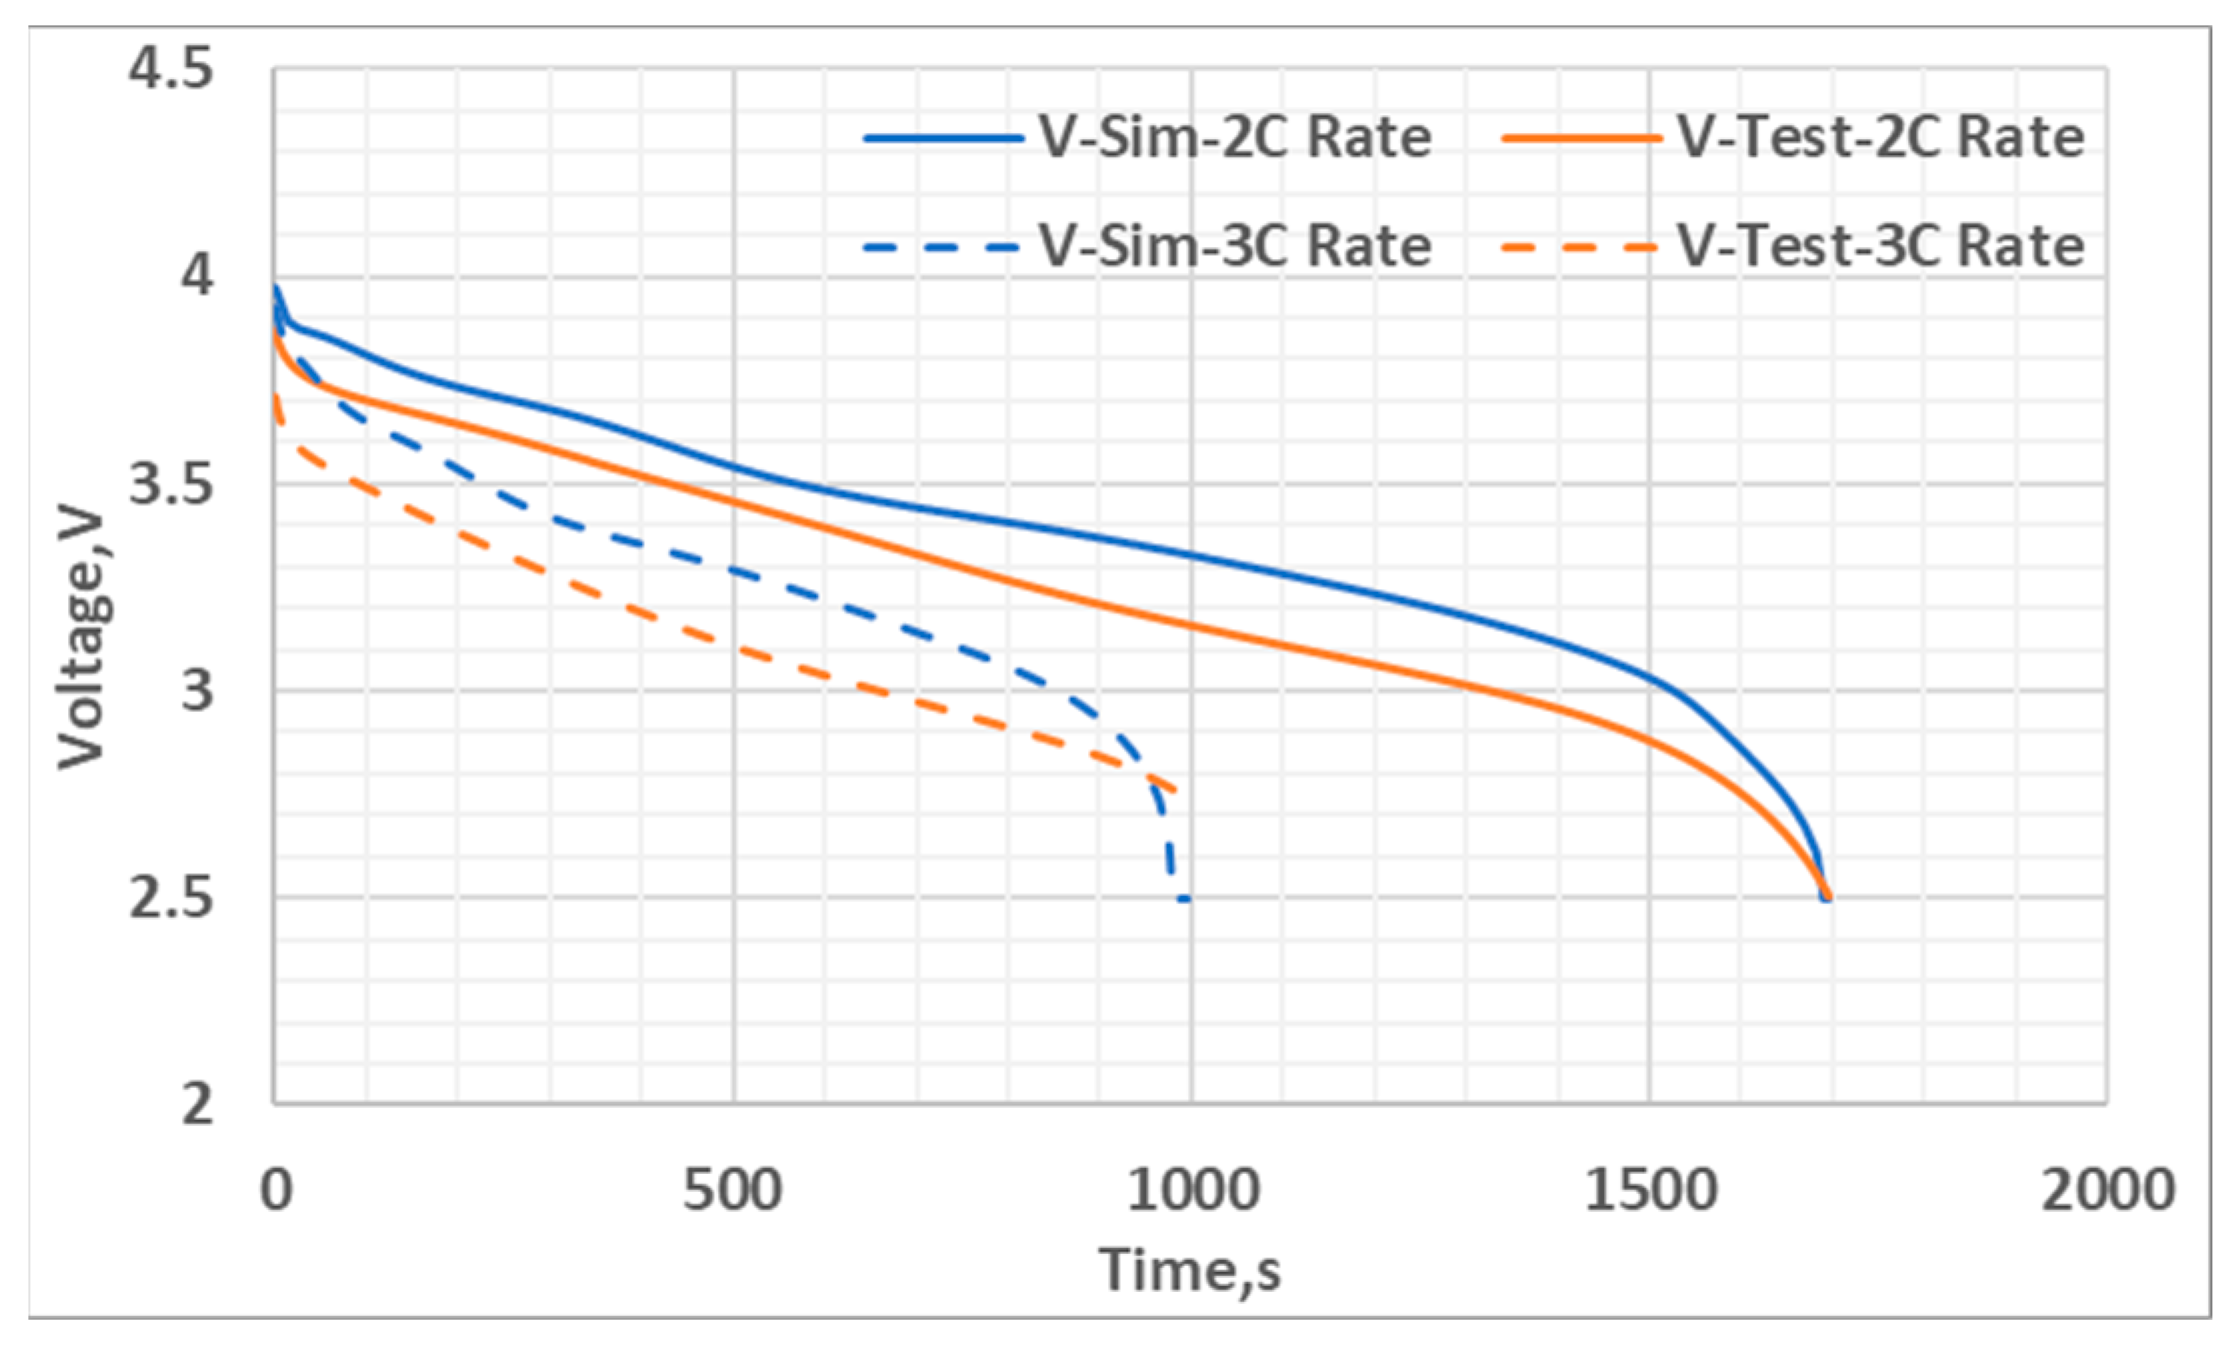
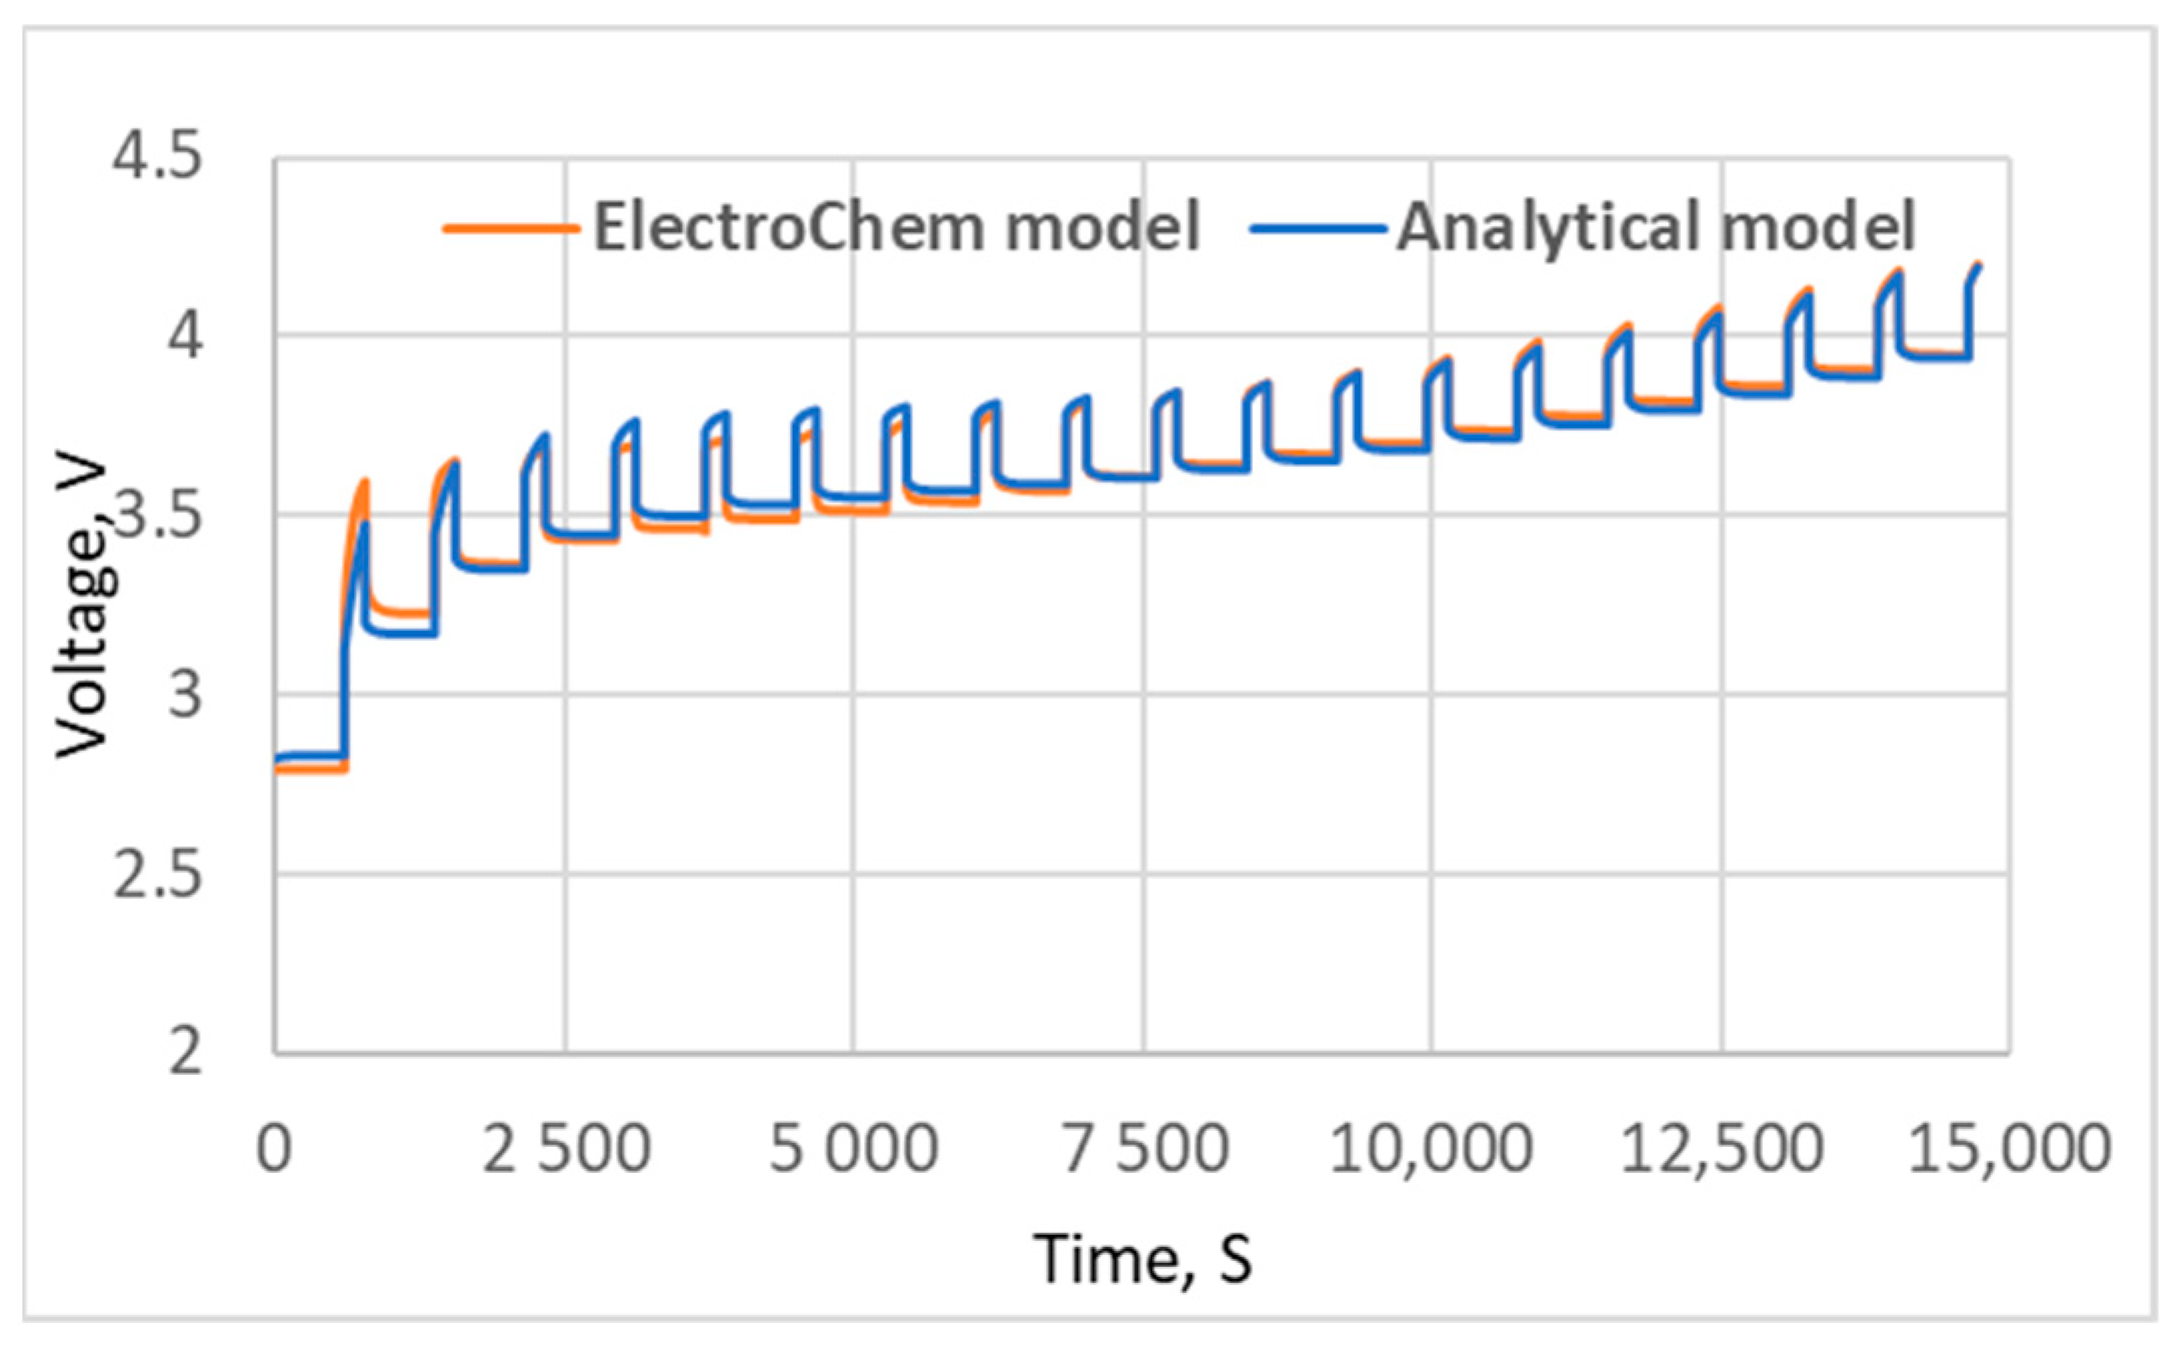
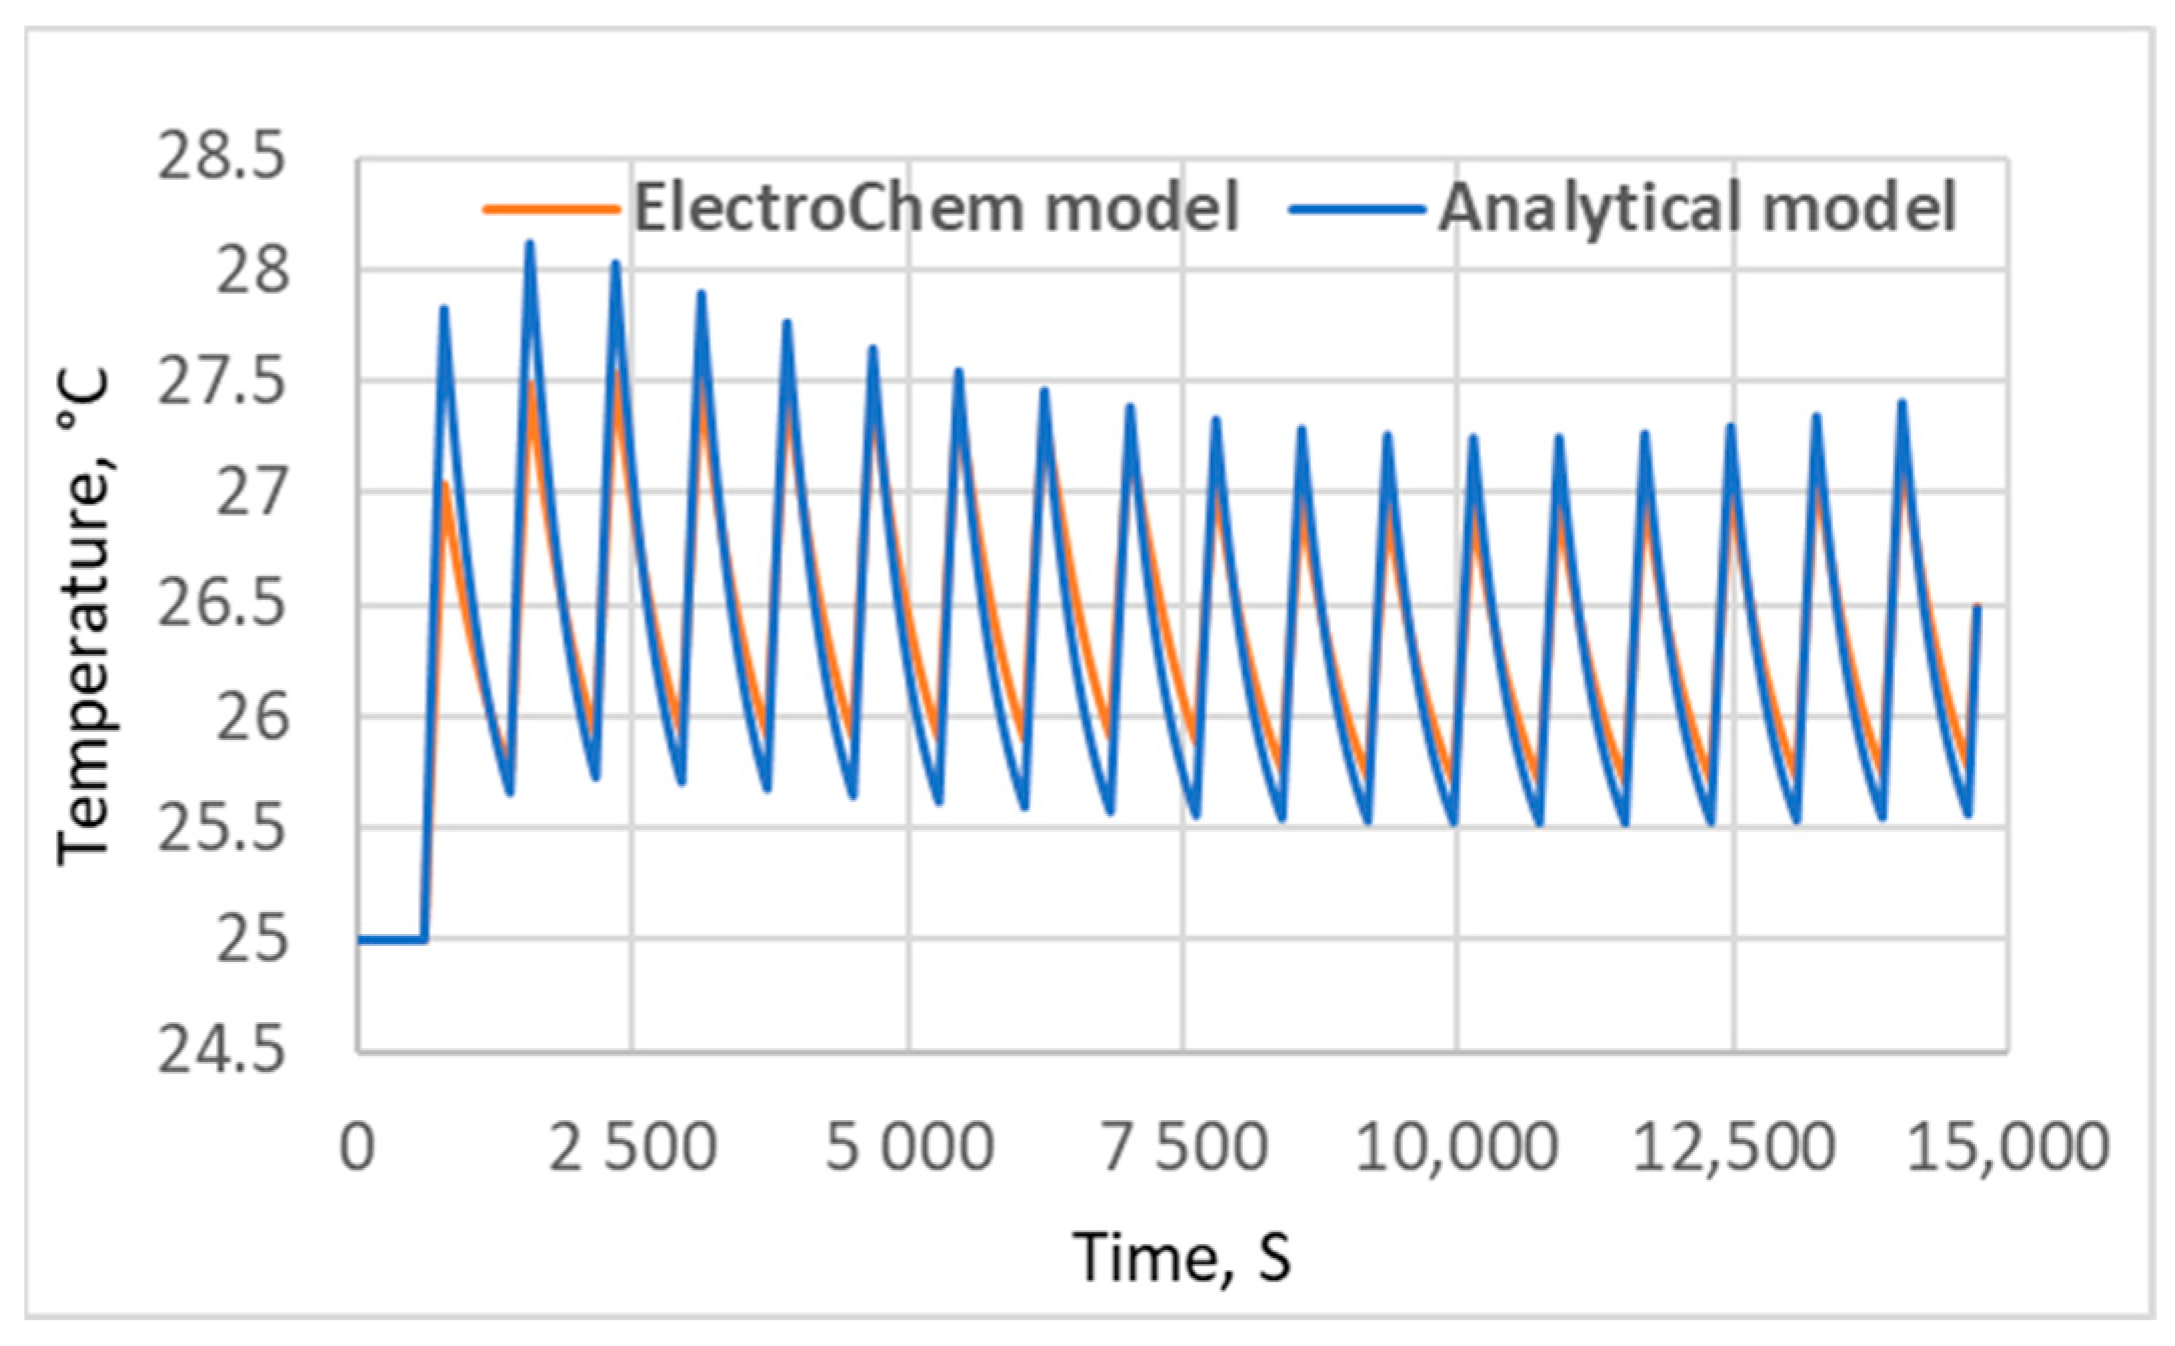
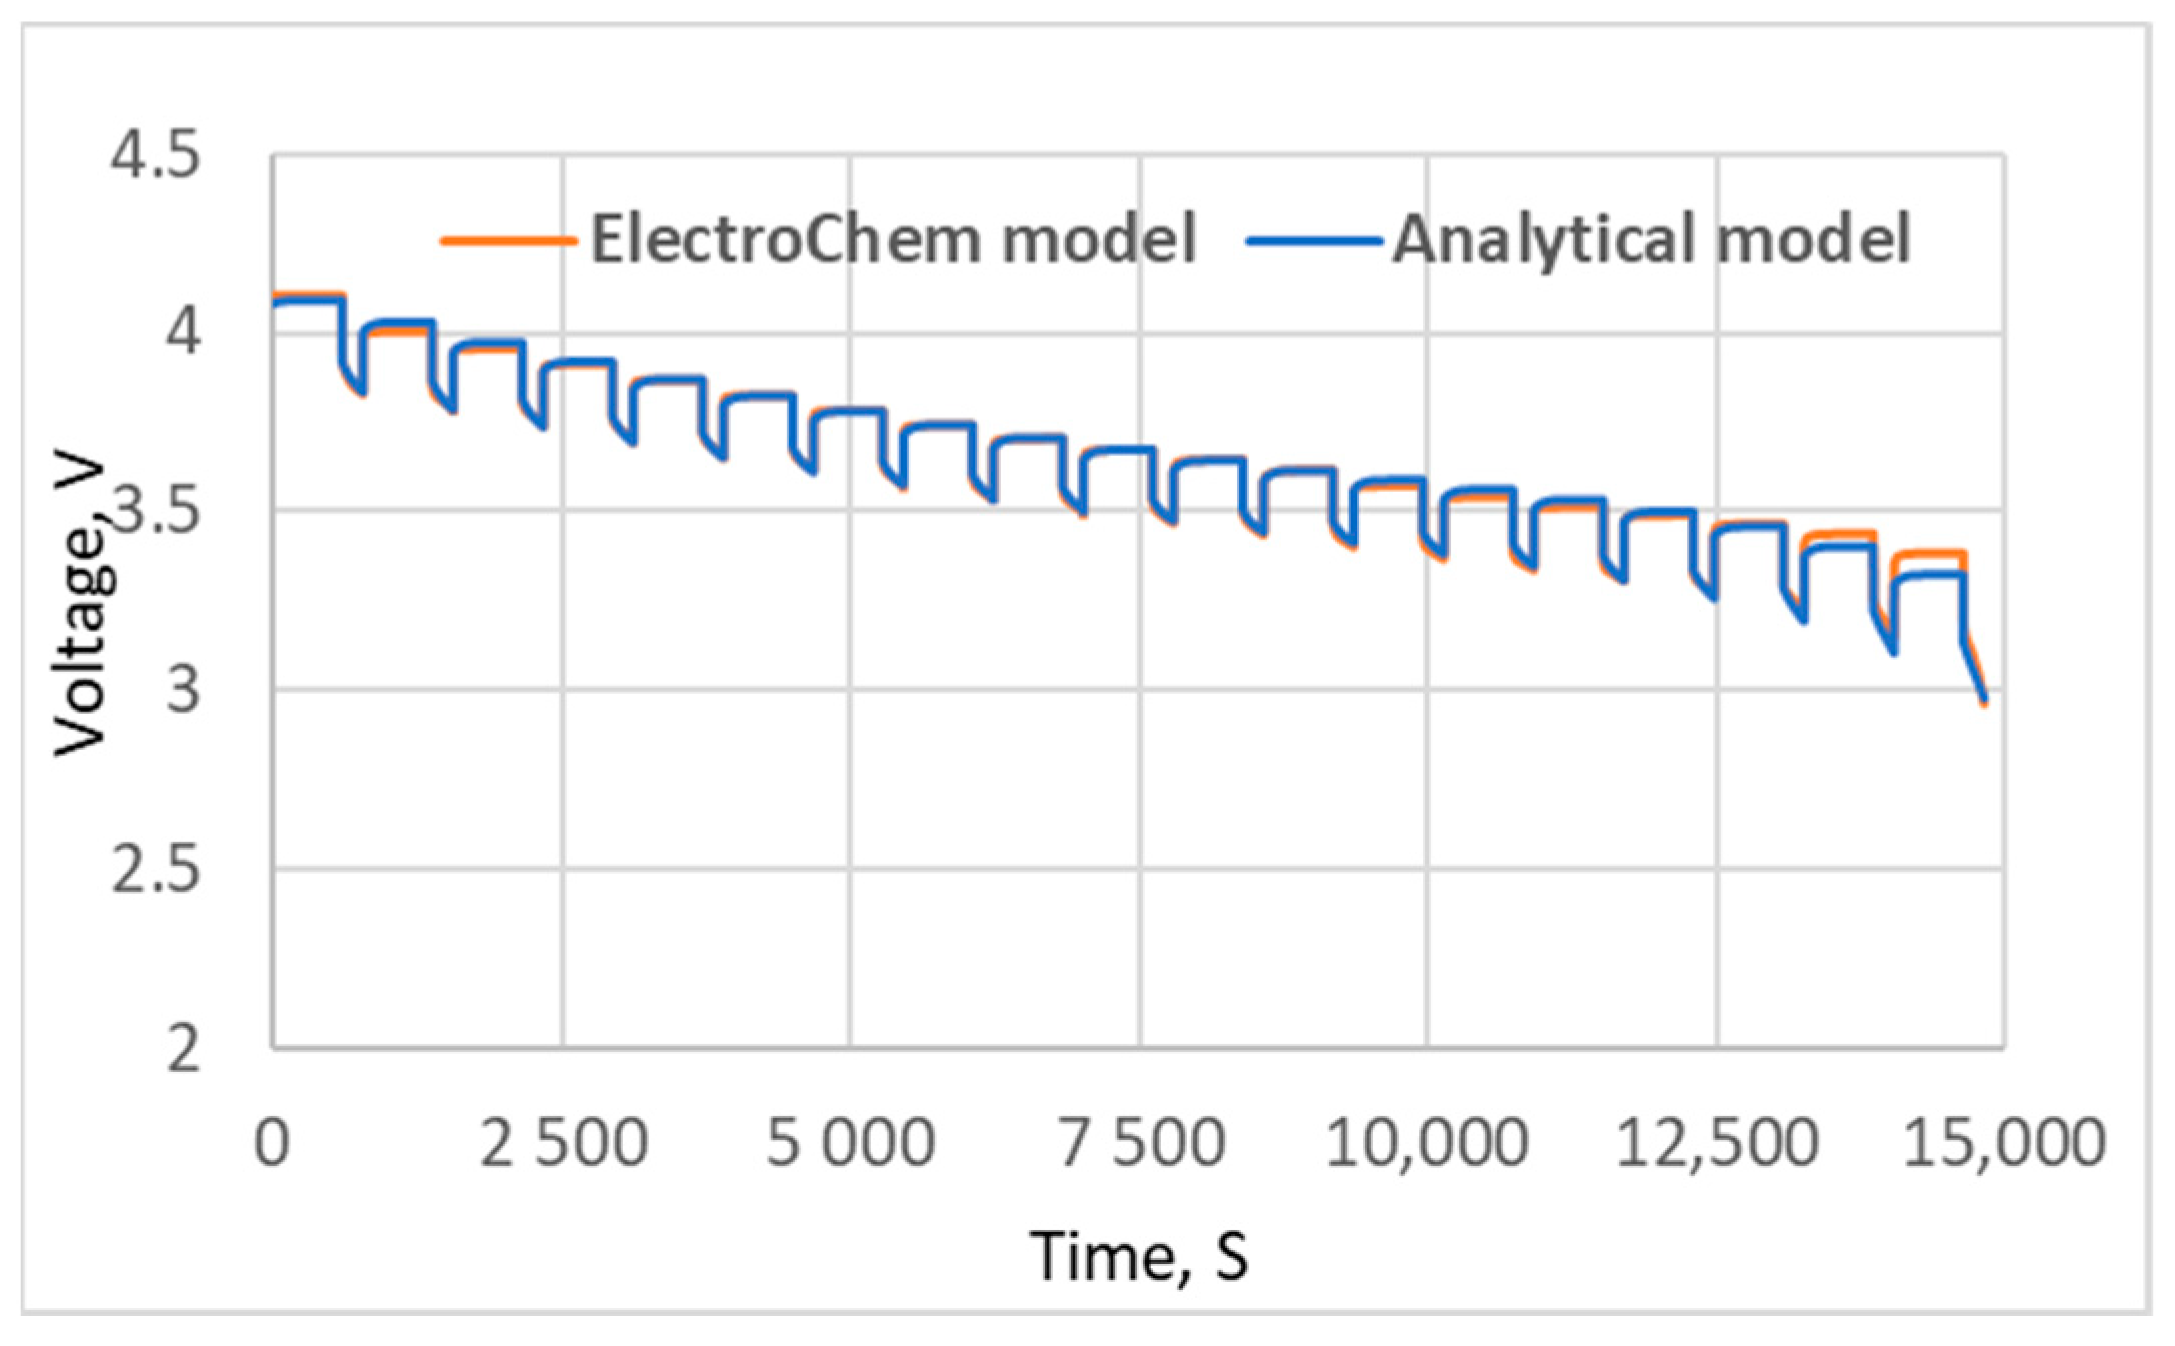
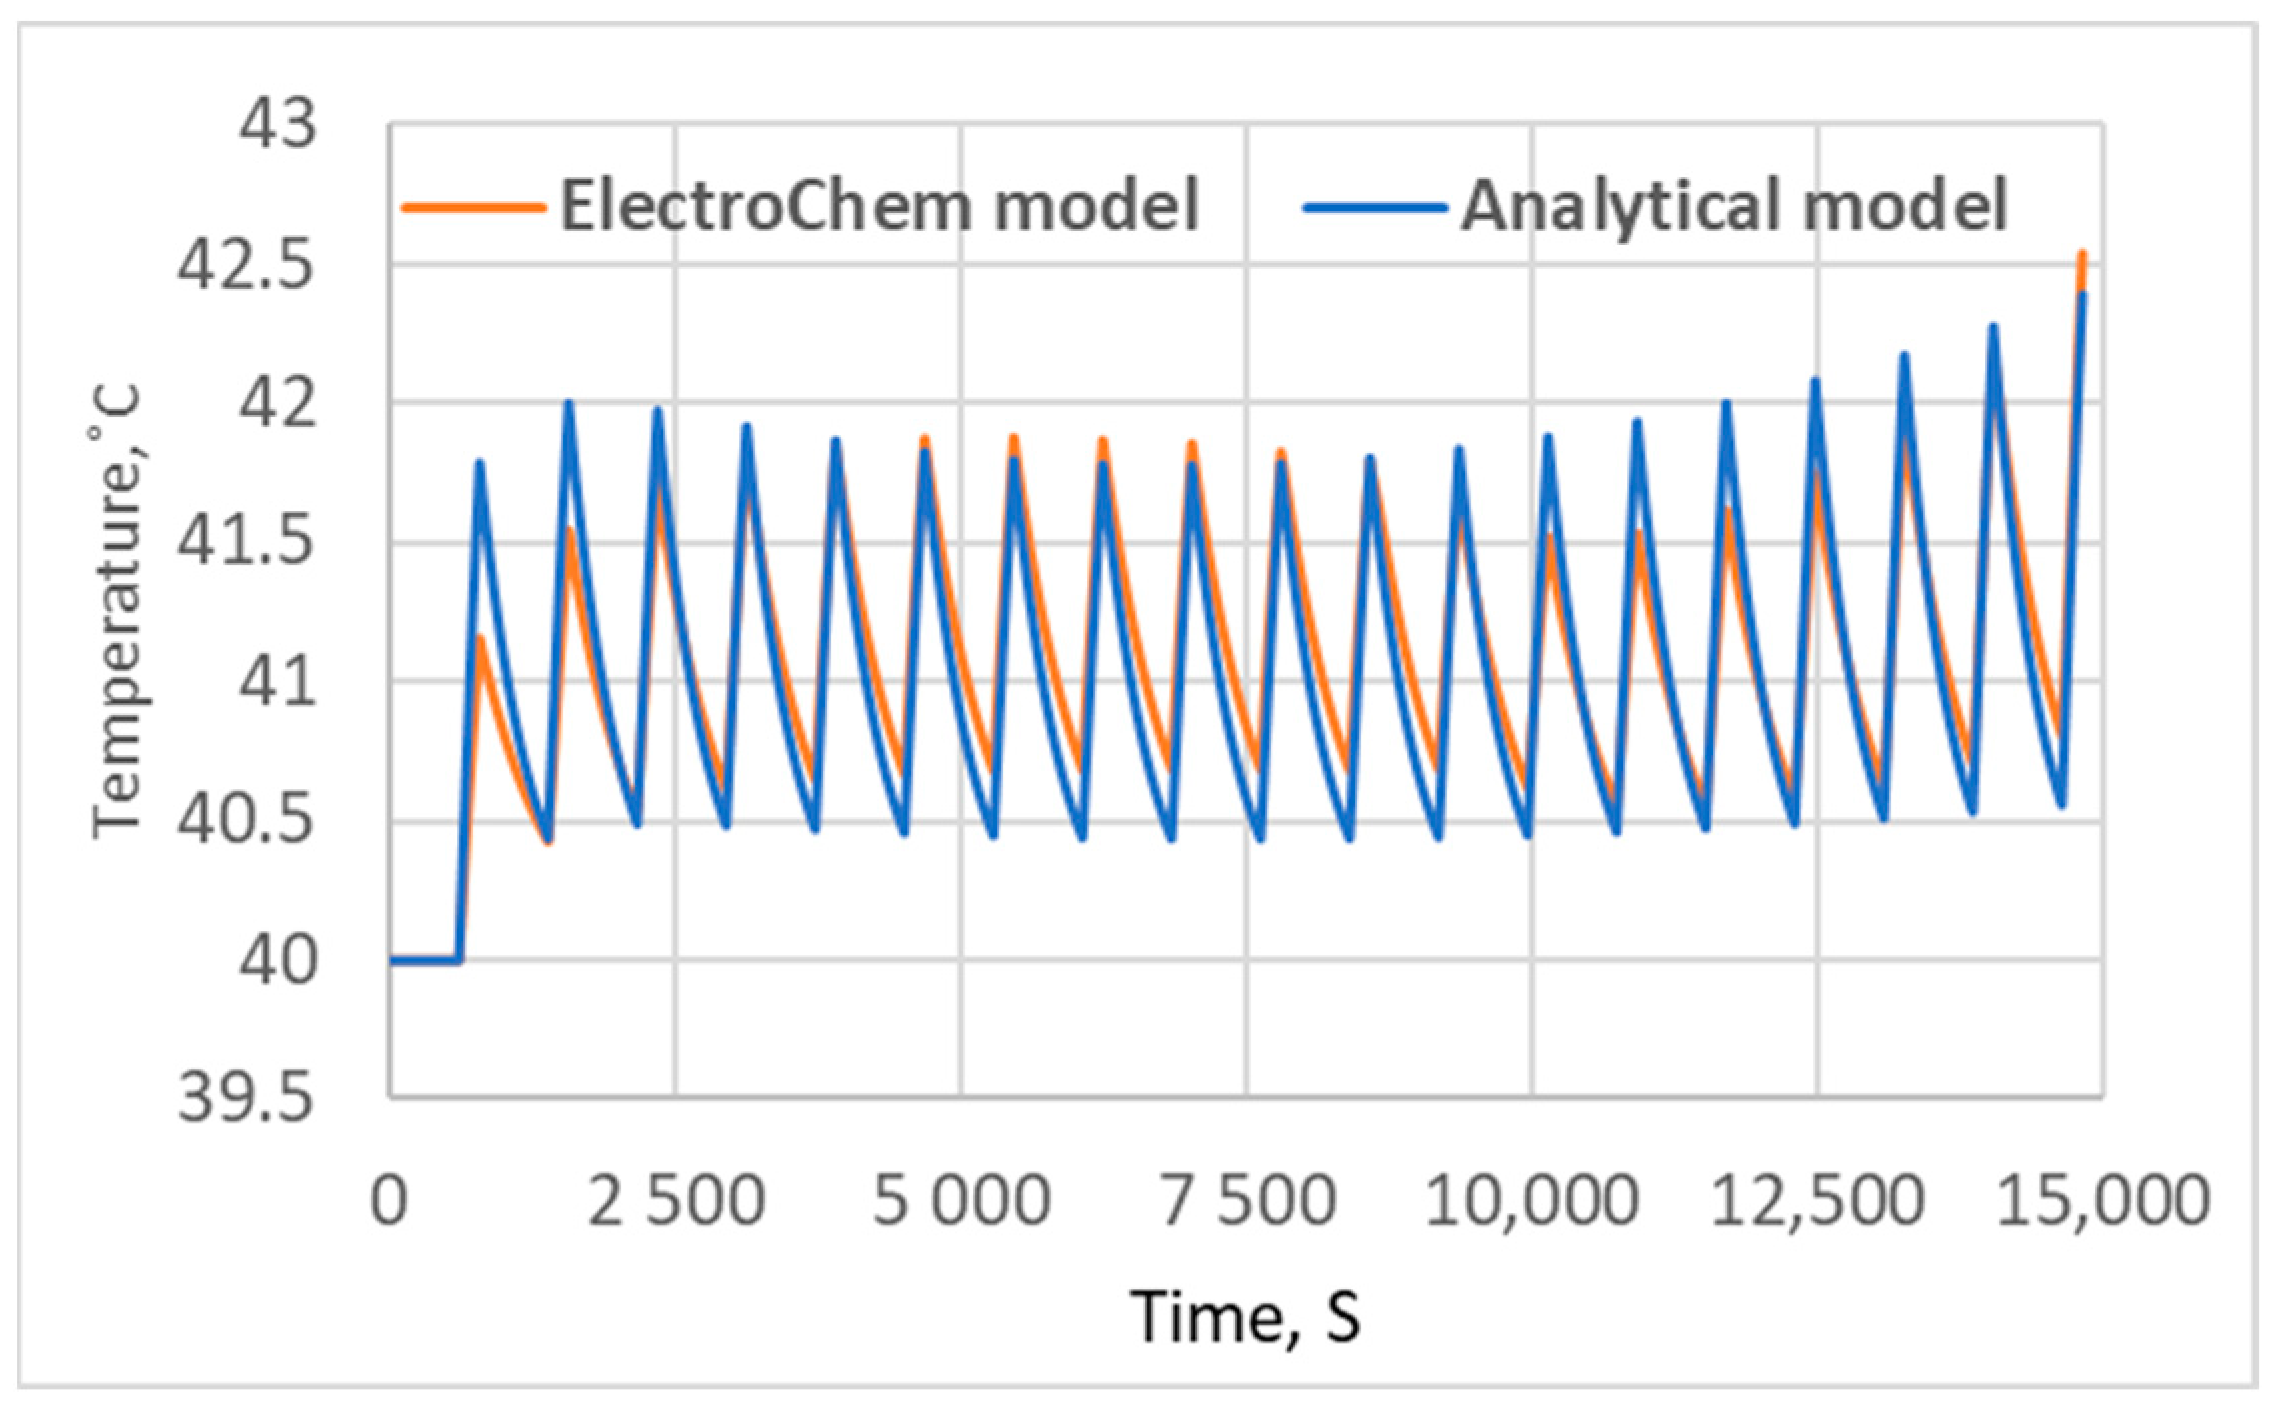
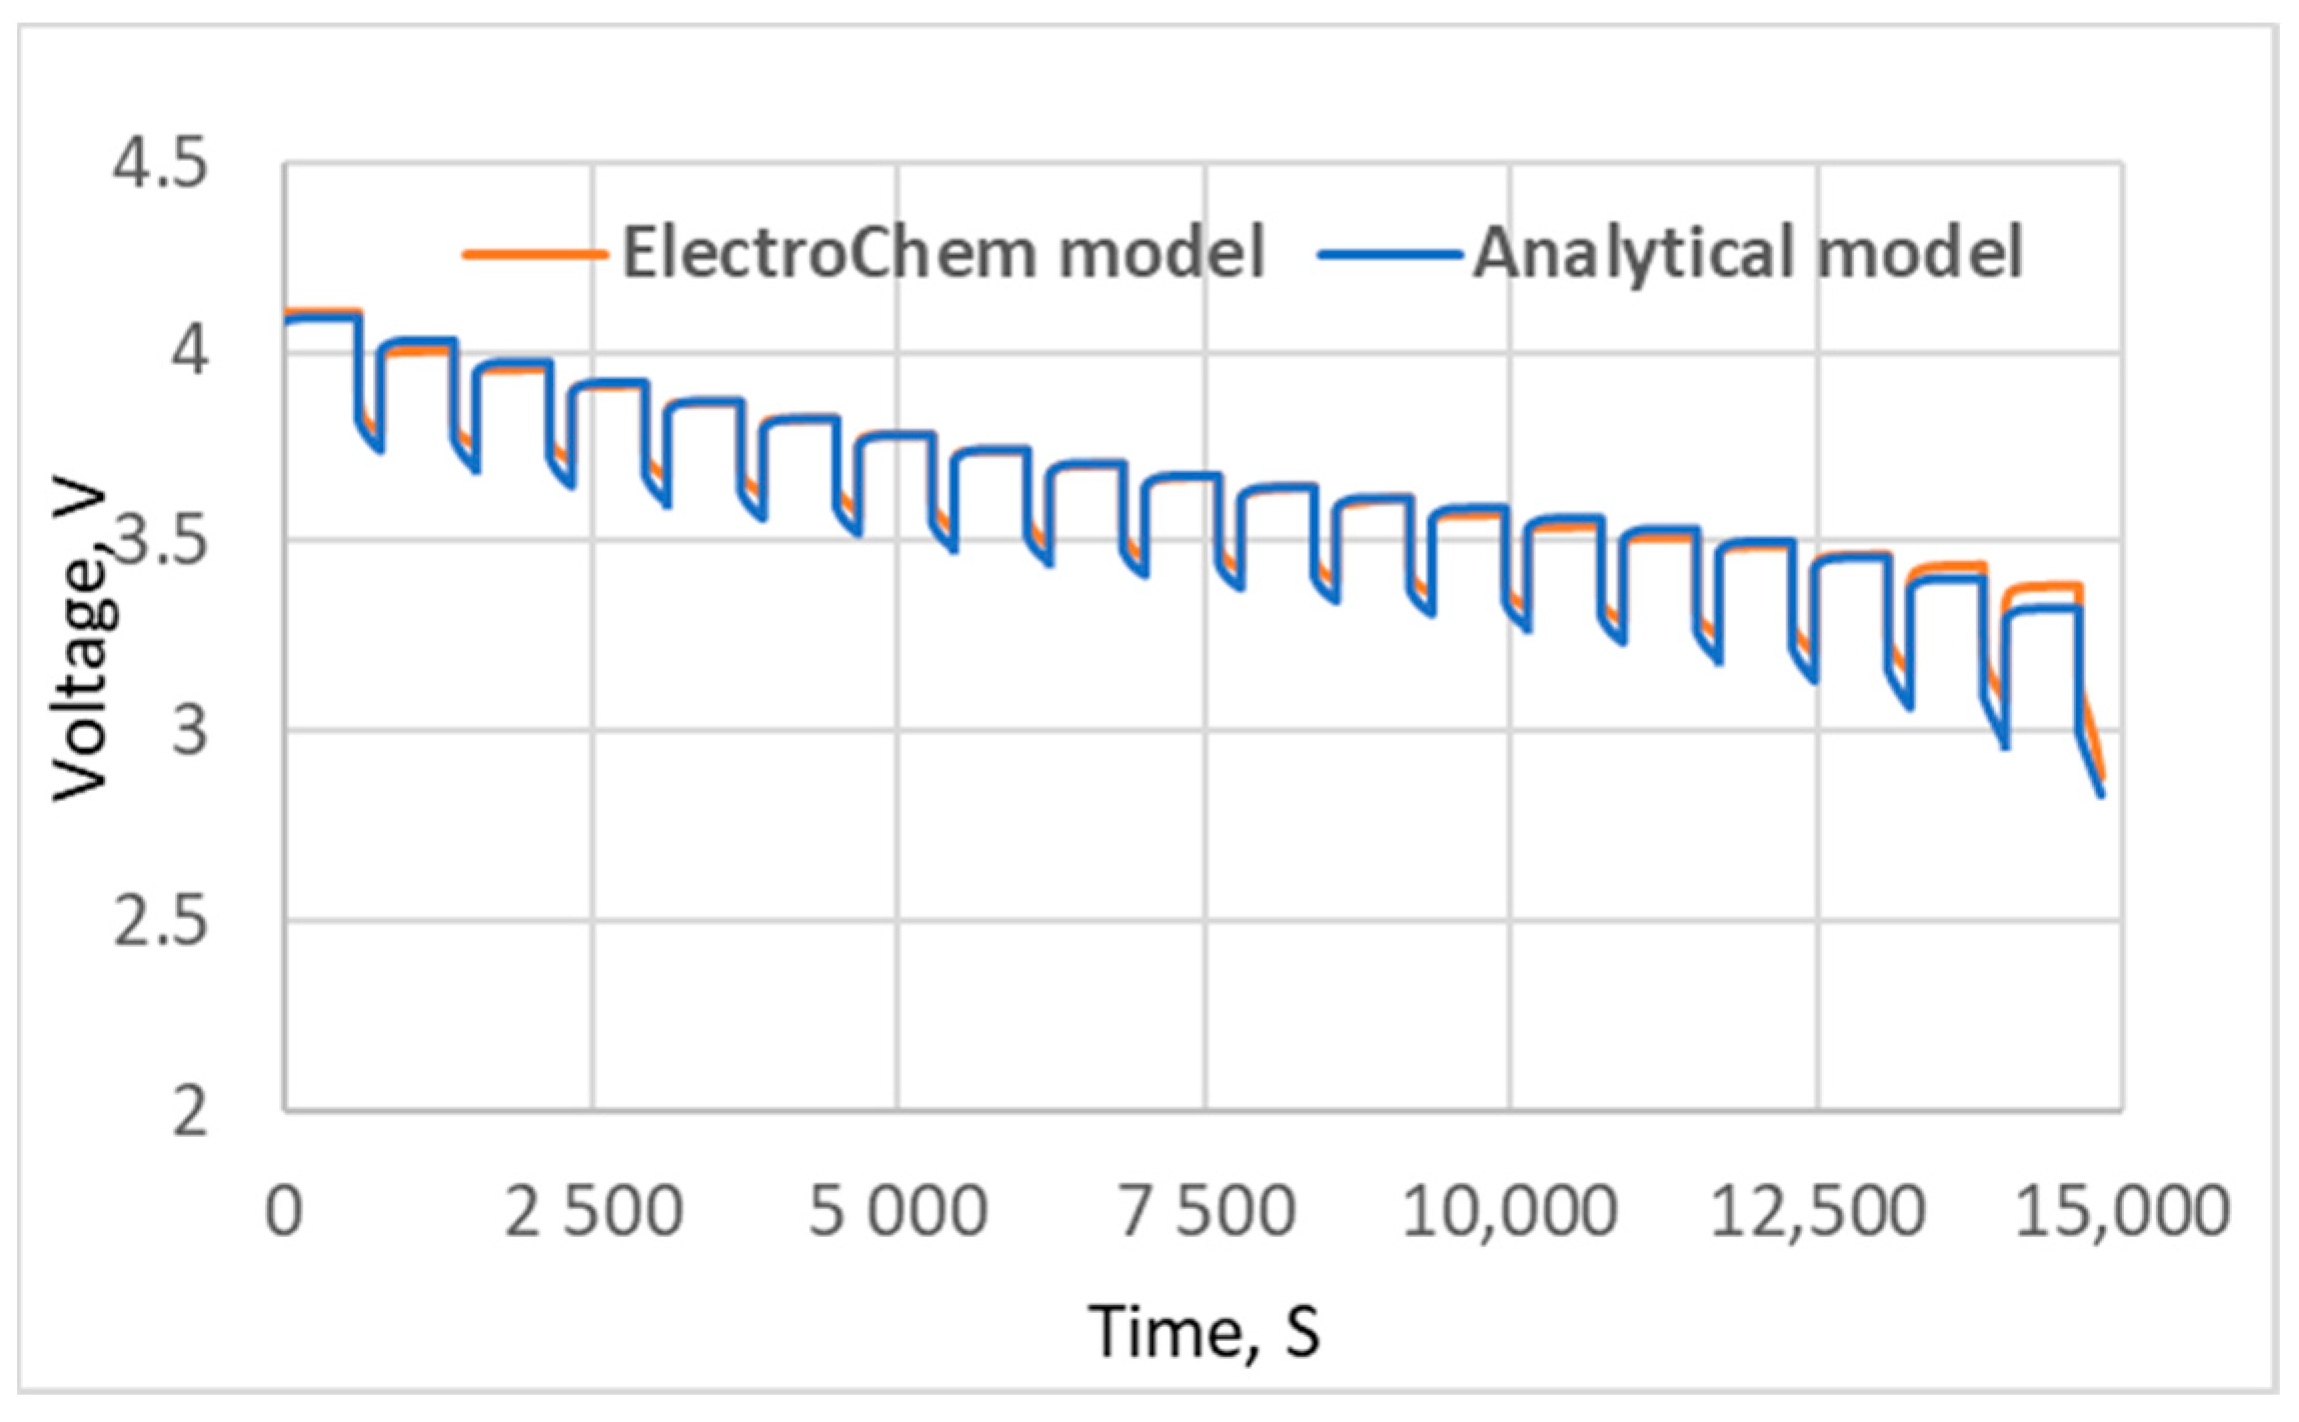
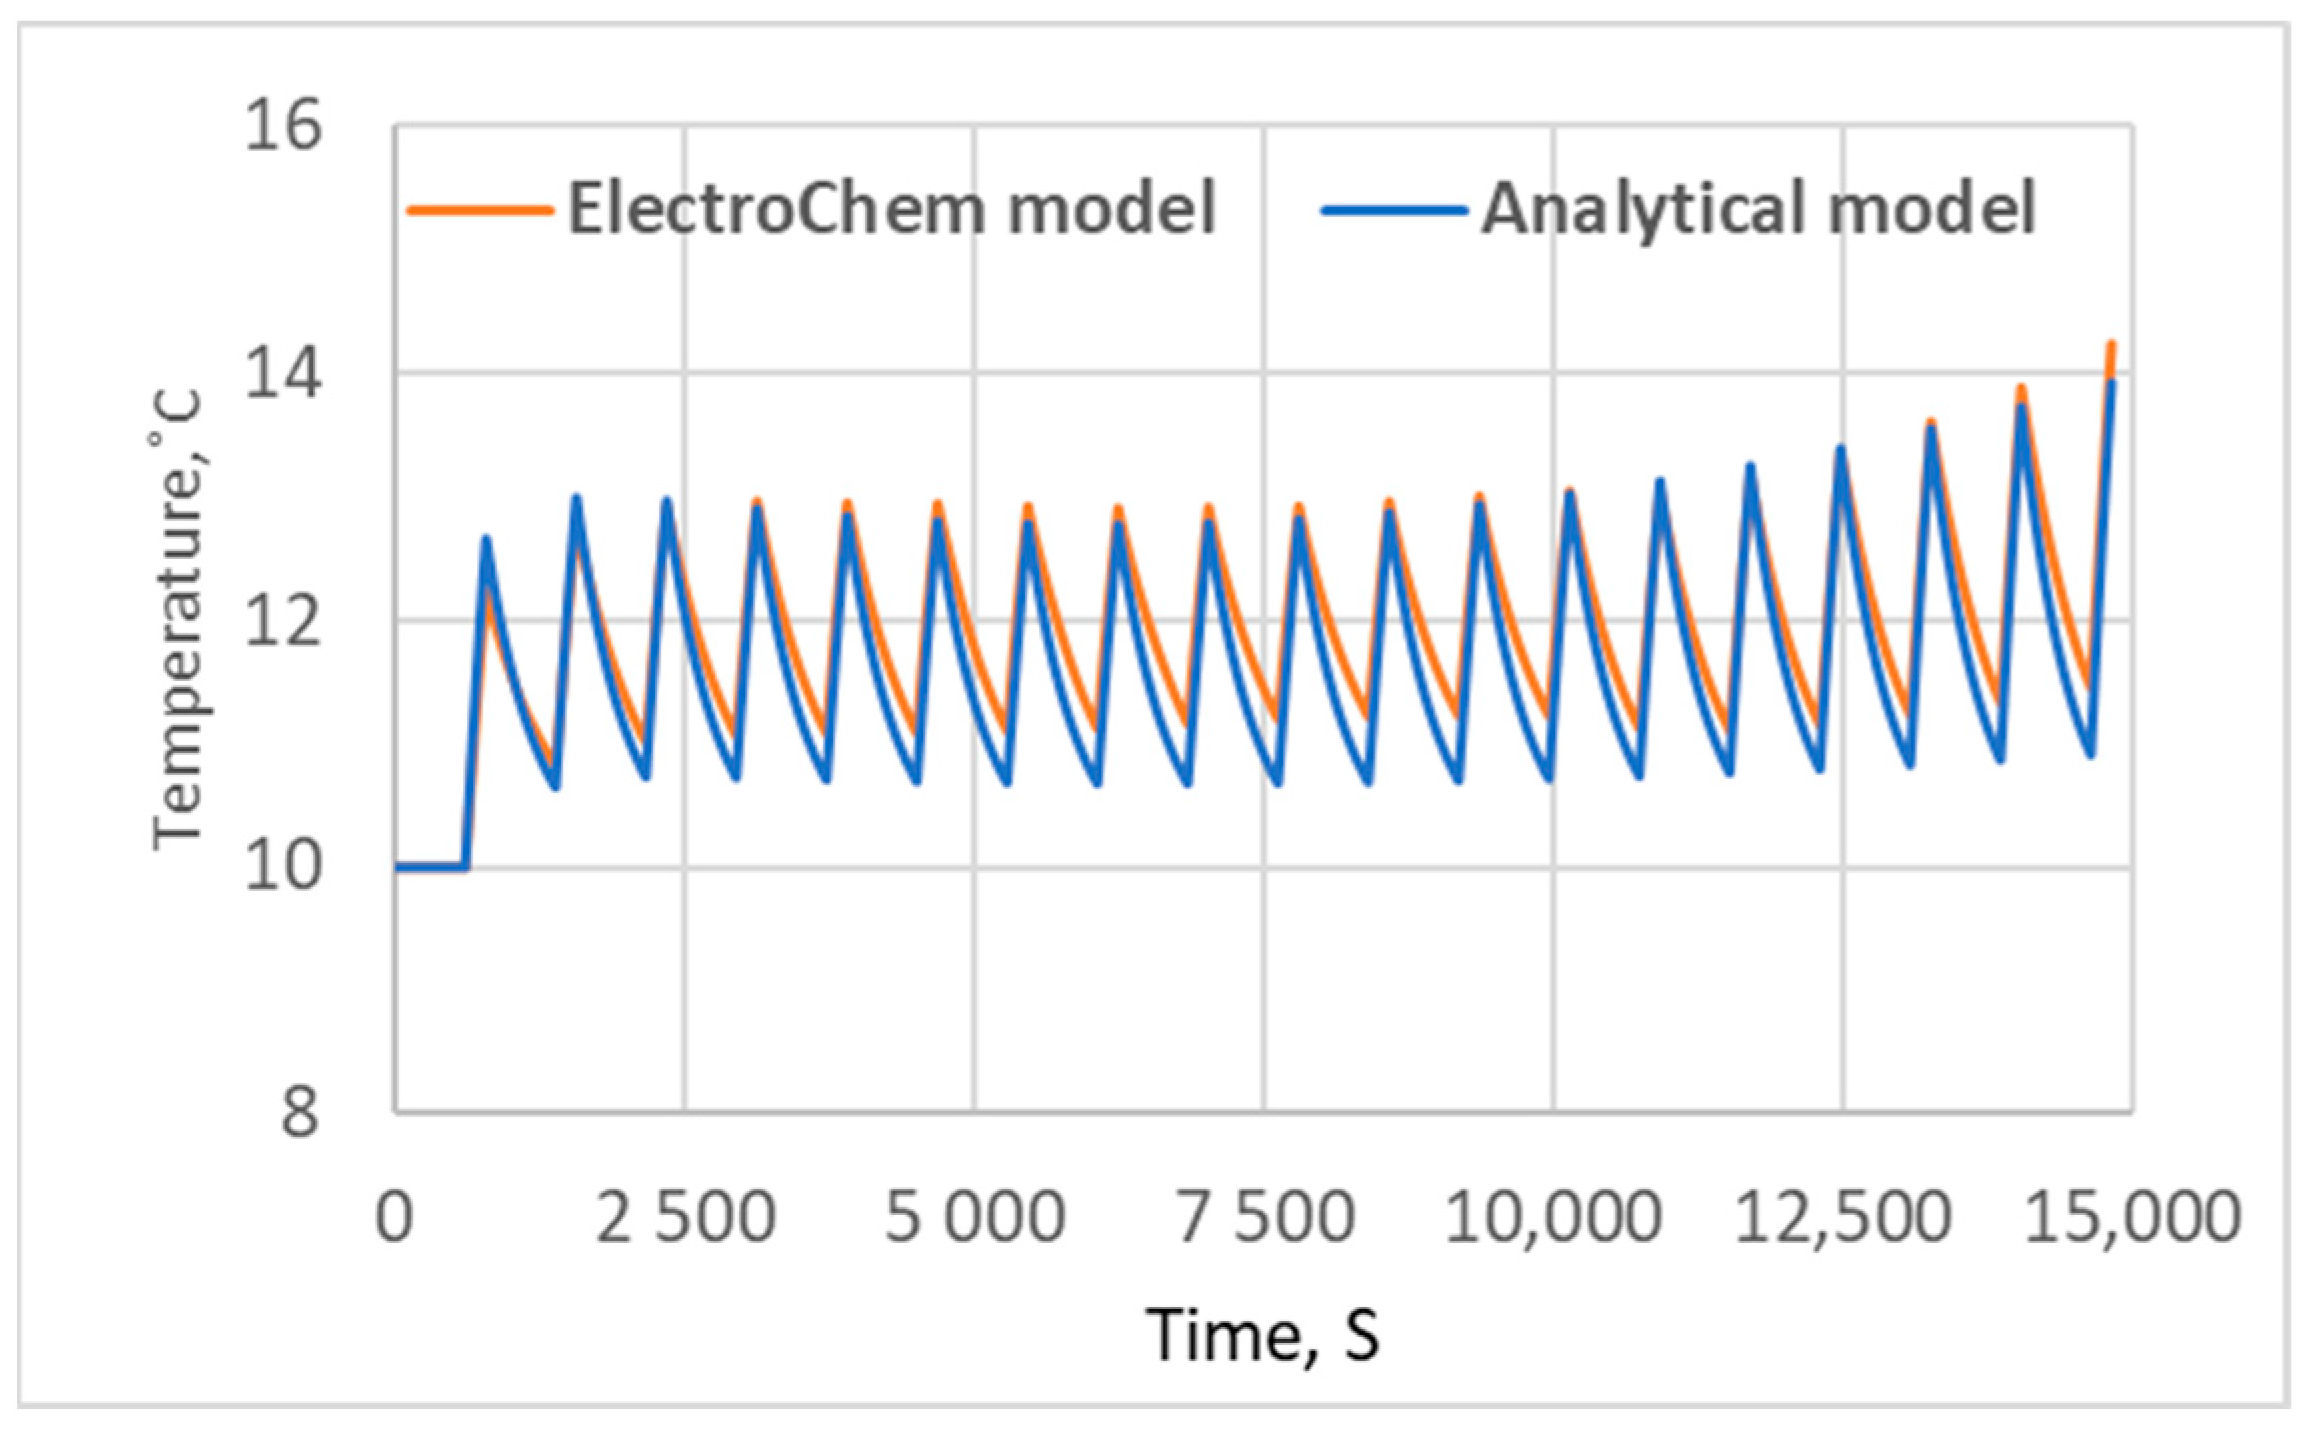
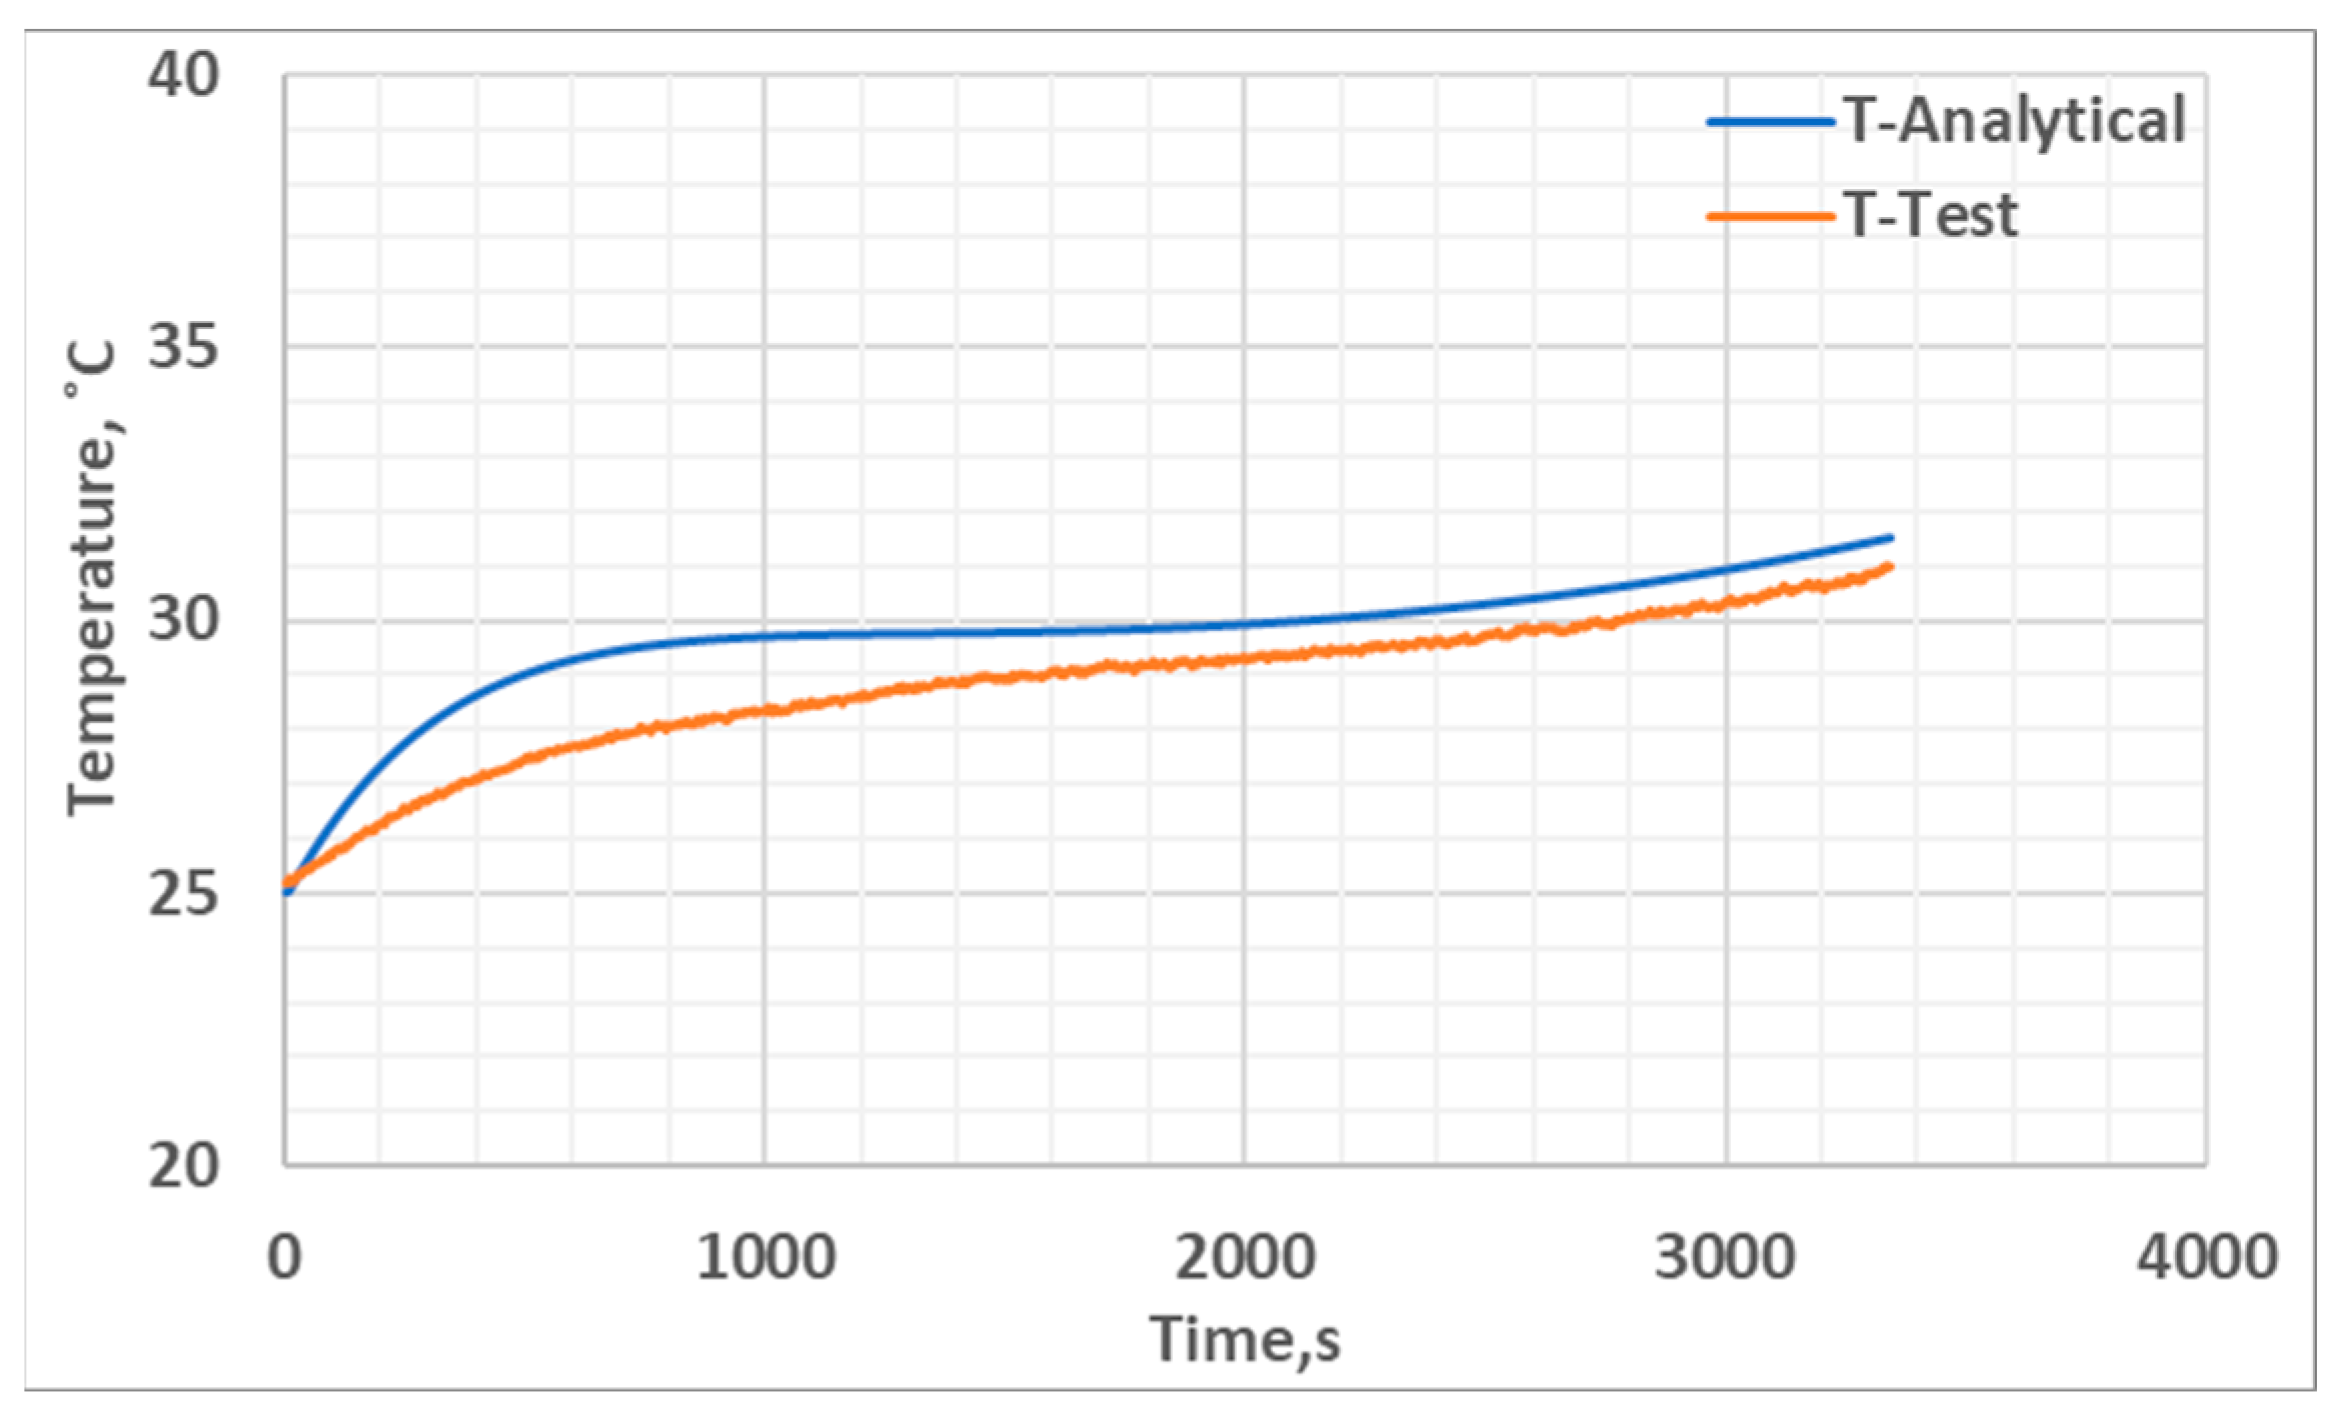
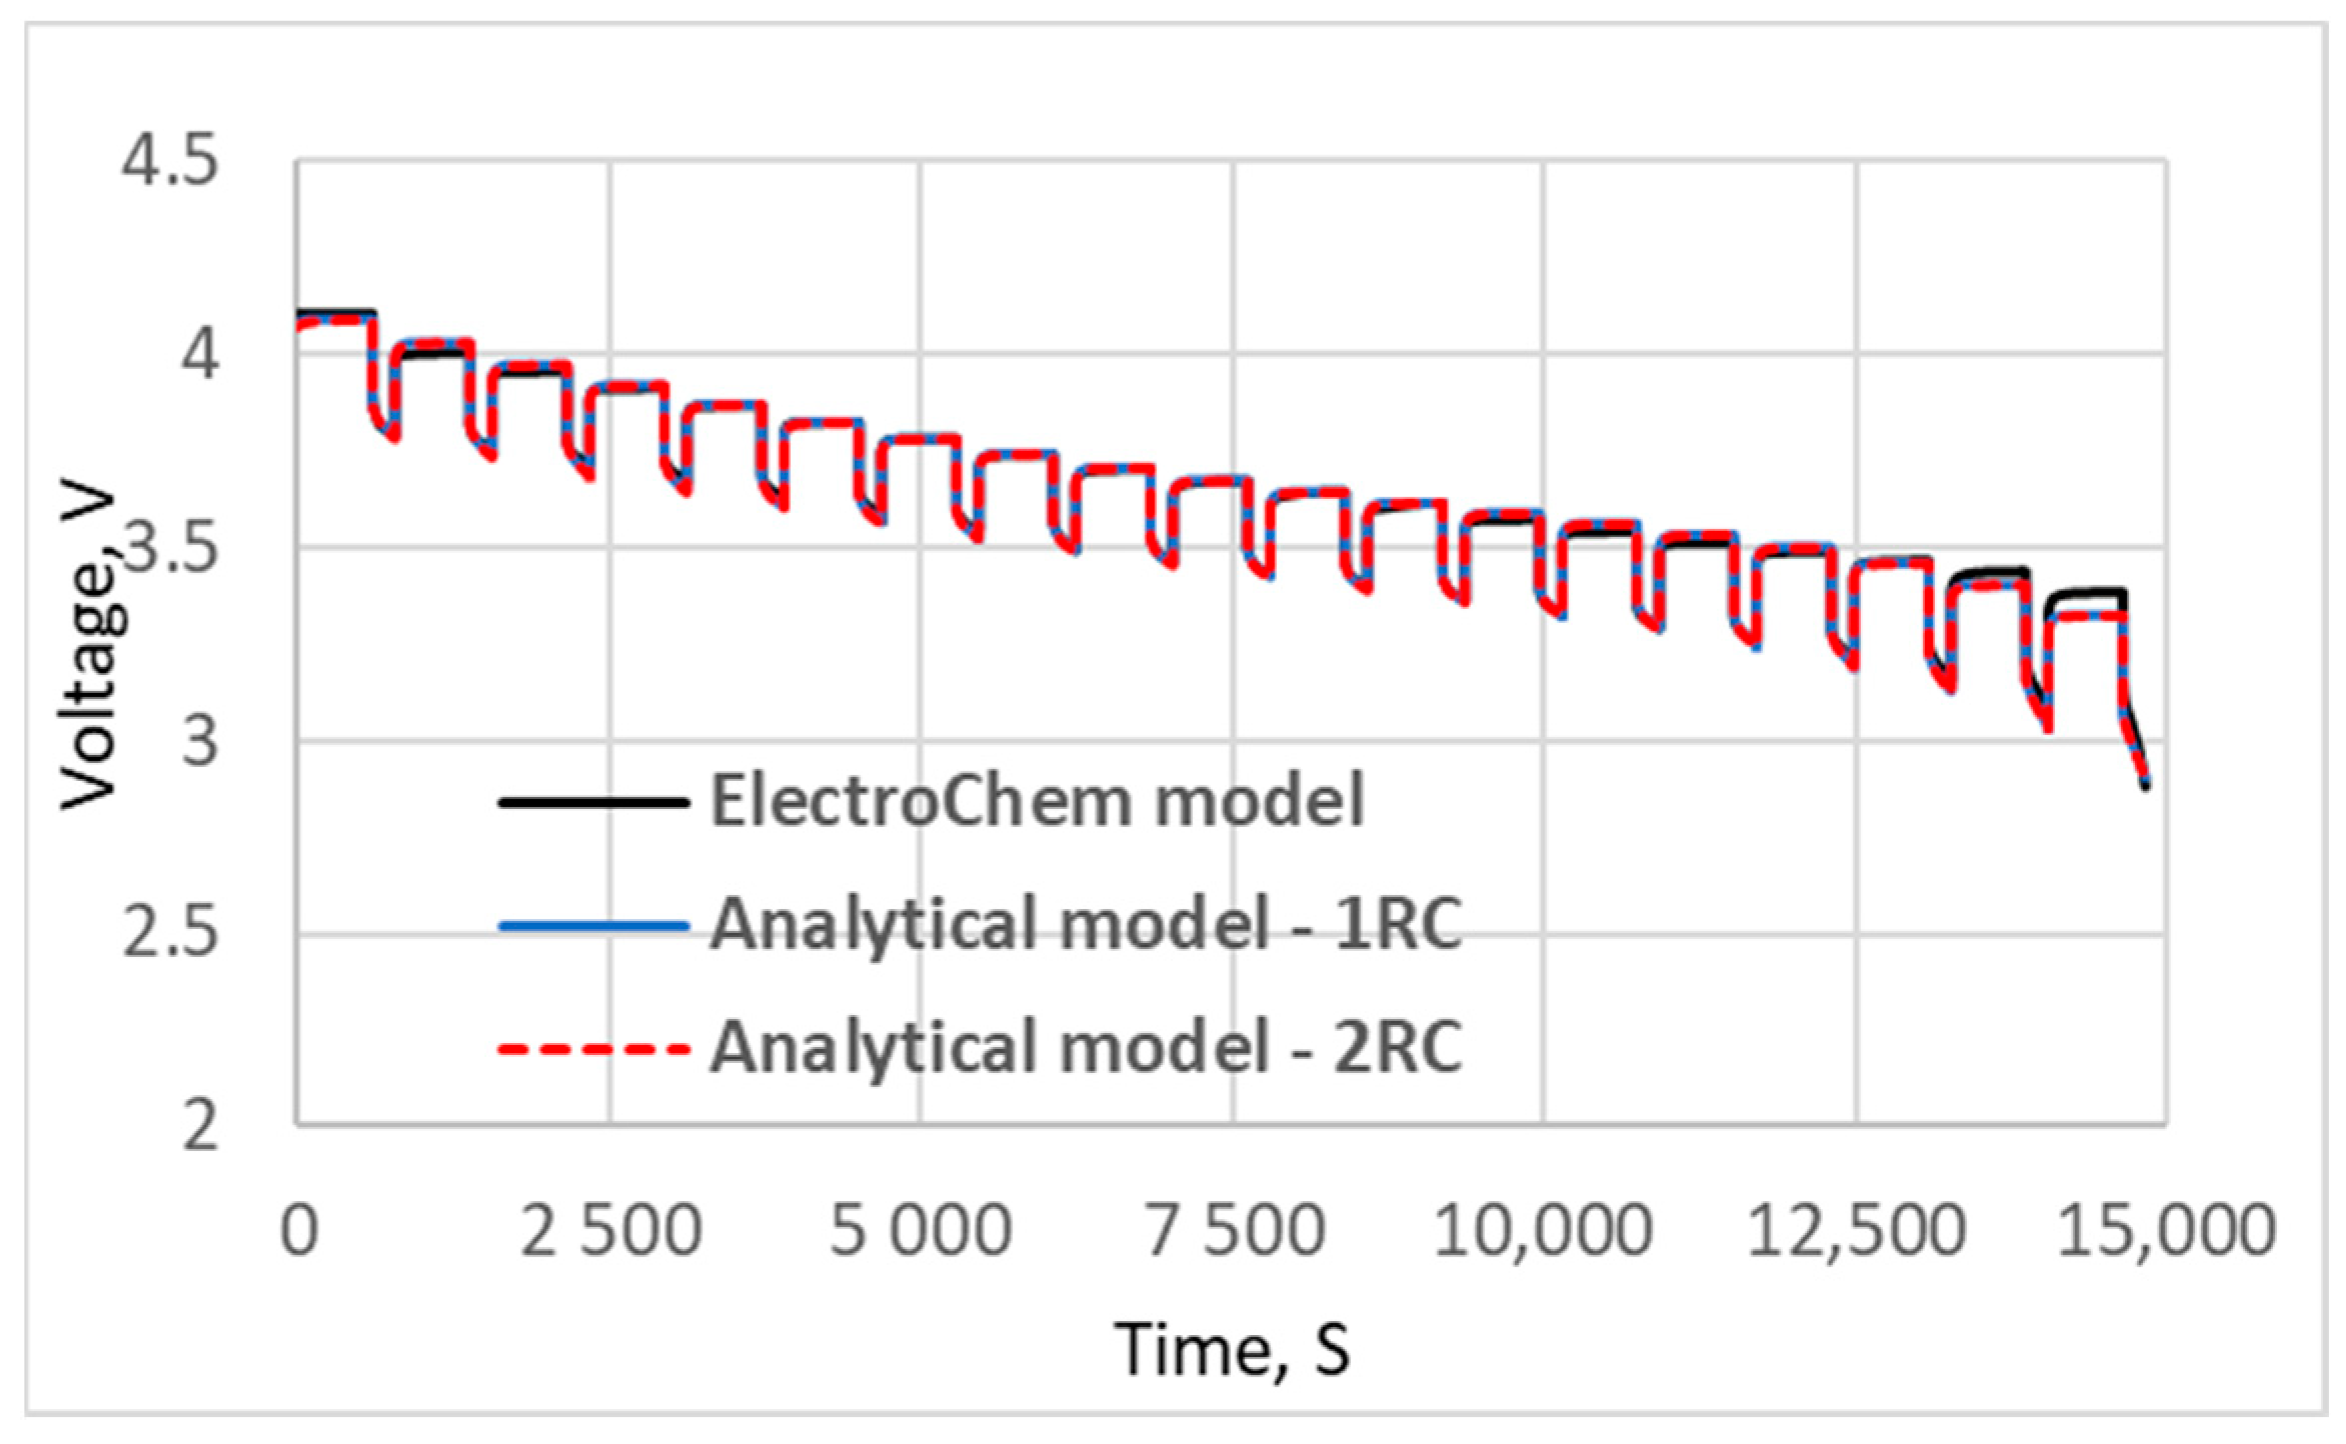
5. Results and Discussion

In the previous section, a fast running analytical model of a battery was developed to predict voltage and temperature. In the current section, the model was run using the HPPC test protocol at different ambient temperatures under 1C-rate charging and discharging conditions. The PyBaMM electrochemical model is used as a benchmark, and the values were compared and discussed.
Figure 15 and Figure 16 compare the terminal voltage prediction between the simplified analytical model and the electrochemical model for 1C-rate charging and discharging HPPC cycles at 25 °C ambient temperature. The voltage values calculated using the analytical model are in agreement with electrochemical model predictions with an RMS error value of 0.034 V for charging and 0.02 V for discharging. The model is able to capture voltage behavior during both charging and discharging. It is to be noted that, in the current approach, the voltage hysteresis behavior is considered negligible, and the same set of RC parameters were used for both charging and discharging. As observed from the voltage plot, the analytical model predictions show some mismatch near the start of charging and end of discharging. The OCV–SOC relationship in the current study is specified using an exponential fitting model (Equation (13)), and when SOC is near zero, the analytical model gives more error. At lower SOC values, the OCV curve exhibited a higher slope, and the model has difficulty matching the test curve. A higher order fitting at the cost of computational speed can help improve the model’s accuracy. The effect of instantaneous ohmic resistance manifests as sudden jumps and drops in the voltage curve. The R0 expression captures this behavior with a good level of accuracy during charging and discharging. The temperature profile exhibits a zig zag behavior during pulse charge/discharge conditions. The simplified analytical model captures this trend well as shown in Figure 17 and Figure 18. The temperature values predicted using the analytical tool are in agreement with the results predicted using the electrochemical model with an RMS error value of 0.2 °C for both charging and discharging conditions. The comparison with the electrochemical model shows that the analytical model predicts slightly higher temperatures for charging and discharging cycles.
The voltage and temperature values are calculated for an ambient temperature of 40 °C, and the profiles are given in Figure 19 and Figure 20. The voltage and temperature values are calculated for an ambient temperature of 10 °C, and the values are given in Figure 21 and Figure 22. The analytical model predictions are in agreement with electrochemical model predictions with an RMS error values of 0.018 V and 0.19 °C as well as 0.034 V and 0.34 °C for 40 °C and 10 °C conditions, respectively. The internal resistance of the cell decreases with an increase in temperature, and this behavior is reflected in the voltage pulse drops. The acceptable OCV predictions by the analytical model at different temperature conditions indicate that the effect of lumping the temperature into the coefficients as given in Equation (14) is a valid approach. The temperature profile shows a rise of 2 to 3 °C during HPPC tests, and this value is minimally affected by the ambient temperatures. The thermal expression with the correction factor fit at 25 °C works at other temperature conditions as well. Also, the voltage and temperature predictions using the current analytical model for typical discharge behavior under 1C-rate and 25 °C ambient conditions are given in Figure 23 and Figure 24. The comparison with test values gives an RMS error of 0.08 V for voltage and 0.99 °C for temperature.
The 1RC model was also compared with the 2RC model to check the robustness of the model. The R2 and C2 values as calculated from the HPPC tests were used, and the voltage values are compared in Figure 25. The 1RC values match well with the 2RC values with an RMS error of 0.003 V within the current temperature range considered (10 to 40 °C). Although the 1RC model makes reasonable predictions within the operating temperature range considered (10 to 40 °C), extrapolating the model beyond the temperature range may yield inaccurate results as the trends of RC parameters may change. To fit the model, the whole operating temperature range should be considered. Also, at the beginning and end of the charge/discharge process, the 1 RC model has difficulty capturing the behavior. The model parameters warrant refinement at lower ambient temperatures and non-linear zones.

6. Conclusions and Future Work

A coupled electrochemical¬–thermal model was developed in PyBaMM using the test data available in the open literature. The calibrated model was validated against the measured voltage and temperature values. Then, the model was used as a virtual test bench, and the standard HPPC protocols were run for different operating conditions. The applied current and voltage response obtained from the virtual HPPC test were used to identify the parameters for the faster and simplified equivalent circuit model. The fast running first-order equivalent circuit model was developed by analytically solving the voltage characteristics equation. The parameters of the analytical model are functions of the SOC and temperature with both fast and slow dynamics lumped effectively. Similarly, for the thermal solution, the energy equation of the cell with reversible and irreversible components was solved. The terminal voltage obtained from the voltage solution was used to estimate the irreversible component, and the reversible (entropy change) component was calculated as a function of the SOC. Using the fast running analytical model, voltage and temperature predictions were made for HPPC conditions at different operating temperatures. The model predictions are in good agreement with the results of the physics-based electrochemical–thermal model, which was extensively validated with openly available test data. Also, the fit 1 RC model is as good as a typical 2 RC model. The developed model can be used on the BMS for efficient energy management. The developed model can also be coupled with thermal system models to make quicker evaluations of battery characteristics and thermal system characteristics during the early development phase. The current approach is a simple analytical expression that can be implemented in a vehicle’s ECU efficiently. This model is expected to be much faster than the physics-based method or look table-based onboard models. Actual implementation and computation with the onboard diagnostics is part of our future research.

Author Contributions

Conceptualization, formal analysis, investigation, methodology, validation, writing—original draft, writing—review & editing, M.J.A., V.D., D.N., T.P., R.K.C., P.R.K., J.T., D.T., T.S. and M.S.; funding acquisition, project administration, software, M.J.A., V.D. and D.N.; data curation, resources, visualization, M.J.A., V.D., D.N., T.P., R.K.C., P.R.K., J.T., D.T., T.S. and M.S.; supervision, M.J.A., V.D., D.N. and J.T. All authors have read and agreed to the published version of the manuscript.

Funding

This research was funded by Natural Sciences and Engineering Research Council of Canada (NSERC) Alliance International Grant ALLRP 571845-21 and Discovery Grants RGPIN-2022-04428.

Data Availability Statement

Data are available on request.

Conflicts of Interest

The authors declare no conflicts of interest.

Nomenclature

nNumber of electrons transferred
ICCurrent through capacitance circuit
IRCurrent through resistance circuit
Q C Charge across capacitance
V 1 0 Voltage at previous time step
rRadius of spherical electrode particle
FFaraday’s constant
t + 0 Transference number
RUniversal constant
VOCOpen circuit voltage, Volts
VtTerminal voltage, Volts

References

  1. Hariharan, K.; Tagade, P.; Ramachandran, S. Mathematical Modeling of Lithium Batteries: From Electrochemical Models to State Estimator Algorithms; Springer International Publishing: Cham, Switzerland, 2018. [Google Scholar]
  2. Plett, G.L. Extended Kalman filtering for battery management systems of LiPB-based HEV battery packs: Part 3. State and parameter estimation. J. Power Sources 2004, 134, 277–292. [Google Scholar] [CrossRef]
  3. Xu, Y.; Hu, M.; Fu, C.; Cao, K.; Su, Z.; Yang, Z. State of Charge Estimation for Lithium-Ion Batteries Based on Temperature-Dependent Second-Order RC Model. Electronics 2019, 8, 1012. [Google Scholar] [CrossRef]
  4. Xiong, R.; Cao, J.; Yu, Q.; He, H.; Sun, F. Critical Review on the Battery State of Charge Estimation Methods for Electric Vehicles. IEEE Access 2018, 6, 1832–1843. [Google Scholar] [CrossRef]
  5. Zhang, C.; Allafi, W.; Dinh, Q.; Ascencio, P.; Marco, J. Online estimation of battery equivalent circuit model parameters and state of charge using decoupled least squares technique. Energy 2018, 142, 678–688. [Google Scholar] [CrossRef]
  6. Aditya, K. Simulation and Validation of a Precise 2RC Model of Lithium-Ion cell Incorporating Wire-bond Losses. In Proceedings of the 2023 International Conference on Control, Communication and Computing (ICCC), Thiruvananthapuram, India, 19–21 May 2023; pp. 1–4. [Google Scholar] [CrossRef]
  7. Dai, H.; Xu, T.; Zhu, L.; Wei, X.; Sun, Z. Adaptive model parameter identification for large capacity Li-ion batteries on separated time scales. Appl. Energy 2016, 184, 119–131. [Google Scholar] [CrossRef]
  8. Jiang, S. A Parameter Identification Method for a Battery Equivalent Circuit Model; SAE Technical Paper; 2011-01-1367; SAE International: Warrendale, PA, USA, 2011; Available online: https://saemobilus.sae.org/papers/a-parameter-identification-method-a-battery-equivalent-circuit-model-2011-01-1367 (accessed on 10 October 2023).
  9. Dagci, O.H.; Chandrasekaran, R. Li-Ion Battery Pack Characterization and Equivalent Electrical Circuit Model Development; SAE Technical Paper; 2014-01-1839; SAE International: Warrendale, PA, USA, 2014; Available online: https://saemobilus.sae.org/papers/li-ion-battery-pack-characterization-equivalent-electrical-circuit-model-development-2014-01-1839 (accessed on 10 October 2023).
  10. Chen, C. Parameter Determination for the Battery Equivalent Circuit Model Using a Numerical Integro-Differential Method; SAE Technical Paper; 2020-01-1179; SAE International: Warrendale, PA, USA, 2020; Available online: https://saemobilus.sae.org/papers/parameter-determination-battery-equivalent-circuit-model-using-a-numerical-integro-differential-method-2020-01-1179 (accessed on 10 October 2023).
  11. Hussein, A.A.-H.; Batarseh, I. An Overview of Generic Battery Models. In Proceedings of the 2011 IEEE Power and Energy Society General Meeting, Detroit, MI, USA, 24–29 July 2011; pp. 1–6. [Google Scholar] [CrossRef]
  12. Zhu, Q.; Li, L.; Hu, X.; Xiong, N.; Hu, G.-D. H∞-Based Nonlinear Observer Design for State of Charge Estimation of Lithium-Ion Battery with Polynomial Parameters. IEEE Trans. Veh. Technol. 2017, 66, 10853–10865. [Google Scholar] [CrossRef]
  13. Barbieri, M.; Ceraolo, M.; Lutzemberger, G.; Scarpelli, C. An Electro-Thermal Model for LFP Cells: Calibration Procedure and Validation. Energies 2022, 15, 2653. [Google Scholar] [CrossRef]
  14. Surya, S.; Samanta, A.; Marcis, V.; Williamson, S. Smart Core and Surface Temperature Estimation Techniques for Health-Conscious Lithium-Ion Battery Management Systems: A Model-to-Model Comparison. Energies 2022, 15, 623. [Google Scholar] [CrossRef]
  15. Guo, J.; Guo, Q.; Liu, J.; Wang, H. The Polarization and Heat Generation Characteristics of Lithium-Ion Battery with Electric–Thermal Coupled Modeling. Batteries 2023, 9, 529. [Google Scholar] [CrossRef]
  16. Zhang, R.; Xia, B.; Li, B.; Cao, L.; Lai, Y.; Zheng, W.; Wang, H.; Wang, W.; Wang, M. A Study on the Open Circuit Voltage and State of Charge Characterization of High Capacity Lithium-Ion Battery under Different Temperature. Energies 2018, 11, 2408. [Google Scholar] [CrossRef]
  17. Catenaro, E.; Onori, S. Experimental data of three lithium-ion batteries under galvanostatic discharge tests at different C-rates and operating temperatures. Data Brief 2021, 35, 106894. [Google Scholar] [CrossRef]
  18. Miguel, E.; Plett, L.G.; Trimboli, M.S.; Oca, L.; Iraola, U.; Bekaert, E. Review of computational parameter estimation methods for electrochemical models. J. Energy Storage 2021, 44, 103388. [Google Scholar] [CrossRef]
  19. Chen, C.-H.; Planella, F.B.; O’Regan, K.; Gastol, D.; Widanage, W.D.; Kendrick, E. Development of Experimental Techniques for Parameterization of Multi-scale Lithium-ion Battery Models. J. Electrochem. Soc. 2020, 167, 080534. [Google Scholar] [CrossRef]
  20. Doyle, M.; Fuller, T.; Newman, J. Modeling of Galvanostatic Charge and Discharge of the Lithium/Polymer/Insertion Cell. J. Electrochem. Soc. 1993, 140, 1526–1533. [Google Scholar] [CrossRef]
  21. Newman, J.; Thomas-Alyea, K. Electrochemical Systems, 3rd ed.; Wiley-Interscience: Hoboken, NJ, USA, 2004. [Google Scholar]
  22. Sulzer, V.; Marquis, S.; Timms, R.; Robinson, M.; Chapman, S.J. Python battery mathematical modelling (PyBaMM). J. Open Res. Softw. 2021, 9, 14. [Google Scholar] [CrossRef]
  23. Seals, D.; Ramesh, P.; D’Arpino, M.; Canova, M. Physics-Based Equivalent Circuit Model for Lithium-Ion Cells via Reduction and Approximation of Electrochemical Model. SAE Int. J. Adv. Curr. Prac. Mobil. 2022, 4, 1154–1165. [Google Scholar] [CrossRef]
Figure 1. (a) Lithium-ion battery schematic. (b) 2-RC pair equivalent circuit model of the battery.
Batteries 10 00215 g001
Figure 2. Voltage profile at 1C-rate discharge and 25 °C ambient temperature.
Batteries 10 00215 g002
Figure 3. Temperature profile at 1C-rate discharge and 25 °C ambient temperature.
Batteries 10 00215 g003
Figure 4. Voltage profile at 25 °C ambient temperature and 2C and 3C discharge rates.
Batteries 10 00215 g004
Figure 5. Temperature profile at 25 °C ambient temperature and 2C and 3C discharge rates.
Batteries 10 00215 g005
Figure 6. Voltage profile at 1C-rate discharge and 5 °C and 35 °C ambient temperatures.
Batteries 10 00215 g006
Figure 7. Temperature profile at 1C-rate discharge and 5 °C and 35 °C ambient temperatures.
Batteries 10 00215 g007
Figure 8. A 1-RC pair equivalent circuit model of a battery.
Batteries 10 00215 g008
Figure 9. Current and voltage profile HPPC test at 25 °C and 4.85 A discharge current.
Batteries 10 00215 g009
Figure 10. Single pulse discharge at 75% SOC and 25 °C.
Batteries 10 00215 g010
Figure 11. OCV–SOC relationship at 25 °C ambient temperature.
Batteries 10 00215 g011
Figure 12. R0 Vs SOC at three different ambient temperatures.
Batteries 10 00215 g012
Figure 13. C1 Vs ambient temperature.
Batteries 10 00215 g013
Figure 14. Lumped battery thermal system.
Batteries 10 00215 g014
Figure 15. Terminal voltage profile for a 1C-rate charging cycle and 25 °C ambient temperature.
Batteries 10 00215 g015
Figure 16. Terminal voltage output profile of Electro Chem model and Analytical model for a 1C-rate discharging cycle and 25 °C ambient temperature.
Batteries 10 00215 g016
Figure 17. Temperature profile for a 1C-rate charging cycle and 25 °C ambient temperature.
Batteries 10 00215 g017
Figure 18. Temperature profile at for a 1C-rate discharging cycle and 25 °C ambient temperature.
Batteries 10 00215 g018
Figure 19. Terminal voltage output profile of Electro Chem model and Analytical model for a 1C-rate discharging cycle and 40 °C ambient temperature.
Batteries 10 00215 g019
Figure 20. Temperature output profile of Electro Chem model and Analytical model at for a 1C-rate discharging cycle and 40 °C ambient temperature.
Batteries 10 00215 g020
Figure 21. Terminal voltage profile for a 1C-rate discharging cycle and 10 °C ambient temperature.
Batteries 10 00215 g021
Figure 22. Temperature profile at for a 1C-rate discharging cycle and 10 °C ambient temperature.
Batteries 10 00215 g022
Figure 23. Terminal voltage profile for a 1C-rate discharging cycle and 25 °C ambient temperature.
Batteries 10 00215 g023
Figure 24. Temperature profile for a 1C-rate discharging cycle and 25 °C ambient temperature.
Batteries 10 00215 g024
Figure 25. Terminal voltage profile for 1RC and 2RC analytical models for a 1C-rate discharging cycle and 25 °C ambient temperature.
Batteries 10 00215 g025
Table 1. List of electrochemical parameters.
ParameterValue
Positive electrode active material volume fraction0.65
Positive electrode porosity0.35
Negative electrode active material volume fraction0.75
Negative electrode porosity0.25
Positive electrode thickness, m7.56 × 10−5
Negative electrode thickness, m8.52 × 10−5
Open circuit voltage, V4.2
Table 2. List of fitted thermal parameters.
ParameterFinal Optimized Value
Contact resistance, Ohm0.001
Heat transfer coefficient, W/m2K25
Bruggeman exponents1.25
Table 3. List of fitted parameter equations for terminal voltage.
ParameterFitted Equation with Parameter Values
V0 0.42 e 6.5 S O C + 3.6 e 0.07 S O C + 0.708575 S O C 2
R0 ( 0.31071 0.00084 T )   s o c 2 + ( 0.45127 + 0.00126 T ) s o c + ( 0.392481 0.00111 T )
R10.0065
C1 3.7778 T 2 255.56 T + 9177.8
Table 4. List of parameter values for temperature prediction using Equation (21).
ParameterValues
Contact Resistance—Rcontact (Ω)1.2427 × 10⁻⁴
Area—A (m2)0.1616
Heat Transfer Coefficient—h (W/(m2K))20
Cell thermal mass—m (kg)0.06
Correction factor—Cf0.55
Disclaimer/Publisher’s Note: The statements, opinions and data contained in all publications are solely those of the individual author(s) and contributor(s) and not of MDPI and/or the editor(s). MDPI and/or the editor(s) disclaim responsibility for any injury to people or property resulting from any ideas, methods, instructions or products referred to in the content.

