Article

EIS Ageing Prediction of Lithium-Ion Batteries Depending on Charge Rates

by
Olivia Bruj
and
Adrian Calborean
*
National Institute for Research and Development of Isotopic and Molecular Technologies, 67-103 Donat, 400293 Cluj-Napoca, Romania
*
Author to whom correspondence should be addressed.
Batteries 2024, 10(7), 247; https://doi.org/10.3390/batteries10070247
Submission received: 30 May 2024 / Revised: 5 July 2024 / Accepted: 9 July 2024 / Published: 11 July 2024
(This article belongs to the Special Issue State-of-Health Estimation of Batteries)

Abstract

:
In the automotive industry, ageing mechanisms and diagnosis of Li-ion batteries depending on charge rate are of tremendous importance. With this in mind, we have investigated the lifetime degradation of lithium-ion battery cells at three distinct charging rates using Electrochemical Impedance Spectroscopy (EIS). Impedance spectra of high-energy Panasonic NCR18650B batteries have been analysed in light of two distinct approaches, namely the time-dependent evaluation of the Constant Phase Element (CPE), and the single parameter investigation of resonance frequency of the circuit. SOH percentages were used to validate our approach. By monitoring the CPE-Q parameter at different charge rates of 0.5 C, 1 C, and 1.5 C, respectively, we applied a degradation speed analysis, allowing us to predict a quantitative value of the LIBs. The results are in complete agreement with the resonance frequency single parameter analysis, in which quite a similar trend was obtained after the spline fitting.

1. Introduction

Due to their tremendous performance benefits [1,2,3,4], lithium-ion batteries (LIBs) have nowadays become indispensable in the development of modern society, being used in several applications including the automotive industry [5,6,7], energy storage platforms [8,9], advanced designs aerospace [10,11], defence [12], mobile power systems [13], etc. Various types of LIBs with distinct anode and cathode materials have been developed, as well as electrolytes and/or separators capable of offering a reliable integration of such complex application demands [14,15,16,17,18,19]. Their high energy density and voltage make them suitable to be employed in a large spectrum of applications that imply increased miniaturization. Moreover, they are highly superior in terms of leakage resistance under environmental variation due to the organic electrolytes that have a solidifying point much lower than aqueous solution electrolytes, thus offering better operation capabilities in a wide range of temperatures [17,18]. All these advantages of lithium batteries, in terms of technological engineering and environmental entanglement, clearly have the potential to innovate and improve our future [20], and, finally, to ensure a sustainable future.
Within the last decade, new lithium battery technologies have been developed based on different active material chemistry and structure/shape, with their own advantages and disadvantages related to cost, performance efficiency, life cycle, and safety [21,22,23,24,25,26,27,28,29,30,31]. The vast research in the field has brought significant refinements to lithium batteries [32,33,34,35,36,37].
However, the main working principle of Li-ion batteries is the same, namely, a battery is made up of several individual cells connected between them. Each cell encompasses three distinct parts: the cathode, the anode, and the liquid electrolyte. In the charging phase, lithium ions pass from the positive side to the negative one, while ions move in the opposite direction during the discharge phase. Between the charging/discharging phase, the separator (i.e., an insulating layer) blocks the electrons, allowing lithium ions to pass through the conductive material. These movements will then create a difference in electrical potential, a voltage corresponding to the electrical potential amount that a battery is capable of incorporating. A schematic illustration is shown in Figure 1, emphasizing the current Li-ion cell materials.
Despite the continuous development and technological engineering of new prototype materials, there is a strong demand for innovative diagnostic tools that are capable of managing an early identification of degradation processes that occur in lithium batteries [38,39,40]. We refer here to cells operating limits implying the inhomogeneous current distribution, temperature distribution, voltage, charge–discharge characteristics (during battery ageing), the performance decrease vs. time, etc.
The modelling of state of charge (SOC) and state of health (SOH), as essential parameters for the battery management system (BMS), were analysed by different approaches, encompassing mathematical algorithms [41,42], energy discharge level [43], neural network [44], data driven through convolutional and recurrent neural networks [45], or physics-based SOC algorithms applied in advanced BMS [46]. An interesting theoretical approach that can be further tested in LIBs is described by Máthé et al. [47,48], in which the electrical transport mechanisms can be analysed.
Another battery model is investigated using electrochemical impedance spectroscopy (EIS), in which the equivalent Randles circuit model describes the (nonlinear) operating characteristics of LIBs in terms of variable parameters such as resistance, capacitance, constant phase elements, or voltage source [49]. This method is capable of offering a detailed examination of physical chemistry processes that occur at both electrodes of lithium-ion batteries, thus offering important knowledge about the power delivery capabilities in LIBs [50,51,52]. A single experiment can divide and quantify in detail the characteristic shapes of impedance graphs in LIBs. As such, during the battery ageing cycling procedures, several Nyquist plots will be acquired and interpreted in terms of an equivalent circuit model, capable of providing insight phenomena of battery SOH and SOC (State of Charge). Due to continued technological improvement, this powerful characterization tool is currently used in various particular domains, such as corrosion [53], supercapacitors [54], catalysts [55], or fuel cells [56].
In these perspectives, we have applied in this work the EIS analysis of three commercial Panasonic NCR18650B batteries with the aim of accurately predicting their degradation speed depending on the variation of charging rates from 0.5 C to 1 C and 1.5 C. Their performance and durability analysis depending on the charge rate have first been investigated by gathering the data of impedance modifications. The dependence of the values for parameters of the Randles circuit was analysed, with particular attention paid to constant phase element (CPE) time-dependent behaviour. Moreover, we employed a second approach for the evaluation of Li-ion batteries vs. charge rate, which has been used successfully in our previous works [57,58], in the framework of a single parameter, namely the resonance frequency of the circuit. A spline fitting has been applied, and the rate of change has been determined for each charging rate.

2. Materials and Methods

2.1. Lithium Batteries

Three commercially 3.25 Ah Panasonic NCR18650B-type batteries, Japan (referred to as B1, B2, and B3, respectively) have been purchased from the market and used as part of this study. The battery characteristics, together with the cell type graphical image, are summarized in Table 1. Due to their particular features, such as good life cycle performance, high energy density, low self-discharge, long storage reliability through reduced metal elution, and durability in actual use [59], this particular type of lithium battery has been used in TESLA MODEL S previous model, and as a consequence, received a lot of attention in recent years [60,61]. Currently, this Panasonic type is also used on e-bike accumulators [62] and is described as optimal for notebook PCs, boosters, portable devices, etc. [63].

2.2. Experimental Set-Up

A VSP multichannel potentiostat from BioLogic, controlled by EC-Lab software (V11.46), was used for impedance battery characterization. The battery measurement setup is shown in Figure 2, in which the VSP and its modules are shown in the back. The battery holder of each battery is connected to the VSP cables by means of crocodile clips. In terms of working procedure, the potentiostat registers the impedance measurements by applying a potential wave to the WE (working electrode) and then records as a spectrum the resulting current waves at different frequencies. Thus, it will analyse the impedance Z as the real part of impedance Z′ vs. the imaginary part of Z″. A schematic illustration of the measurement process is shown in Figure 2-right.
All the EIS measurements were performed in a controlled temperature room, in which the temperature was set to 21 degrees, all along the period (several months of cycling). We are fully aware of the impact of temperature effects on lithium-ion batteries, in which the electrochemical reactions that govern the lithium batteries’ performance are susceptible to temperature variations, but the scope of this paper is not focused in this direction.

2.3. Electrochemical Impedance Spectroscopy (EIS)

EIS was employed as a key approach in the modelling and characterization of electrochemical reaction in our Li-ion batteries. Being capable of scanning from rather high (MHz) to low (mHz) frequencies, we were allowed to correlate the elements of battery cell models within the physical chemical mechanisms that occur inside their dynamic behaviour. Within a single scan, most of the processes, from slowest to fastest, can be analysed and separated, thus highlighting the influence of various components in terms of double-layer capacity, electron transfer resistance, diffusion, etc.
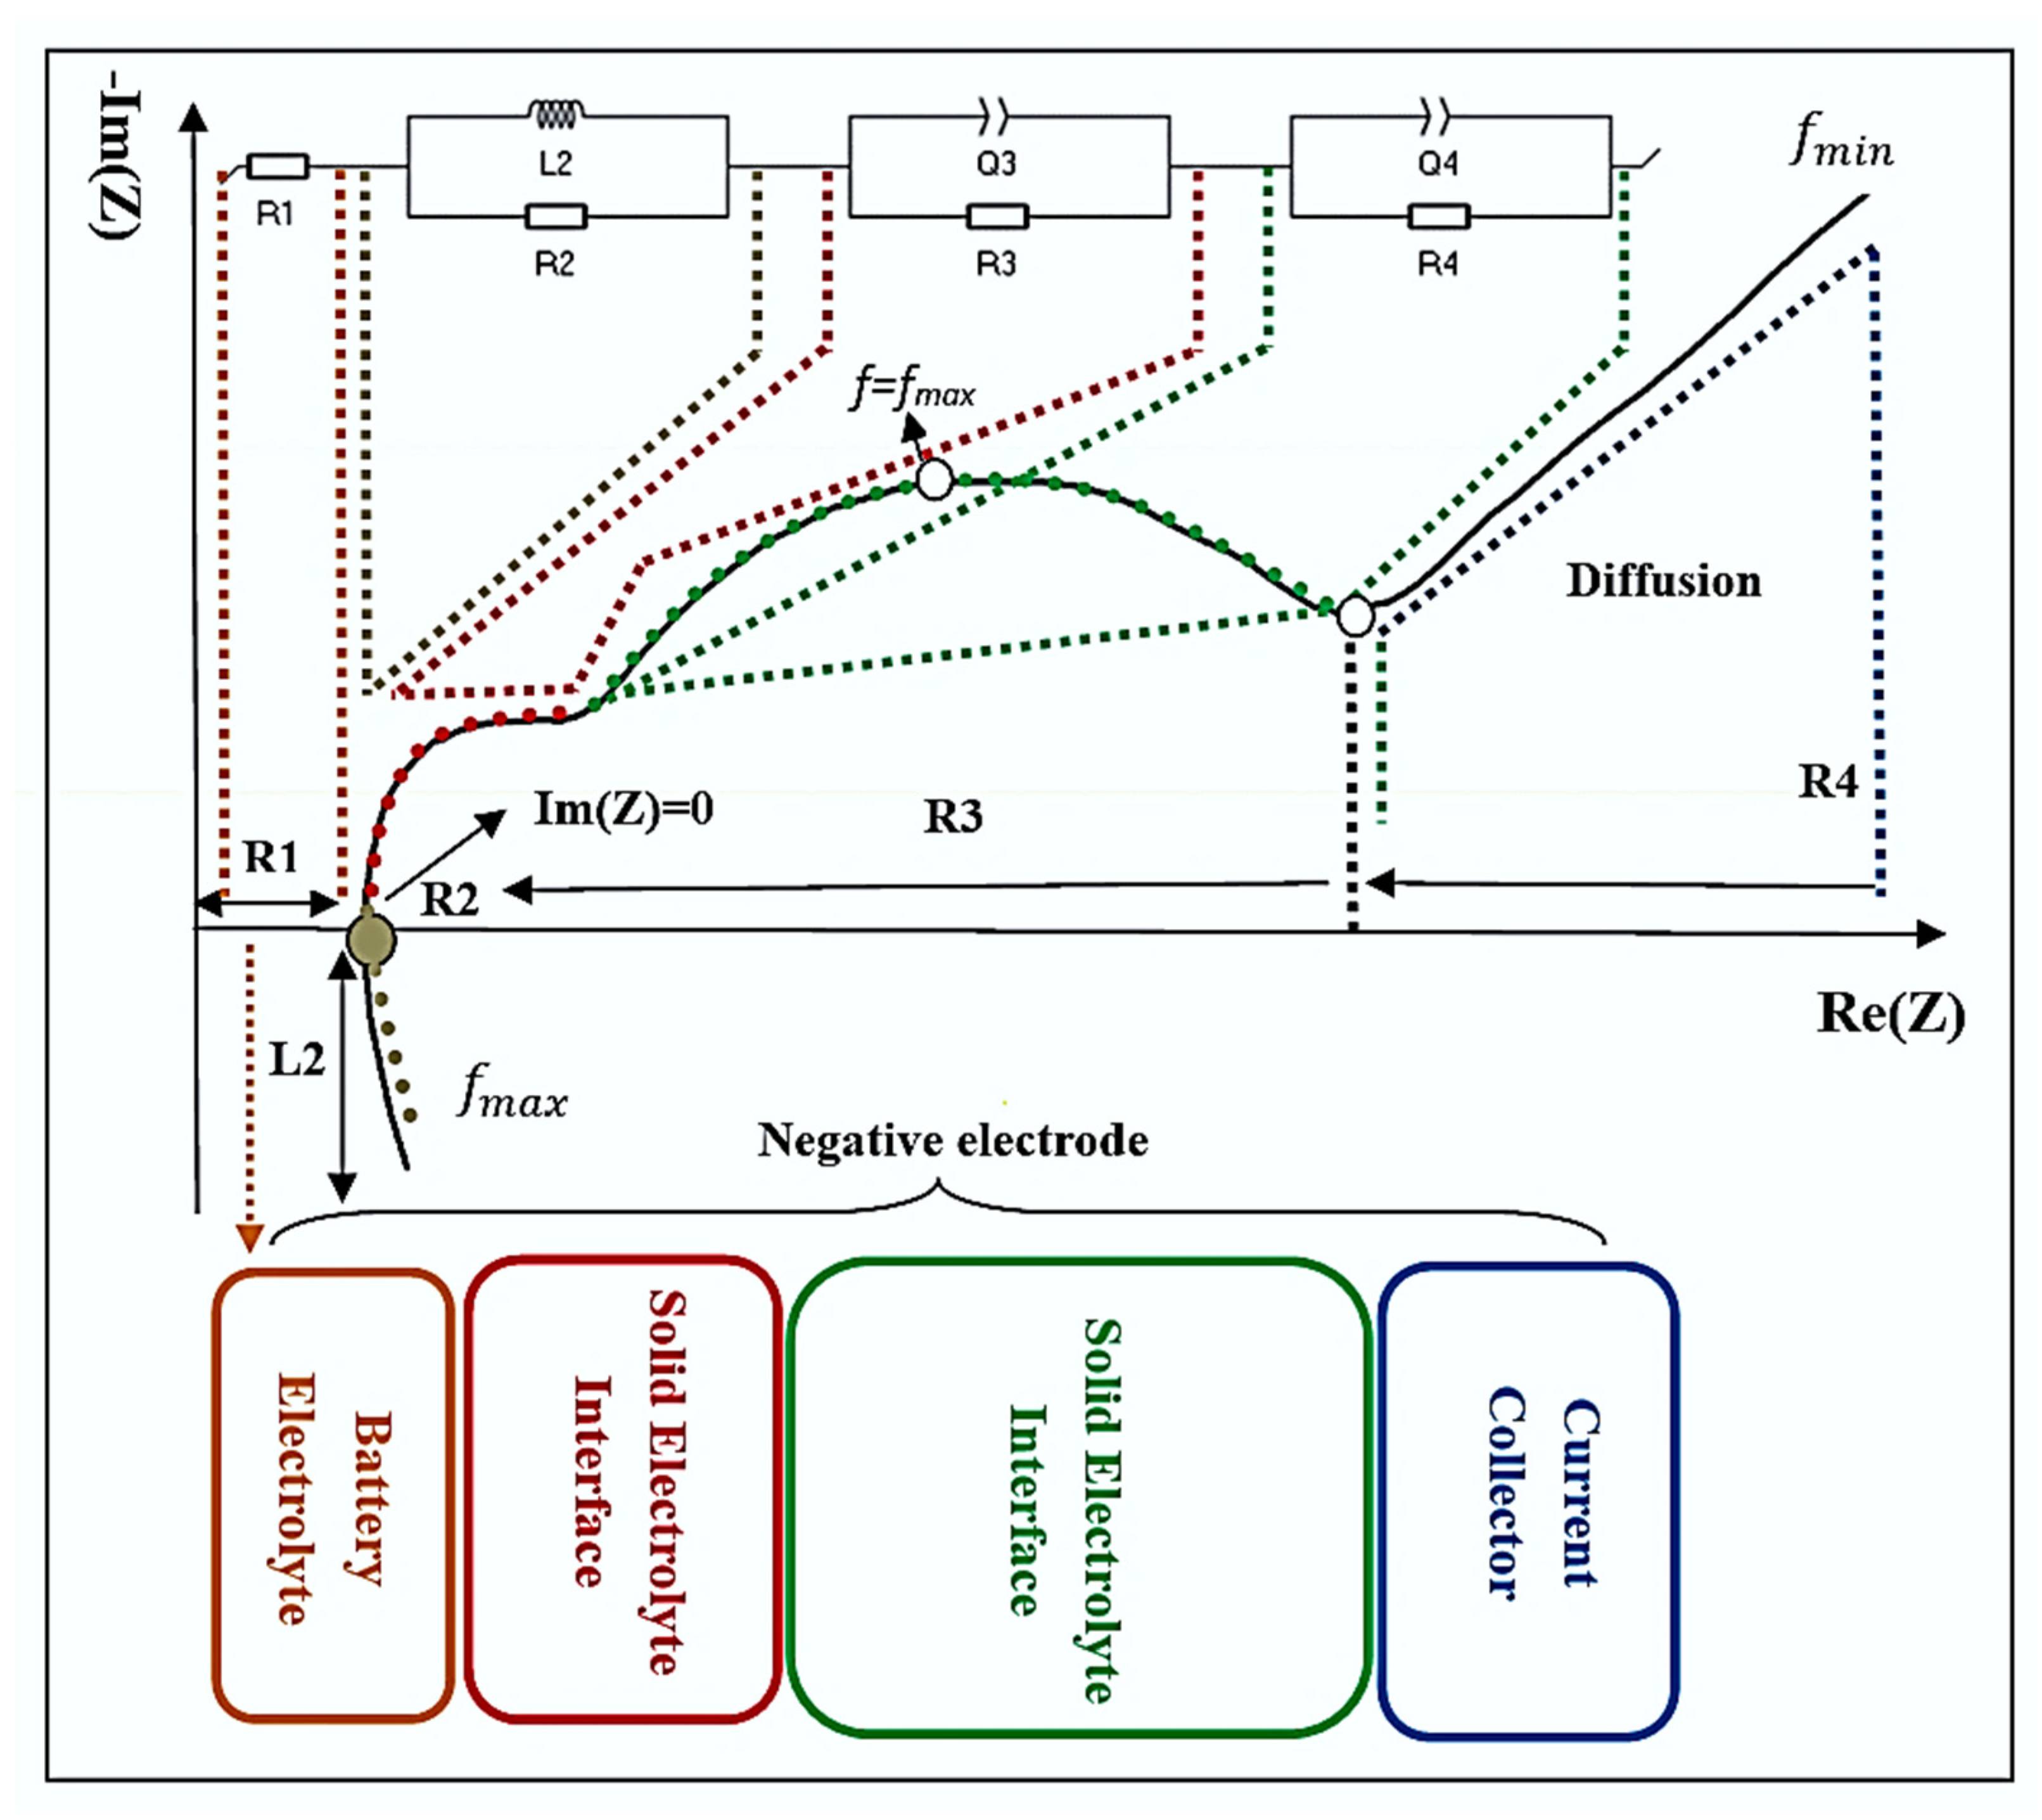
The electrical equivalent circuit has been induced by the identification of characteristic shapes of impedances graphs. In Figure 3-top, the Nyquist diagram for Li-ion batteries within the equivalent Randles circuit is schematically shown. As can be observed, the results of EIS analysis are described in the framework of an imaginary part of the impedance vs. the real part. The very high frequency domain is related to the L2 inductor and the resistor R2, directly implicated in the conduction trial at the crossing of impedance spectrum and the real axis (Im(Z) = 0). Within the decrease of frequency, two arcs related to the presence of the solid electrolyte interface and to the charge transfer mechanisms are described by the resistor R3 and the Constant Phase Element CPE-Q3 (the small semicircle), and R4 and CPE-Q4, respectively (the larger semi-circle). The last semicircle is usually associated with the charge transfer mechanism and the double layer capacitance, while the last domain at small frequencies corresponds to the diffusion case.
In order to describe the arcs as a representation of the CPE and a resistor, the impedance of Q depending on a frequency can be deducted by following the formula:
Z C P E f = 1 Q j x 2 π f α
where Q is the impedance coefficient and α represents the order.

2.4. Ageing Method Protocol

At the beginning of the workflow, the new batteries have been cycled four times for initial capacity measurement. The EIS measurements were performed in the VMP3B-5 module, using Potentio Electrochemical Impedance Spectroscopy (PEIS) technique. This technique can be selected from the stand-alone PEIS module or added using the Modulo Bat (MB) technique. Thus, in the simplified PEIS sequence under MB, the sinus signal was applied only around the DC potential close to the equilibrium state. It is important to mention that this approach can easily lead to overcharging in a fully charged Li-ion cell, especially at low frequencies (below 50 mHz).
The PEIS settings in the stand-alone module allow us to superimpose a sinus signal over a fixed DC potential, E, which is sufficiently small, so the upper voltage limit is not exceeded at low frequencies. A total of 10 mV has been set for the fixed potential and the frequency ranges between 5 mHz and 10 kHz. The sinus amplitude is 20 mV and two measures per frequency were used for the recordings. Before each PEIS measurement, thirty minutes of relaxation time have been imposed, and then we have verified the state of the battery at the end of the relaxation period. The difference in the voltage change after 30 min is less than 0.032%; therefore, we consider that the cell is in a stable state.
Two PEIS measurements have been employed in this experiment: one in the fully charged state and the other in the fully discharged state. The PEIS data obtained in the discharged state have no risk of overcharging; therefore, the DC potential around the equilibrium state can be used.
The initial capacity of all three batteries had closely related values. The ageing process has been implemented according to the workflow diagram in Figure 4. The discharge current for all the experiments has been set to 1.5 C as a compromise between fast discharge and battery degradation. If the discharge current is too high, the desired parameters analysis is then compromised.
The current limitation during the CV charging has been set to 200 mA, otherwise the overcharge during the PEIS sequence will force the device to pause the experiment in order to avoid damage. This is most likely to occur for the charging current of 0.5 C, where the charge build-up is maximum. The ageing duration varied according to the charge current and battery degradation. As Li-ion batteries can withstand a high number of charge/discharge cycles, the PEIS technique has been employed every fourth charge/discharge cycle in order to reduce the amount of data for the processing stage. The ageing process ended when the battery capacity dropped below 65%. We extended the end-of-life capacity from 80% as it is set for the EV industry so that the frequency resonance becomes clearer.

3. Results and Discussion

3.1. Dependence of Li-Ion Batteries Impedance on the SOH vs. Charge Rate

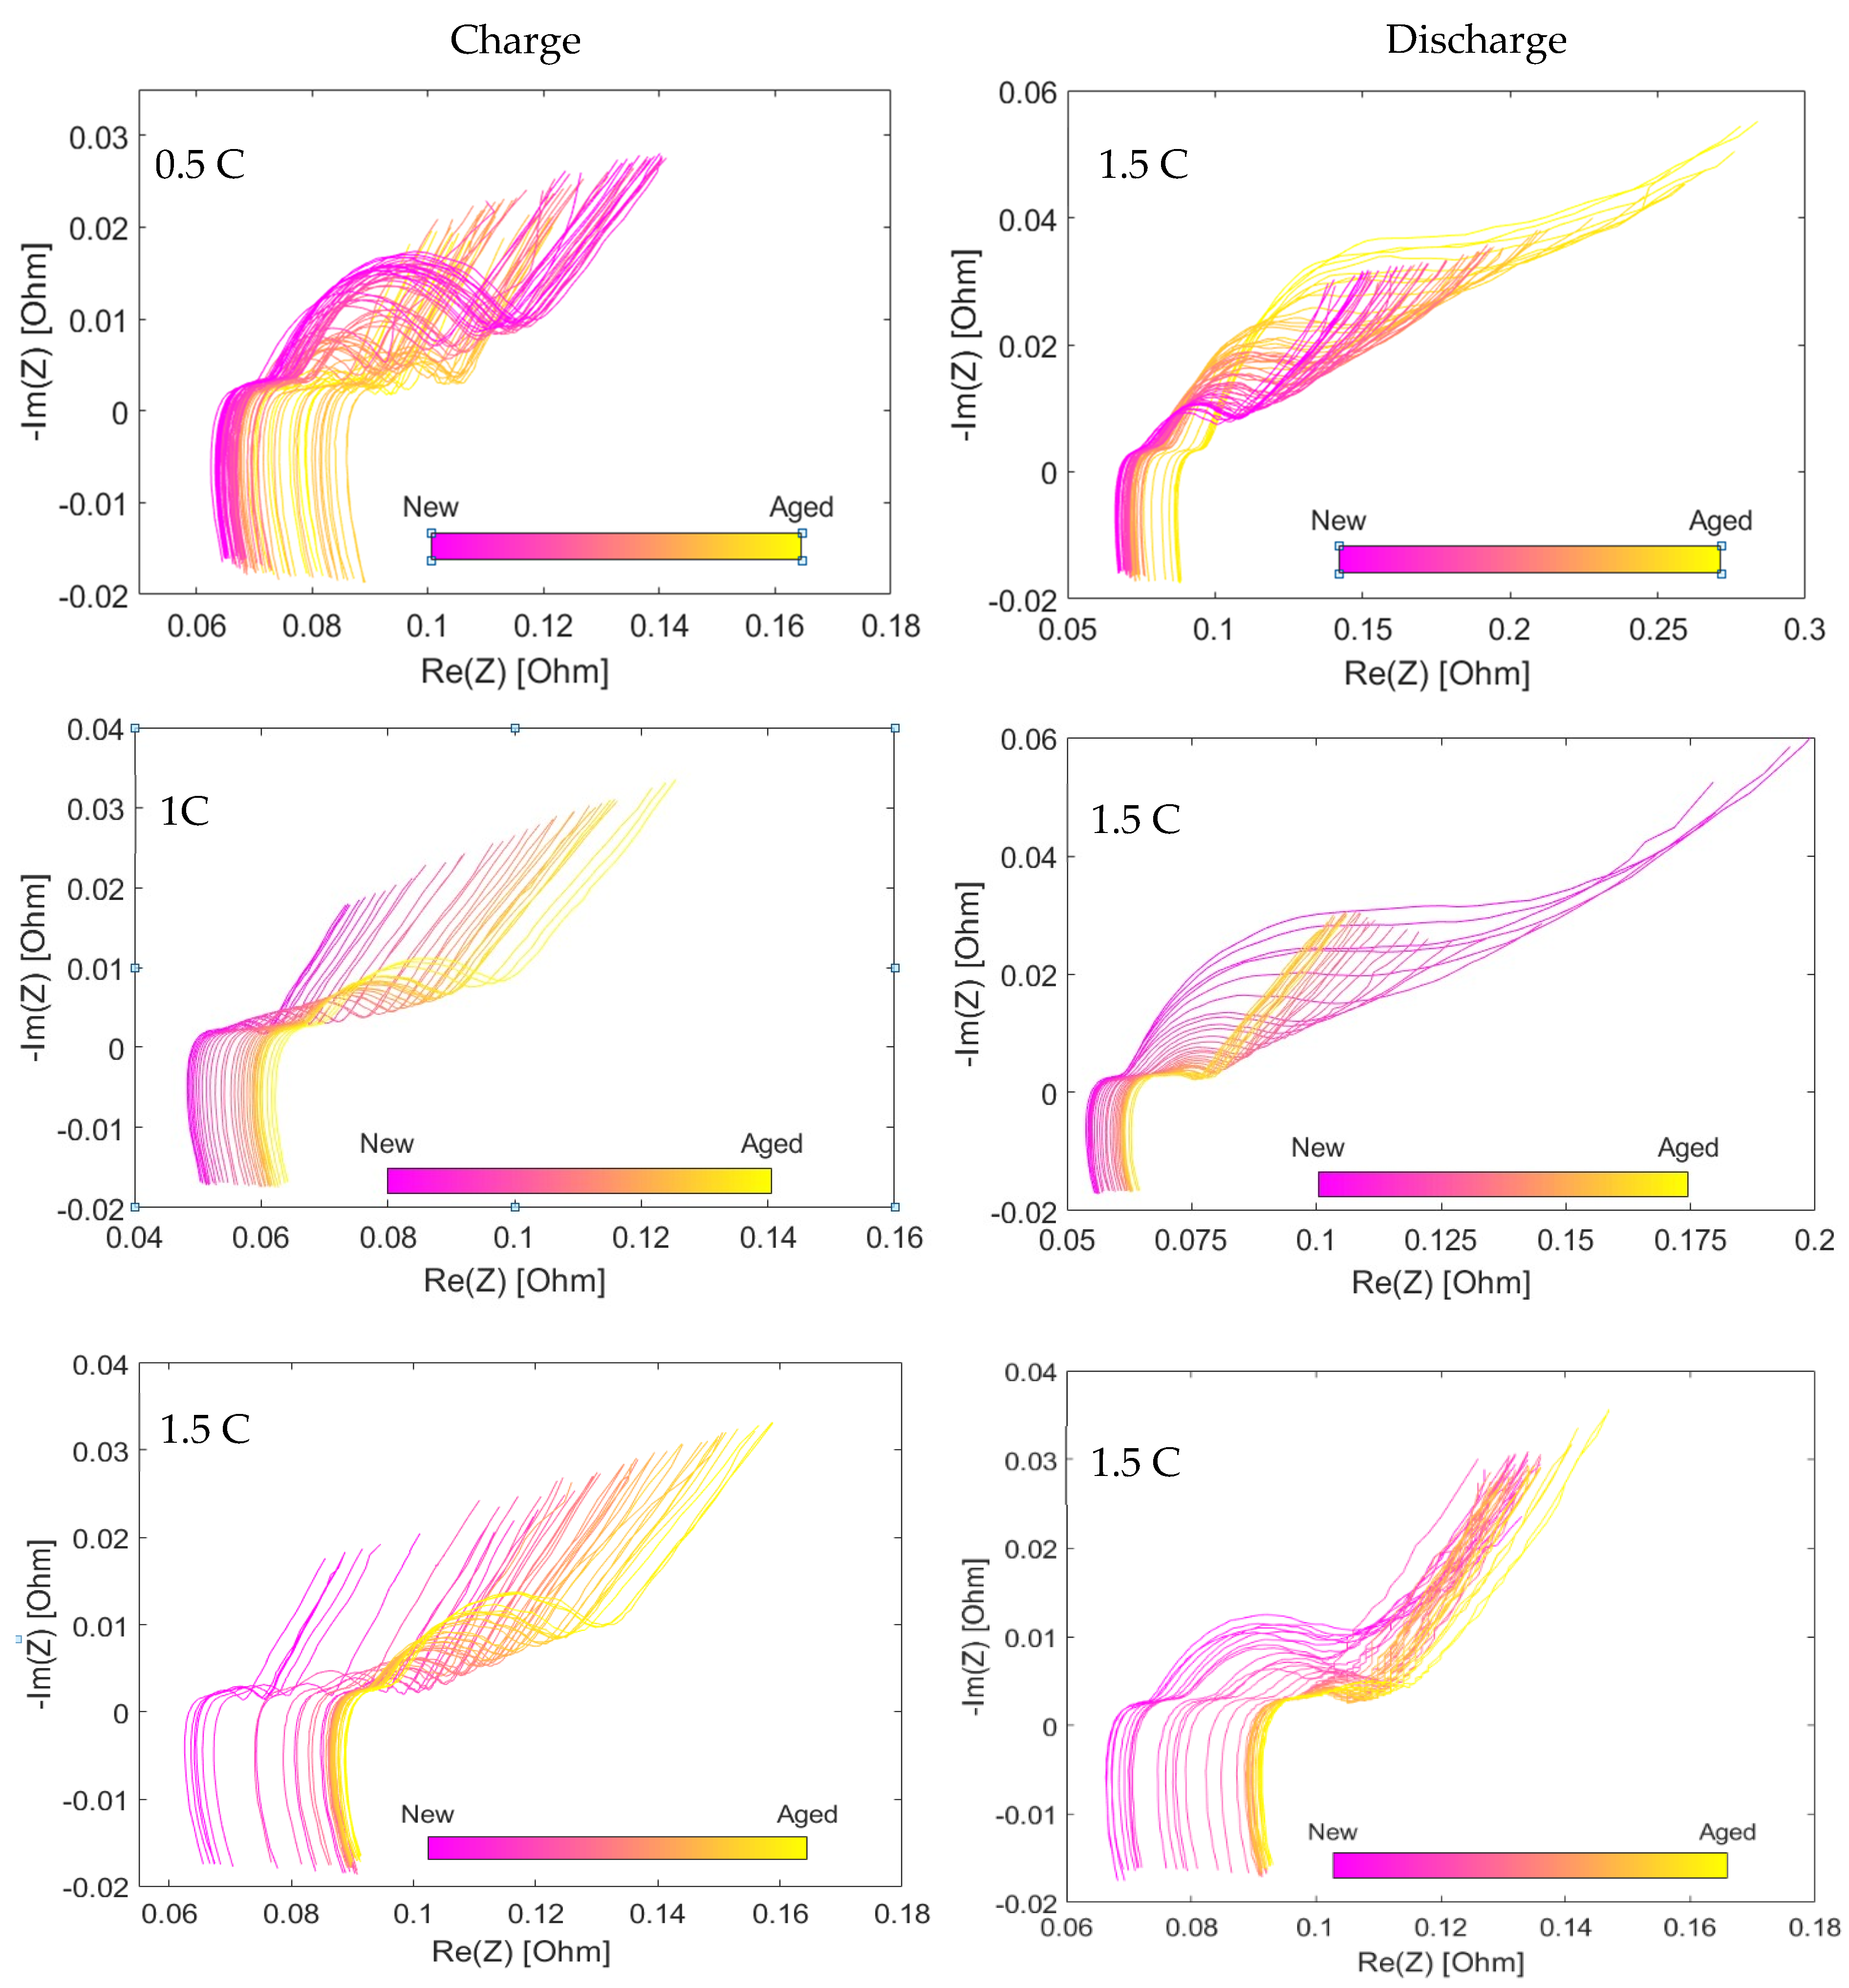
The dependence of the three batteries’ impedance spectra on the SOH is explored at different Icharge, from 0.5 C to 1 C and 1.5 C, respectively. Figure 5 emphasises the results of Nyquist diagrams in both cycling states of charging and discharging.
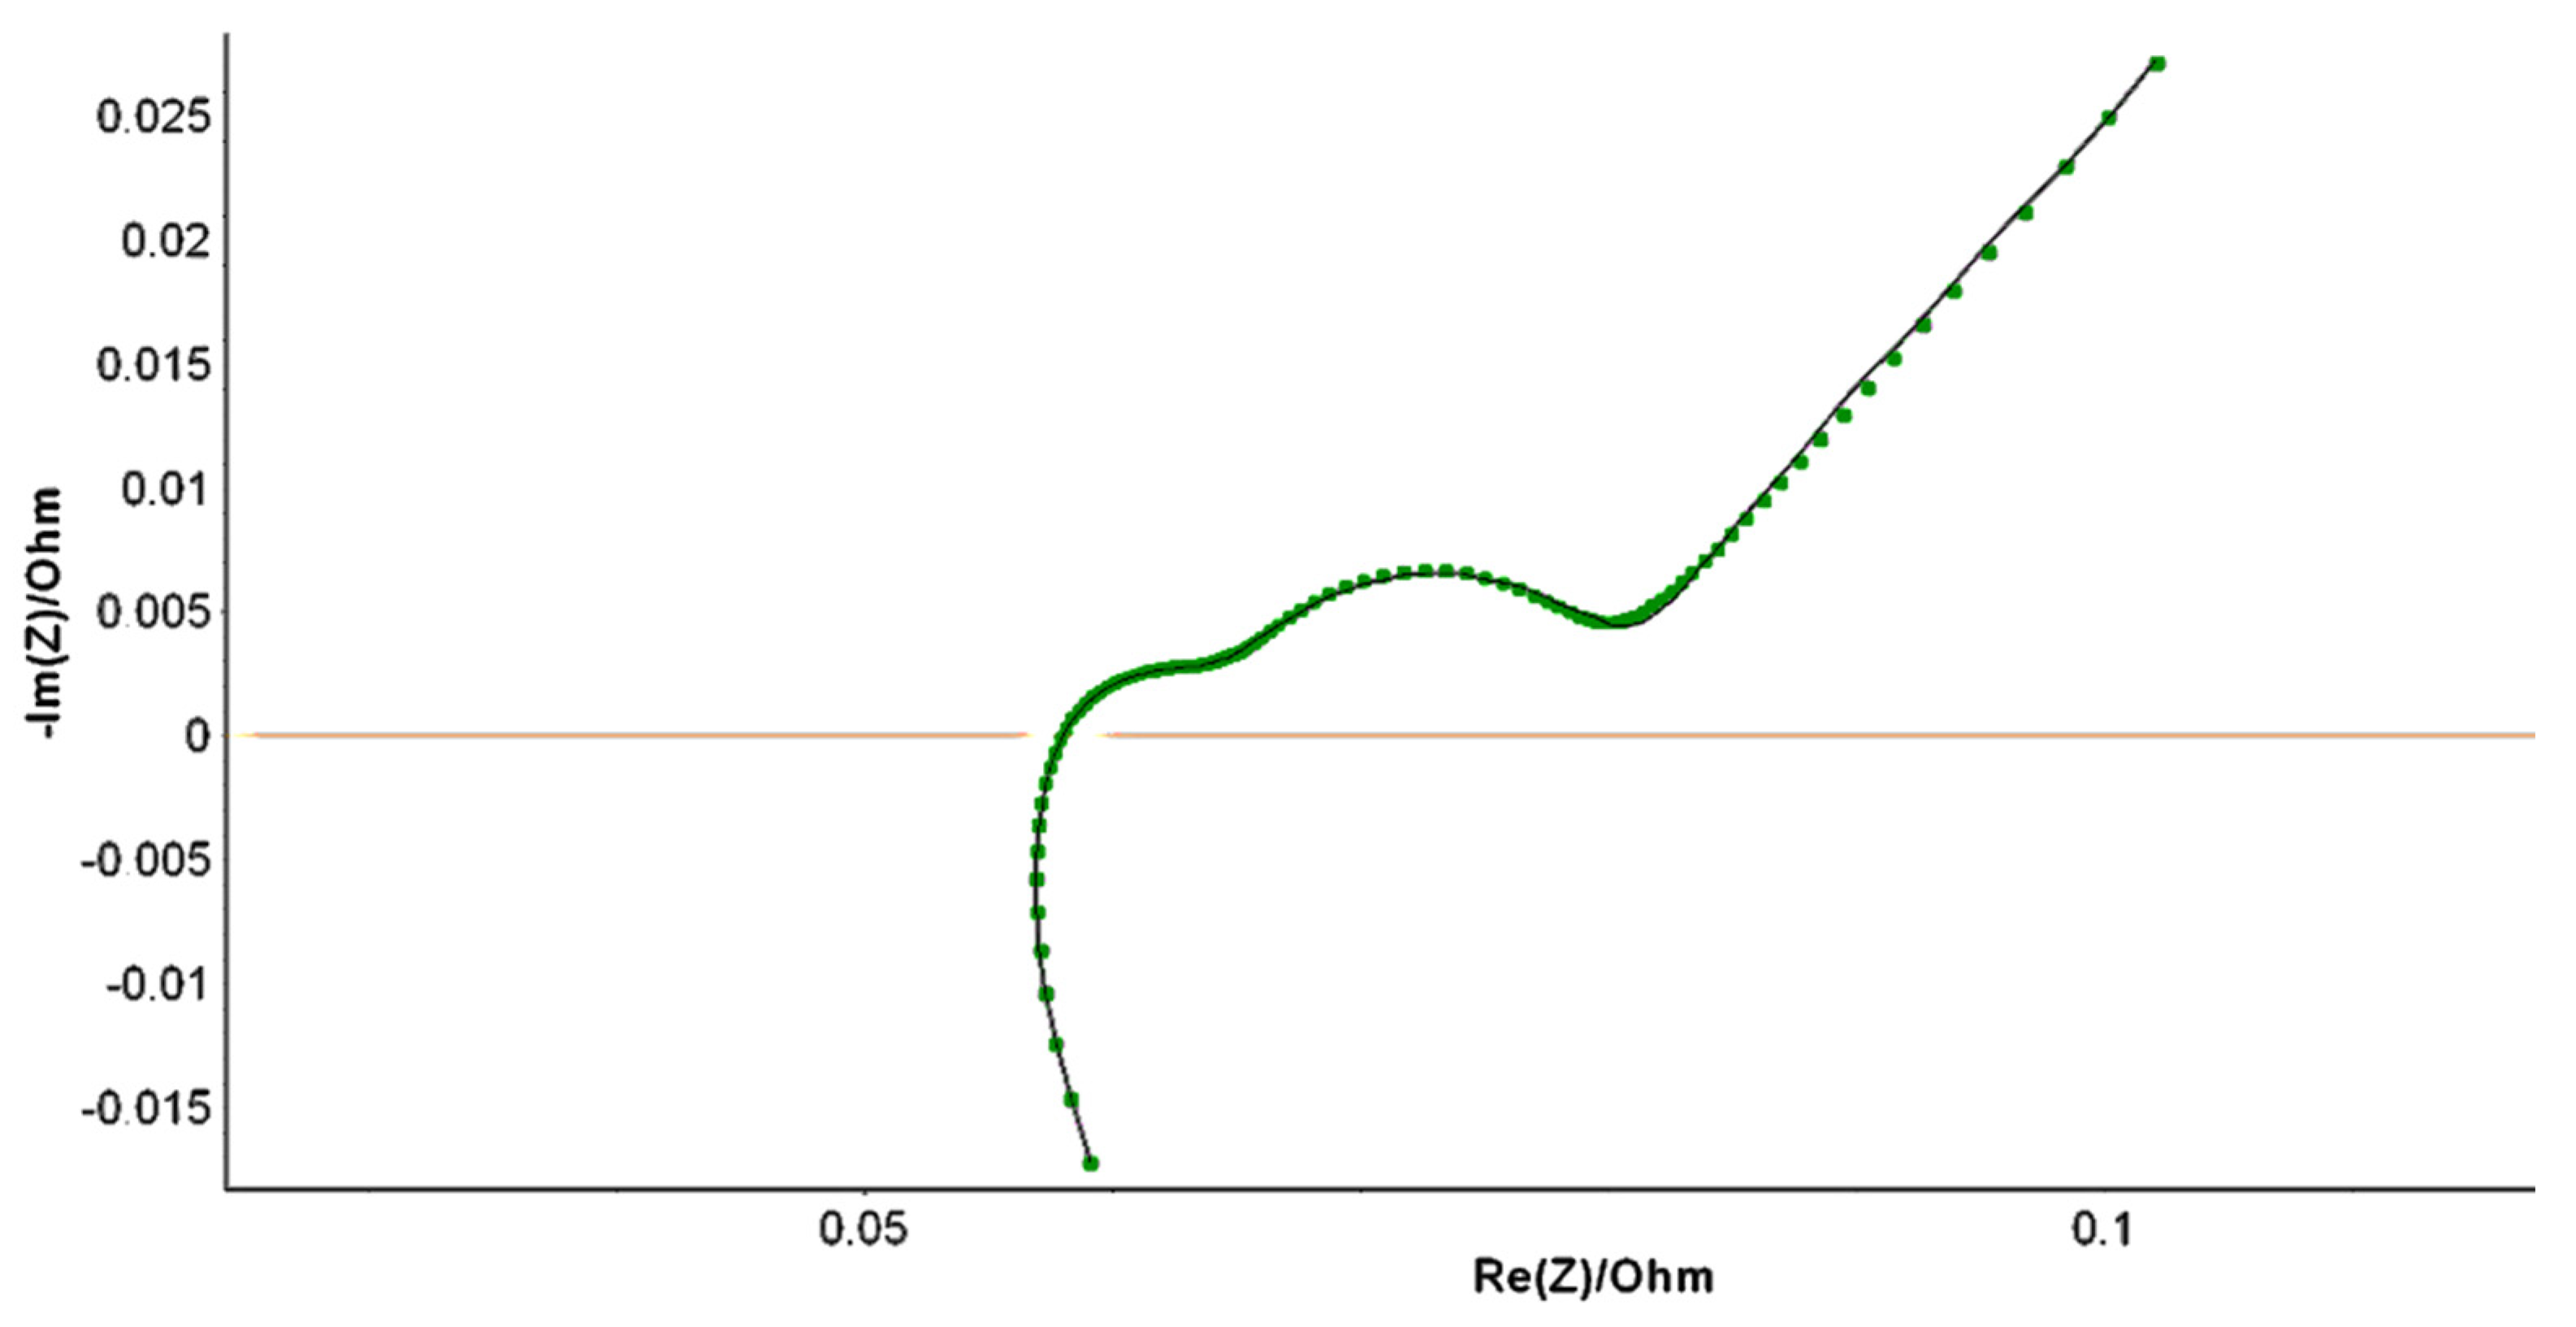
The evolution to the right of the impedance spectra during the ageing process is illustrated by different colours, being directly related to the Li battery’s internal reactions. There is a smooth battery ageing, highlighting in all cases a decreasing performance of usage and time. Nevertheless, the Nyquist shape plots are similar to that found in the literature, separated into four major areas as follows: (1) high frequencies, which are related to an inductive effect determined by the cylindrical cell geometry and/or porosity of the electrode plates; (2) the total value of the ohmic resistance, impedance spectrum intercepting the real axis; (3) middle frequencies, related to the semicircles on the Nyquist curves, which mainly correspond to the solid electrolyte interface or separator; and (4) low frequencies that are attributed to the diffusion effects. The first semicircle belongs to the relaxation of charge carriers at the solid-electrolyte interface (see also Figure 3), and the second semicircle is subordinate to the electrode potential, shaped by a double-layer capacitance and charge-transfer resistance. At the end of the semicircle in low-frequency ranges, a spike is present, corresponding to thee Li+ cation diffusion process in the solid-state phase. Figure 6 shows an example of a Nyquist curve fit.
The fitting of the Nyquist curves exhibits high similarities between the measured spectrum and the fitted spectrum. In order to quantify the quality of the fit, we analysed the error coefficient for each value of ν, defined as the mean squared error divided by the average value of the impedance. This has an advantage over the mean squared error since it indicates the error as a fraction. This is computed according to EC-Lab, using the following formula:
χ = N i = 1 Z f i t i Z e x p i 2 Z e x p i
in which the fit tab specifies the fitting conditions set for the fitting procedure in terms of number of iterations, relative error, and fit duration. The simplex method has been applied as a minimisation method by minimizing the criterion χ 2 , using the following formula:
χ 2 = i = 1 N I m e a s E i I s i m u l E i ,   p a r a m 2
where I m e a s E i is the current value at the potential E i of the experimental voltammogram and I s i m u l E i ,   p a r a m is the simulated current, which is a function of the chosen mechanism. Usual values for the error coefficient χ are between 1 and 3%.
We are also aware that the appearance of a semi-circle in the Q3 region is unusual for pristine commercial cells and typically appears later in the cell’s life cycle. However, the appearance is due to the many PEIS curves, and because they were cycled four times prior aging protocol for capacity determination, as was mentioned previously in Section 2.4. For clarity, please see below in Figure 7 the first three PEIS curves for the B1 (0.5 C) battery, in which the first semicircle is not present at all.
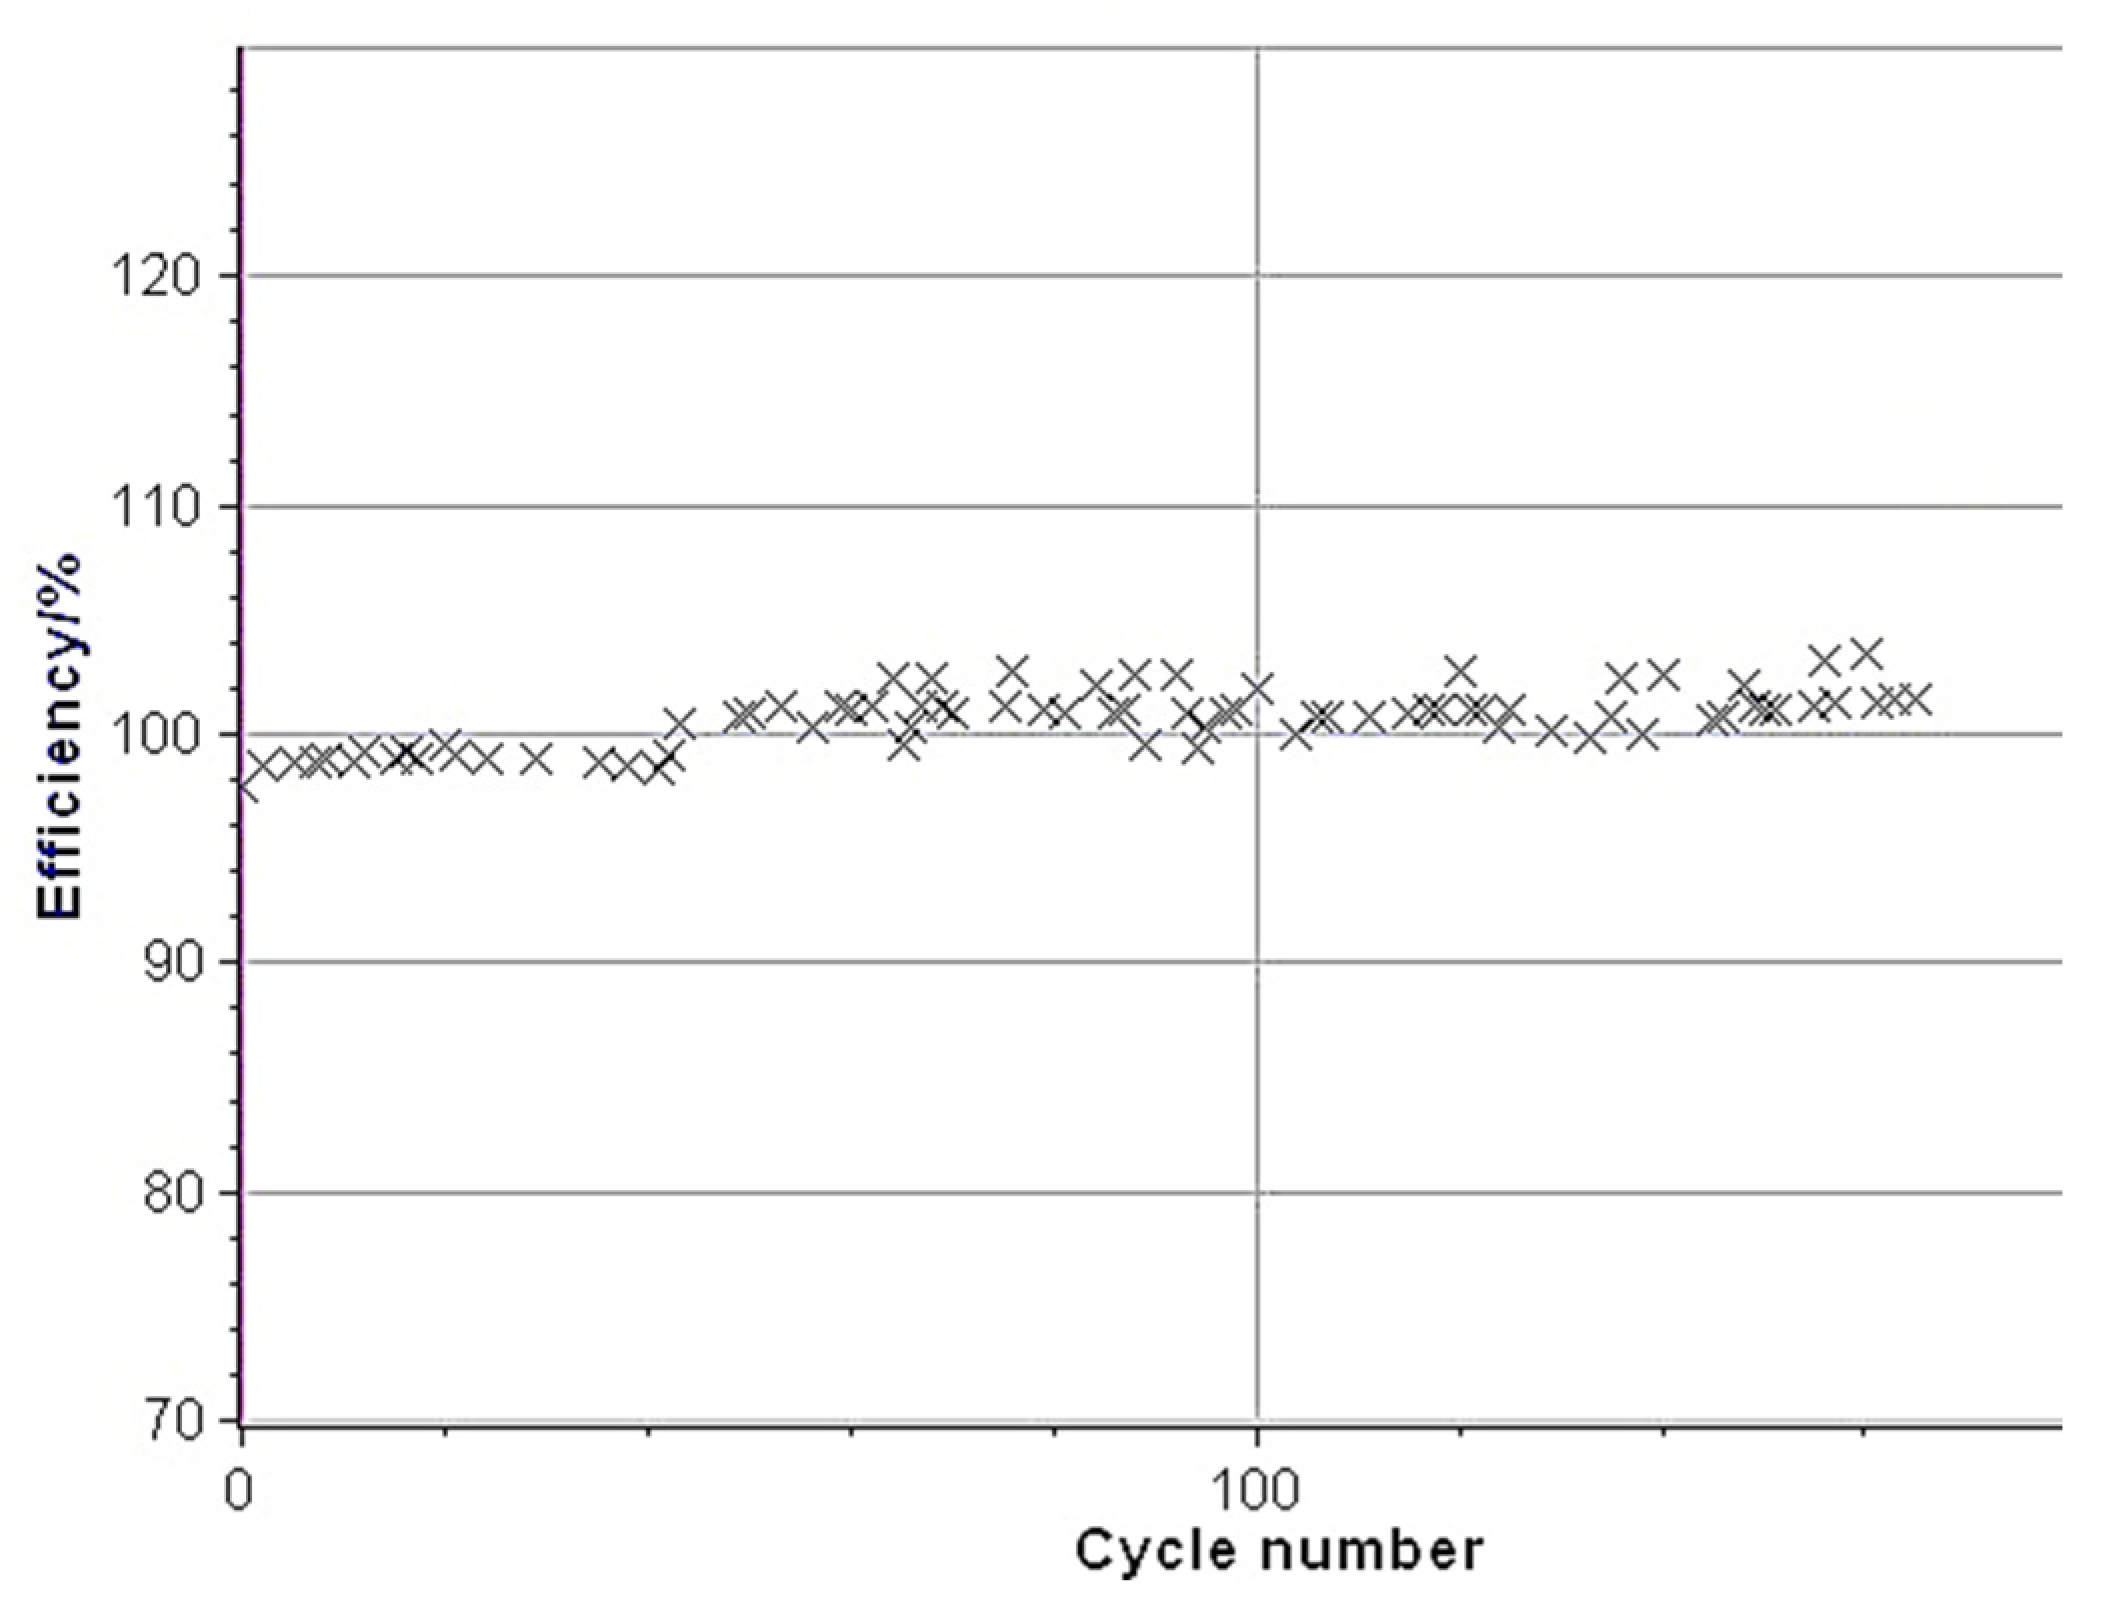
We have also plotted the efficiency in Figure 8 as an example for the B1 type in order to verify if the batteries are all in a good state. Their capacity was tested before the ageing process.

3.2. Variation of the Equivalent Electrical Circuit CPE-Q Parameter with SOH

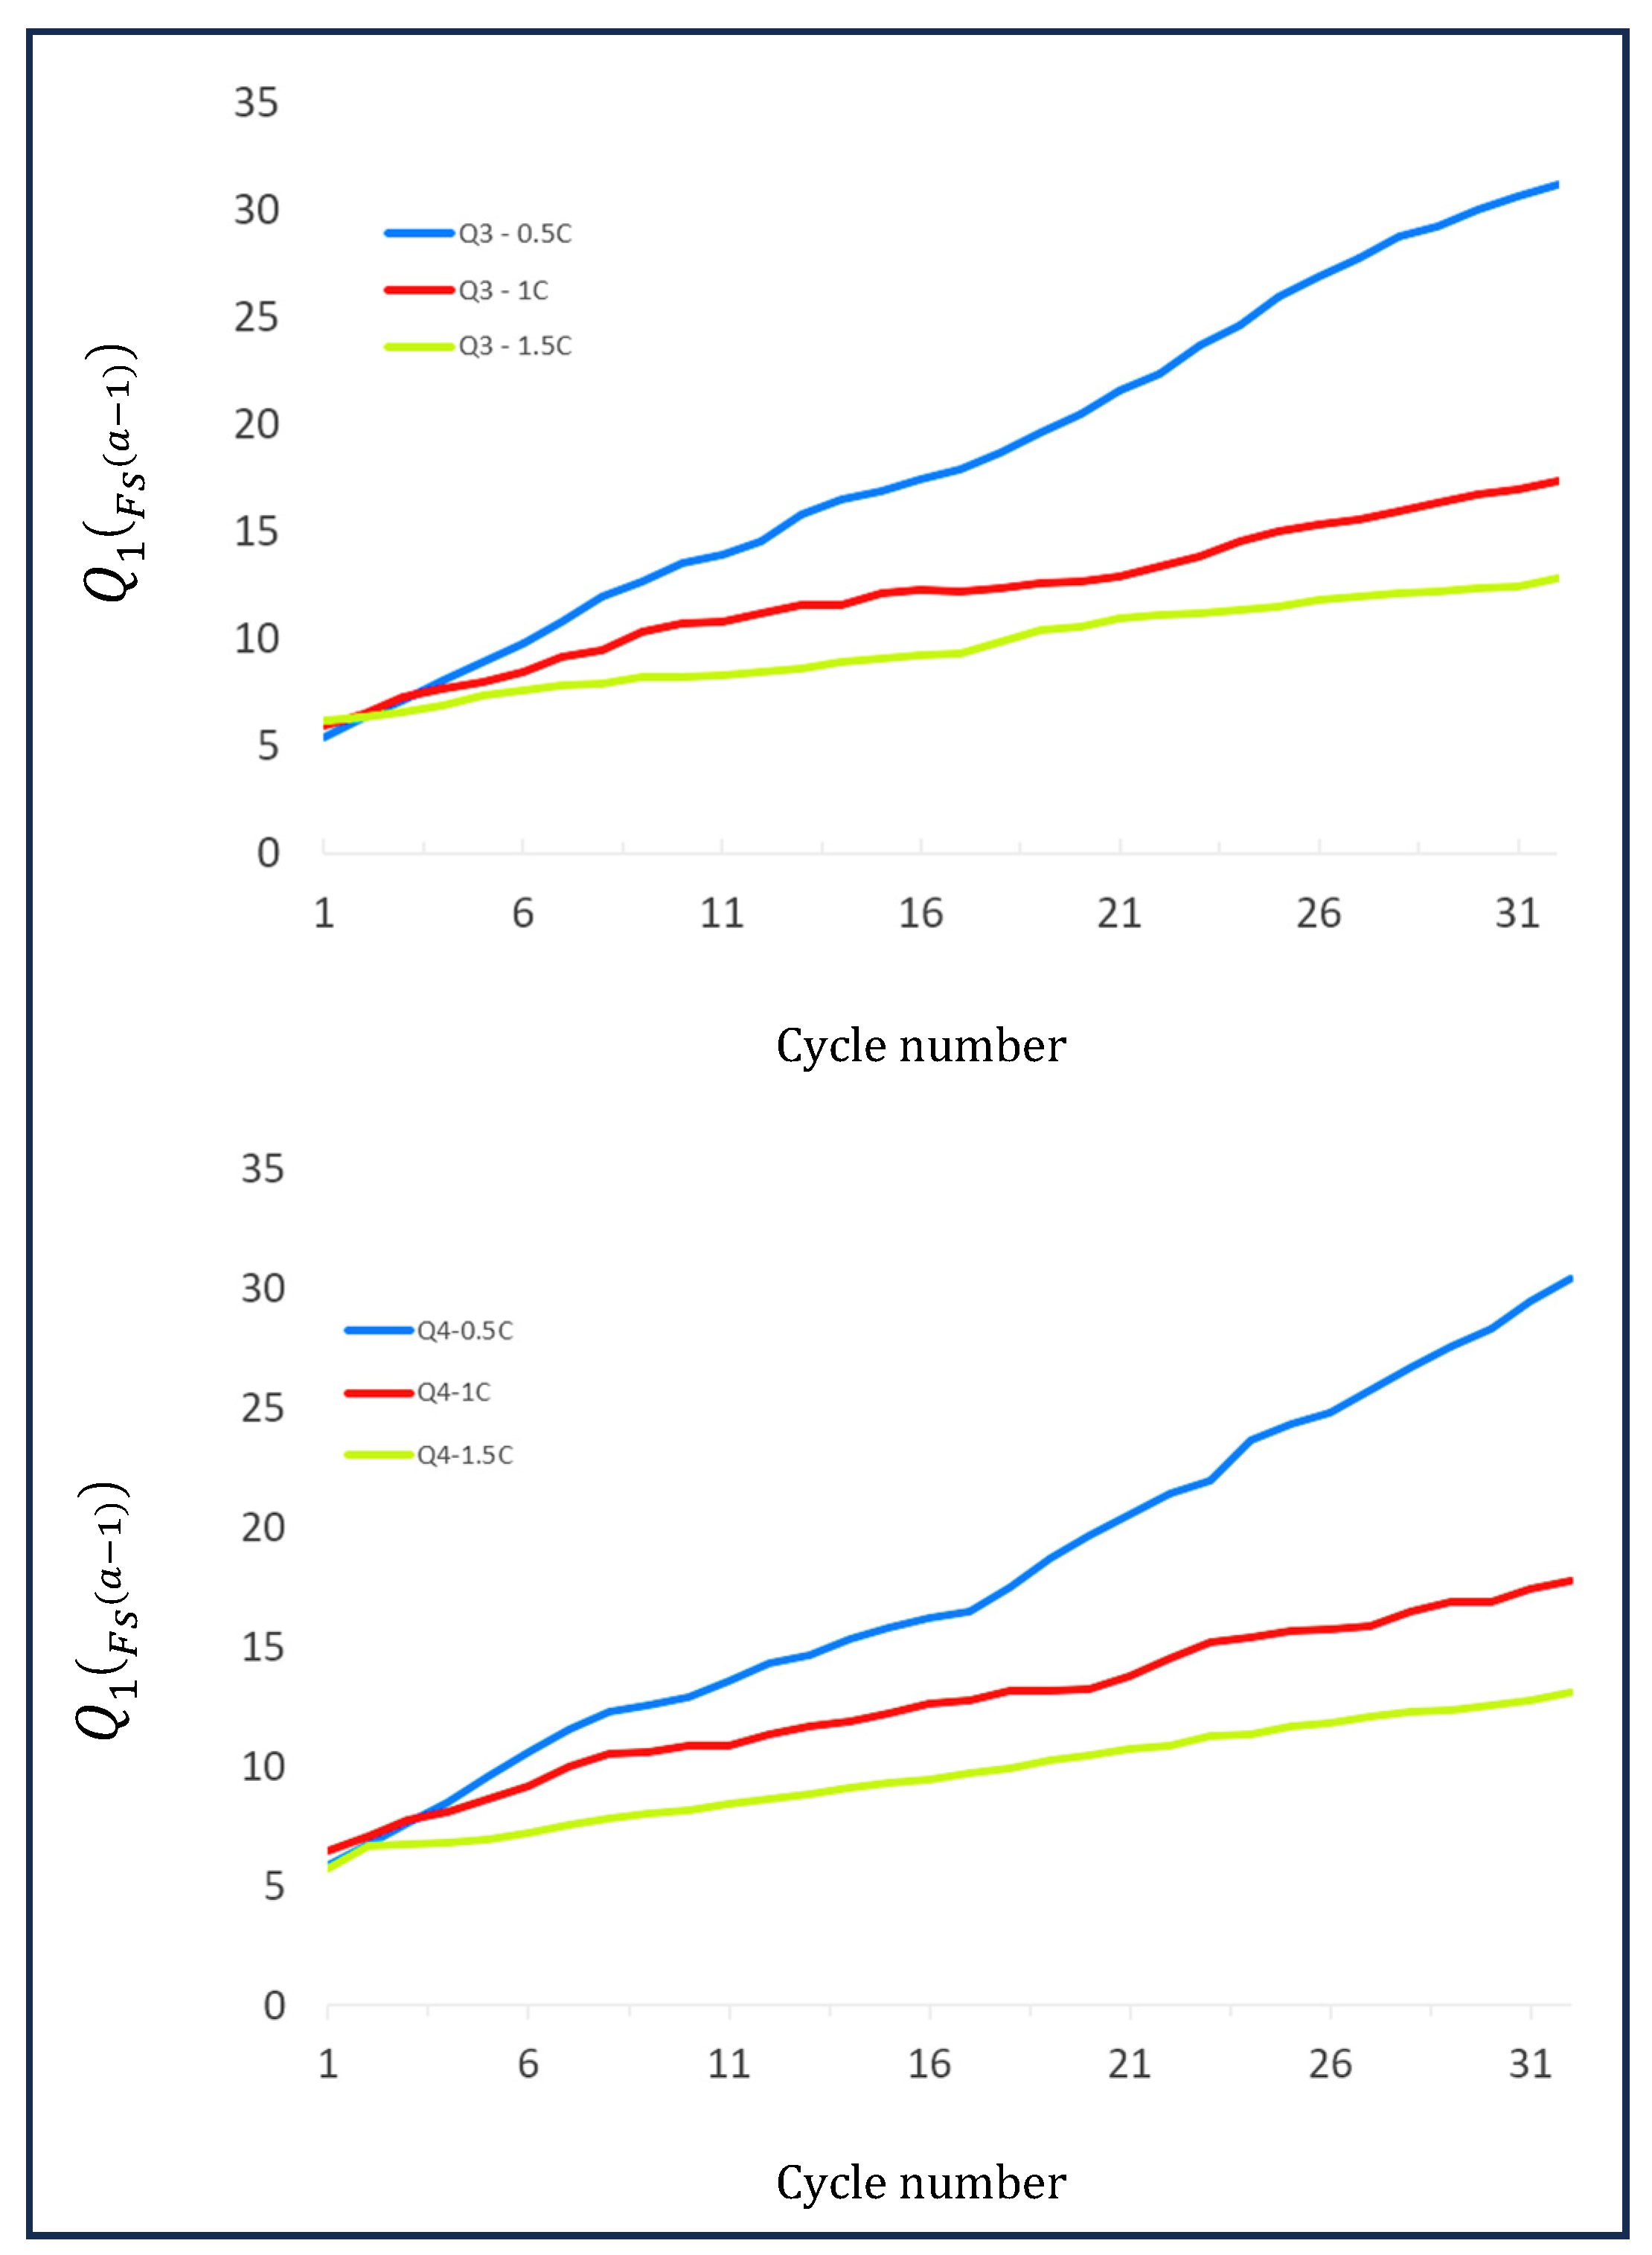
Because the RC parallel circuit in real practice does not fit exactly with the charge transfer impedance (due to capacitor imperfections), we have considered in our fit procedure the Constant Phase Element (CPE). In particular, we focused on the Q parameter of the CPE element, which has been analysed depending on the charging rate of the batteries. By increasing the charge from 0.5 C (B1) to 1. C (B2), and, respectively 1.5 C (B3), a clear exponential trend has resulted for the Q3 and Q4 elements. For a better illustration of their growth rate, we averaged the values of the Q spectra for the B1 and B3 batteries. As can be seen from Figure 7, the effects on the solid electrolyte interface and/or separator are significantly influenced by the charging rate.
Depending on Icharge, it seems that in the middle-frequency spectrum, the thin film formation on the surface of the anode electrode (from the electrochemical reduction in electrolytes) plays a decisive role in the long-term battery cyclability, and, in particular, in the performance of the electrode materials. Taking into account that it starts forming from the first cycle and continues to thicken when the cell is used, we can see a linear exponential shift in the function of the charge rate by monitoring the Q element of the CPE parameter. If we look at Figure 9, we can easily observe a much lower shift at the beginning due to the fact that the solid electrolyte interface layer is thin, thus the performance is not so much affected.
As the battery ages, the shifts become much larger depending on the charge rate due to the fact that the film layer increases its thickness and starts interfering within the major chemical reactions inside the battery. Moreover, as the film thickness increases till electrons cannot pass through it, there will appear a new passivation layer, which finally will inhibit the prolongation of redox reaction.
Despite the physical chemical explanations described above, we also performed a Q3 and Q4 curve calibration analysis depending on the cycle number in the smoothest domain between cycle 21 and cycle 31. In this manner, we were able to highlight the degradation speed of these curves, taking into account the second part of the batteries’ lifetime, in which they are supposed to be more stable. The following equation has been used for the linear fit:
α = Q 3,4 c y c l e
in which α describes the quantitative quality estimation of the batteries. In Table 2, we have summarised the resulted values of ΔQ3 and ΔQ4 at different charge rates.
From the linear trend robustness curve analysis of ΔQ3, we obtained a higher ratio value of 4.7 for B1, 3.2 for B2, and 2.3 for B3, while from the ΔQ4 data, we get the following values: 4.6 for B1, 3 for B2, and 2.3 for B3. These data allow us to predict a quantitative value, in which the lowest charging of 0.5 C applied to the Li-ion batteries emphasized a significant improvement of their lifetime performance between 30 and 35% over the 1 C charging rate increment, and between 45 and 50% for the highest charging rate of 1.5 C. The cycling at the higher charge (in this case) will clearly favour a different formation of solid electrolyte interface film, from a lower to low rate of 0.5 C, and then increasing for 1 C, and even more for 1.5 C. This means that, depending on charge rate, in the formation of the thin film, more lithium ions will be consumed, which finally reduce the charge and discharge efficiency of the electrode materials. As the batteries undergo multiple cycles, the electrolyte starts to decompose differently from lower to higher charge rates due to the reduction in the electrolyte chemicals.

3.3. SOH Dependency on Charging Rate

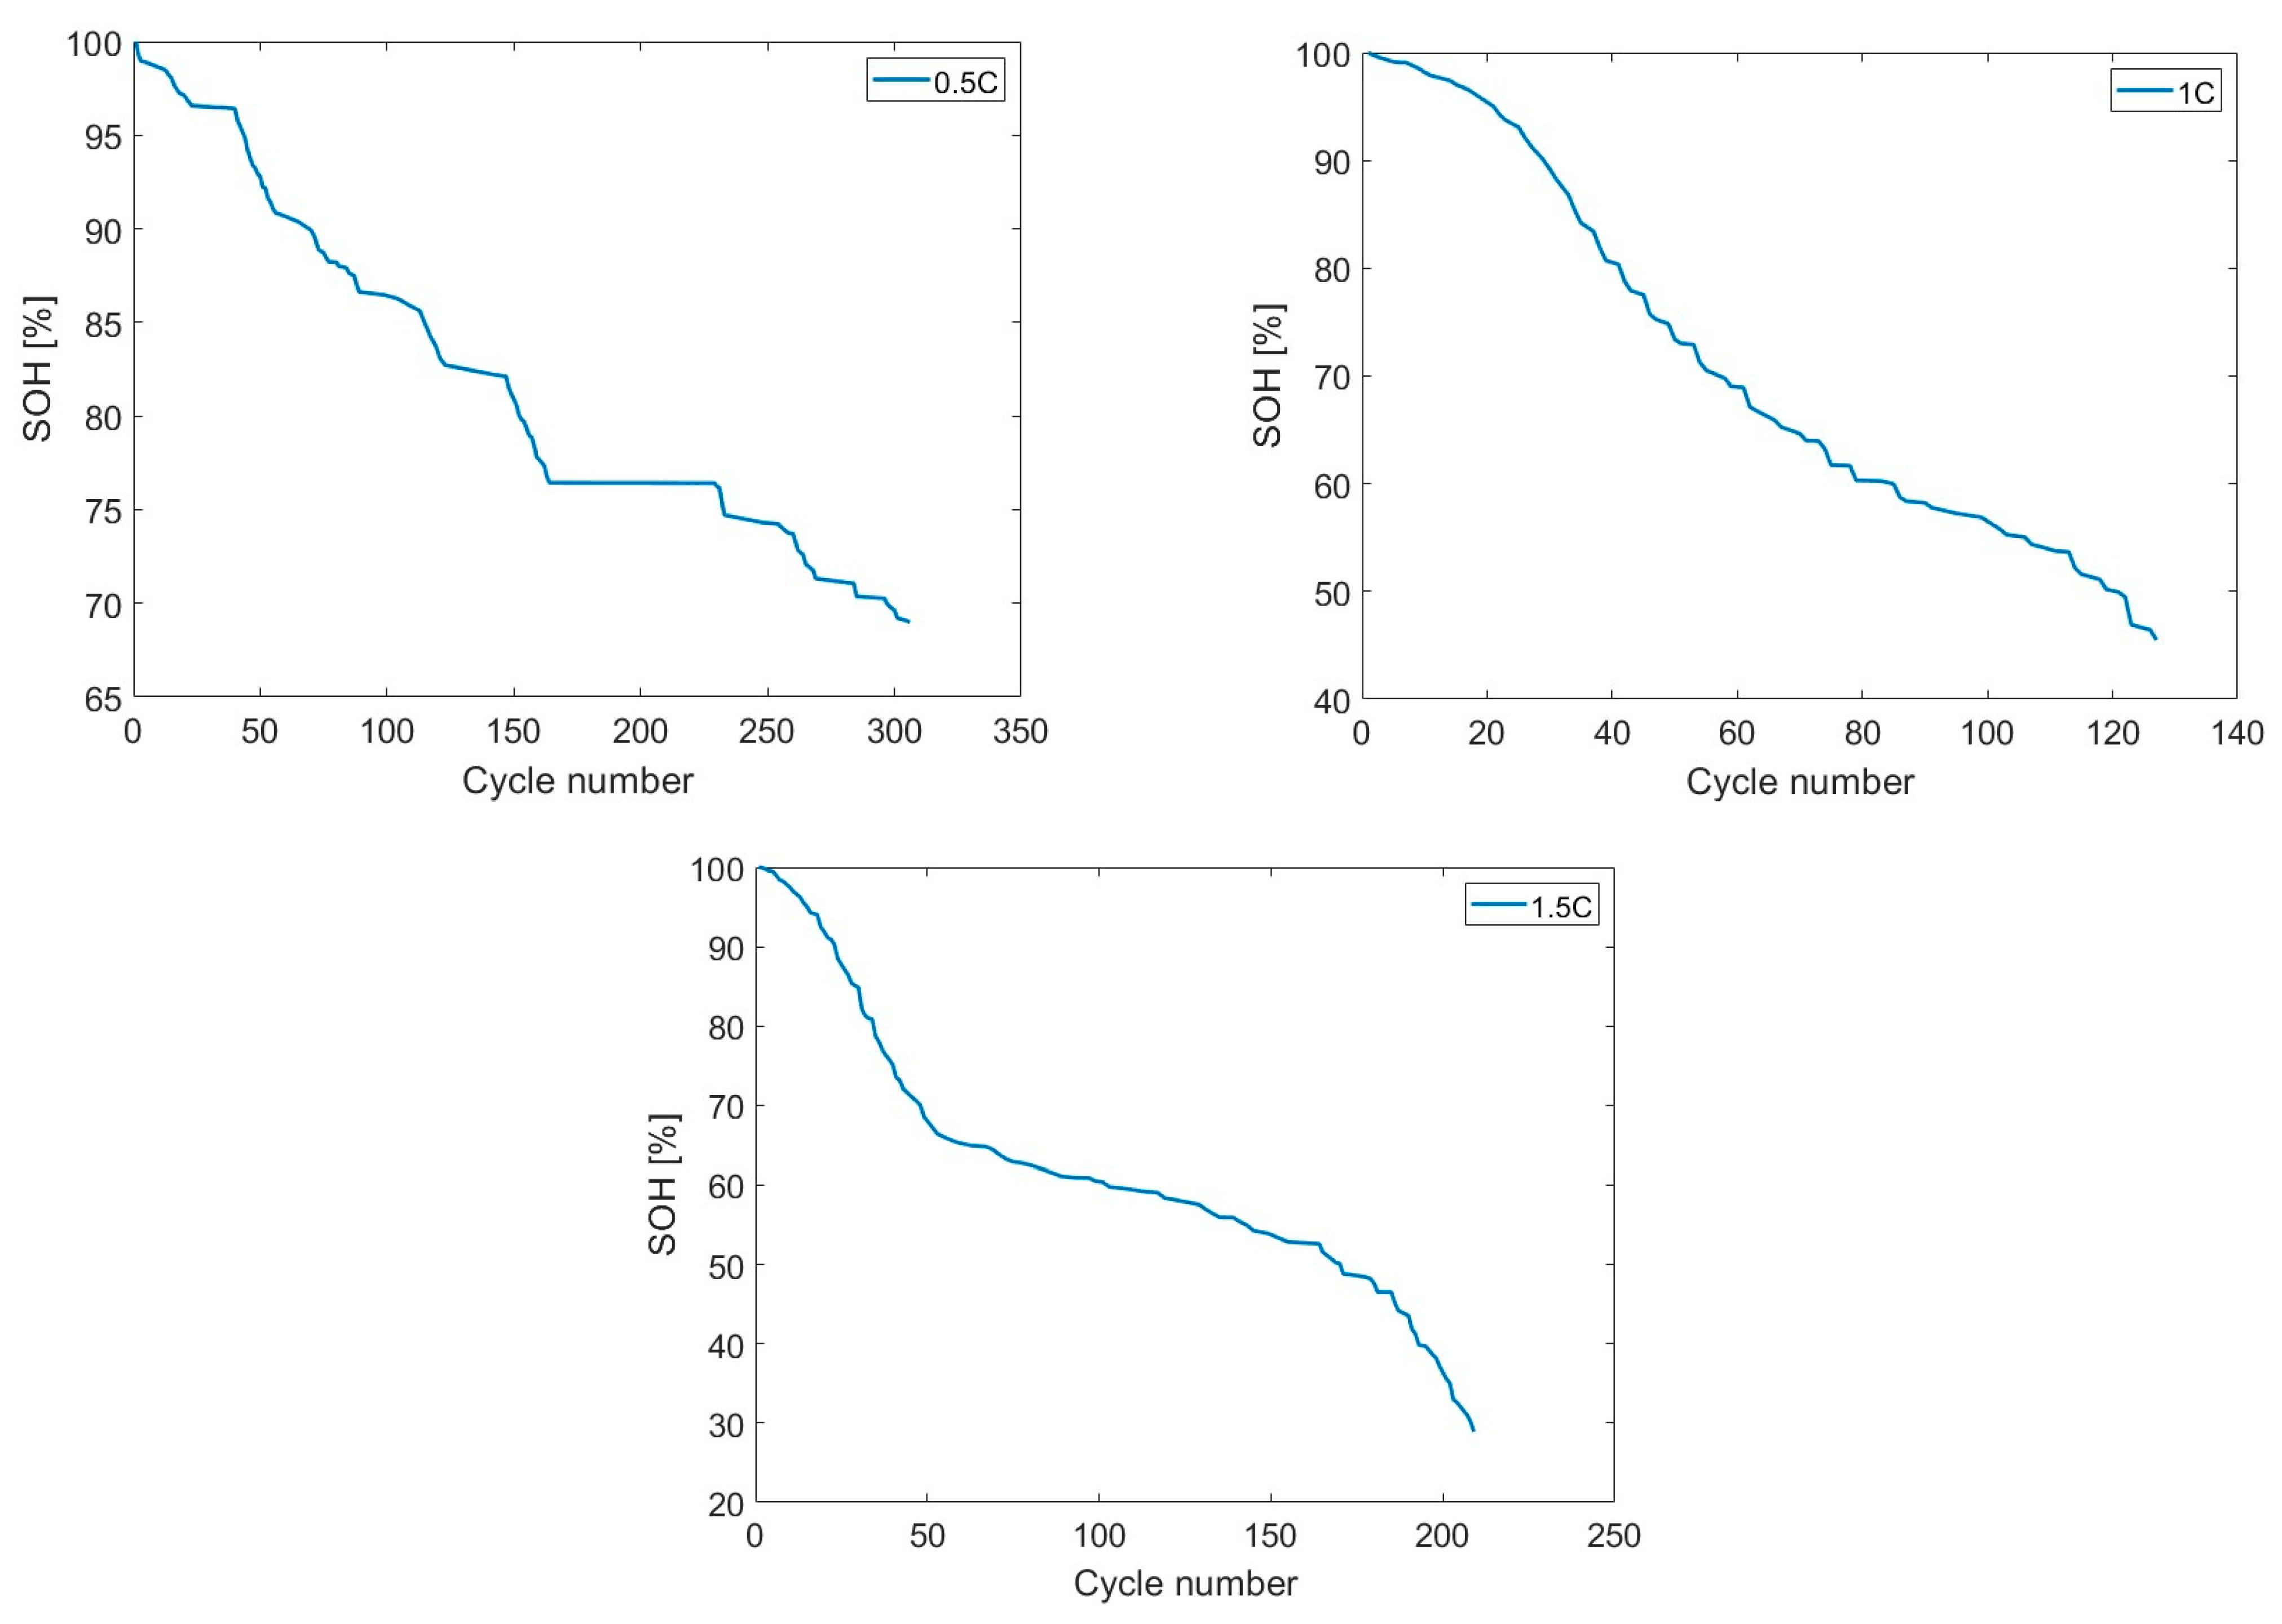
In Figure 10, the evolution of the SOH with cycling is presented. The SOH for each C-rate has been determined according to the standard formula [64]:
S O H = C d i s c h a r g e d C i n i t i a l × 100   [ % ]
The SOH dependence of the C-rate can be depicted in terms of degradation level. A C-rate of 0.5 C and more than 300 charge–discharge cycles determine a SOH of 69%. For a charging current of 1 C, the SOH reaches 54%, which means a 21.4% deeper decrease in the SOH. The fastest C-rate extends the SOH far down to 29%, which signifies a 58% decreasee towards the 0.5 C-rate. Thus, the SOH dependency on the charging rate, and not on the cycle number can be clearly deducted.

3.4. Resonance Frequency Analysis

The resonance frequency of each battery has been determined from PEIS measurements for all three charging rates. In Figure 11, an ordering algorithm is applied to the resonance frequency data so a better view of the trend can be observed. Battery B2 had the lowest number of cycles and, therefore, the shortest life. We relate this state to a low-quality manufacturing process. The resonance frequency for Li-ion batteries was found in a frequency range of 900–1800 Hz. Battery B1 had a resonance frequency starting near 1100 Hz and ending around 1750 Hz. As the charging current increased, the starting point of the resonance frequency interval started to decrease. For battery B3, the resonance frequency range dropped below 950 Hz in the mid-frequency range.
To obtain a smoother version of the data, spline fitting was employed (red line in Figure 11) and the slope of the data for each case has been calculated. The battery with the smallest charging current, B1, has the lowest slope. As the charging rate increases, the slope of B2 and B3 rises by 9.6% and ~50%, respectively.
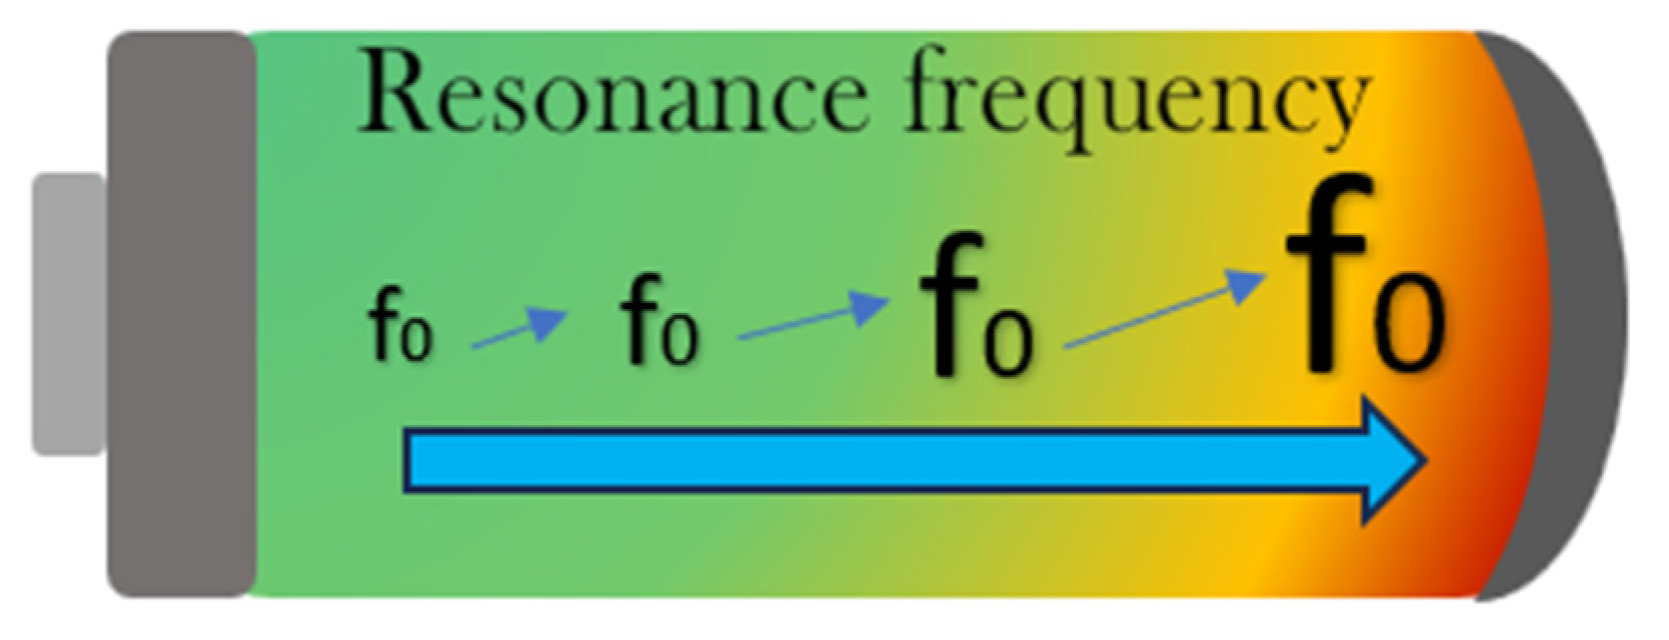
The rate of change of the resonance frequency is smoother at a high SOH and becomes steeper as the battery ages. At 1.5 C, a significant decrease in the smoother part is observed as a result of a faster degradation of the battery. The resonance frequency parameter growth becomes faster as the charging current increases. This is mostly due to the internal resistance of the battery, which degrades with ageing. This trend is schematically illustrated in Figure 12.

4. Conclusions

The lifetime degradation of the Panasonic NCR18650B lithium-ion battery, depending on three distinct charge rates of 0.5 C, 1 C, and 1.5 C, was investigated using EIS methodology. We focused on the dependence of the values for equivalent Randles circuit parameters, with particular attention paid to constant phase element (CPE) time-dependent behaviour. We made a performance appraisal of the parameters used for the fitting of Nyquist diagrams, focusing on the dependence of the values for equivalent Randles circuit parameters, with particular attention paid to constant phase element (CPE) time-dependent behaviour. By monitoring the Q3 and Q4 elements of the CPE parameter, a linear exponential shifting in the function of the charge rate resulted. By analysing their linear trend robustness curves, we obtained for ΔQ3 a higher ratio value of 4.7 for B1, 3.2 for B2, and 2.3 for B3, while from the ΔQ4 results, we obtained appropriate values of 4.6 for B1, 3 for B2, and 2.3 for B3.
These results allowed us to predict a quantitative value of the LIBs depending on the charge rate, in which the lowest charging of 0.5 C highlights a significant improvement of their lifetime performance of ~30–35% over the 1 C charging rate increase, and somewhere between 45 and 50% for the highest charging rate of 1 C. The cycling at a higher charge will favour a distinct formation of solid electrolyte interface film, from a lower charging rate of 0.5 C to 1 C, and even more from a higher charge rate of 1.5 C. The effects on the solid electrolyte interface and/or separator are significantly influenced by the charging rate, in which the thin film formation on the surface of the anode electrode (from the electrochemical reduction of electrolyte) plays a decisive role in the long-term battery cyclability, and in particular on the performance of electrode materials.
The dependency of SOH with the C-rate has been expressed as degradation speed percentages. Due to different calculation methods and different meanings of each parameter considered, the percentages slightly differ, but the dependency on the charge rate is maintained in all cases. Furthermore, the degradation speed is confirmed in both methods and validated by SOH.
By analysis of the resonance frequency of a single parameter, we have gathered the EIS survey of Li batteries, providing a fast and reliable connection without any intermediary fitting procedures between batteries’ SOH and their lifetime prediction. The rate of change of the resonance frequency parameter with cycling shows that when the charging rate increases, the cycle number decreases, thus the slope of the resonance frequency data is directly proportional to the charging rate. Applying spline fitting, the data for each case have been calculated, highlighting the lowest slope for the battery with the smallest charging current, B1. As the charging rate increases, the slope of B2 grows by ~10%, while for B3, a significant increment of 50% is obtained. Moreover, the starting point of the resonance frequency interval shifts towards the mid-frequency region as the charging rate increases to 1.5. This peculiar behaviour observed on this Li-ion battery type is in very good agreement with the first analysis of the CPE-Q parameter, showing that after a certain number of charging/discharging trials, resonance frequency variation is affected by the charging rate. As such, it can be considered a fast-ageing EIS analysis by simply monitoring one parameter.

Author Contributions

O.B.: Methodology; Validation; Formal analysis; Investigation; Resources; Data curation; Writing—original draft preparation. A.C.: Conceptualization; Investigation, Writing—original draft preparation; Writing—review and editing; Visualization; Supervision; Project administration; Funding acquisition. All authors have read and agreed to the published version of the manuscript.

Funding

This study was financially supported by the PN-III-P2-2.1-PED-2021-0936 project, no. 715 PED/2022, and the MCID Core Programmes within the National Plan for Research Development and Innovation 2022–2027 project PN 23 24 02 01.

Data Availability Statement

No new data were created or analyzed in this study. Data sharing is not applicable to this article.

Conflicts of Interest

The authors declare no conflict of interest.

References

  1. Nelson, P.; Bloom, I.; Amine, K.; Henriksen, G. Design modelling of lithium-ion battery performance. J. Power Sources 2002, 110, 437–444. [Google Scholar] [CrossRef]
  2. Eddahech, A.; Briat, O.; Vinassa, J.-M. Lithium-ion battery performance improvement based on capacity recovery exploitation. Electrochim. Acta 2013, 114, 750–757. [Google Scholar] [CrossRef]
  3. Yamada, M.; Watanabe, T.; Gunji, T.; Wu, J.; Matsumoto, F. Review of the Design of Current Collectors for Improving the Battery Performance in Lithium-Ion and Post-Lithium-Ion Batteries. Electrochem 2020, 1, 124–159. [Google Scholar] [CrossRef]
  4. van Ree, T. Electrolyte additives for improved lithium-ion battery performance and overcharge protection. Curr. Opin. Electrochem. 2020, 21, 22–30. [Google Scholar] [CrossRef]
  5. Masias, A.; Marcicki, J.; Paxton, W.A. Opportunities and Challenges of Lithium Ion Batteries in Automotive Applications. ACS Energy Lett. 2021, 6, 621–630. [Google Scholar] [CrossRef]
  6. Xiong, R.; Pan, Y.; Shen, W.; Li, H.; Sun, F. Lithium-ion battery aging mechanisms and diagnosis method for automotive applications: Recent advances and perspectives. Renew. Sustain. Energy Rev. 2020, 131, 110048. [Google Scholar] [CrossRef]
  7. Dai, Q.; Kelly, J.C.; Gaines, L.; Wang, M. Life Cycle Analysis of Lithium-Ion Batteries for Automotive Applications. Batteries 2019, 5, 48. [Google Scholar] [CrossRef]
  8. Kim, T.; Makwana, D.; Adhikaree, A.; Vagdoda, J.S.; Lee, Y. Cloud-Based Battery Condition Monitoring and Fault Diagnosis Platform for Large-Scale Lithium-Ion Battery Energy Storage Systems. Energies 2018, 11, 125. [Google Scholar] [CrossRef]
  9. Moyer, K.; Meng, C.; Marshall, B.; Assal, O.; Eaves, J.; Perez, D.; Karkkainen, R.; Roberson, L.; Pint, C.L. Carbon fiber reinforced structural lithium-ion battery composite: Multifunctional power integration for CubeSats. Energy Storage Mater. 2020, 24, 676–681. [Google Scholar] [CrossRef]
  10. Marsh, R.A.; Vukson, S.; Surampudi, S.; Ratnakumar, B.V.; Smart, M.C.; Manzo, M.; Dalton, P.J. Li ion batteries for aerospace applications. J. Power Sources 2001, 97–98, 25–27. [Google Scholar] [CrossRef]
  11. Krause, F.C.; Ruiz, J.P.; Jones, S.C.; Brandon, E.J.; Darcy, E.C.; Iannello, C.J.; Bugga, R.V. Performance of Commercial Li-Ion Cells for Future NASA Missions and Aerospace Applications. J. Electrochem. Soc. 2021, 168, 040504. [Google Scholar] [CrossRef]
  12. European Comission. Lithium Ion Battery Value Chain and Related Opportunities for Europe. Available online: https://core.ac.uk/download/pdf/154760177.pdf (accessed on 8 July 2024).
  13. Wang, Y.; Li, H.; He, P.; Hosono, E.; Zhou, H. Nano active materials for lithium-ion batteries. Nanoscale 2010, 2, 1294–1305. [Google Scholar] [CrossRef]
  14. Mekonnen, Y.; Sundararajan, A.; Sarwat, A.I. A review of cathode and anode materials for lithium-ion batteries. In Proceedings of the IEEE SoutheastCon 2016 Conference, Norfolk, VA, USA, 30 March–3 April 2016. [Google Scholar]
  15. Khalifa, H.; El-Safty, S.A.; Reda, A.; Selim, M.M.; Shenashen, M.A. One-dimensional hierarchical anode/cathode materials engineering for high-performance lithium ion batteries. Energy Storage Mater. 2021, 37, 363–377. [Google Scholar] [CrossRef]
  16. Hassoun, J.; Bonaccorso, F.; Agostini, M.; Angelucci, M.; Betti, M.G.; Cingolanti, R.; Gemmi, M.; Mariani, C.; Panero, S.; Pellegrini, V.; et al. An advanced Lithium-Ion Battery Based on a Graphene Anode and a Lithium Iron Phosphate Cathode. Nano Lett. 2014, 14, 4901–4906. [Google Scholar] [CrossRef] [PubMed]
  17. Lagadec, M.F.; Zahn, R.; Wood, V. Characterization and performance evaluation of lithium-ion battery separators. Nat. Energy 2019, 4, 16–25. [Google Scholar] [CrossRef]
  18. Yuan, M.; Liu, K. Rational design on separators and liquid electrolytes for safer lithium-ion batteries. J. Energy Chem. 2020, 43, 58–70. [Google Scholar] [CrossRef]
  19. Luiso, S.; Fedkiw, P. Lithium-ion battery separators: Recent developments and state of art. Current Opinion in Electrochemistry 2020, 20, 99–107. [Google Scholar] [CrossRef]
  20. Bajolle, H.; Lagadic, M.; Louvet, N. The future of lithium-ion batteries: Exploring expert conceptions, market trends, and price scenarios. Energy Res. Soc. Sci. 2022, 93, 102850. [Google Scholar] [CrossRef]
  21. Hadouchi, M.; Koketsu, T.; Hu, Z.; Ma, J. The origin of fast-charging lithium iron phosphate for batteries. Battery Energy 2022, 1, 20210010. [Google Scholar] [CrossRef]
  22. Ioakimidis, C.S.; Murillo-Marrodan, A.; Bagheri, A.; Thomas, D.; Genikmsakis, K.N. Life Cycle Assessment of a Lithium Iron Phosphate (LFP) Electric Vehicle Battery in Second Life Application Scenarios. Sustainability 2019, 11, 2527. [Google Scholar] [CrossRef]
  23. Barker, J.; Batteries, L.-I.R.; Buschow, K.H.J.; Cahn, R.W.; Flemings, M.C.; Ilschner, B.; Kramer, E.J.; Mahajan, S.; Veyssière, P. Encyclopedia of Materials: Science and Technology; Elsevier: Amsterdam, The Netherlands, 2010; pp. 1–6. ISBN 9780080431529. [Google Scholar]
  24. Li, J.; Lin, C.; Weng, M.; Qiu, Y.; Chen, P.; Yang, K.; Huang, W.; Hong, Y.; Li, J.; Zhang, M.; et al. Structural origin of the high-voltage instability of lithium cobalt oxide. Nat. Nanotechnol. 2021, 16, 599–605. [Google Scholar] [CrossRef] [PubMed]
  25. Liu, S.; Wang, B.; Zhang, X.; Zhao, S.; Zhang, Z.; Yu, H. Reviving the lithium-manganese-based-layered oxide cathodes for lithium-ion batteries. Matter 2021, 4, 1511–1527. [Google Scholar] [CrossRef]
  26. Hang, M.N.; Gunsolus, I.L.; Wayland, H.; Melby, E.S.; Mensch, A.C.; Hurley, K.R.; Pedersen, J.A.; Haynes, C.L.; Hamers, R.J. Impact of Nanoscale Lithium Nickel Manganese Cobalt Oxide (NMC) on the Bacterium Shewanella oneidensis MR-1. Chem. Mater. 2016, 28, 1092–1100. [Google Scholar] [CrossRef]
  27. Pant, D.; Dolker, T. Green and facile method for the recovery of spent Lithium Nickel Manganese Cobalt Oxide (NMC) Based Lithium Ion Batteries. Waste Manag. 2017, 60, 689–695. [Google Scholar] [CrossRef]
  28. Vadivel, S.; Phattharasupakun, N.; Wutthiprom, J.; Duangdangchote, S.; Sawanphruk, M. High-Performance Li-Ion Batteries Using Nickel-Rich Lithium Nickel Cobalt Aluminium Oxide-Nanocarbon Core-Shell Cathode: In Operando X-ray Diffraction. ACS Appl. Mater. Interfaces 2019, 11, 30719–30727. [Google Scholar] [CrossRef] [PubMed]
  29. Brand, M.; Glaser, S.; Geder, J.; Menacher, S.; Obpacher, S.; Jossen, A.; Quinger, D. Electrical safety of commercial Li-ion cells based on NMC and NCA technology compared to LFP technology. World Electr. Veh. J. 2013, 6, 572–580. [Google Scholar] [CrossRef]
  30. Fell, C.R.; Sun, L.; Hallac, P.B.; Metz, B.; Sisk, B. Investigation of the Gas Generation in Lithium Titanate Anode Based Lithium Ion Batteries. J. Electrochem. Soc. 2015, 162, A1916. [Google Scholar] [CrossRef]
  31. Assefa, T.A.; Suzana, A.F.; Wu, L.; Koch, R.J.; Li, L.; Cha, W.; Harder, R.J.; Bozin, E.S.; Wang, F.; Robinson, I.K. Imaging the Phase Transformation in Single Particles of the Lithium Titanate Anode for Lithium-Ion Batteries. ACS Appl. Energy Mater. 2021, 4, 111–118. [Google Scholar] [CrossRef]
  32. Tan, S.; Ji, Y.J.; Zhang, Z.R.; Yang, Y. Recent Progress in Research on High-Voltage Electrolytes for Lithium-Ion Batteries. ChemPhysChem 2014, 15, 1956–1969. [Google Scholar] [CrossRef]
  33. Wang, C.; Yang, C.; Zheng, Z. Toward Practical High-Energy and High-Power Lithium Battery Anodes: Present and Future. Adv. Sci. 2022, 9, 2105213. [Google Scholar] [CrossRef]
  34. Xu, W.-T.; Peng, H.-J.; Huang, J.-Q.; Zhao, C.-Z.; Cheng, X.-B.; Zhang, Q. Towards Stable Lithium–Sulfur Batteries with a Low Self-Discharge Rate: Ion Diffusion Modulation and Anode Protection. ChemSusChem 2015, 8, 2892–2901. [Google Scholar] [CrossRef] [PubMed]
  35. He, Y.; Zou, P.; Bak, S.-M.; Wang, C.; Zhang, R.; Yao, L.; Du, Y.; Hu, E.; Lin, R.; Xin, H.L. Dual Passivation of Cathode and Anode through Electrode-Electrolyte Interface Engineering Enables Long-Lifespan Li Metal -SPAN Batteries. ACS Energy Lett. 2022, 7, 2866–2875. [Google Scholar] [CrossRef]
  36. Wang, L.; Zhang, L.; Wang, Q.; Li, W.; Wu, B.; Jia, W.; Wang, Y.; Li, J.; Li, H. Long lifespan lithium metal anodes enabled by Al2O3 sputter coating. Energy Storage Mater. 2018, 10, 16–23. [Google Scholar] [CrossRef]
  37. AllCell Technologies LLC. A Comparison of Lead Acid to Lithium-Ion in Stationary Storage Applications. Available online: http://www.batterypoweronline.com/wp-content/uploads/2012/07/Lead-acid-white-paper.pdf (accessed on 8 July 2024).
  38. Iurilli, P.; Brivio, C.; Wood, V. On the use of electrochemical impedance spectroscopy to characterize and model the aging phenomena of lithium-ion batteries: A critical review. J. Power Sources 2021, 505, 229860. [Google Scholar] [CrossRef]
  39. Meddings, N.; Heinrich, M.; Overney, F.; Lee, J.-S.; Ruiz, V.; Napolitano, E.; Seitz, S.; Hinds, G.; Raccichini, R.; Gaberscek, M.; et al. Application of electrochemical impedance spectroscopy to commercial Li-ion cells: A review. J. Power Sources 2020, 480, 228742. [Google Scholar] [CrossRef]
  40. Andre, D.; Meiler, M.; Steiner, K.; Wimmer, C.; Soczka-Guth, T.; Sauer, D.U. Characterization of high-power lithium-ion batteries by electrochemical impedance spectroscopy. I. Experimental investigation. J. Power Sources 2011, 196, 5334–5341. [Google Scholar] [CrossRef]
  41. Martí-Florences, M.; Cecilia, A.; Costa-Castelló, R. Modelling and Estimation in Lithium-Ion Batteries: A Literature Review. Energies 2023, 16, 6846. [Google Scholar] [CrossRef]
  42. Sadhukhan, C.; Mitra, S.K.; Bhattacharyya, S.; Almatrafi, E.; Saleh, B.; Naskar, M.K. Modeling and simulation of high energy density lithium-ion battery for multiple fault detection. Sci. Rep. 2022, 12, 9800. [Google Scholar] [CrossRef] [PubMed]
  43. Porras-Hermoso, Á.; Pindado, S.; Cubas, J. Lithium-ion battery performance modeling based on the energy discharge level. Meas. Sci. Technol. 2018, 29, 117002. Available online: https://oa.upm.es/53065/1/measurement2018.pdf (accessed on 8 July 2024). [CrossRef]
  44. Wang, J.; Xiang, Y. Fast Modeling of the Capacity Degradation of Lithium-Ion Batteries via a Conditional Temporal Convolutional Encoder–Decoder. IEEE Trans. Transp. Electrif. 2022, 8, 1695–1709. [Google Scholar] [CrossRef]
  45. Lee, J.; Lee, J.H. Simultaneous extraction of intra- and inter-cycle features for predicting lithium-ion battery’s knees using convolutional and recurrent neural networks. Appl. Energy 2024, 356, 122399. [Google Scholar] [CrossRef]
  46. Wu, L.; Lyu, Z.; Huang, Z.; Zhang, C.; Wei, C. Physics-based battery SOC estimation methods: Recent advances and future perspectives. J. Energy Chem. 2024, 89, 27–40. [Google Scholar] [CrossRef]
  47. Máthé, L.; Grosu, I. Transport Through a Quantum Dot with Electron-Phonon Interaction. Mater. Today Proc. 2018, 5, 15878–15887. [Google Scholar] [CrossRef]
  48. Máthé, L.; Grosu, I. Nonequilibrium Kondo effect in a graphene-coupled quantum dot in the presence of a magnetic field. Beilstein J. Nanotechnol. 2020, 11, 225–239. [Google Scholar] [CrossRef] [PubMed]
  49. Choi, W.; Shin, H.-C.; Kim, J.M.; Choi, J.-Y.; Yoon, S. Modeling and Applications of Electrochemical Impedance Spectroscopy (EIS) for Lithium-ion Batteries. J. Electrochem. Sci. Technol. 2020, 11, 1–13. [Google Scholar] [CrossRef]
  50. Pastor-Fernández, C.; Widanage, W.D.; Marco, J.; Gama-Valdez, M.-Á.; Chouchelamane, G.H. Identification and quantification of ageing mechanisms in Lithium-ion batteries using the EIS technique. In Proceedings of the 2016 IEEE Transportation Electrification Conference and Expo (ITEC), Dearborn, MI, USA, 27–29 June 2016; pp. 1–6. [Google Scholar]
  51. Crescentini, M.; De Angelis, A.; Ramilli, R.; De Angelis, G.; Tartagni, M.; Moschitta, A.; Traverso, P.A.; Carbone, P. Online EIS and Diagnostics on Lithium-Ion Batteries by Means of Low-Power Integrated Sensing and Parametric Modeling. IEEE Trans. Instrum. Meas. 2021, 70, 1–11. [Google Scholar] [CrossRef]
  52. Itagaki, M.; Honda, K.; Hoshi, Y.; Shitanda, I. In-situ EIS to determine impedance spectra of lithium-ion rechargeable batteries during charge and discharge cycle. J. Electroanal. Chem. 2015, 737, 78–84. [Google Scholar] [CrossRef]
  53. Dai, S.; Chen, J.; Ren, Y.; Liu, Z.; Chen, J.; Li, C.; Zhang, X.; Zhang, X.; Zeng, T. Electrochemical Corrosion Behavior of the Copper Current Collector in the Electrolyte of Lithium-ion Batteries. Int. J. Electrochem. Sci. 2017, 12, 10589–10598. [Google Scholar] [CrossRef]
  54. Zhang, X.; Zhang, X.; Sun, X.; An, Y.; Song, S.; Li, C.; Wang, K.; Su, F.; Chen, C.-M.; Liu, F.; et al. Electrochemical impedance spectroscopy study of lithium-ion capacitors: Modeling and capacity fading mechanism. J. Power Sources 2021, 488, 229454. [Google Scholar] [CrossRef]
  55. Liu, T.; Cai, S.; Zhao, G.; Gao, Z.; Liu, S.; Li, H.; Chen, L.; Li, M.; Yang, X.; Guo, H. Recycling valuable cobalt from spent lithium ion batteries for controllably designing a novel sea-urchin-like cobalt nitride-graphene hybrid catalyst: Towards efficient overall water splitting. J. Energy Chem. 2021, 62, 440–450. [Google Scholar] [CrossRef]
  56. Dong, Q.; Zhou, Y.; Lian, J.; Li, L. A Fast Fuel Cell EIS Measurement Method Based on Square Wave Excitation and Modified Wavelets. J. Electrochem. Soc. 2023, 170, 044502. [Google Scholar] [CrossRef]
  57. Calborean, A.; Bruj, O.; Murariu, T.; Morari, C. Resonance frequency analysis of lead-acid cells: An EIS approach to predict the state-of-health. J. Energy Storage 2020, 27, 101143. [Google Scholar] [CrossRef]
  58. Calborean, A.; Murariu, T.; Morari, C. Optimized lead-acid grid architectures for automotive lead-acid batteries: An electrochemical analysis. Electrochim. Acta 2021, 372, 137880. [Google Scholar] [CrossRef]
  59. Panasonic. Lithium Ion NCR18650B. Available online: https://www.batteryspace.com/prod-specs/ncr18650b.pdf (accessed on 8 July 2024).
  60. Available online: https://www.ancoo-battery.com/en/product/NCR18650B.html (accessed on 8 July 2024).
  61. Andre, D.; Meiler, M.; Steiner, K.; Walz, H.; Soczka-Guth, T.; Sauer, D.U. Characterization of high-power lithium-ion batteries by electrochemical impedance spectroscopy. II: Modelling. J. Power Sources 2011, 196, 5349–5356. [Google Scholar] [CrossRef]
  62. Soto, F.A.; Marzouk, A.; El-Mellouhi, F.; Balbuena, P.B. Understanding Ionic Diffusion through SEI Components for Lithium-Ion and Sodium-Ion Batteries: Insights from First-Principles Calculations. Chem. Mater. 2018, 30, 3315–3322. [Google Scholar] [CrossRef]
  63. Grepow. What Is the SEI, and What Effect Does It Have on the Battery? | Battery Monday. Available online: https://www.grepow.com/blog/what-is-the-sei-and-what-effect-does-it-have-on-the-battery-battery-monday.html (accessed on 8 July 2024).
  64. Li, Y.; Luo, L.; Zhang, C.; Liu, H. State of Health Assessment for Lithium-Ion Batteries Using Incremental Energy Analysis and Bidirectional Long Short-Term Memory. World Electr. Veh. J. 2023, 14, 188. [Google Scholar] [CrossRef]
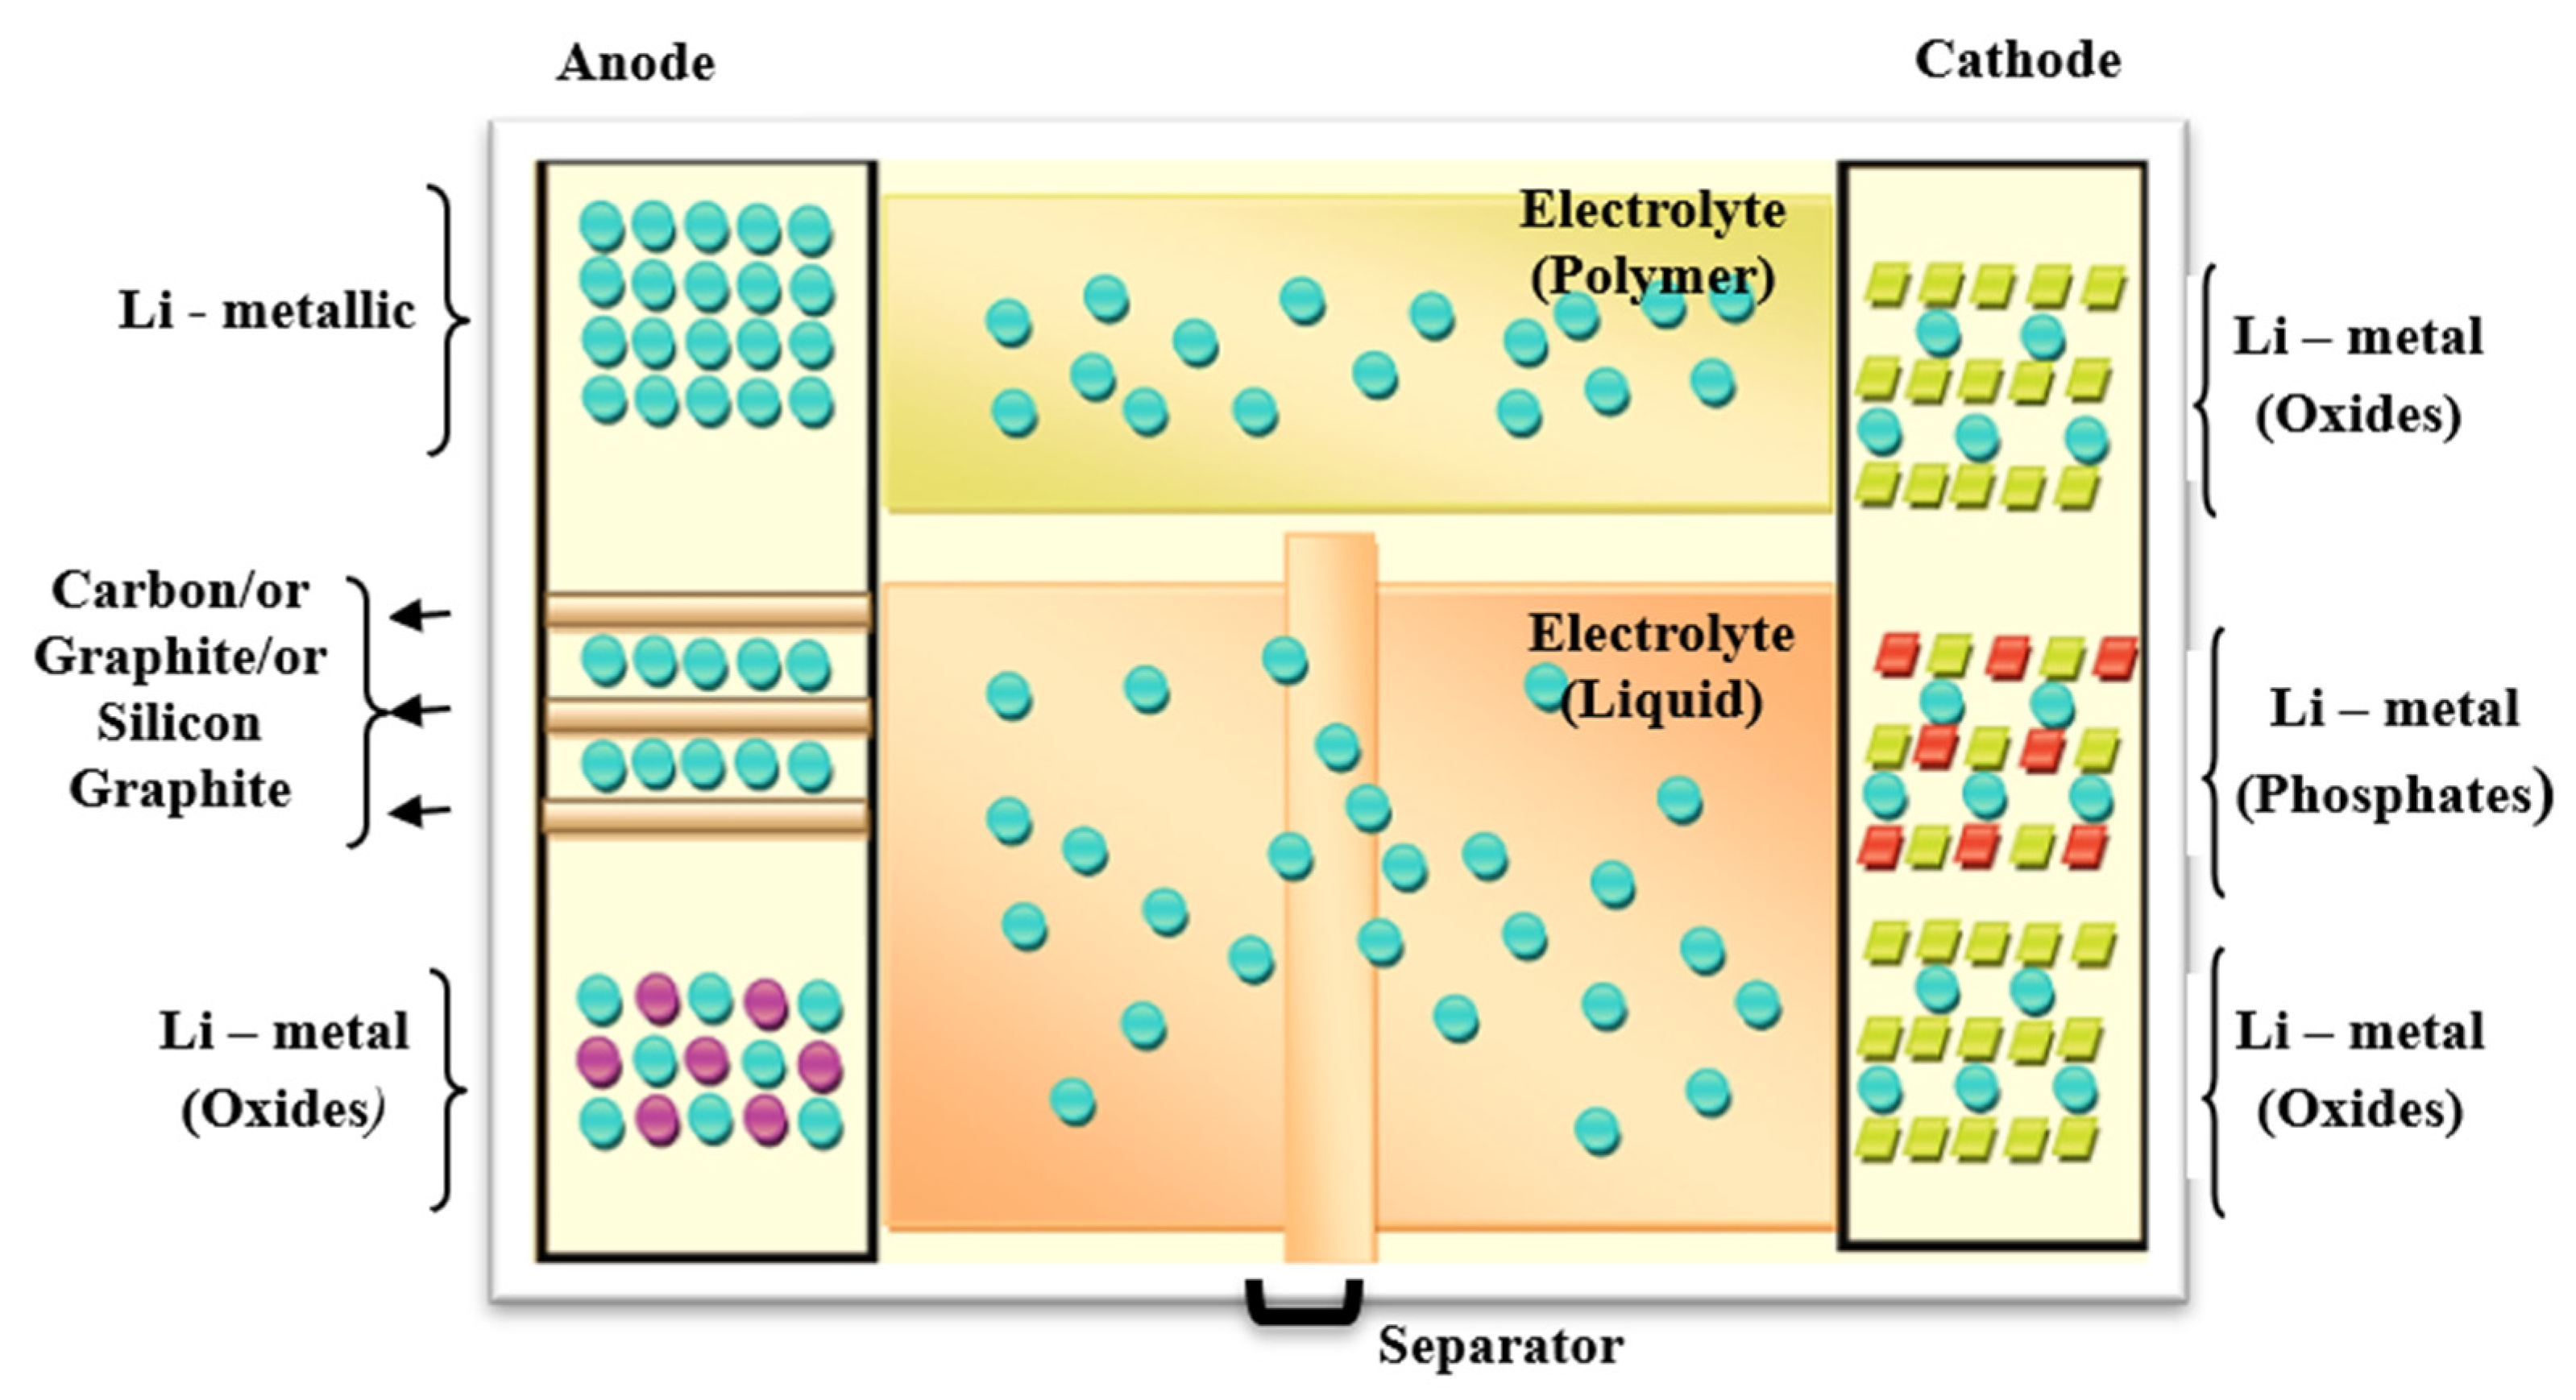
Figure 1. Li-ion cell fabrication concept.
Batteries 10 00247 g001
Figure 2. The measurement setup (left); impedance Z as the as the real part of impedance Z′ vs. the imaginary part of Z″ (right).
Batteries 10 00247 g002
Figure 3. The typical Nyquist diagram for Li-ion batteries within the equivalent Randles circuit (top); half-battery illustration showing the correlation with the Li ion battery internal reactions (down). The dotted lines of different colours are corresponding to different areas on the plot.
Batteries 10 00247 g003
Figure 4. Ageing workflow for three Li-ion batteries: B1, B2, and B3.
Batteries 10 00247 g004
Figure 5. Nyquist diagrams in charge state (left) and discharge state (right).
Batteries 10 00247 g005
Figure 6. Example of fitting for a Nyquist curve in B2.
Batteries 10 00247 g006
Figure 7. First three PEIS of the B1 battery.
Batteries 10 00247 g007
Figure 8. The efficiency of the B1 (0.5 C) battery.
Batteries 10 00247 g008
Figure 9. The dependence on the cycle number for selected fit Q3 (Top) and Q4 (Down) parameters in B1, B2, and B3 batteries.
Batteries 10 00247 g009
Figure 10. The dependence of SOH vs. cycle number in B1, B2, and B3 batteries.
Batteries 10 00247 g010
Figure 11. Resonance frequency and spline fitting for 0.5 C, 1 C, and 1.5 C.
Batteries 10 00247 g011aBatteries 10 00247 g011b
Figure 12. The evolution of resonance frequency with ageing.
Batteries 10 00247 g012
Table 1. NCR18650B batteries specifications.
Batteries 10 00247 i001Rated Capacity
at 25 °C
3200 mAh
Nominal Capacity
at 25 °C
Min. 3250 mAh
Typ. 3350 mAh
Nominal Voltage3.6 V
Charging MethodCC-CV
Charging current1625 mA
Charging voltage4.2 V
Charging Time2 h
Cathode materialNichel Oxide-Based New Platform (NNP)
Table 2. Values of ΔQ3 and ΔQ4 at different charge rates.
Battery Charge Rates0.5 C (B1)1 C (B2)1.5 C (B3)
ΔQ3Cycle 21
19.47
Cycle 31
28.35
Cycle 21
13.73
Cycle 31
18.2
Cycle 21
10.58
Cycle 21
12.33
ΔQ4Cycle 21
18.66
Cycle 31
27.32
Cycle 21
13.24
Cycle 31
16.91
Cycle 21
10.48
Cycle 31
12.6
Δcycle101010
Disclaimer/Publisher’s Note: The statements, opinions and data contained in all publications are solely those of the individual author(s) and contributor(s) and not of MDPI and/or the editor(s). MDPI and/or the editor(s) disclaim responsibility for any injury to people or property resulting from any ideas, methods, instructions or products referred to in the content.