Abstract
All-solid-state batteries with a lithium negative electrode and a ceramic electrolyte are key toward high energy density. To ensure a safe, fast, accurate, and cost-effective development of this technology, the experimental methodology must be supported by the numerical modeling approach. This work proposes and describes an electrochemical model of a Li7La3Zr2O12 (LLZO) and Ni-rich NMC-based lithium cell with a deformable lithium negative electrode. Simulations were computed using the finite element method at different operating conditions to demonstrate the scope of the modeling work. Discharge rate tests, deformation tracking, geometric defect investigation, and polarization decomposition are described. Theoretical validation of the mass balance, the stripping rate, the ohmic polarization, and the mesh deformation demonstrated the consistency of the volumetric deformation strategy. We demonstrated in this study a deformable modeling strategy, which was found to be useful for the electrostripping analysis of anodic geometry defects during discharge. Non-uniformity in the lithium stripping rate was found along the anodic interface with defects, and this non-uniformity was accentuated with a higher discharge rate. The cell’s discharge potential was decomposed by considering the equilibrium potential and the polarizations of the main components of the cell. This post-processing was found to be useful for the understanding of the cell’s behavior.
1. Introduction
One way of improving lithium secondary batteries is to use lithium metal instead of conventional graphite as the negative electrode material, which increases the theoretical specific capacity of the negative electrode by a factor of ten (3861 mAh g−1 versus 372 mAh g−1 for a lithiated graphite electrode). A further way of improving lithium metal batteries is to use a solid electrolyte for enhanced safety and capacity retention. On one hand, this eliminates the need for flammable liquid electrolytes, and on the other, it mechanically impedes lithium dendrite growth [1,2,3,4,5,6,7,8].
The technological development approach to new batteries is generally experimental, which comes with a few shortcomings. First, numerous preparation steps and multiple tests are required to research, develop, validate, or optimize a new generation of materials, processes, or cells. Second, technology scale-up, for example, from button cell to pouch cell, can be a limitation when performing only experiments. Third, common characterization techniques are not very informative about the internal behavior of cells. Ultimately, a deeper understanding of electrochemistry through numerical modeling would ensure safer, faster, more accurate, and more cost-effective technological development [9,10,11].
In the 1990s, Doyle, Fuller, and Newman simulated the charging and discharging of Li-ion cells [12,13]. Lithium insertion into the active material was described following Newman’s work on porous electrode theory [14]. In 2010, Danilov et al. presented the modeling of an all-solid-state Li/Li3PO4/LiCoO2 cell and the decomposition of the total polarization. Three polarizations were evaluated: mass transfer polarization for the electrolyte and charge transfer and diffusion polarizations for the positive electrode [15]. In 2021, Chen et al. presented a detailed breakdown of the total polarization of a graphite electrode in a half-cell with a mobile anions electrolyte and a conductive additive in the negative electrode. Four polarizations were evaluated: mass transfer polarization for the electrolyte and also charge transfer, diffusion, and ohmic resistance polarizations for the electrode [16]. In 2023, Wang et al. presented a detailed analysis of resistances in current collectors [17]. In 2023, Xiong et al. presented a detailed polarization decomposition method for lithium-ion battery porous electrodes [18]. Several other authors have published electrochemical modeling studies of lithium batteries with liquid or solid electrolytes [19,20,21,22,23,24,25,26,27,28,29,30,31,32,33,34,35,36,37,38]. Among others, they have studied the thermo-mechanical behavior, predicted the performance, simplified the multiphysics models, and computed the Li transports for all-solid-state and Li-ion battery technologies. However, few authors have focused on modeling all-solid-state batteries with ceramic electrolytes, and only a little work was done on the decomposition of the total polarization of these batteries. Also, these studies do not account for the common geometric defects on the surface of the anode or solid electrolyte.
One promising ceramic electrolyte is Li7La3Zr2O12 (LLZO) due to its low electronic conductivity (10−8 S cm−1), high ionic conductivity (up to 10−3 S cm−1), high thermochemical stability, and wide electrochemical potential window (0–6 V vs. Li+/Li) [39,40,41,42,43,44,45,46,47]. An all-solid-state lithium metal cell with LLZO has two electrodes separated by LLZO and a positive electrode composed of a mixture of LLZO and active material. This was modeled by Horii et al. and Kravchyk et al. using a lithiated cobalt oxide active material (LiCoO2, LCO) [48,49]. These studies highlighted the effects of the LLZO microstructure, thickness, and content in the LCO cathode on the battery performance.
Currently, the transport electrification industry is considering using all-solid-state batteries and is looking for low-cost technologies that minimize the content of Co in the positive electrode. In this context, the present modeling work was focused on a Li/LLZO/(LLZO-NMC811) cell, where NMC811 is a Ni-rich layered lithiated nickel-manganese-cobalt oxide (LiNi0.8Mn0.1Co0.1O2). The layered lithiated cobalt oxide or LCO (LiCoO2) was also considered a comparative material for the cell’s voltage curves. The deformation of the negative electrode was tracked through the discharge in a ceramic electrolyte all-solid-state cell. The deformable geometry strategy was applied to investigate the electrostripping of anodic interface with common geometric defects. A decomposition of polarizations is also presented. This study describes in detail an innovative approach to predict the behavior of all-solid-state batteries (ASSBs) and a new approach that can support the development of technologies incorporating metallic lithium and solid electrolytes.
2. Methods
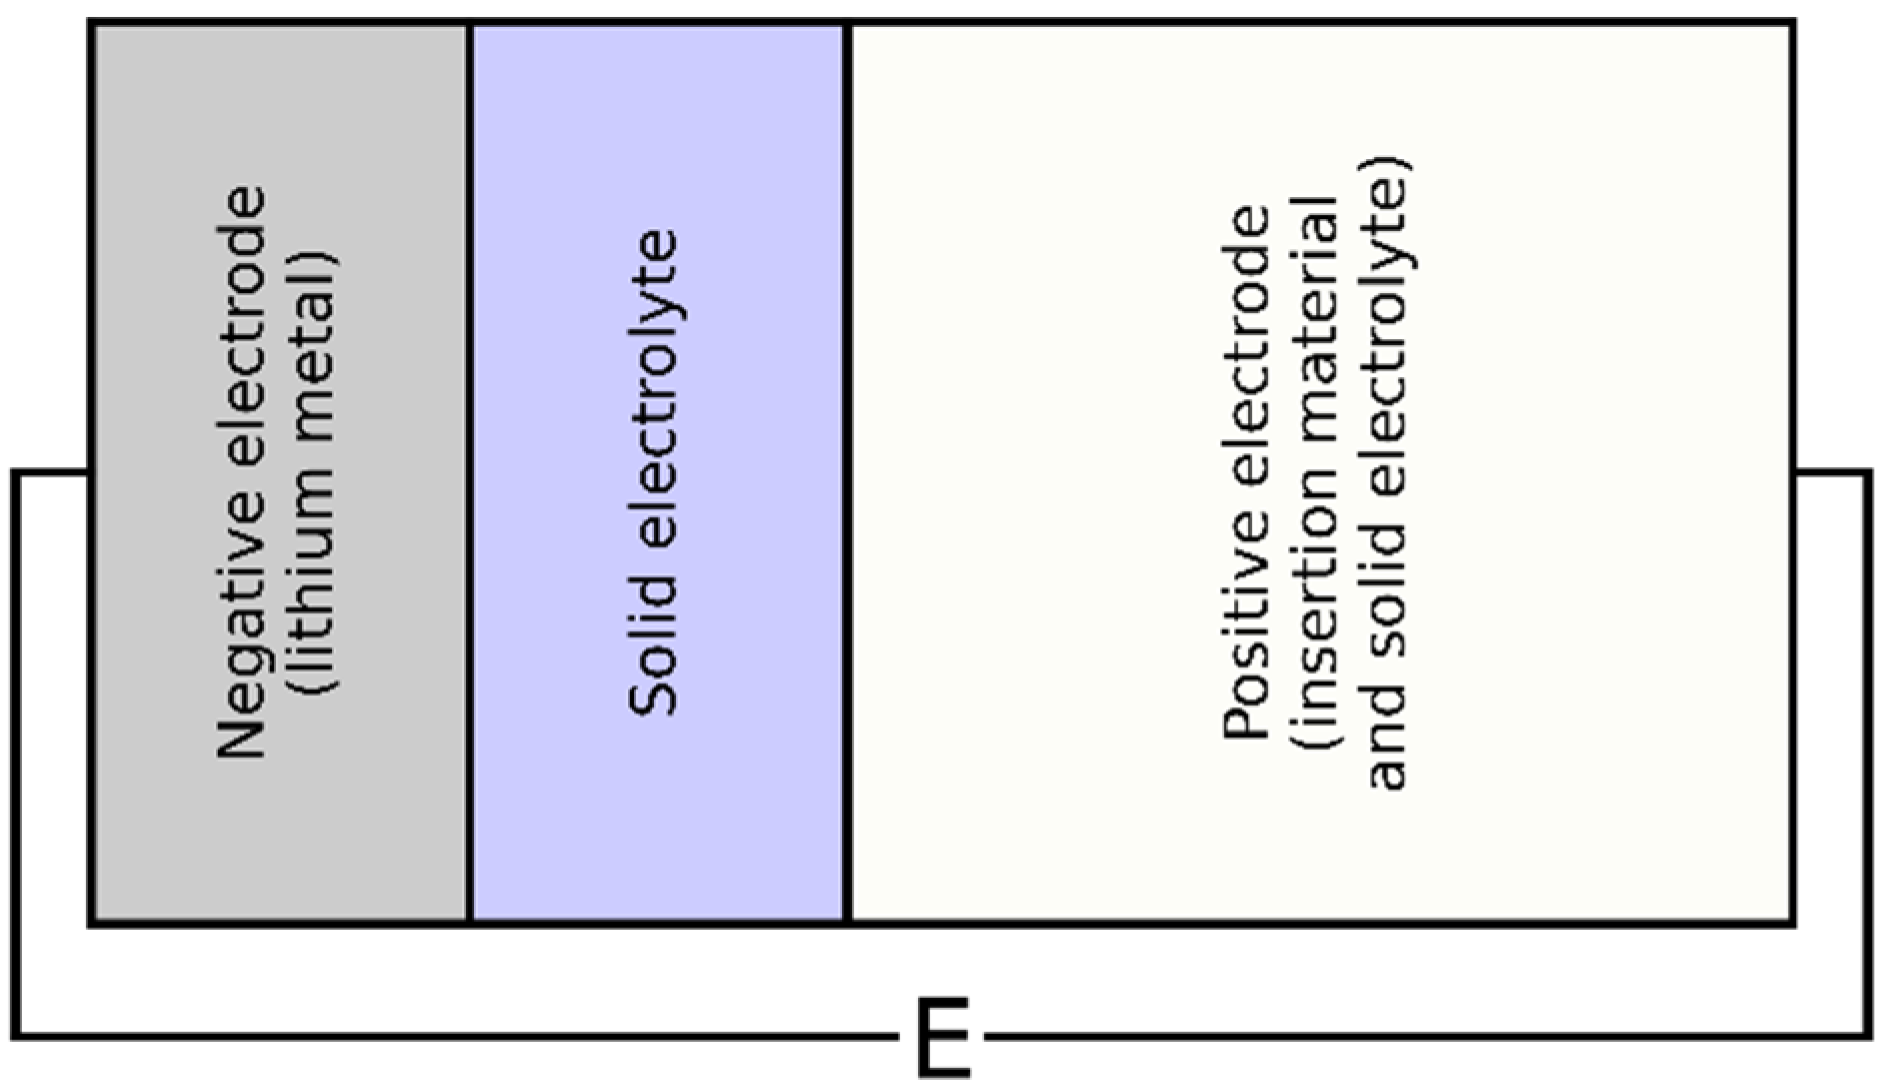
The all-solid-state cell, schemed in Figure 1, was divided into three main components: the lithium metal (negative electrode), the solid electrolyte, and the positive electrode consisting of a mixture of active material and solid electrolyte. During discharge, lithium was stripped from the negative electrode and transported to the positive electrode, where it became inserted in particles of active material.

Figure 1.
The 2D scheme of the all-solid-state cell.
2.1. Governing Equations
A numerical model was developed based on the following assumptions: (1) a fully reversible electrochemical cell, (2) isothermal, (3) a variable-volume metal negative electrode, (4) a solid electrolyte with immobile anions, (5) a positive electrode of invariable volume in which spherical active particles are homogeneously mixed with solid electrolyte, (6) with perfectly conducting current collectors, and (7) we considered a perfect interface with no interfacial resistance at both LLZO/Li and LLZO/NMC boundaries, as other studies did [36,49]. This assumption was valid as we simulated a cell with a non-degraded interface (without SEI, without additives, and so on). Additionally, LLZO-based solid electrolytes are often prepared using methods similar to those of the semiconductor industry [36], where there is excellent contact between the electrode and electrolyte surfaces. The symbols used in this model are shown in Table 1. The governing equations of the multiphysics numerical model are presented in Table 2.

Table 1.
Symbols used in the model.
Table 2.
Governing equations of the numerical model.
For the negative electrode, since the material was solid, electronically conductive, and ionically insulating, the only charge transport mechanism was the electronic conduction described by Ohm’s law. The conservation of electric charge was considered stationary, given the speed order of electronic conduction relative to the cell’s cycling timescales. The redox half-reaction was that of lithium, and its kinetic was described by the Butler–Volmer relation.
For the solid electrolyte, the lithium cation was the only mobile ion. Oxygen anions, on the other side, were immobile due to their high activation barrier. The dominant mass transport mechanism of lithium cations was migration [50]. There was neither polarization nor limiting current, as is the case for electrolytes with diffusive mass transport. The only polarization was ohmic. Since ionic conduction was much higher than electronic conduction, electronic conduction was negligible. The governing equations were the same as for electronic conduction in the negative electrode but this time considering the ionic conductivity of the solid electrolyte.
For the positive electrode, solid electrolyte was uniformly mixed with spherical particles of active material. Three sets of governing competing equations must be considered and applied over the entire electrode domain: one set of equations associated with electronic conduction in the active material, one with lithium migration into the solid electrolyte, and one with lithium insertion into the active material. Bruggeman’s relationship applied to the efficient electronic conductivity of the active material of the positive electrode and the efficient ionic conductivity of the electrolyte. Within the active material particles, the lithium-ion transport mechanism was diffusion. The quantity conserved was the mass of lithium cations. Fick’s first law describes the internal molar flux. Two boundary conditions were required. At the center of the particle, i.e., at in the spherical coordinate system, the condition of central symmetry applied. At the surface of the particle, i.e., at , i.e., at the interface between the active material and the solid electrolyte, the diffusion–insertion flux equivalence condition applied. The Butler–Volmer relationship described the chemical kinetics of lithium insertion into the active material. The exchange current density was adjusted according to the local lithiation state.
2.2. Deformation of the Negative Electrode
During discharge, the lithium metal negative electrode thinned; during charging, it thickened. This volume change was considered in the numerical model by a deformable negative electrode domain and a deformable negative electrode surface. The strategy for deforming the geometry is illustrated in Figure 2. The absolute plating or stripping rate was proportional to the anodic interface current density (Equation (1)), where the proportionality constant was . There were a few other mechanical considerations within the adopted model that should be noted. Mechanical stresses were not considered while the cell was subjected to volumetric and geometric change upon charge and discharge. An external stack pressure is generally required to avoid void formation between the lithium and the electrolyte films. This void formation was not considered in the present study. The volume change in the positive electrode was not considered either.

Figure 2.
The 2D scheme of the geometry deformation strategy. The negative electrode domain and surface were deformable. The domain of the solid electrolyte and that of the positive electrode were constant.
Since the mass transport mechanism in the solid electrolyte was migration, when the cell was discharged, the amount of lithium stripped from the negative electrode must equal the amount of lithium inserted into the positive electrode. To validate the moving-boundary strategy, these two quantities were used to post-process the areal discharge capacity ([=] mAh cm−2) in two ways. The mass balance was validated by the equality of the two calculated capacity values. The surface discharge capacity according to the lithium stripped from the negative electrode and the surface discharge capacity according to the lithium inserted in the positive electrode were, respectively,
2.3. Polarization Decomposition and Evaluation
The polarizations observed in an electrochemical cell were linked either to reaction activation, electrical or ionic resistance, or charge carrier depletion. The total polarization represents the potential difference between the electrochemical reaction’s ideal state and the current state. Furthermore, the equilibrium potential of the positive electrode varies according to its state of charge and temperature. The more lithiated the positive electrode, or the higher the temperature, the lower its oxidizing potential.
Two activation polarizations were observed in the cell under study. According to the Butler–Volmer equation, a kinetic polarization at the negative electrode, , varied according to the imposed current. It was evaluated at the interface of the negative electrode and the electrolyte. At the positive electrode, also following the Butler–Volmer equation, a kinetic polarization, , varied according to the imposed current, but this time the exchange current varied according to the local lithiation state of the electrode. It was evaluated at the interface of the electrolyte and the positive electrode.
Four ohmic polarizations were observed at (i) the negative electrode, (ii) the electrolyte, (iii) the active section of the positive electrode, and (iv) the electrolytic section of the positive electrode. The first two were evaluated by the potential difference in their domain. The third could be evaluated by . However, the fourth could not be evaluated by . The effective oxidation potential of the active material was that at the particle surface. Here, the concentration of lithium inserted differed from the concentration averaged across the whole electrode. Thereby, the ohmic polarization of the electrolytic section of the positive electrode could be evaluated as follows.
A charge carrier depletion polarization was observed. At the positive electrode, inside the active material particles, lithium diffused according to Fick’s second law. If the flux and particle radius were too high compared with the diffusivity of lithium in the active material, a concentration gradient set in. Here, the concentration of inserted lithium was different from the concentration averaged inside the particle. Thereby, the concentration polarization associated with this phenomenon was as follows.
The total polarization, , was equal to the sum of the absolute polarizations.
The cell potential was the difference between equilibrium potential and total polarization.
The total difference potential was the difference between the actual potential and the fully charged cell potential.
2.4. Simulation
The numerical model was solved following the finite element approach available in Comsol Multiphysics 6.1 [51]. The following considerations were taken. For the cell boundary conditions, a current density was imposed at one electrode, and an electrical ground was imposed at the other electrode. In the negative electrode, the geometry and the mesh were deforming through the discharge; in the electrolyte film and in the positive electrode, the geometry and the mesh were kept constant. The current distribution was initialized with a primary-type current distribution strategy. The time-dependent study was solved with the fully coupled parallel direct solver PARDISO. The LiionDB database was consulted to assist in selecting the appropriate parameter values [52]. Some parameters could have a range of values, e.g., ionic conductivity of LLZO varying from 0.1 and 0.01 S m−1. To illustrate the effect of the ionic conductivity of LLZO, we simulated the discharge potential curve at 1 C in Figure S1 of the Supplementary Materials. For this study, we chose a typical value of 0.1 S m−1, ensuring this aligned with practical applications. The parameters used in simulations are presented in Table 3. Since the cell’s capacity was limited by polarizations, a stop condition ensured that the discharge ended when the potential fell below 2.5 V.
Table 3.
List of parameters used for simulations.
3. Results and Discussion
3.1. Discharge Rate
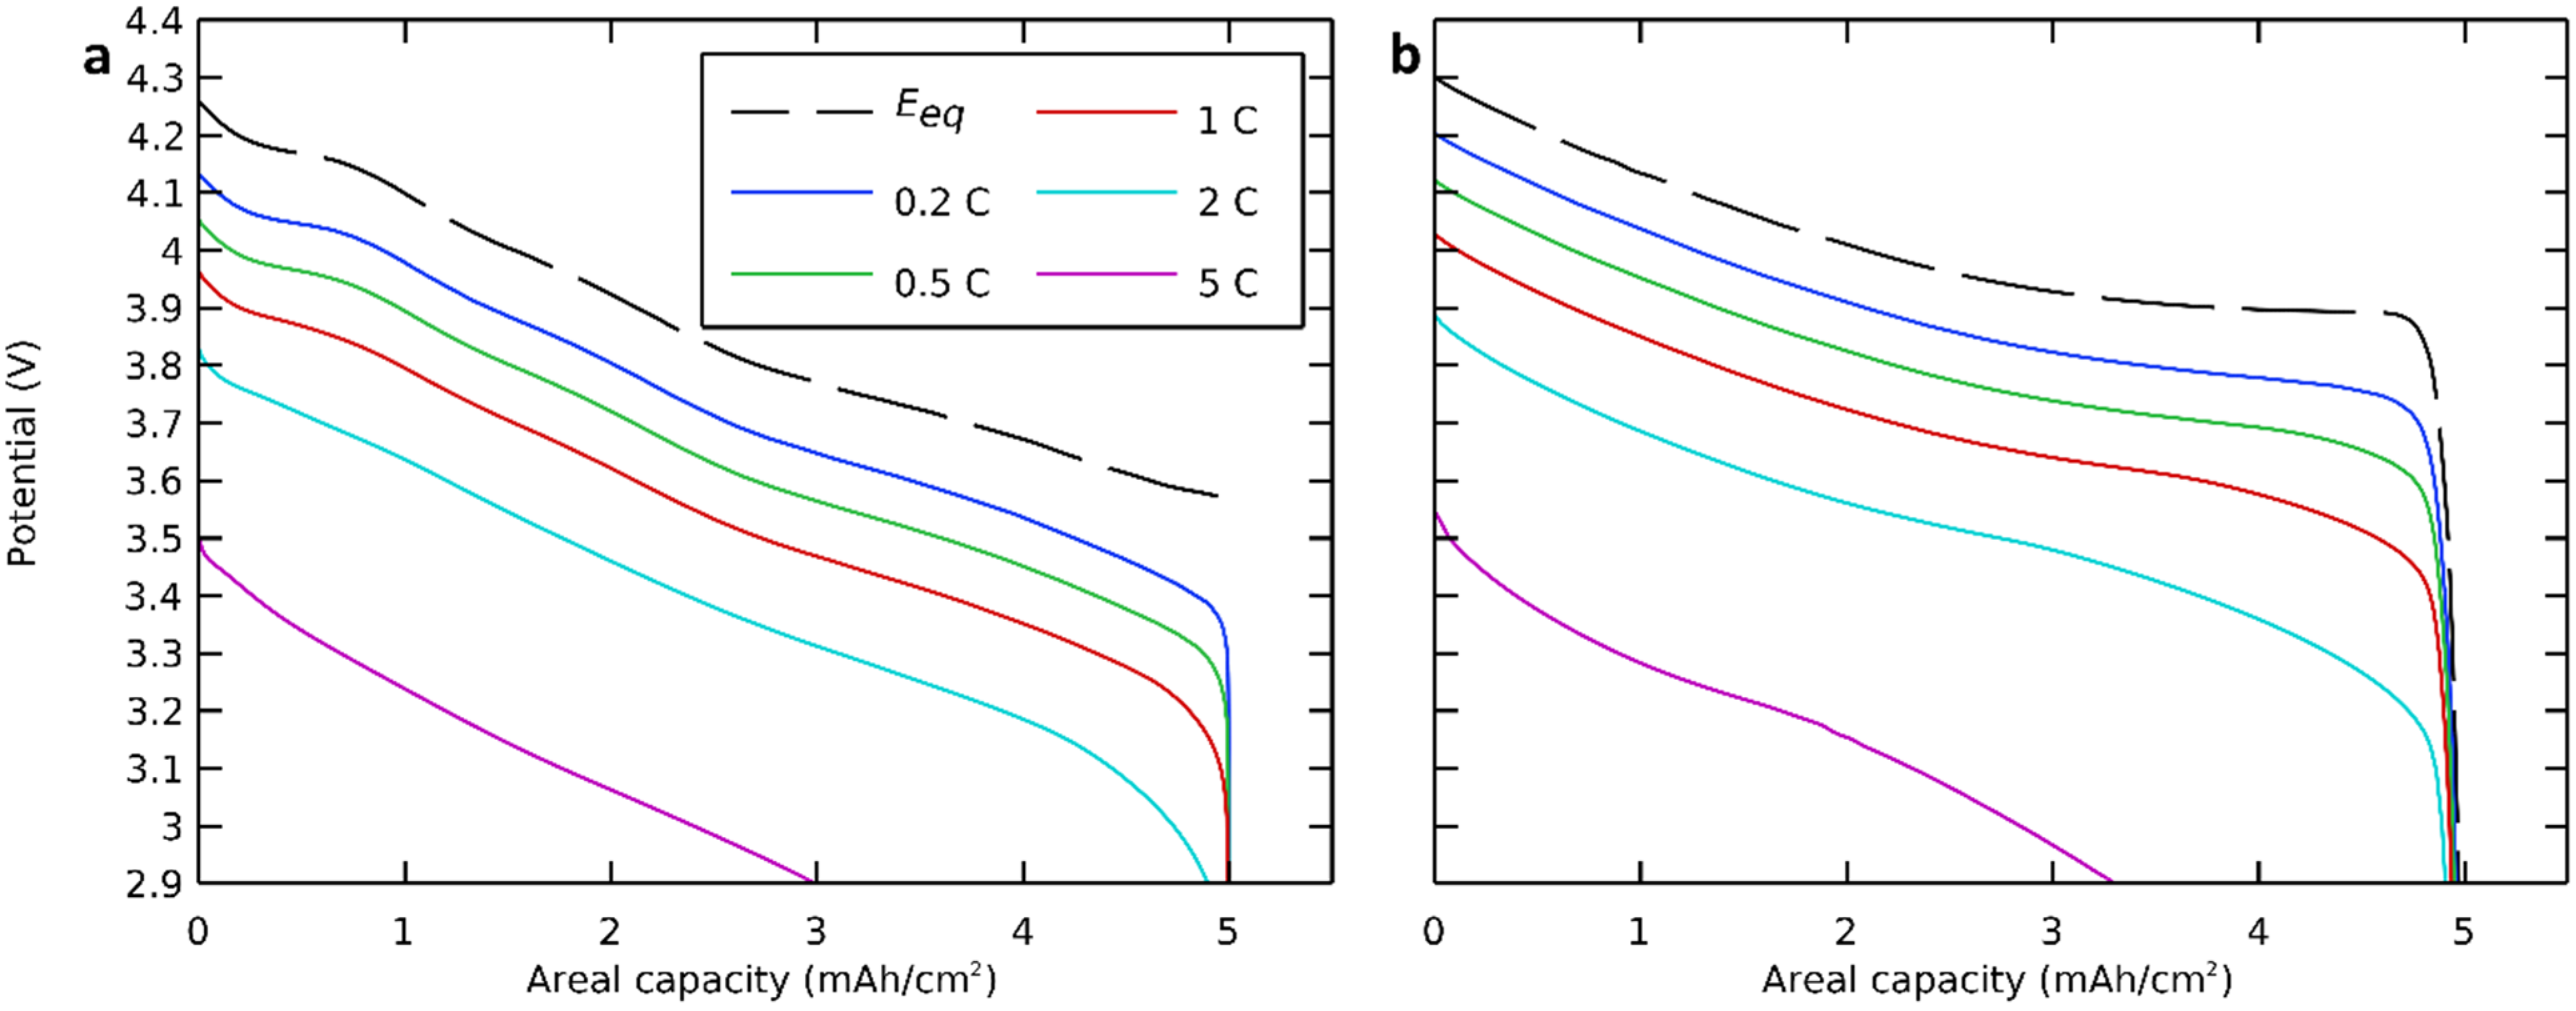
We first focused on the discharge curves of the modeled all-solid-state cell with NMC811 as the positive electrode active material at different discharge rates, and we compared this result with a modeled cell with LCO as the positive electrode active material. The governing equations (Table 2) were solved with nominal parameters (Table 3) at discharge rates of 0.2 C, 0.5 C, 1 C, 2 C, and 5 C. The simulated discharge voltage profiles are presented in Figure 3.
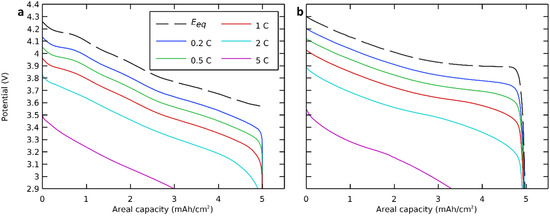
Figure 3.
Discharge potential curves at different discharge rates with (a) NMC811 and (b) LCO positive electrode active material.
The equilibrium potential, which indicated the potential of an ideal cell, thus without polarization or at a very low discharge rate, was also calculated and presented in the same figure [56,57]. Here, we see that even polarization-free or at very low discharge rates, the capacity and the cutoff voltage of a cell with an NMC-based positive electrode were lower than those with an LCO-based positive electrode. The theoretical areal capacity was calculated based on the lithium insertion in the positive electrode (NMC811) and was limited by polarizations, which will be discussed further.
3.2. Deformation of the Negative Electrode
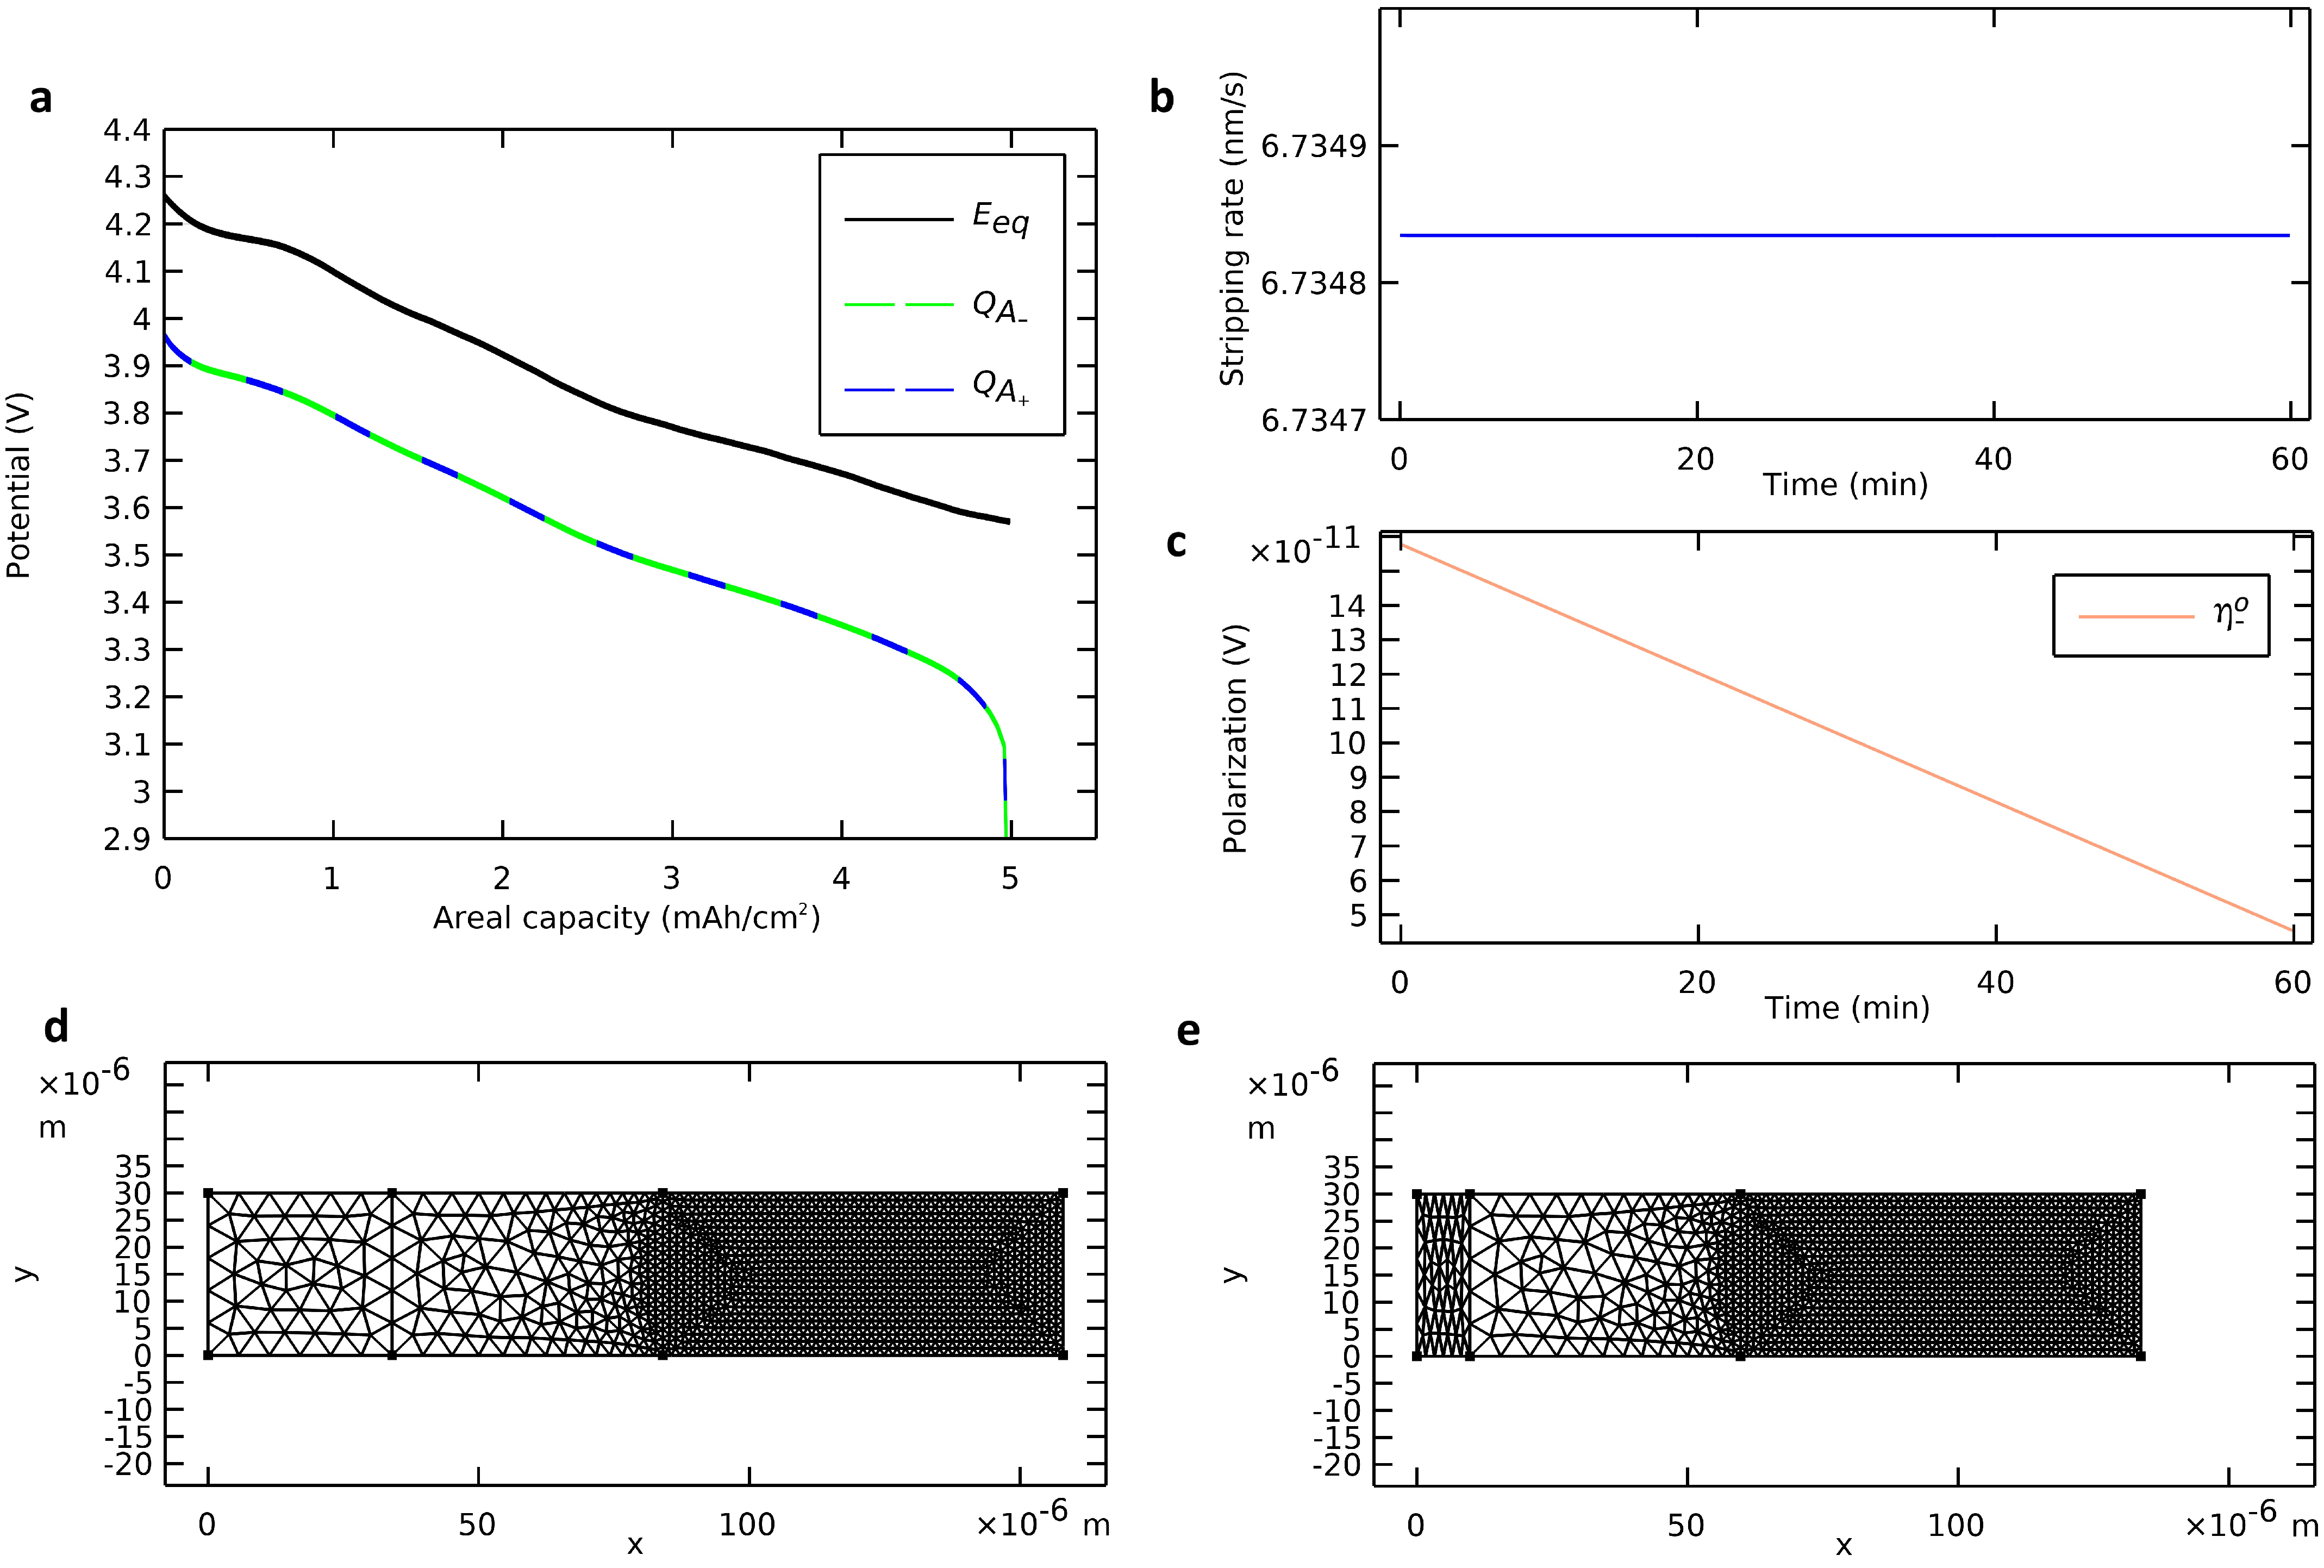
During a discharge of the modeled all-solid-state cell, we monitored the deformation of the negative electrode with a plane interface while using NMC811 as the active material for the positive electrode. The governing equations (Table 2) were solved with nominal parameters (Table 3) at a discharge rate of 1 C. The simulation results are presented in Figure 4. A video of the deforming mesh coupled with the voltage profile during the discharge is available in Supplementary Materials.
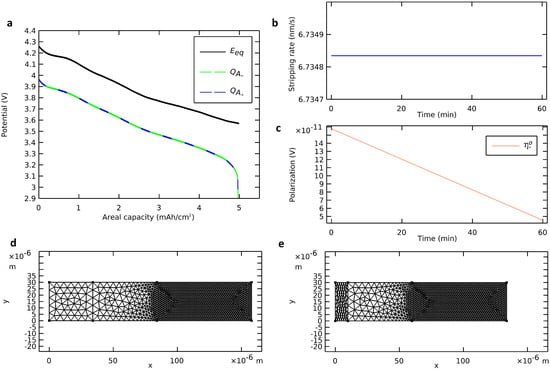
Figure 4.
Deformation of the negative electrode with a plane interface. (a) Voltage profile calculated from the deformation of the negative electrode (dashed green curve) and from insertion in the positive electrode (dashed blue curve) compared with the profile of an ideal cell. (b) Stripping rate and (c) ohmic negative polarization. (d) Initial state and (e) final state of the deformable mesh.
To validate the deforming geometry strategy, four elements are observed: (i) the mass balance, (ii) the stripping rate, (iii) the ohmic polarization, and (iv) the mesh deformation. Due to the immediacy of the migration mass transfer mechanism, there was no accumulation of lithium in the electrolyte. Hence, the quantity of stripped metallic lithium from the anode surface equaled the quantity of inserted ionic lithium in the cathode active material. The two methods proposed for calculating the areal capacity during the discharge (Equations (2) and (3)) were followed (Figure 4a). They were in line with each other and validated the mass balance. The stripping rate (Figure 4b) and the anodic ohmic polarization (Figure 4c) were probed during the discharge. The stripping rate was positive and constant. Also, the anodic ohmic polarization was negligible, positive, and decreasing. These observations aligned with theoretical considerations of Equation (1) and Ohm’s law. The mesh was actualized at each time step from the beginning of the discharge (Figure 4d) until its end (Figure 4e). The negative electrode was contracting while the rest of the cell remained unchanged. At the end of the discharge, the cell was almost anode-free with only a 10 µm film of lithium negative electrode left as a cathodic reactive surface for the charging step. The mesh contraction at the end of the discharge, when there was a sudden drop of voltage, was consistent with the mass of lithium migrated from the anode to the cathode.
3.3. Electrostripping of Geometric Defects in the Anodic Interface
There would be no significant difference between the results obtained from a 1D or 2D model regarding the ohmic potential drop when using a planar anodic interface. However, one insight of the 2D deformable geometry strategy was the capability to study the transient electrostripping of defects in the anodic interface.
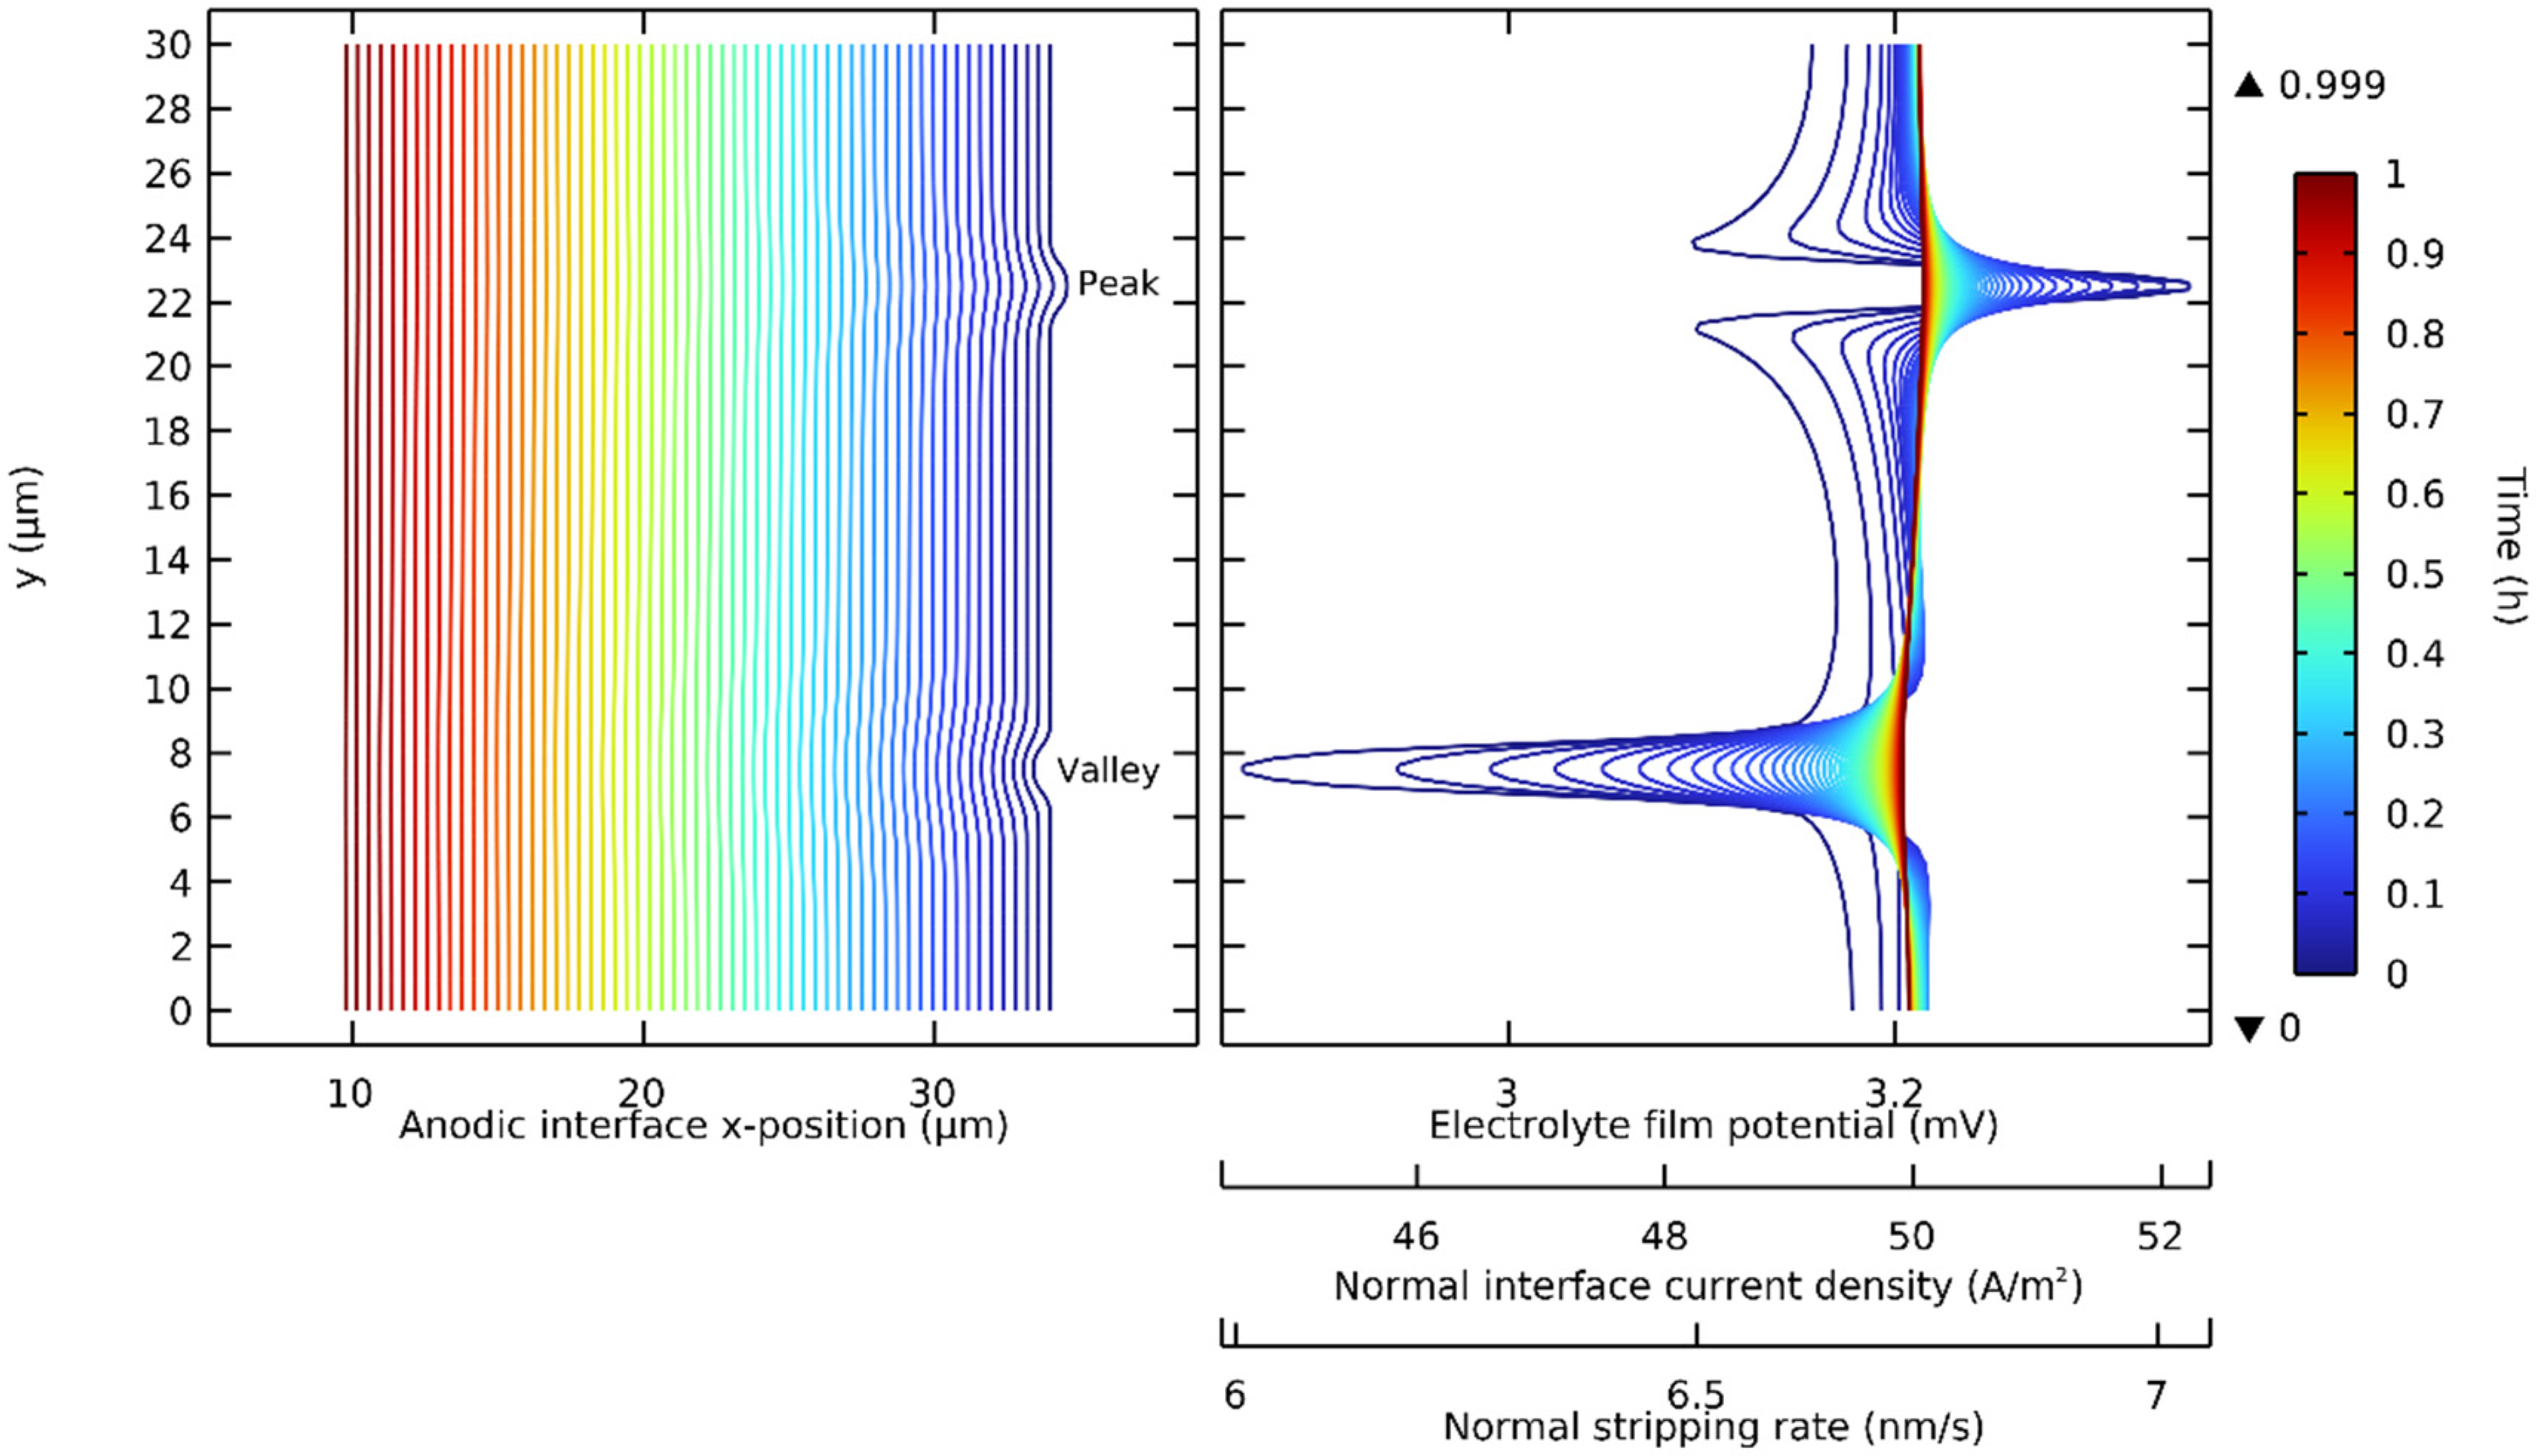
The deformation strategy presented in Figure 2 was extended with the use of a volume-constant deformable single-ion electrolyte. The electrostripping of a lithium anode with a peak and a valley, two common anodic interface defects, was investigated. It was assumed that the submicron defects were thin enough to allow perfect interfacial contact during the simulated discharges. The governing equations (Table 2) with NMC811 were solved with nominal parameters (Table 3) at a discharge rate of 1 C. Figure 5 shows the interface deformation progression. The anodic interface x-position is shown in time with three proportional variables, which we identify. These are the electrolyte film potential, the normal current density at the interface, and normal stripping rate.

Figure 5.
Progression of the electrostripping of a lithium anode with two geometric defects at the interface: a lithium peak and a lithium valley. Contour lines represent time from 0 to 1 h (1 C) with 30 s time steps.
It was demonstrated that on a lithium peak, the electrolyte film potential, the normal interface current density, and the normal stripping rate were maximized on the tip and minimized on the edges. It was also demonstrated that the opposite phenomenon occurred in a lithium valley: each of these proportional variables was minimized in the base and maximized on the edges. The geometric defects on the lithium made the stripping rate non-uniform, and this non-uniformity along the interface, while reduced during the discharge, was maximal at the initial time step.
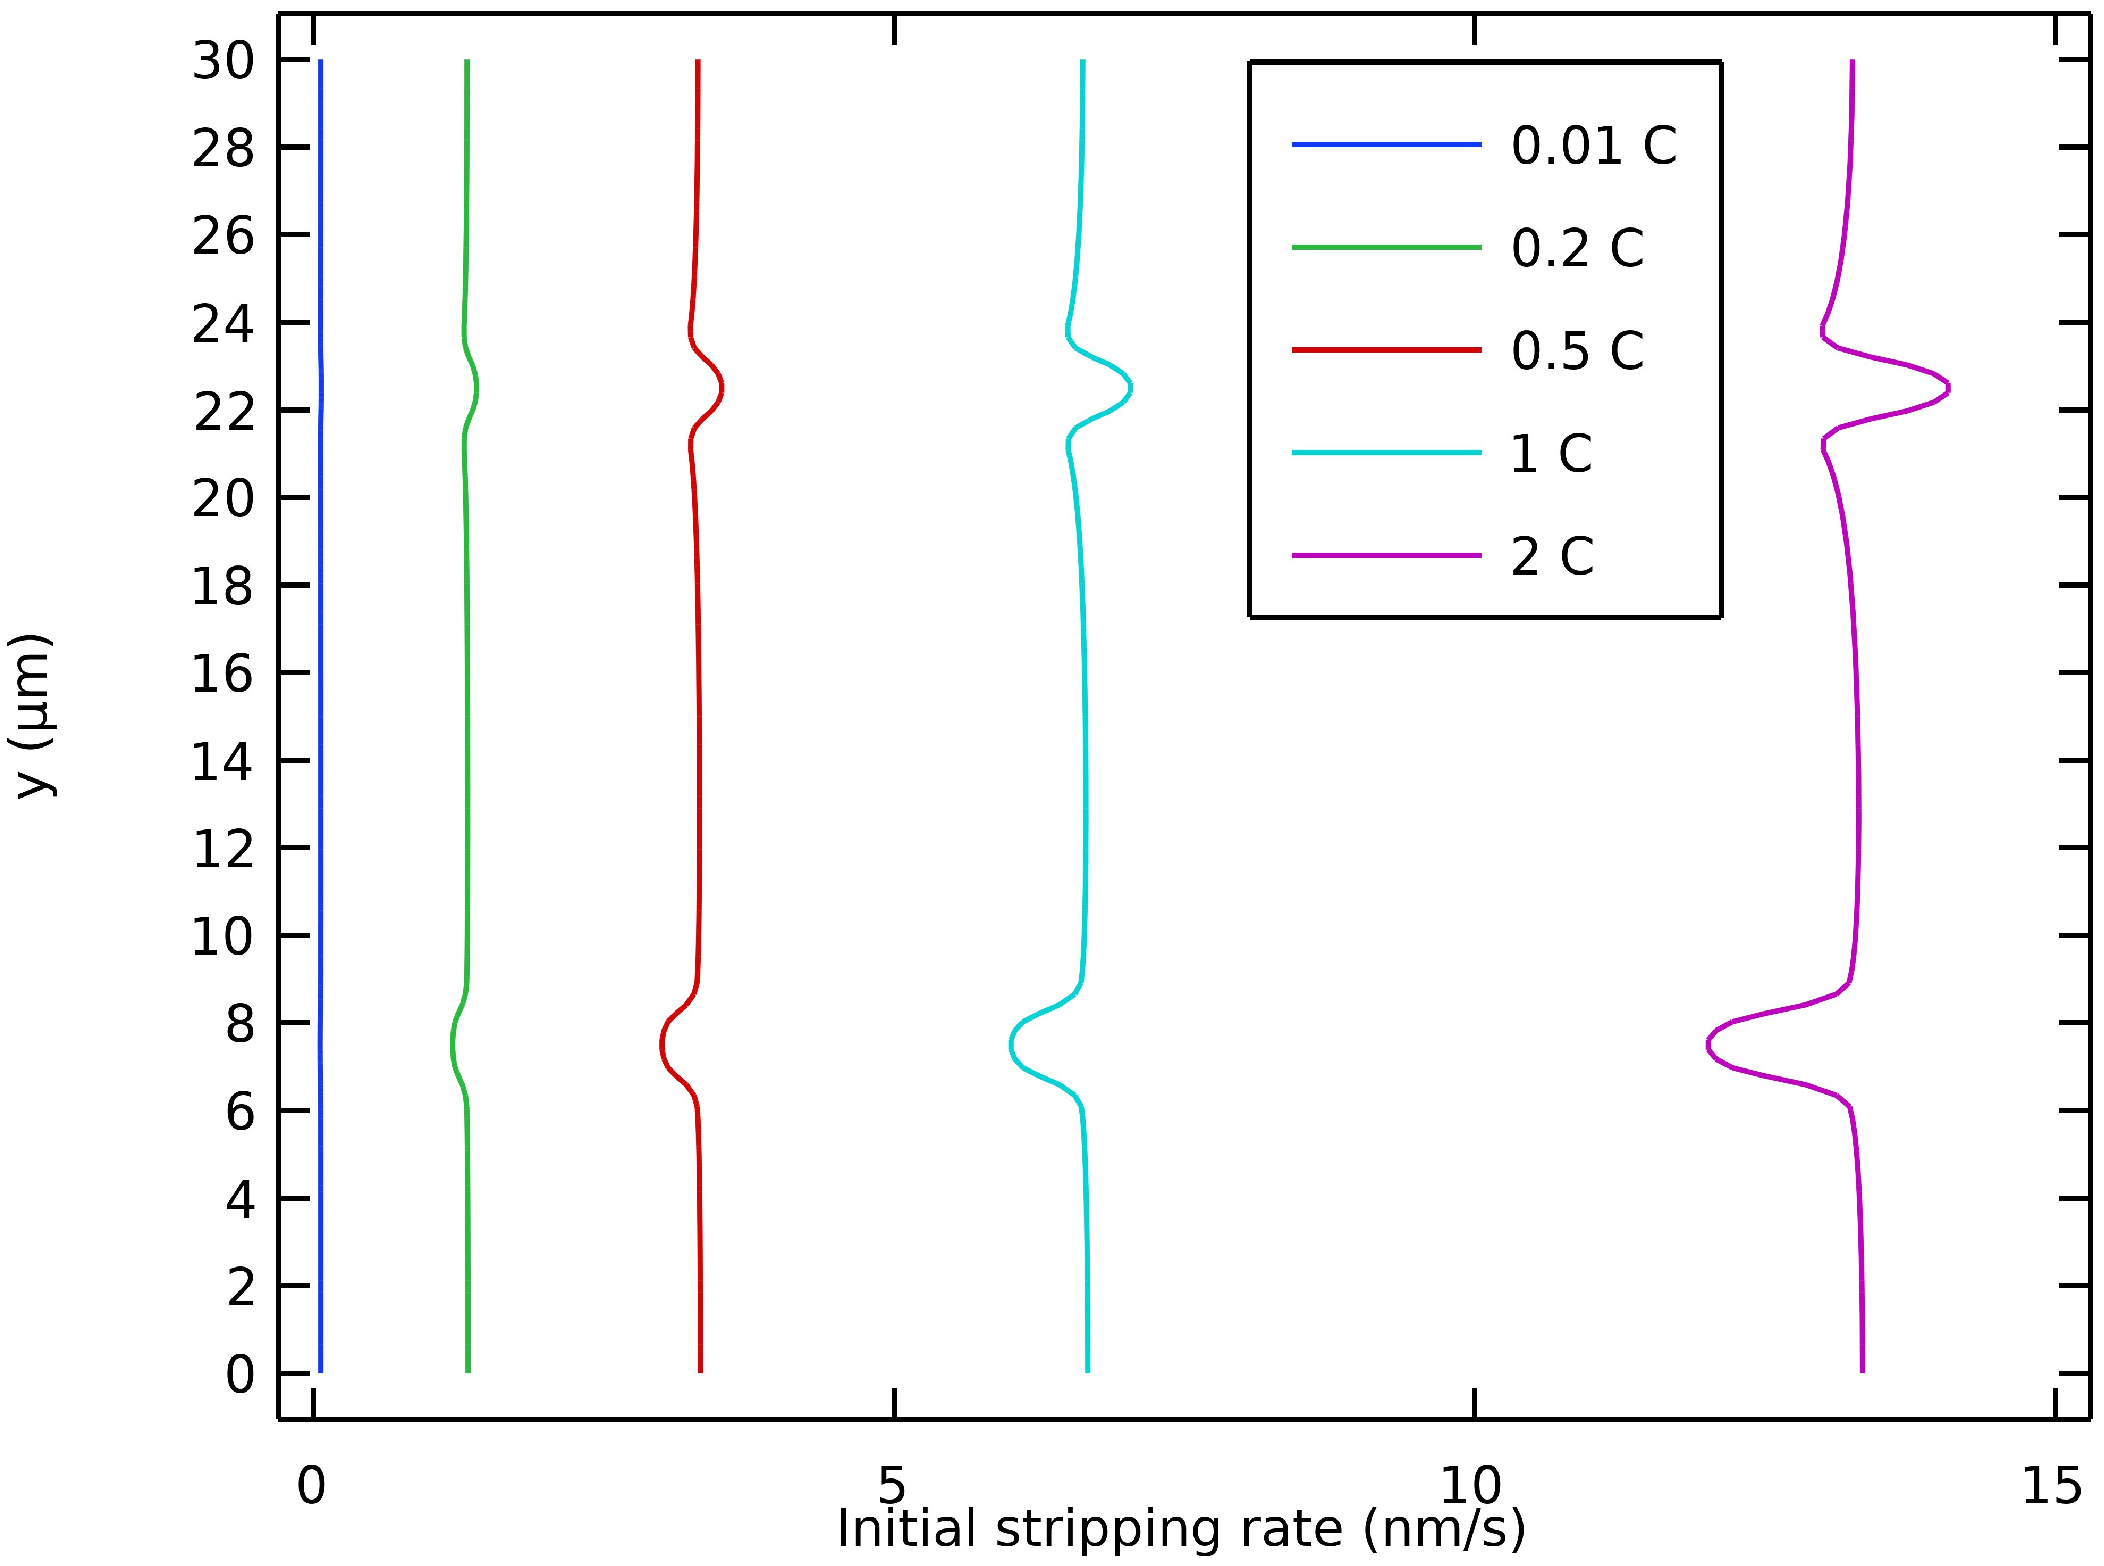
Figure 6 shows the initial value of the stripping rate at different discharge rates. It is shown that the non-uniformity of the initial stripping rate along the interface was accentuated at higher discharge rates. The locations around a geometric defect with the highest stripping rate were on the edges for a valley and on the tip for a peak. If the interfacial contact was not maintained, it was at these locations that voids would be inclined to form. This could occur if the lithium flow from inside the electrode was locally insufficient or if the surface of the electrolyte was strictly non-deformable. Recently, Vishnugopi et al. have also reported that a contact loss might appear during stripping [58]. This is more inclined to occur at higher discharge rates, i.e., when the stripping rate variability along the interface is accentuated. These results on the effect of different discharge rates are in accordance with the predictions recently presented by Carmona and Albertus in their work on stationary current distribution at the Li/LLZO interface [59].
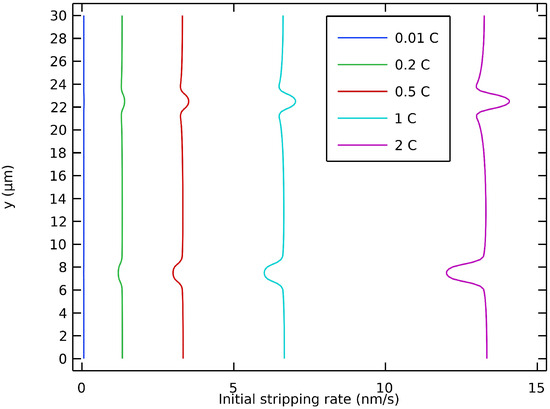
Figure 6.
Initial stripping rate of anodic interface with defects at different discharge rates.
3.4. Decomposition of Polarizations
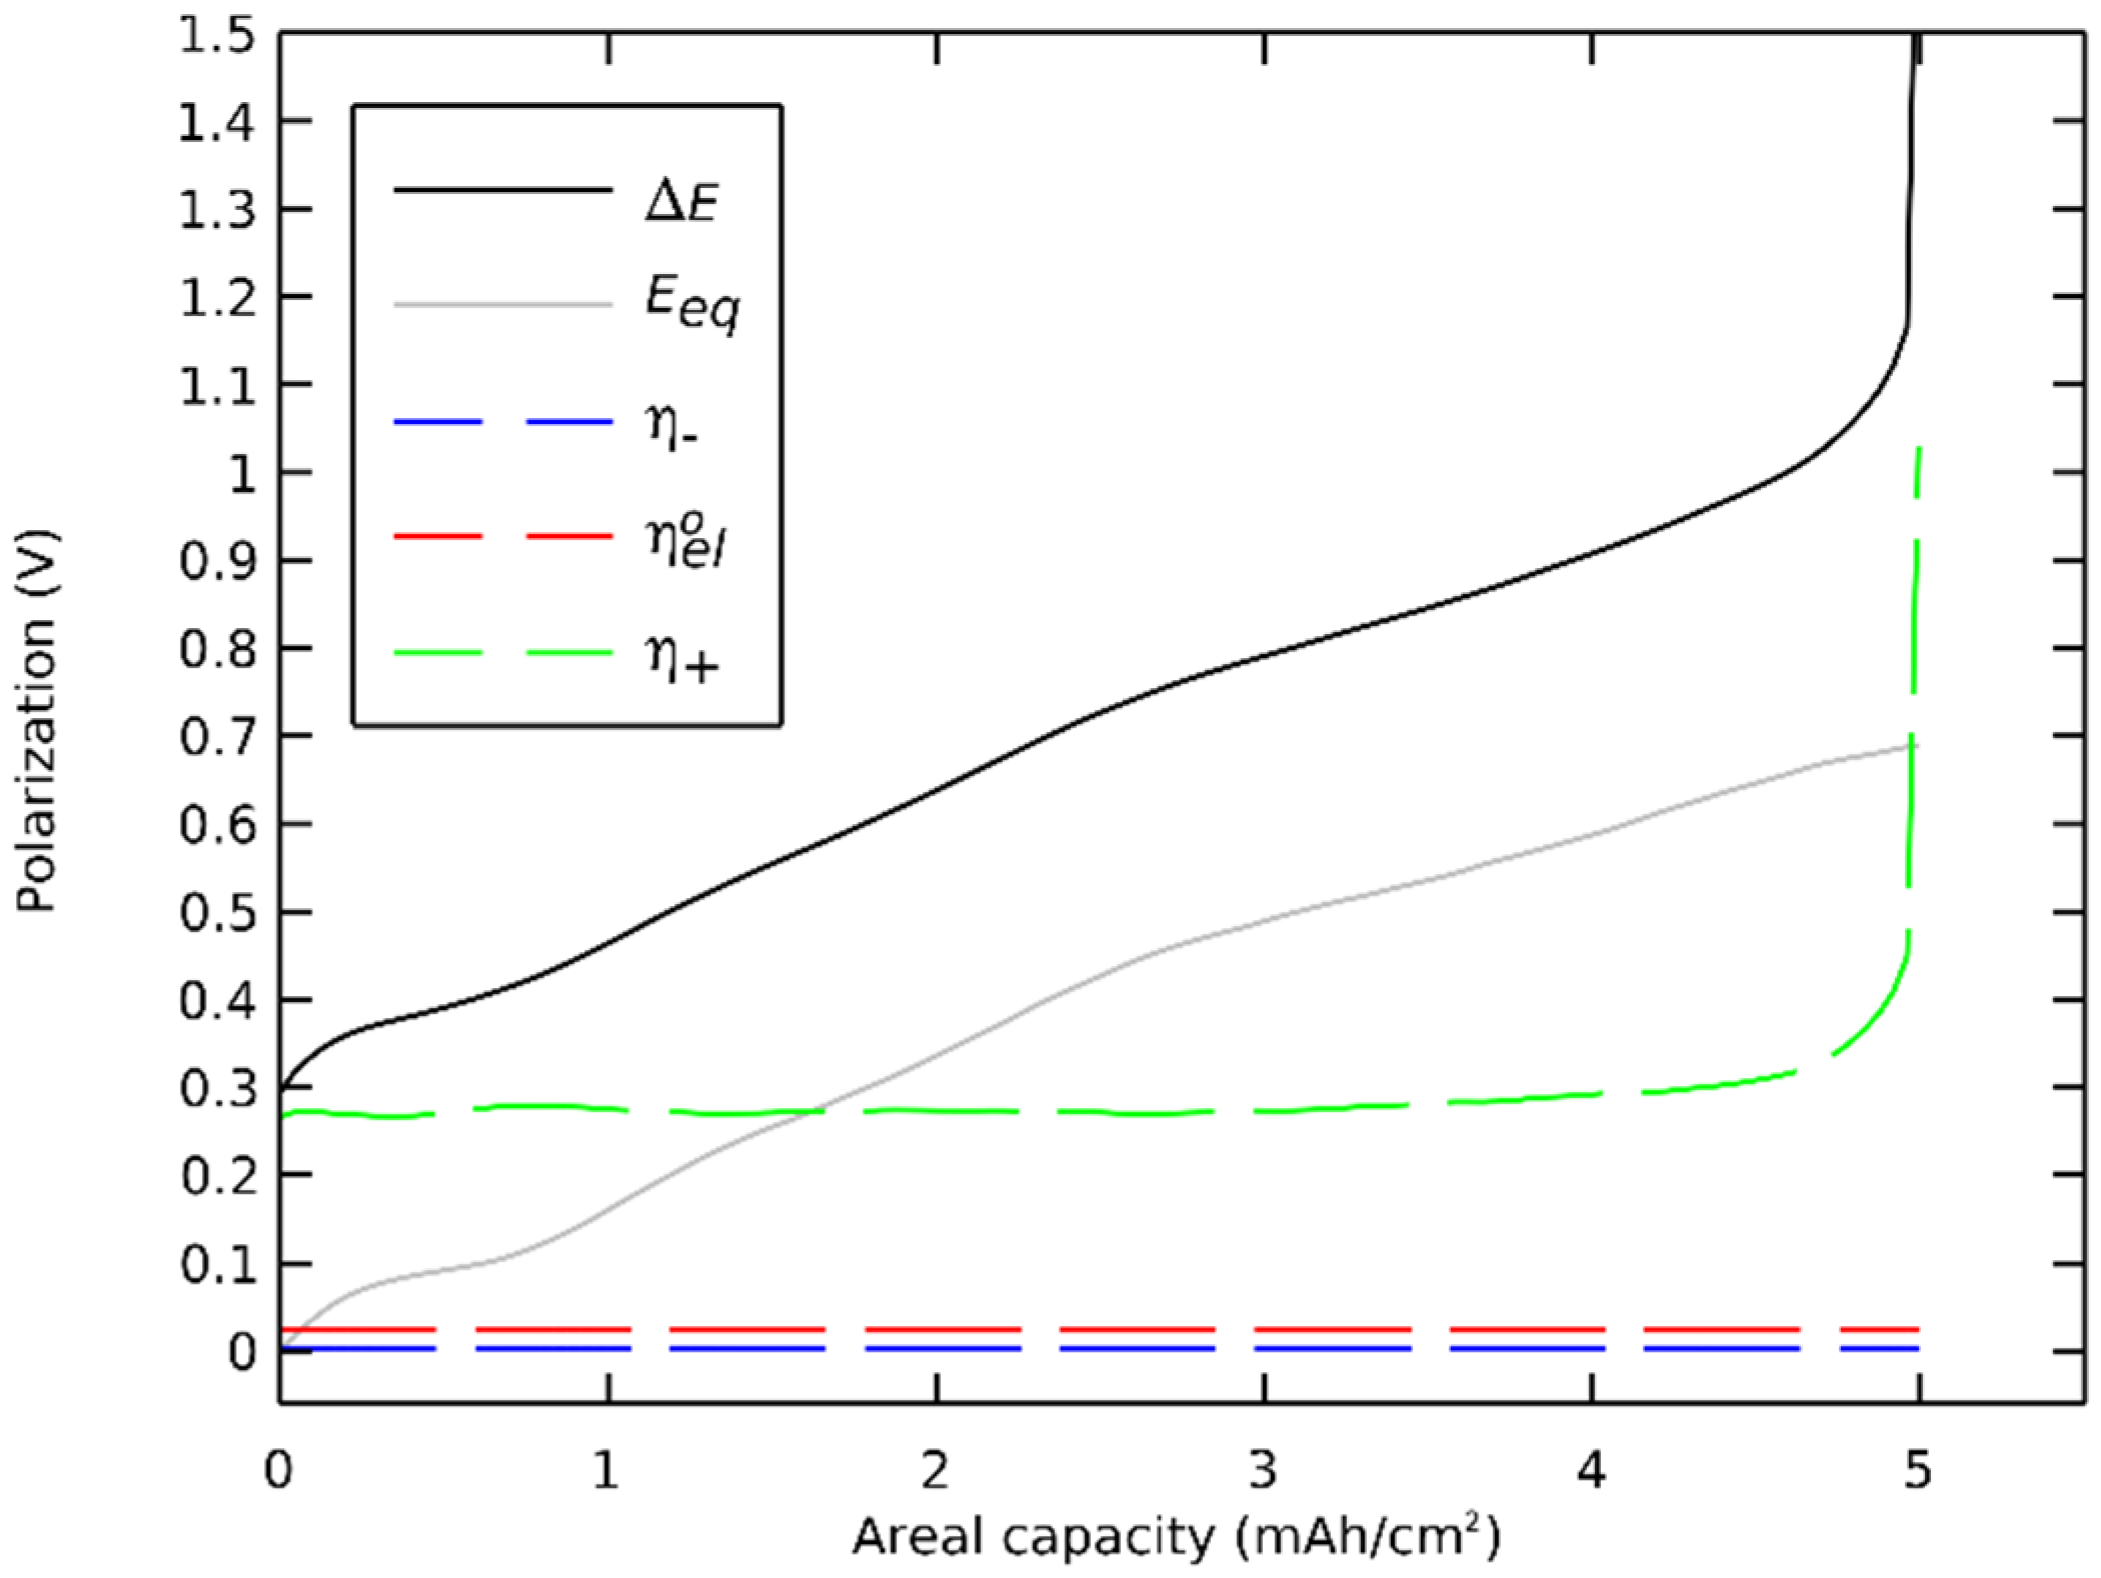
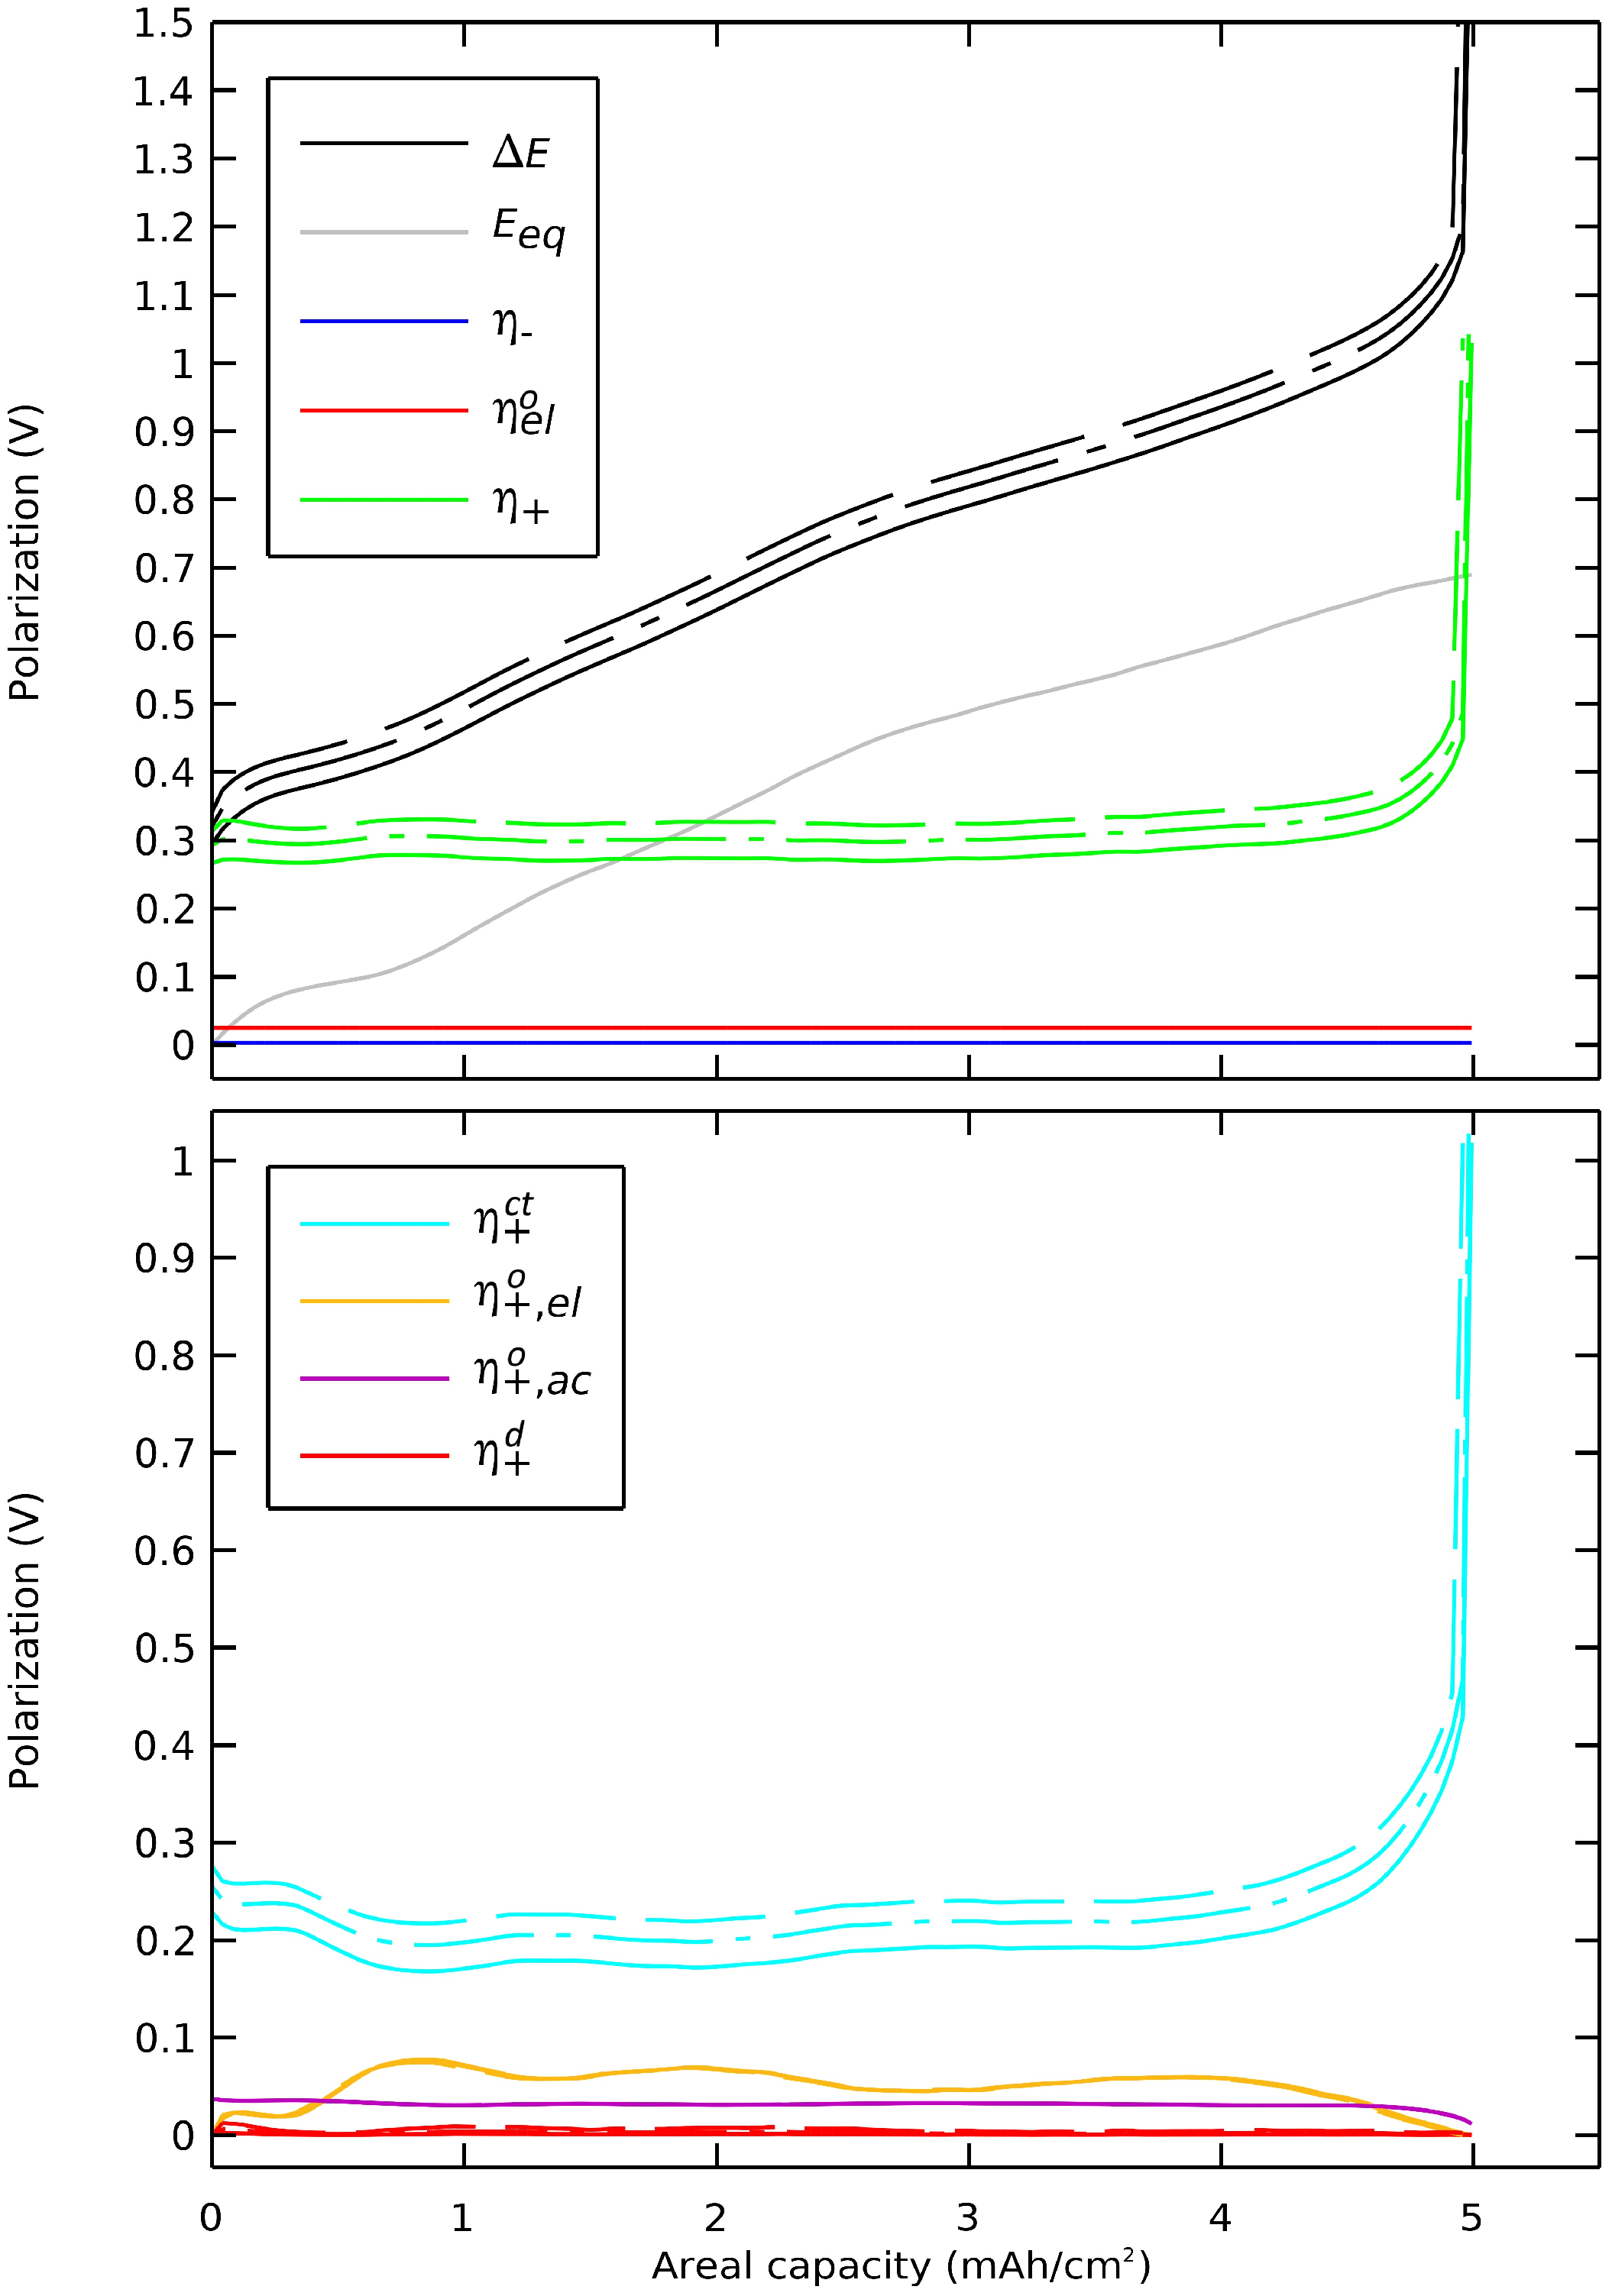
We then decomposed the polarizations of a general case Li/LLZO/(LLZO-NMC811) cell during a discharge. The polarizations were extracted from the preceding section’s simulation where the governing equations (Table 2) were solved with nominal parameters (Table 3) at a discharge rate of 1 C. The polarizations of main components are presented in Figure 7, and the order of magnitudes of all polarizations are shown in Table 4.
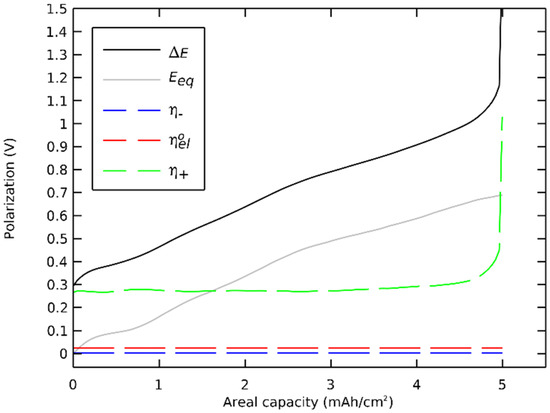
Figure 7.
Polarization breakdown profile.
Table 4.
Order of magnitude of all polarizations.
The sum of polarizations with the equilibrium potential equaled the potential difference. The polarization of the negative electrode, especially the ohmic contribution, was several orders of magnitude lower than the total polarization. The ohmic polarization of the electrolyte between the electrodes was also orders of magnitude lower that the total polarization. The cell’s discharge concluded not at 3600 s but at 3595 s with a sudden and significant rise of the polarization in the positive electrode. The capacity was limited by the charge transfer polarization that increased when the surface insertion concentration approached the maximal concentration.
The charge transfer contribution was dominant, showing that the cell was reaction limited. This limitation was linked to the 0.942 maximal state of the charge coefficient of the NMC811, which highlighted the charge transfer polarization. This effect was unique to active materials with a maximal state of charge coefficient lower than one. On an equivalent cell with LCO as a positive active material, with a maximal state of the charge coefficient of 1, the final voltage drop would have a significant diffusion polarization contribution together with an equilibrium potential drop.
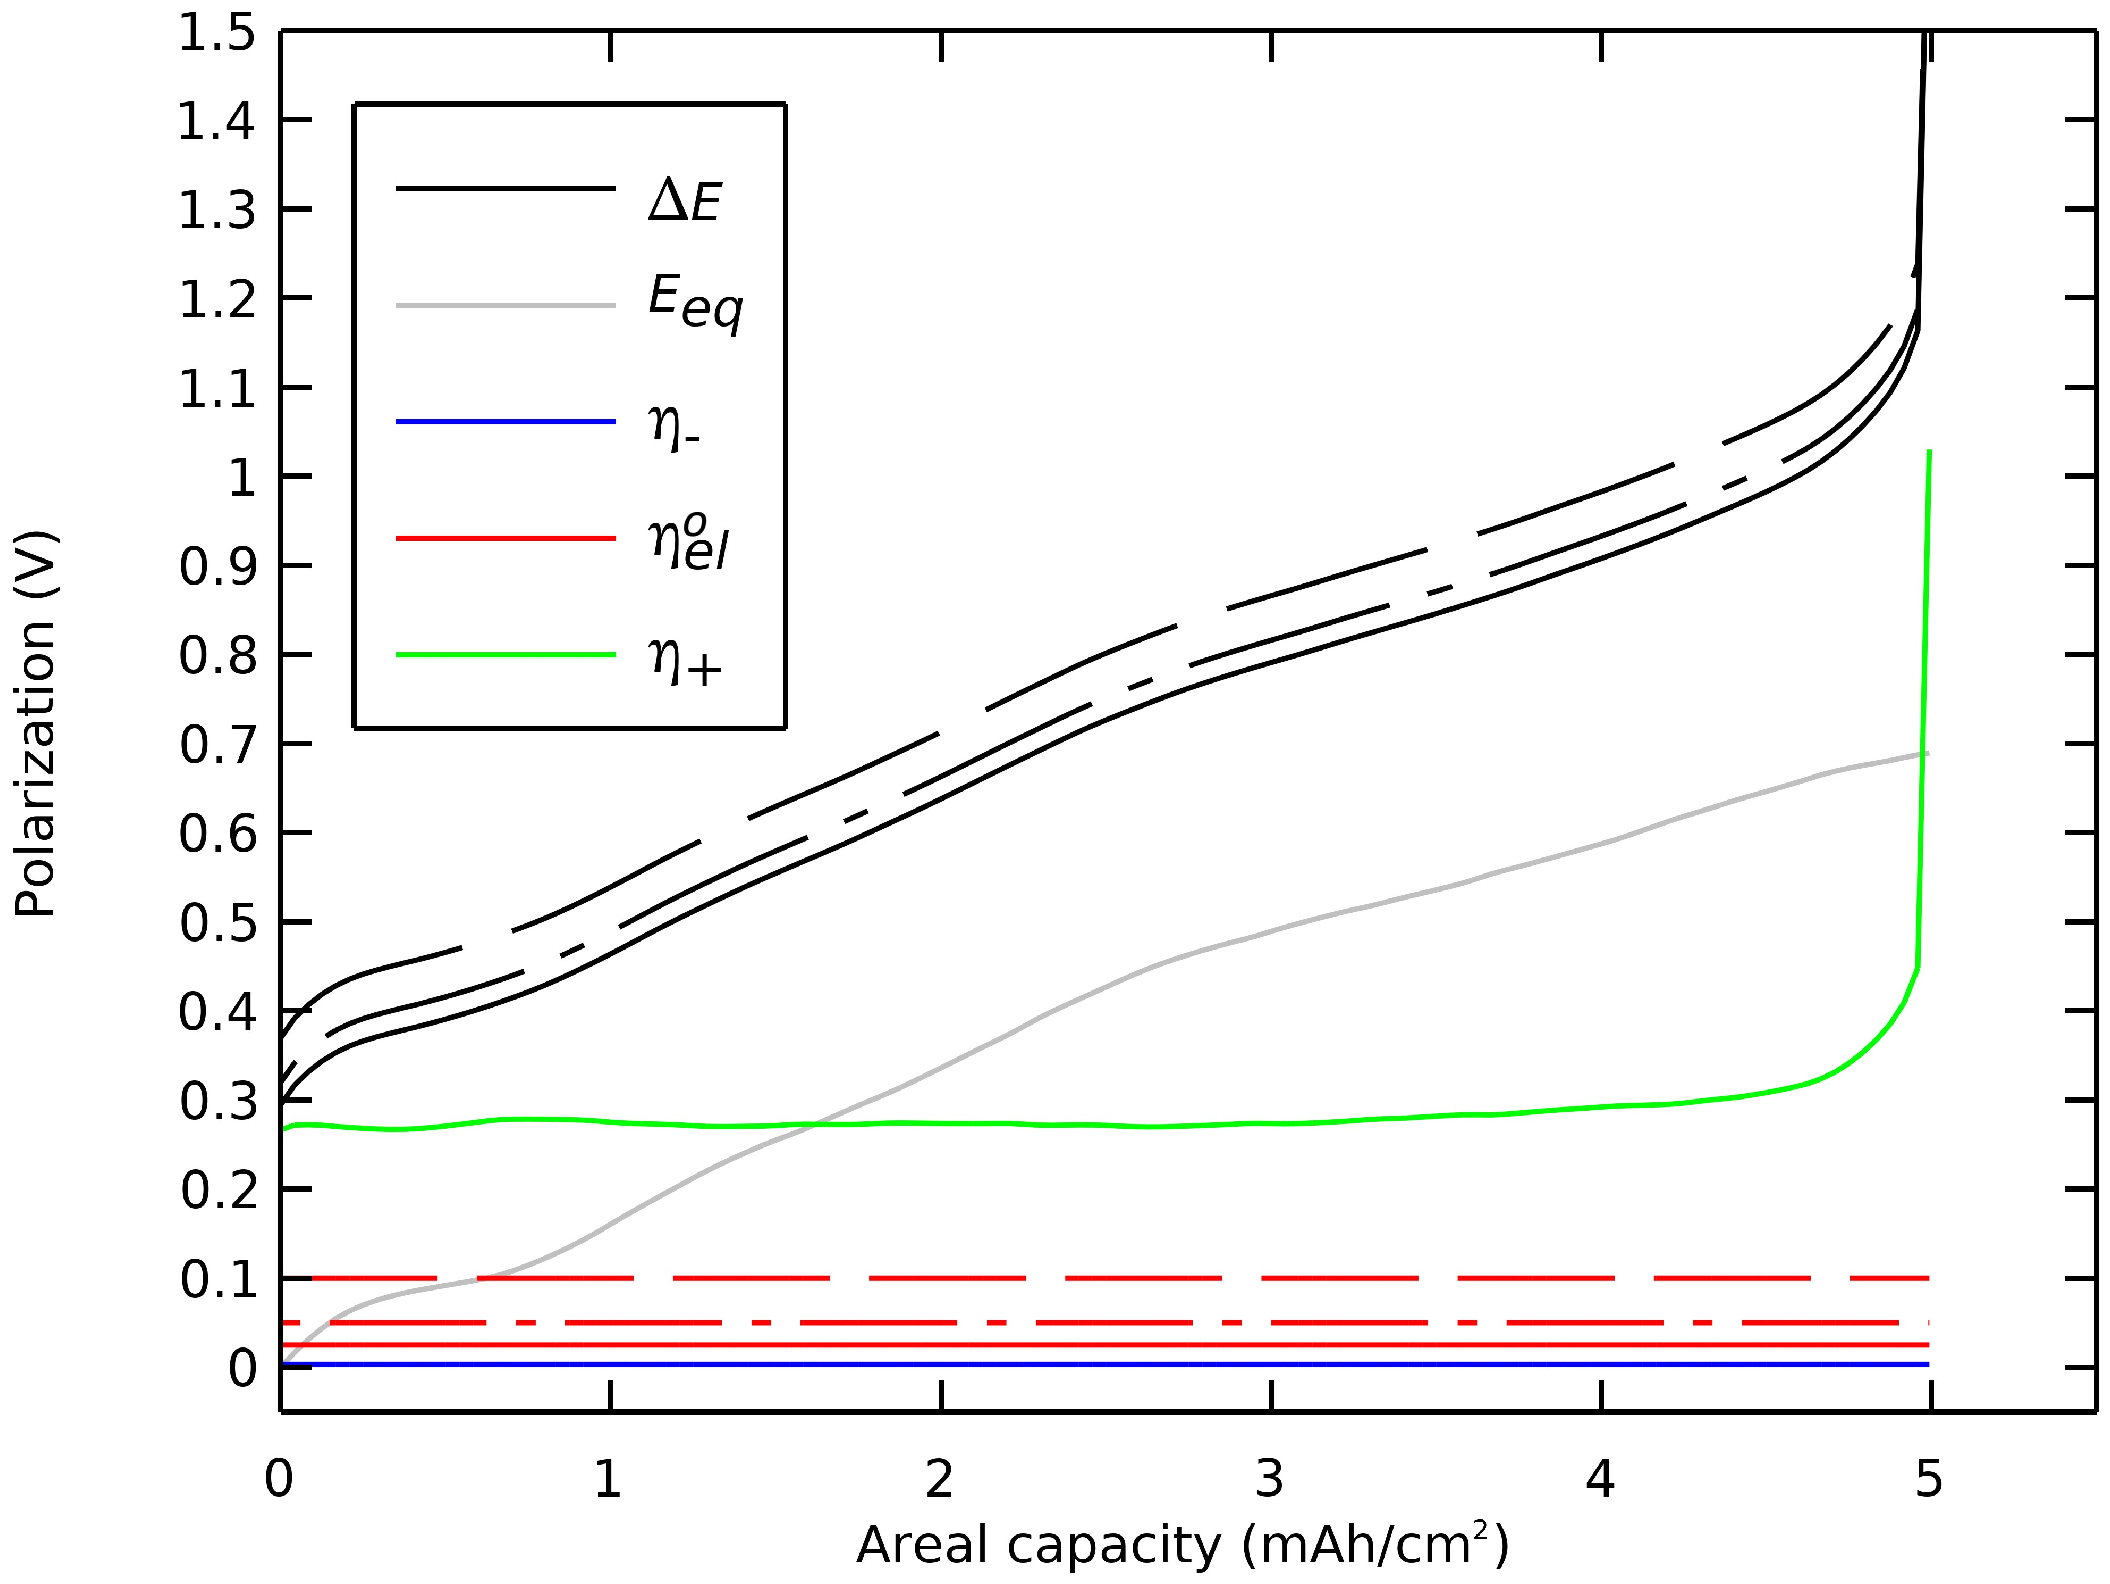
One insight of this decomposition of polarization was to examine the impact and the tuning of key design parameters on the cell’s voltage profile. Here, we repeated the preceding section’s simulation but here with (i) a thicker film of electrolyte between the electrodes and (ii) a larger radius of active particles in the positive electrode. Figure 8 shows that a thicker electrolyte film would lead to an undesired decrease in voltage by an ohmic drop. However, a thinner film of electrolyte, under 50 µm for this simulation case, would not be a key to enhancing the cell’s capacity or voltage. The aim of achieving ultrathin ceramic electrolyte film was to increase energy density and specific capacity of the cell due to a weight and volume reduction.

Figure 8.
Impact of the thickness of the single-ion electrolyte film on the cell’s polarization. Thicknesses of (-) 50 µm, (-.) 100 µm, and (--) 200 µm.
The upper part of Figure 9 shows that a larger radius of the active particles in the positive electrode would lead to a deteriorated voltage profile. The lower part of Figure 9 shows that this impact was more precisely due to charge transfer activation limitation and also shows that the other polarization components in the positive electrode were not significantly affected. A larger radius of active particles led to undesired decreased capacity and voltage of the cell. A radius smaller than 10 µm for this simulation case did not lead to improvement in capacity but in voltage only. The limitation in capacity occurred due to the rise in charge transfer polarization as the surface insertion concentration drew closer to its maximum level. The lower voltage from the beginning of the discharge was caused by the increased surface area of the active materials. This indicated that in a positive electrode with a particle-sized distributed active material, larger particles could contribute more to the voltage drop than smaller ones.
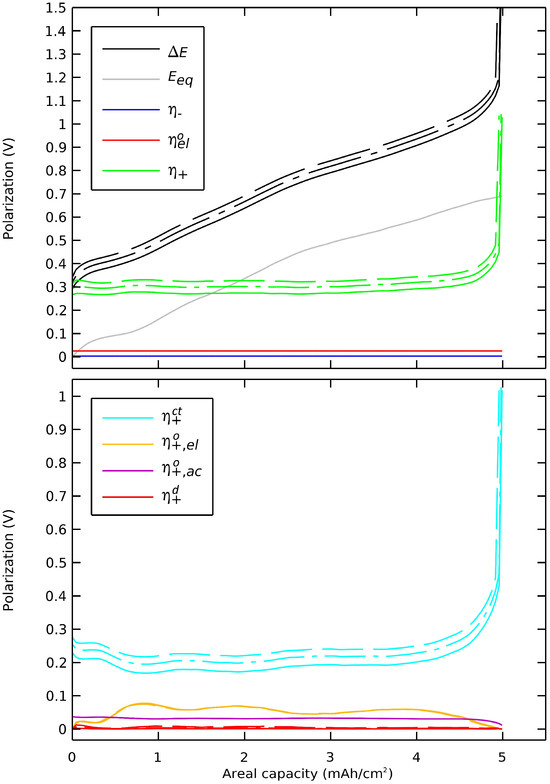
Figure 9.
Impact of the active particles’ radius in the positive electrode on the cell’s polarization. Radii of (-) 6 µm, (-.) 10 µm, and (--) 15 µm.
4. Conclusions
This research paper presents a numerical electrochemical model of an all-solid-state cell with lithium metal electrode, a ceramic solid electrolyte, and a low-cobalt positive electrode. The studied ceramic solid electrolyte was LLZO, and the studied positive electrode active material was NMC811. The mobility of the lithium ions in the electrolyte was modeled as migrating in an immobile anions medium.
We proposed a way to consider the negative electrode as deformable and to track its deformation in time. We calculated the areal capacity through discharge from the deformation of the negative electrode and from insertion in the positive electrode. We showed that the deformable negative electrode strategy was consistent from viewpoints of (i) the mass balance, (ii) the stripping rate, (iii) the ohmic polarization, and (iv) the mesh deformation.
We showed that this deformable modeling strategy did not affect the voltage profile predictions since the lithium electrode’s ohmic polarization was negligible. However, it could be used to illuminate the behavior of geometric defects in the anodic interface. We investigated the cases of a valley and a peak and illustrated the electrostripping of geometric defects in the anodic interface. This simulation case demonstrated that the stripping rate was non-uniform along the interface, and this phenomenon was accentuated at high discharge rates. This work in finite element modeling of the lithium-electrolyte interface, which moves over time, is a step toward a powerful tool for the visualization and optimization of Li/LLZO interfaces. This would be useful to developers of ASSBs looking for robust tools for predicting the performance of this promising technology.
We also described a decomposition of polarizations. We showed that in the numerical model, the equilibrium potential and the positive electrode polarization were dominant in the cell’s voltage drop. We showed that the impacts and the tuning of key parameters were deeply understandable through this post-processing. Two examples were shown. The first example showed how increasing the single-ion electrolyte thickness between the electrodes would lead to an undesired ohmic voltage drop. The second example showed how increased active material particle radius in the positive electrode would lead to undesired drops of capacity and voltage due to charge transfer limitation. Future work will focus on broadening the scope of this numerical investigation with thermal and mechanical physics.
Supplementary Materials
The following are available online at https://www.mdpi.com/article/10.3390/batteries10070250/s1, Figure S1: Simulated discharge potential curve of a Li/LLZO/(NMC811+LLZO) cell at 1 C with ionic conductivity of LLZO of 0.1 and 0.01 S m−1; Video S1: Deformation of the negative electrode with a plane interface during a discharge.
Author Contributions
Conceptualization, D.N.; methodology, D.N.; software, D.N.; validation, D.N. and F.A.; formal analysis, D.N.; investigation, D.N., L.R. and F.A.; resources, F.A.; data curation, F.A.; writing—original draft preparation, D.N.; writing—review and editing, D.N., L.R. and F.A.; visualization, D.N.; supervision, L.R. and F.A.; project administration, F.A.; funding acquisition, F.A. All authors have read and agreed to the published version of the manuscript.
Funding
This research received no external funding.
Data Availability Statement
Data will be made available on request.
Conflicts of Interest
The authors declare no conflicts of interest.
References
- Xu, W.; Wang, J.; Ding, F.; Chen, X.; Nasybulin, E.; Zhang, Y.; Zhang, J.G. Lithium metal anodes for rechargeable batteries. Energy Environ. Sci. 2014, 7, 513–537. [Google Scholar] [CrossRef]
- Lin, D.; Liu, Y.; Cui, Y. Reviving the lithium metal anode for high-energy batteries. Nat. Nanotechnol. 2017, 12, 194–206. [Google Scholar] [CrossRef] [PubMed]
- Manthiram, A.; Yu, X.; Wang, S. Lithium battery chemistries enabled by solid-state electrolytes. Nat. Rev. Mater. 2017, 2, 16103. [Google Scholar] [CrossRef]
- Sun, C.; Liu, J.; Gong, Y.; Wilkinson, D.P.; Zhang, J. Recent advances in all-solid-state rechargeable lithium batteries. Nano Energy 2017, 33, 363–386. [Google Scholar] [CrossRef]
- Wang, Z.; Liu, J.; Wang, M.; Shen, X.; Qian, T.; Yan, C. Toward safer solid-state lithium metal batteries: A review. Nanoscale Adv. 2020, 2, 1828–1836. [Google Scholar] [CrossRef]
- Li, C.; Wang, Z.-Y.; He, Z.-J.; Li, Y.-J.; Mao, J.; Dai, K.-H.; Yan, C.; Zheng, J.-C. An advance review of solid-state battery: Challenges, progress and prospects. Sustain. Mater. Technol. 2021, 29, e00297. [Google Scholar] [CrossRef]
- Zaman, W.; Hatzell, K.B. Processing and manufacturing of next generation lithium-based all solid-state batteries. Curr. Opin. Solid State. Mater. Sci. 2022, 26, 101003. [Google Scholar] [CrossRef]
- Wang, R.; Cui, W.; Chu, F.; Wu, F. Lithium metal anodes: Present and future. J. Energy Chem. 2020, 48, 145–159. [Google Scholar] [CrossRef]
- Abada, S.; Marlair, G.; Lecocq, A.; Petit, M.; Sauvant-Moynot, V.; Huet, F. Safety focused modeling of lithium-ion batteries: A review. J. Power Sources 2016, 306, 178–192. [Google Scholar] [CrossRef]
- Zhao, Y.; Stein, P.; Bai, Y.; Al-Siraj, M.; Yang, Y.; Xu, B.X. A review on modeling of electro-chemo-mechanics in lithium-ion batteries. J. Power Sources 2019, 413, 259–283. [Google Scholar] [CrossRef]
- Bistri, D.; Afshar, A.; Di Leo, C.V. Modeling the chemo-mechanical behavior of all-solid-state batteries: A review. Meccanica 2021, 56, 1523–1554. [Google Scholar] [CrossRef]
- Doyle, M.; Fuller, T.F.; Newman, J. Modeling of galvanostatic charge and discharge of the lithium/polymer/insertion cell. J. Electrochem. Soc. 1993, 140, 1526. [Google Scholar] [CrossRef]
- Fuller, T.F.; Doyle, M.; Newman, J. Simulation and optimization of the dual lithium ion insertion cell. J. Electrochem. Soc. 1994, 141, 1. [Google Scholar] [CrossRef]
- Newman, J.; Tiedemann, W. Porous-electrode theory with battery applications. AIChE J. 1975, 21, 25–41. [Google Scholar] [CrossRef]
- Danilov, D.L.; Niessen, R.A.H.; Notten, P.H.L. Modeling all-solid-state Li-ion batteries. J. Electrochem. Soc. 2010, 158, A215. [Google Scholar] [CrossRef]
- Chen, Z.; Danilov, D.L.; Raijmakers, L.H.; Chayambuka, K.; Jiang, M.; Zhou, L.; Zhou, J.; Eichel, R.-A.; Notten, P.H. Overpotential analysis of graphite-based Li-ion batteries seen from a porous electrode modeling perspective. J. Power Sources 2021, 509, 230345. [Google Scholar] [CrossRef]
- Wang, Z.; Danilov, D.L.; Eichel, R.A.; Notten, P.H. Modeling the Resistance of Thin-Film Current Collectors in Thin-Film Batteries. J. Electrochem. Soc. 2022, 170, 020514. [Google Scholar] [CrossRef]
- Xiong, R.; Yu, Y.; Chen, S.; Li, M.; Li, L.; Zhou, M.; Zhang, W.; Yan, B.; Li, D.; Yang, H.; et al. Overpotential decomposition enabled decoupling of complex kinetic processes in battery electrodes. J. Power Sources 2023, 553, 232296. [Google Scholar] [CrossRef]
- Fabre, S.D.; Guy-Bouyssou, D.; Bouillon, P.; Le Cras, F.; Delacourt, C. Charge/discharge simulation of an all-solid-state thin-film battery using a one-dimensional model. J. Electrochem. Soc. 2011, 159, A104. [Google Scholar] [CrossRef]
- N’Dri, N.; Megahed, M.; Fabre, S.D. Thermo-Mechanical Simulation of Solid Microbatteries. ECS Trans. 2012, 40, 205. [Google Scholar] [CrossRef]
- Nesro, M.S.; Elfadel, I.M. Simplified multiphysics model for all-solid-state microbatteries. In Proceedings of the 2013 COMSOL Conference in Rotterdam, Rotterdam, The Netherlands, 24–28 October 2013. [Google Scholar]
- Ferrese, A.; Newman, J. Modeling lithium movement over multiple cycles in a lithium-metal battery. J. Electrochem. Soc. 2014, 161, A948. [Google Scholar] [CrossRef]
- Vyroubal, P.; Maxa, J.; Kazda, T.; Vondrák, J. Computational modeling of lithium ion battery. ECS Trans. 2014, 63, 99. [Google Scholar] [CrossRef]
- Vyroubal, P.; Maxa, J.; Kazda, T.; Vondrák, J. The Finite Element Method in Electrochemistry–Modelling of the Lithium-Ion Battery. ECS Trans. 2014, 48, 289. [Google Scholar] [CrossRef]
- Bates, A.; Mukherjee, S.; Schuppert, N.; Son, B.; Kim, J.G.; Park, S. Modeling and simulation of 2D lithium-ion solid state battery. Int. J. Energy Res. 2015, 39, 1505–1518. [Google Scholar] [CrossRef]
- Vyroubal, P.; Kazda, T.; Maxa, J.; Vondrák, J.; Sedlaříková, M.; Tichý, J.; Cipín, R. 3D Modelling and study of electrochemical characteristics and thermal stability of commercial accumulator by simulation methods. Int. J. Electrochem. Sci. 2016, 11, 1938–1950. [Google Scholar] [CrossRef]
- Mendoza, H.; Roberts, S.A.; Brunini, V.E.; Grillet, A.M. Mechanical and electrochemical response of a LiCoO2 cathode using reconstructed microstructures. Electrochim. Acta 2016, 190, 1–15. [Google Scholar] [CrossRef]
- Taleghani, S.T.; Marcos, B.; Zaghib, K.; Lantagne, G. A study on the effect of porosity and particles size distribution on Li-ion battery performance. J. Electrochem. Soc. 2017, 164, E3179. [Google Scholar] [CrossRef]
- Kashkooli, A.G.; Amirfazli, A.; Farhad, S.; Lee, D.U.; Felicelli, S.; Park, H.W.; Feng, K.; De Andrade, V.; Chen, Z. Representative volume element model of lithium-ion battery electrodes based on X-ray nano-tomography. J. Appl. Electrochem. 2017, 47, 281–293. [Google Scholar] [CrossRef]
- Taleghani, S.T.; Marcos, B.; Lantagne, G. Modeling and simulation of a commercial graphite–LiFePO4 cell in a full range of C-rates. J. Appl. Electrochem. 2018, 48, 1389–1400. [Google Scholar] [CrossRef]
- Wolff, N.; Röder, F.; Krewer, U. Model based assessment of performance of lithium-ion batteries using single ion conducting electrolytes. Electrochim. Acta 2018, 284, 639–646. [Google Scholar] [CrossRef]
- Kazemi, N.; Danilov, D.L.; Haverkate, L.; Dudney, N.J.; Unnikrishnan, S.; Notten, P.H. Modeling of all-solid-state thin-film Li-ion batteries: Accuracy improvement. Solid State Ion. 2019, 334, 111–116. [Google Scholar] [CrossRef]
- Xu, S.; Chen, K.H.; Dasgupta, N.P.; Siegel, J.B.; Stefanopoulou, A.G. Evolution of dead lithium growth in lithium metal batteries: Experimentally validated model of the apparent capacity loss. J. Electrochem. Soc. 2019, 166, A3456. [Google Scholar] [CrossRef]
- Raijmakers, L.H.J.; Danilov, D.L.; Eichel, R.A.; Notten, P.H.L. An advanced all-solid-state Li-ion battery model. Electrochim. Acta 2020, 330, 135147. [Google Scholar] [CrossRef]
- Kim, J.; Mohanty, S.K.; Yoo, H.D. Modeling ionic intercalation and solid-state diffusion using typical descriptors of batteries. J. Appl. Electrochem. 2021, 51, 703–713. [Google Scholar] [CrossRef]
- Yue, F.; Xia, Q.; Gong, Y.; Wang, M.; Xia, H.; Huang, X. A fully coupled electrochemical-mechanical-thermal model of all-solid-state thin-film Li-ion batteries. J. Power Sources 2022, 539, 231614. [Google Scholar] [CrossRef]
- Li, W.; Bao, Z.; Wang, J.; Du, Q.; Jiao, K. Comparative simulation of thin-film and bulk-type all-solid-state batteries under adiabatic and isothermal conditions. Appl. Therm. Eng. 2023, 223, 119957. [Google Scholar] [CrossRef]
- Quarti, M.; Bayer, A.; Bessler, W.G. Trade-off between energy density and fast-charge capability of lithium-ion batteries: A model-based design study of cells with thick electrodes. Electrochem. Sci. Adv. 2023, 3, e2100161. [Google Scholar] [CrossRef]
- Murugan, R.; Thangadurai, V.; Weppner, W. Fast lithium ion conduction in garnet-type Li7La3Zr2O12. Angew. Chem. Int. Ed. 2007, 46, 7778–7781. [Google Scholar] [CrossRef] [PubMed]
- Ohta, S.; Kobayashi, T.; Asaoka, T. High lithium ionic conductivity in the garnet-type oxide Li7−XLa3(Zr2−X, NbX)O12 (X = 0–2). J. Power Sources 2011, 196, 3342–3345. [Google Scholar] [CrossRef]
- Buschmann, H.; Dölle, J.; Berendts, S.; Kuhn, A.; Bottke, P.; Wilkening, M.; Heitjans, P.; Senyshyn, A.; Ehrenberg, H.; Lotnyk, A.; et al. Structure and dynamics of the fast lithium ion conductor “Li7La3Zr2O12”. Phys. Chem. Chem. Phys. 2011, 13, 19378–19392. [Google Scholar] [CrossRef]
- Buschmann, H.; Berendts, S.; Mogwitz, B.; Janek, J. Lithium metal electrode kinetics and ionic conductivity of the solid lithium ion conductors “Li7La3Zr2O12” and Li7−xLa3Zr2−xTaxO12 with garnet-type structure. J. Power Sources 2012, 206, 236–244. [Google Scholar] [CrossRef]
- Rangasamy, E.; Wolfenstine, J.; Sakamoto, J. The role of Al and Li concentration on the formation of cubic garnet solid electrolyte of nominal composition Li7La3Zr2O12. Solid State Ion. 2012, 206, 28–32. [Google Scholar] [CrossRef]
- Thangadurai, V.; Narayanan, S.; Pinzaru, D. Garnet-type solid-state fast Li ion conductors for Li batteries: Critical review. Chem. Soc. Rev. 2014, 43, 4714–4727. [Google Scholar] [CrossRef] [PubMed]
- Thangadurai, V.; Pinzaru, D.; Narayanan, S.; Baral, A.K. Fast solid-state Li ion conducting garnet-type structure metal oxides for energy storage. J. Phys. Chem. Lett. 2015, 6, 292–299. [Google Scholar] [CrossRef] [PubMed]
- Samson, A.J.; Hofstetter, K.; Bag, S.; Thangadurai, V. A bird’s-eye view of Li-stuffed garnet-type Li7La3Zr2O12 ceramic electrolytes for advanced all-solid-state Li batteries. Energy Environ. Sci. 2019, 12, 2957–2975. [Google Scholar] [CrossRef]
- Sun, H.; Kang, S.; Cui, L. Prospects of LLZO type solid electrolyte: From material design to battery application. Chem. Eng. J. 2023, 454, 140375. [Google Scholar] [CrossRef]
- Horii, M.; Christianson, R.J.; Mutha, H.; Bachman, J.C. Modeling the effect of electrolyte microstructure on conductivity and solid-state Li-ion battery performance. J. Power Sources 2022, 528, 231177. [Google Scholar] [CrossRef]
- Kravchyk, K.V.; Karabay, D.T.; Kovalenko, M.V. On the feasibility of all-solid-state batteries with LLZO as a single electrolyte. Sci. Rep. 2022, 12, 1177. [Google Scholar] [CrossRef]
- Kuganathan, N.; Rushton, M.J.; Grimes, R.W.; Kilner, J.A.; Gkanas, E.I.; Chroneos, A. Self-diffusion in garnet-type Li7La3Zr2O12 solid electrolytes. Sci. Rep. 2021, 11, 451. [Google Scholar] [CrossRef]
- COMSOL Multiphysics® v. 6.1; COMSOL AB: Stockholm, Sweden, 2022; Available online: http://www.comsol.com (accessed on 16 August 2023).
- Wang, A.A.; O’kane, S.E.J.; Planella, F.B.; Le Houx, J.; O’Regan, K.; Zyskin, M.; Edge, J.S.; Monroe, C.; Cooper, S.; Howey, D.A.; et al. of parameterisation and a novel database (LiionDB) for continuum Li-ion battery models. Prog. Energy 2022, 4, 032004. [Google Scholar] [CrossRef]
- Swiderska-Mocek, A.; Lewandowski, A. Kinetics of Li-ion transfer reaction at LiMn2O4, LiCoO2, and LiFePO4 cathodes. J. Solid State Electrochem. 2017, 21, 1365–1372. [Google Scholar] [CrossRef]
- Chen, C.H.; Planella, F.B.; O’regan, K.; Gastol, D.; Widanage, W.D.; Kendrick, E. Development of experimental techniques for parameterization of multi-scale lithium-ion battery models. J. Electrochem. Soc. 2020, 167, 080534. [Google Scholar] [CrossRef]
- Golozar, M.; Paolella, A.; Demers, H.; Bessette, S.; Lagacé, M.; Bouchard, P.; Guerfi, A.; Gauvin, R.; Zaghib, K. In situ observation of solid electrolyte interphase evolution in a lithium metal battery. Commun. Chem 2019, 2, 131. [Google Scholar] [CrossRef]
- Tang, M.; Albertus, P.; Newman, J. Two-dimensional modeling of lithium deposition during cell charging. J. Electrochem. Soc. 2009, 156, A390. [Google Scholar] [CrossRef]
- Sturm, J.; Rheinfeld, A.; Zilberman, I.; Spingler, F.B.; Kosch, S.; Frie, F.; Jossen, A. Modeling and simulation of inhomogeneities in a 18650 nickel-rich, silicon-graphite lithium-ion cell during fast charging. J. Power Sources 2019, 412, 204–223. [Google Scholar] [CrossRef]
- Vishnugopi, B.S.; Naik, K.G.; Kawakami, H.; Ikeda, N.; Mizuno, Y.; Iwamura, R.; Kotaka, T.; Aotani, K.; Tabuchi, Y.; Mukherjee, P.P. Asymmetric contact loss dynamics during plating and stripping in solid-state batteries. Adv. Energy Mater. 2023, 13, 2203671. [Google Scholar] [CrossRef]
- Carmona, E.A.; Albertus, P. Modeling how interface geometry and mechanical stress affect Li metal/solid electrolyte current distributions. J. Electrochem. Soc. 2023, 170, 020524. [Google Scholar] [CrossRef]

Disclaimer/Publisher’s Note: The statements, opinions and data contained in all publications are solely those of the individual author(s) and contributor(s) and not of MDPI and/or the editor(s). MDPI and/or the editor(s) disclaim responsibility for any injury to people or property resulting from any ideas, methods, instructions or products referred to in the content. |
© 2024 by the authors. Licensee MDPI, Basel, Switzerland. This article is an open access article distributed under the terms and conditions of the Creative Commons Attribution (CC BY) license (https://creativecommons.org/licenses/by/4.0/).