Article

Effects of Non-Uniform Temperature Distribution on the Degradation of Liquid-Cooled Parallel-Connected Lithium-Ion Cells

Department of Mechanical & Aerospace Engineering, The University of Alabama in Huntsville, Huntsville, AL 35899, USA
*
Author to whom correspondence should be addressed.
Batteries 2024, 10(8), 274; https://doi.org/10.3390/batteries10080274
Submission received: 11 June 2024 / Revised: 25 July 2024 / Accepted: 25 July 2024 / Published: 30 July 2024

Abstract

:
Our previous work on an air-cooled stack of five pouch-format lithium-ion (Li-ion) cells showed that non-uniform temperature can cause accelerated degradation, especially of the middle cell. In this work, a stack of five similar cells was cycled at a higher C-rate and water-cooled to create a larger temperature gradient for comparison with the air-cooled stack. It was hypothesized that the larger temperature gradient in the water-cooled stack would exacerbate the degradation of the middle cell. However, the results showed that the middle cell degraded slightly slower than the side cells in the water-cooled stack. This trend is opposite to that in the air-cooled stack. This difference could be attributed to the combined effects of a smaller temperature rise and larger temperature gradient in the water-cooled stack than in the air-cooled stack. Post-mortem analysis of cycled cells and a fresh cell showed that the degradation mainly came from the anode. Increased lithium plating and decreased porosity in the side cells are possible mechanisms for the faster degradation compared with the middle cell. It was also found that all the cells in the water-cooled stack experienced a phenomenon of capacity drop and recovery after a low C-rate reference performance test and extended rest. This phenomenon can be attributed to lithium diffusion between the anode active area and the anode overhang area.

Graphical Abstract

1. Introduction

Li-ion batteries have been widely used in various applications. However, their durability still needs to be further improved, especially for electric vehicle (EV) and grid-scale energy storage applications. There are many mechanisms of degradation, such as through growth of the solid–electrolyte interphase (SEI) layer, lithium plating, electrode particle fracture, and transition metal dissolution [1,2,3]. Most of these degradation mechanisms are temperature dependent [2]. High temperatures can accelerate the SEI layer growth and transition metal dissolution. Low temperatures can increase the risk of lithium plating and electrode particle fracture.
Due to the heat generation during operation [4,5] and the low thermal conductivity of Li-ion cell components [6,7,8], temperature distributions in Li-ion cells are generally non-uniform across the cell thickness [9,10,11,12,13,14], especially in large-format cells during higher-rate operation. Due to the dependence of Li-ion battery degradation on temperature, the non-uniform temperature distribution could cause non-uniform and accelerated degradation. Hunt et al. compared the effects of surface cooling and tab cooling on the degradation of single Li-ion cells [15]. The research showed that strong surface cooling accelerated degradation, which was attributed to large temperature gradients across the cell thickness. Carter et al. [16] studied the influence of a non-uniform temperature distribution by imposing a temperature gradient externally and also observed accelerated degradation. Some other experimental results showed that non-uniform temperature distribution can lead to non-uniform resistance and current distribution [17,18,19], which would also accelerate degradation because a higher current can exacerbate particle cracking and lithium plating.
In most of the above-mentioned experimental studies on the degradation effects of non-uniform temperature distribution, the temperature differences were applied externally. To confirm that non-uniform temperature distribution due to heat generation inside large Li-ion cells can cause non-uniform and accelerated degradation, Cavalheiro et al. [20] tested a stack of five parallel-connected pouch cells for 2215 cycles and compared their degradation with a baseline cell. The temperature distributions, individual cell degradation, and current distributions of the stack were measured simultaneously. It was found that all five cells in the stack experienced a higher temperature rise and degraded faster than the baseline cell. In particular, the capacity retention of the middle cell in the stack, which experienced the largest temperature rise, decreased to 51% after 2215 cycles. In comparison, the capacity retention of the side cells was still above 82%, and that of the baseline cell was nearly 88%. These results clearly supported the hypothesis that a non-uniform temperature distribution causes non-uniform and accelerated degradation. To confirm the degradation mechanisms of the cells in the work by Cavalheiro et al. [20], Gonzalez Malabet et al. [21] performed electrochemical impedance spectroscopy (EIS) and post-mortem analysis of the cycled cells for comparison with a fresh cell. While the EIS implied that the main degradation mechanism for the middle cell was SEI layer growth, post-mortem analysis using X-ray diffraction (XRD), optical microscopy, and scanning electron microscopy (SEM) with energy dispersive X-ray spectroscopy (EDS) revealed the presence of lithium plating, especially in the middle cell. The analysis also implied that fast SEI layer growth in the middle cell induced lithium plating and caused abrupt failure of the middle cell near the end of the cycling. The analysis was consistent with a previous modeling study [22].
While the studies by Cavalheiro et al. [20] and Gonzalez Malabet et al. [21] confirmed that a non-uniform temperature distribution during operation can cause non-uniform and accelerated degradation, the Li-ion cells in the studies were air-cooled using natural convection. Compared with air cooling, liquid cooling has a much stronger cooling capability and is much more widely used in EV applications [23]. But stronger cooling would lead to a larger temperature gradient and exacerbate the effects of a non-uniform temperature distribution. Therefore, it is hypothesized that the degradation of liquid-cooled Li-ion cells will be more non-uniform than that of air-cooled cells. To test this hypothesis and to enhance our understanding of the effects of non-uniform temperature distribution that is more relevant for practical applications, a stack of five parallel-connected Li-ion cells, similar to those in our previous study [20], are cycled under water-cooled conditions in this study. The discharging rate during cycling is set to twice that in the previous study to further increase the temperature gradient. Surprisingly, however, the water-cooled stack of Li-ion cells shows very different behaviors to the air-cooled stack. More details are described in the following sections. Section 2 describes the experimental setup and test protocol. Section 3 describes and discusses the experimental results. Finally, Section 4 briefly summarizes the new findings.

2. Experimental

2.1. Experimental Setup

As schematically shown in Figure 1a, five pouch-format 3-Ah Li-ion cells (30107-0, Tenergy, Fremont, CA, USA) were stacked together and placed between a pair of cooling plates (ATS-CP-1001, Advanced Thermal Solutions, Norwood, MA, USA). The dimension of each cell is 102 mm (L) by 50 mm (W) by 6 mm (H). The pair of cooling plates was connected to a water circulator (Refrigerated/Heated Bath Circulator, Thermo Fisher Scientific, Waltham, MA, USA) to keep the water temperature at a set value (set to 24 °C in this study to be comparable to our previous study with the air-cooled stack [20]). Six T-type thermocouples (5TC-TT-T-30-72, Omega Engineering Inc., Norwalk, CT, USA) were used to measure temperature distributions across the thickness of the stack, labelled as T1 through T6 from the top to the bottom. As shown in Figure 1b, the sides of the cells were thermally insulated by polystyrene foam to reduce heat loss. The five pouch cells were connected in parallel and then connected to a battery tester (LBT 21084, Arbin Instruments, College Station, TX, USA). Shunt resistors (PLV7AL, 2 ± 0.005% mΩ, Precision Resistor Company Inc., Clearwater, FL, USA) were used for the measurement of individual cell currents (I1, I2, I3, I4, I5), while the total stack current (Itotal) was controlled and measured by the battery tester.

2.2. Selection of Experimental Li-Ion Cells

To ensure comparable performance of cells in the stack, five cells were selected from the same batch. The selected cells had a similar high-frequency resistance (7.9 ± 0.35 mΩ) as measured by a resistance tester (BATTERY HiTESTER 3561, HIOKI USA, Dallas, TX, USA), similar DC internal resistance (19.2 ± 0.7 mΩ, as determined by the open-circuit voltage and the cell voltage after 10 s of 2C discharge [25]), and similar discharge capacity (3.34 ± 0.03 Ah, according to 1C discharge testing).

2.3. Test Protocol

As shown in Figure 2a, the stack was first rested for 40 min, then charged at a constant current of 1C (corresponding to 15 A) up to a voltage of 4.2 V, followed by a constant voltage step of 4.2 V until the current decreased to C/20 (corresponding to 0.75 A). After a rest of 20 min, the stack was discharged at a constant current of 2C (corresponding to 30 A) until a voltage of 2.8 V was reached. After another rest of 40 min, the stack was charged again in a new cycle. Reference performance testing (RPT) was performed after every 50 or 100 cycles. The charging protocol during RPT was the same (1C, 4.2 V max, C/20 cut-off), but the discharging rate was C/3 (corresponding to 5 A) so that the cells could be fully discharged. After each RPT, the stack experienced an extended rest (at least 4 h) before the resumption of normal cycling.

2.4. Post-Mortem Analysis

Cell 3, cell 4, and cell 5 in the stack were disassembled for post-mortem analysis. A fresh cell was also disassembled as a reference. The cells were first fully discharged and then disassembled in an argon-filled glovebox (LABstart pro, MBRAUN USA, Stratham, NH, USA). Electrode layers, including 15 anode layers and 14 cathode layers in each cell, were separated from the tabs. Individual electrode layers were washed twice using 99% dimethyl carbonate (DMC, Thermo Scientific Chemicals, Waltham, MA, USA) and dried before being moved out of the glovebox for further examination. Pictures of dried electrodes were taken using a phone camera. Some regions of the electrodes were further examined using a JEOL 7000 field-emission scanning electron microscope (JEOL Ltd., Tokyo, Japan) at the University of Alabama Analytical Research Facility. The FE-SEM system has an Oxford energy dispersive spectroscopy (EDS) system attached, which was used for the analysis of elemental content in the electrodes.

3. Results and Discussion

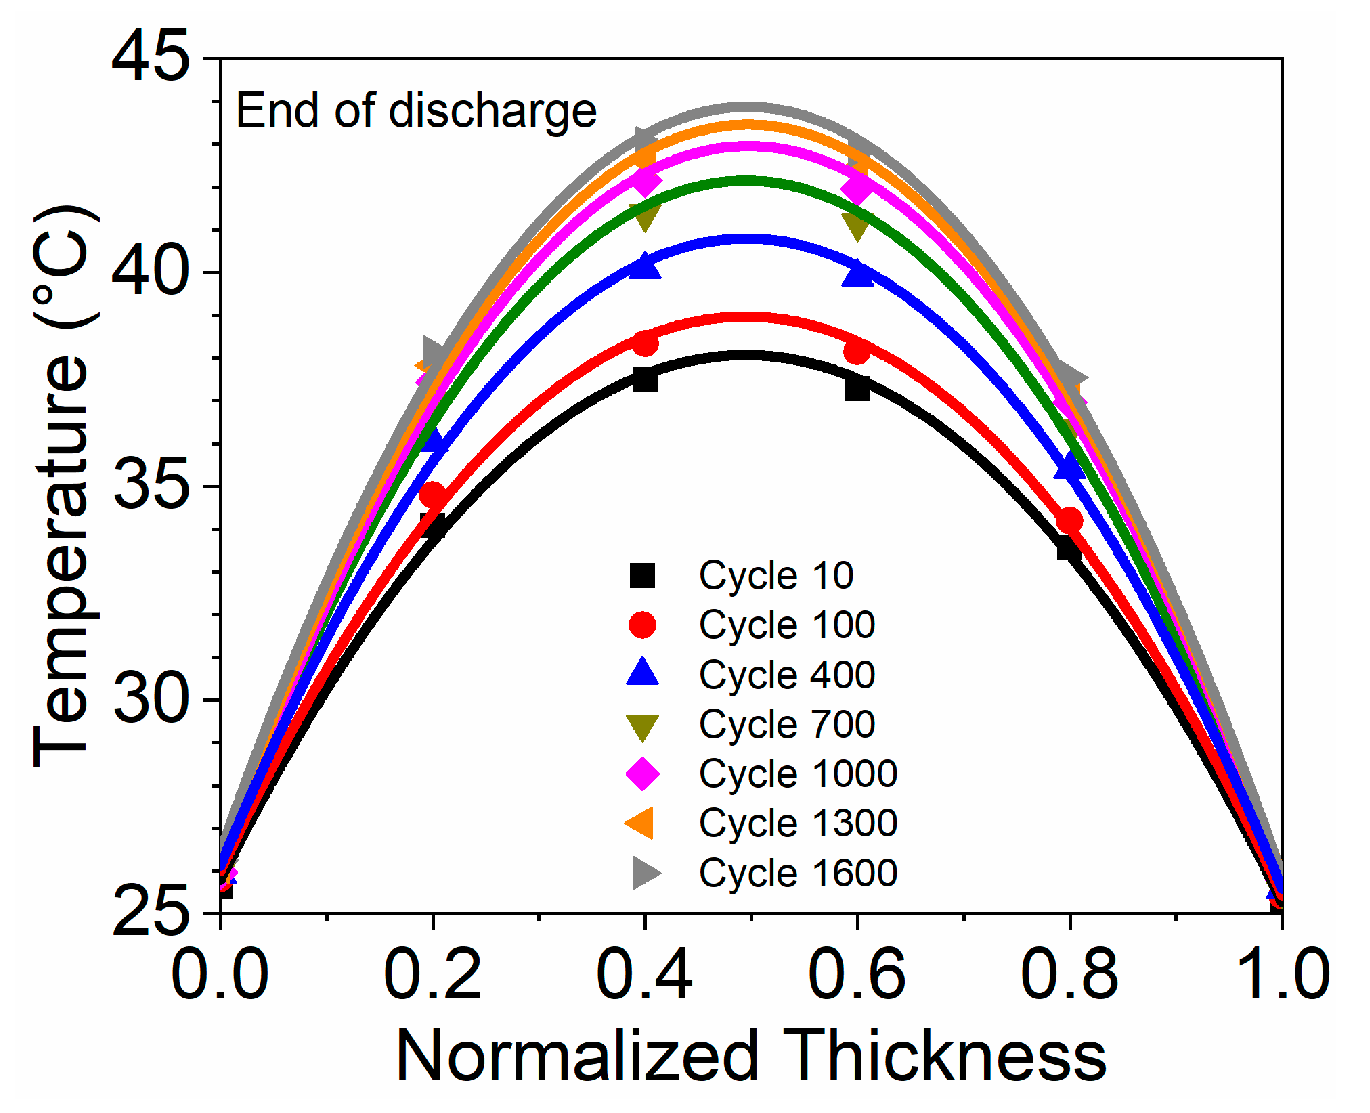
3.1. Temperature Distribution Behaviours

As a representation, Figure 2b shows the variation in local temperatures in the stack during cycle 10. It can be seen that the local temperatures T2 to T5 decreased slightly at the beginning of charging. This slight decrease can be attributed to the negative entropic heat generation, which is discussed in Section 3.2. Then, the local temperatures T2 to T5 started to increase because the heat generation became positive at higher SOC levels. After a few minutes into the constant voltage (CV) charging stage, local temperatures began to decrease due to the decline in charging current and the heat generation rate. The temperatures went back to 24 °C shortly after the end of charging. Local temperatures T1 and T6 showed little change during this period because they were located between the outside cells and the cooling plates that were kept at a constant temperature. All the local temperatures increased to higher levels and more rapidly during discharging than during charging, which can be attributed to the higher current during discharging (30 A) than that during charging (15 A). Even T1 and T6 showed obvious increases during discharging.
The temperature distribution across the thickness of the stack is better seen in Figure 2c,d, which show the rise in local temperatures at different times of charging and discharging. T1 and T6 show very small changes due to their contact with the cooling plates, while local temperatures closer to the center of the stack show larger changes due to heat generation inside the cells. Note that the largest temperature difference occurs between T1 and T2 as well as T5 and T6. The differences between T2 and T3 as well as T4 and T5 are smaller but still noticeable. There is not an obvious temperature difference between T3 and T4 due to the symmetry of their locations although they increased the most. These results of the temperature rise and temperature difference indicate that side cells (cell 1 and cell 5) experienced the smallest average temperature rise but the largest temperature gradient. In comparison, the middle cell (cell 3) experienced the largest temperature rise but the smallest temperature gradient.

3.2. Heat Generation Analysis

In order to understand the temperature behavior of the stack, heat generation was analyzed. Irreversible heat generation due to ohmic heating and reversible heat generation due to entropy change were considered. Other sources of heat generation, such as mixed heat generation, were assumed to be negligible [26,27]. Then the heat generation rate qgen during the charging of a Li-ion cell could be estimated from Equation (1):
q g e n = q g e n , i r r + q g e n , r e v = I V U + I T U T
where I is the current and its value is positive during charging, V is the cell voltage, U is the open-circuit voltage (OCV), T is the absolute temperature in the Kelvin scale, and U T is the entropic coefficient. The term I V U represents the irreversible heat generation rate qgen,irr, which is always positive. The term I T U T represents the reversible heat generation rate qgen,rev, which can be positive or negative depending on the signs of the current and the entropic coefficient.
The open-circuit voltage at different SOC was estimated as the average of the charging voltage and discharging voltage at C/30 (0.1 A), which nearly overlapped due to the small current. The results are shown in Figure 3a. The entropic coefficient was obtained with a baseline cell using a procedure similar to that in an earlier study [13]. The cell was first fully charged at 25 °C and then discharged at C/30 to different SOC levels (~5% interval). At each SOC level, the cell was rested for at least four hours for its OCV to become stable, then the cell was heated from 25 °C to 40 °C or cooled from 40 °C to 25 °C and rested for another four hours to reach a new stable OCV. Then, the entropic coefficient was determined by assuming a linear change in the OCV between 25 °C and 40 °C. The variation in the entropic coefficient with SOC levels is shown in Figure 3b. It can be seen that the entropic coefficient is negative for a wide range of SOCs, especially below a 40% SOC. Then, according to Equation (1), the entropic heat generation at the beginning of charging is negative, which can offset the positive irreversible heat generation and thus cause the cell temperature to decrease slightly, as shown in Figure 2b. Then, during discharging when the current is negative, the entropic heat generation is mostly positive. Combined with the always positive irreversible heat generation and the higher discharging current rate, the heat generation during discharging would be much higher than that during charging.

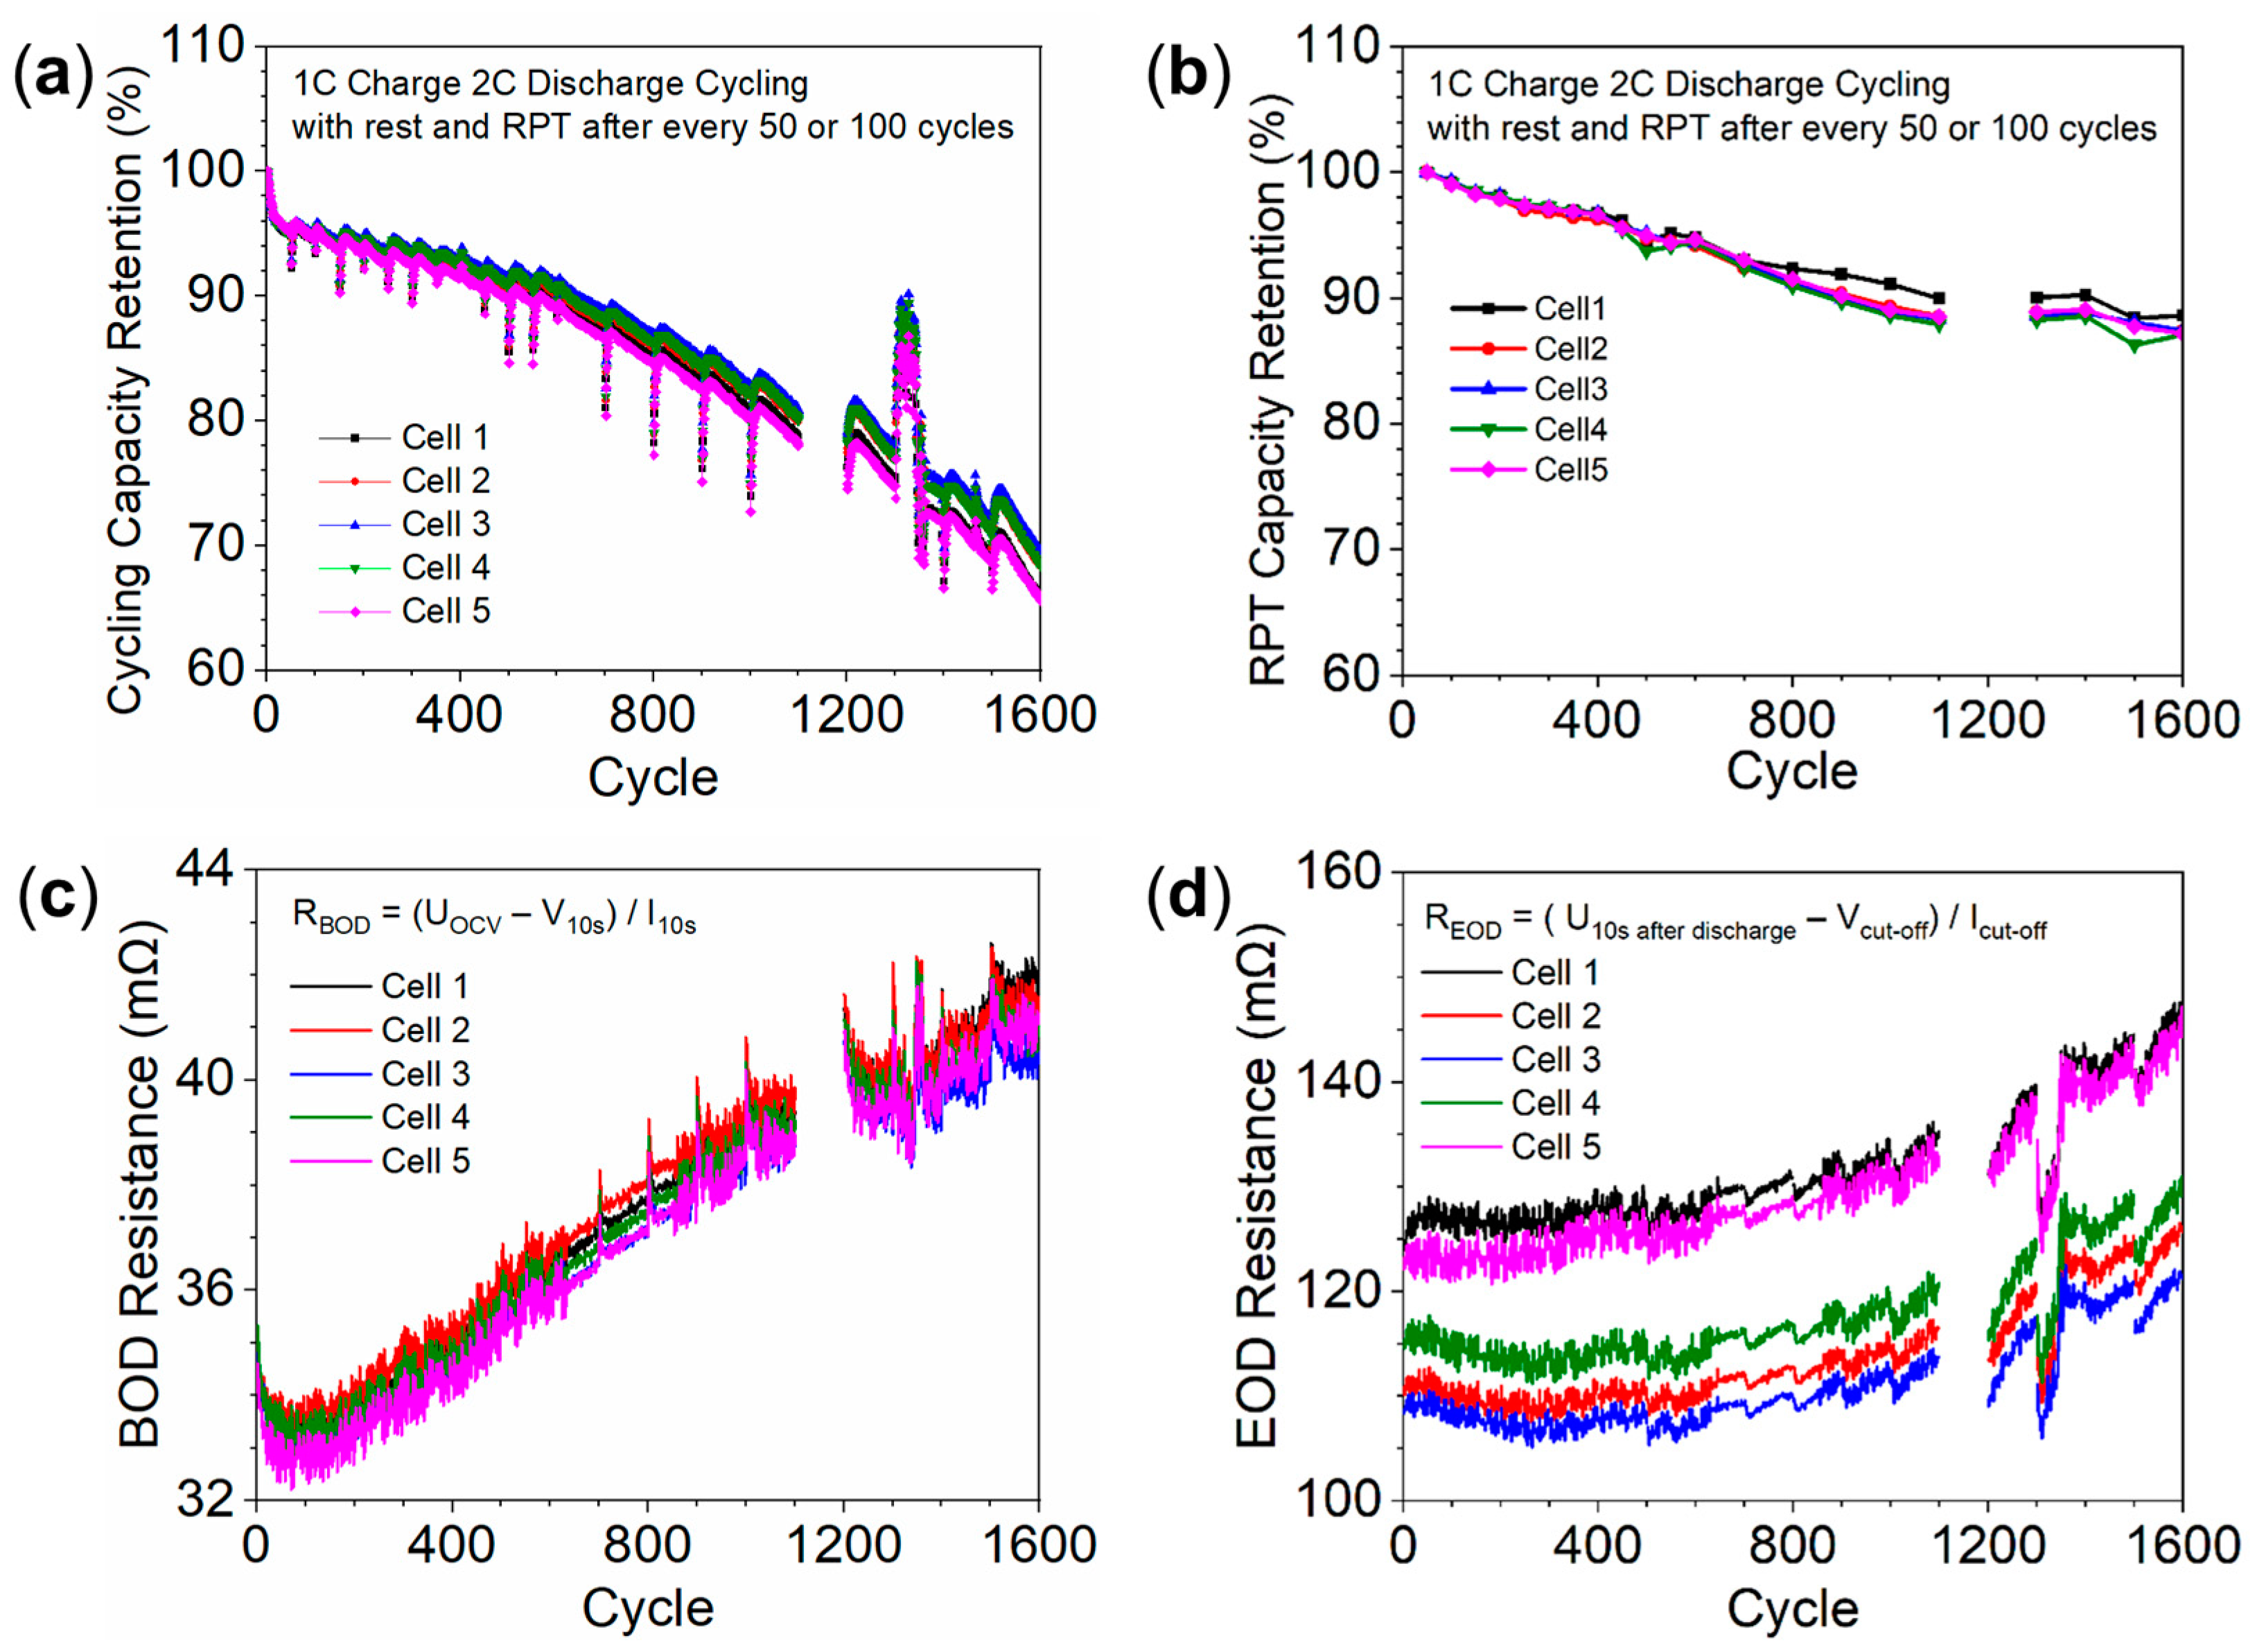
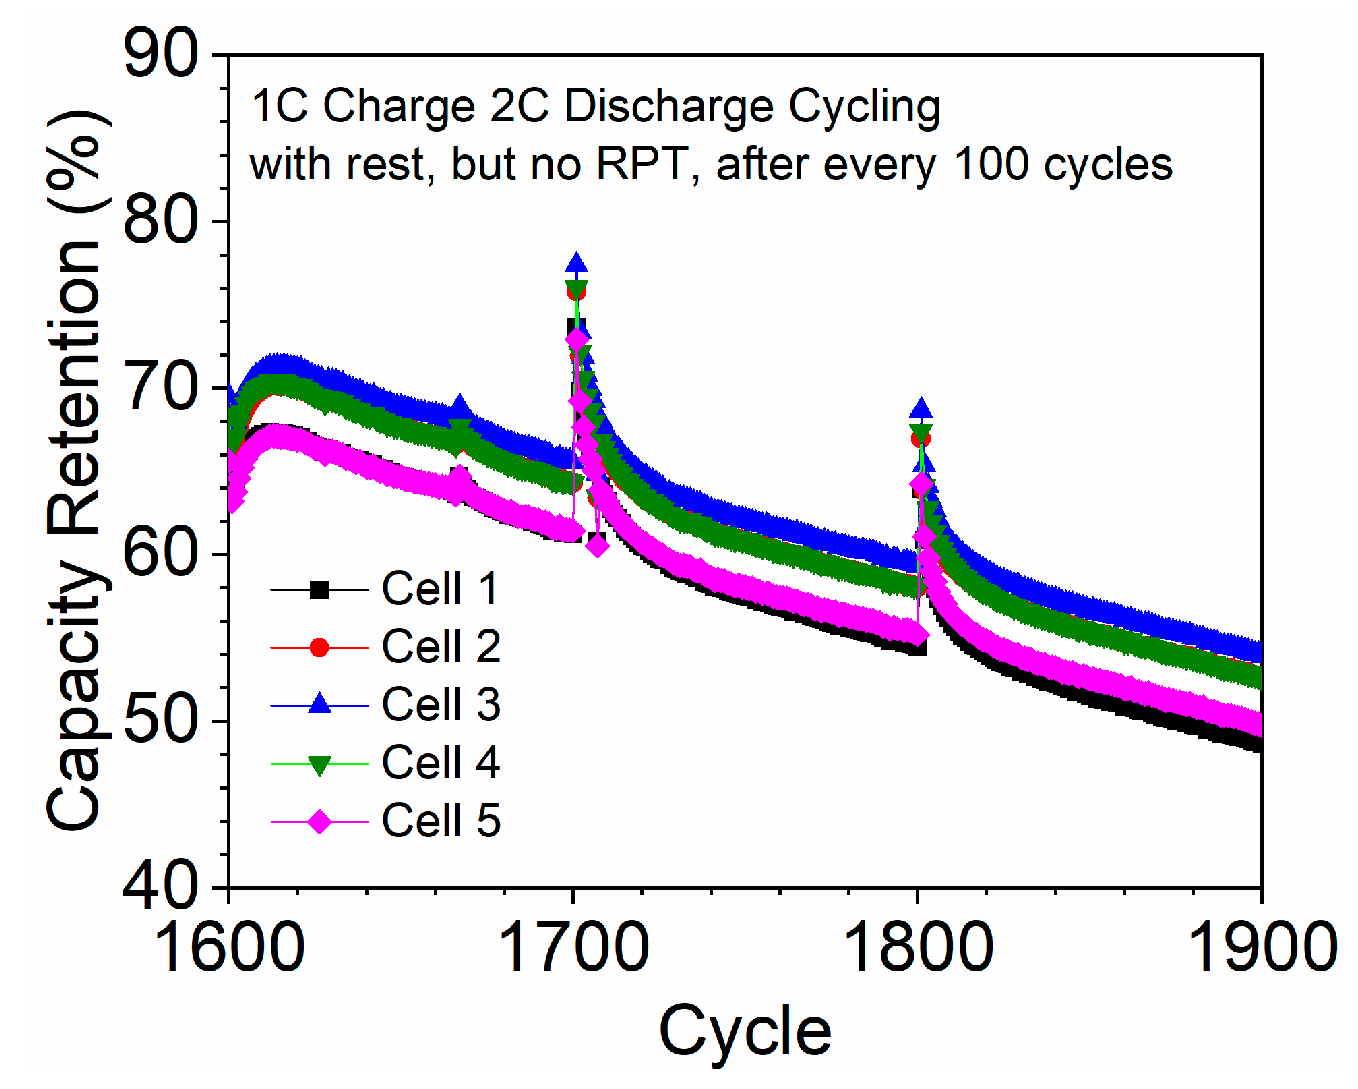
3.3. Degradation of Cells in the Stack

Figure 4a shows the capacity retention of cells in the stack over 1600 regular cycles (2C discharging), which indicates the usable capacity during 2C discharging. Figure 4b shows the capacity retention determined by RPT (C/3 discharging), which indicates the retention of true capacity during low-current discharging. The gap between cycles 1100 and 1200 was due to a failure in data recording by the battery tester. The abnormally higher capacity between cycles 1300 and 1400 was due to insufficient water and insufficient cooling of the water circulator, which happened during the winter break. Note that these malfunctions did not change the general trend of degradation or the conclusion of this work.
Three interesting phenomena can be observed from Figure 4a,b. First, the capacity retention in regular cycles was significantly lower than that in RPT cycles. This trend is expected. It indicates that the cells in the stack suffered power fade as well as capacity fade. Power fade is associated with an increase in cell internal resistance, which reduces the usable capacity during high-current discharging. To confirm this, the variations in DC resistance at the beginning of discharge (BOD) and at the end of discharge (EOD) with cycle number are shown in Figure 4c and Figure 4d respectively. Note that the BOD resistance was determined by using the difference between the open-circuit voltage (UOCV, ~4.18 V) and the cell voltage at 10 s of discharging (V10s) divided by the individual cell current (I10s). The EOD resistance was determined by using the difference between the open-circuit voltage at 10 s after discharge (U10s after discharge) and the cell cut-off voltage (Vcut-off; 2.8 V in this study) divided by the individual cell current at cut-off (Icut-off). It can be seen that the resistance of the cells indeed increased significantly with cycling. Note that the EOD resistance of all the cells was much higher than the BOD resistance, which can be attributed to the electrolyte concentration gradient and the high diffusion resistance near the end of discharge [28]. The BOD resistance was similar among the five cells because the temperature distribution was uniform at the beginning. The EOD resistance was very different, with cell 3 resistance being the lowest while those of cells 1 and 5 were the highest. The difference can be attributed to cell 3 having the highest temperature, while cells 1 and 5 had the lowest temperatures at the end of discharge, as shown in Figure 2d. Second, the middle cell (cell 3) showed slightly slower degradation than the outside cells (cells 1 and 5). This trend can be more clearly seen in Figure 5a, which shows the detailed capacity retention during cycles 1590 to 1600. This trend is unexpected because it is the opposite of what was observed in our earlier study with air-cooled stacks [20], in which the middle cell degraded the quickest. More discussion on this phenomenon is presented in Section 3.4. Third, the capacity retention of every cell experienced a significant drop after each RPT cycle, but this recovered in a few cycles and then decreased again. This phenomenon is more clearly shown in Figure 5b, with details before and after the RPT at around cycle 1500. More discussion on this phenomenon is presented in Section 3.5.

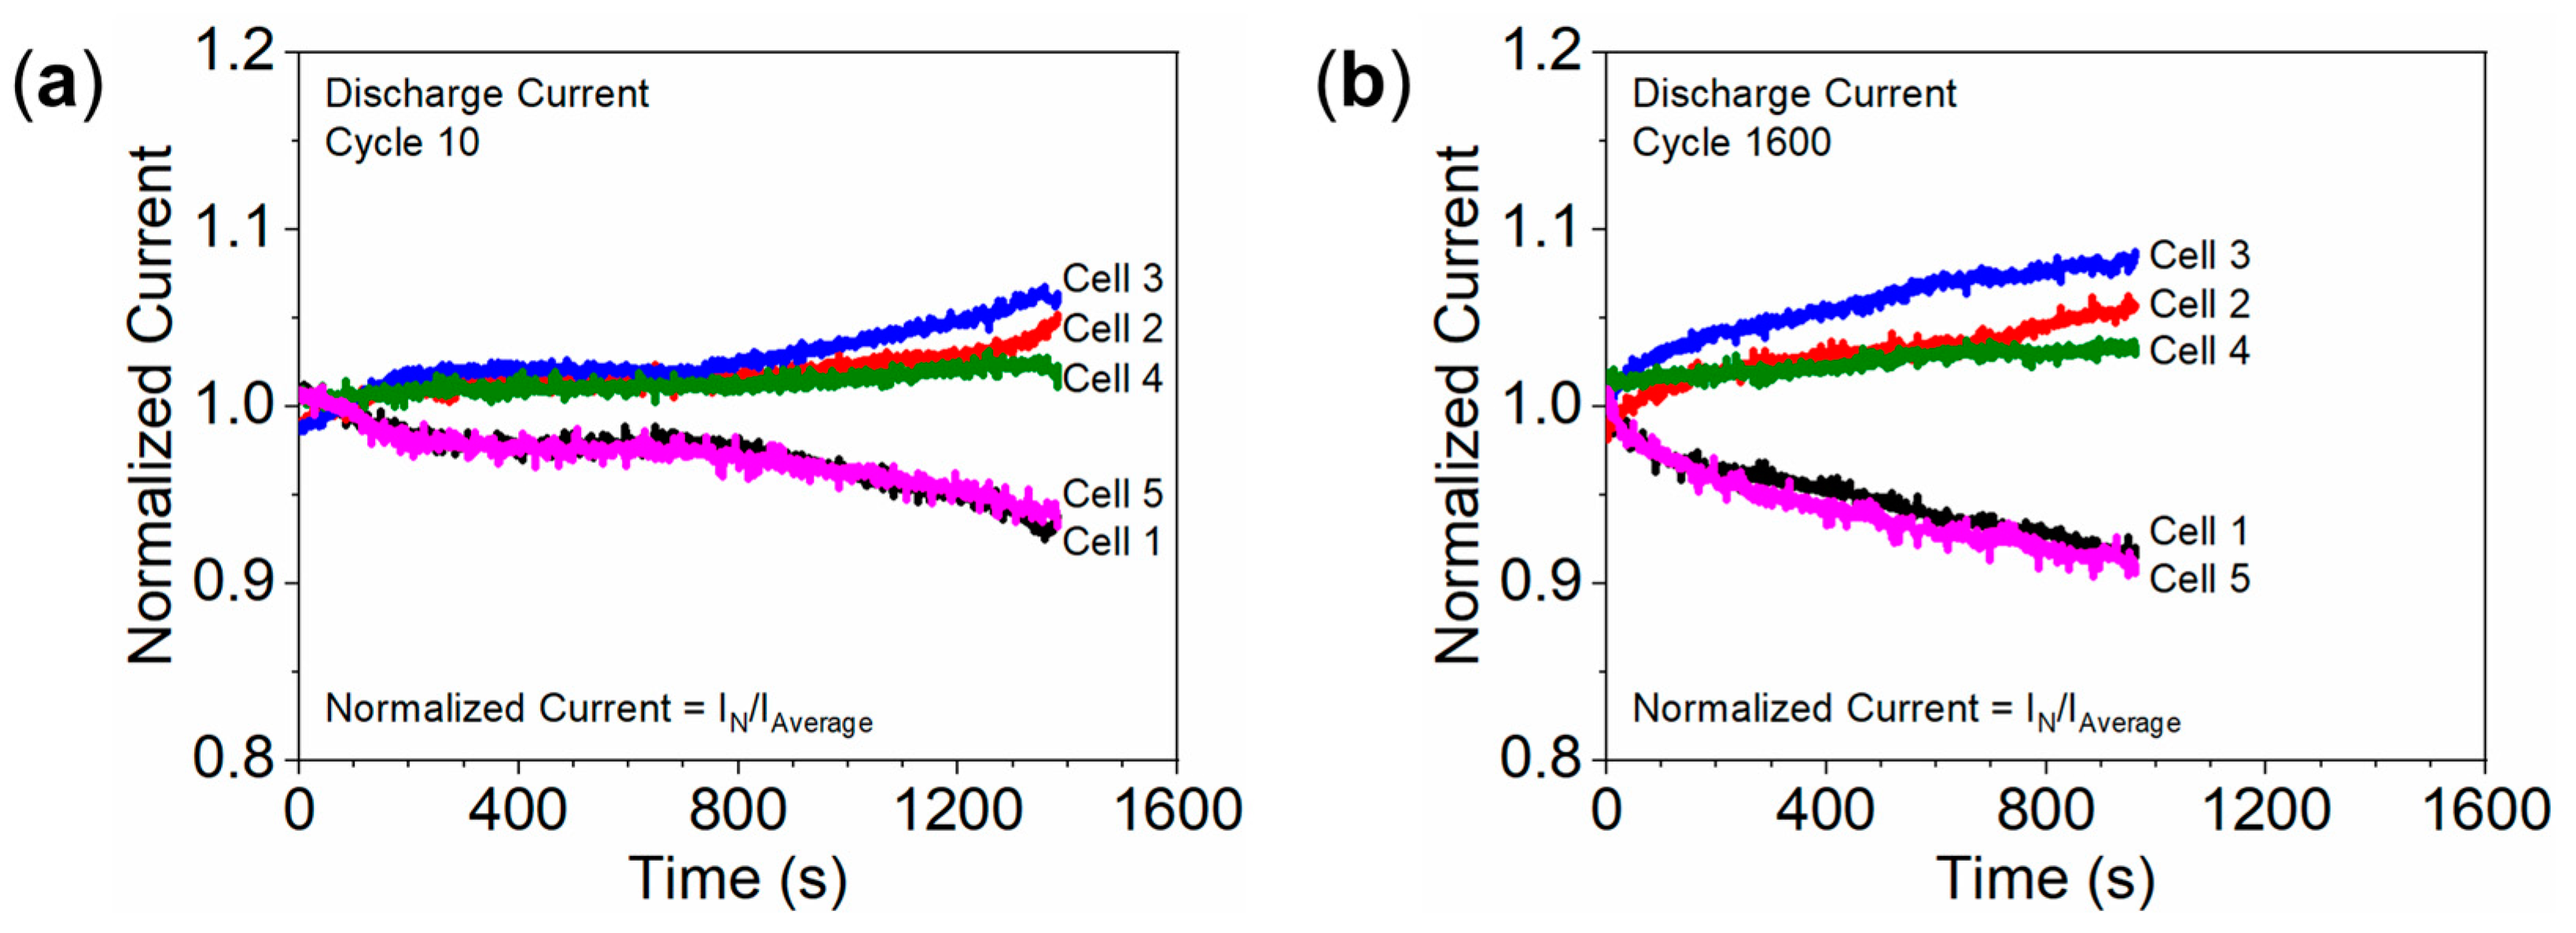
3.4. Non-Uniform Degradation Due to Temperature Differences

As mentioned above in Figure 4a, the middle cell in the stack degraded slightly more slowly than the outside cells. This trend is opposite to the trend observed in our earlier study of an air-cooled stack. A few factors could influence the non-uniform degradation of cells in the stack. The first factor is the non-uniform current distribution across the stack due to a non-uniform temperature distribution, but this was ruled out as discussed below. As shown in Figure 6, cell 3 always had the highest current due to having the highest temperature. Li-ion cells degrade faster at a higher C-rate. Therefore, non-uniform current distribution is unlikely to be the cause of slower degradation for cell 3. The second factor is non-uniform lithium plating. Considering that cell 3 had the highest temperature during cycling, it would have a lower risk of lithium plating than the side cells. Post-mortem analysis in Section 3.6 indicated a greater presence of lithium plating in cell 5 than in cell 3, which supported this explanation. The third factor is the temperature gradient across the cell. An earlier work by Carter et al. [16] showed that the temperature gradient across the thickness of Li-ion cells can accelerate degradation. As shown in Figure 7, the temperature gradient is smallest in the middle cell and largest in the side cells. Note that the temperature gradient of the side cells in this water-cooled stack (~10 °C) is much larger than that of the side cells in the previous air-cooled stack (~4 °C) [20]. Therefore, the larger temperature gradient across the side cells in this water-cooled stack could cause faster degradation than for the middle cell. The fourth factor is the maximum temperature of the middle cell. As shown in Figure 7, the maximum temperature of the middle cell stayed below 44 °C in this water-cooled stack. In comparison, the value ranged from 44 °C to 50 °C in our earlier air-cooled stack. The reduction in the maximum temperature of the middle cell would slow down degradation. Further investigation is needed in the future to examine these factors more closely.

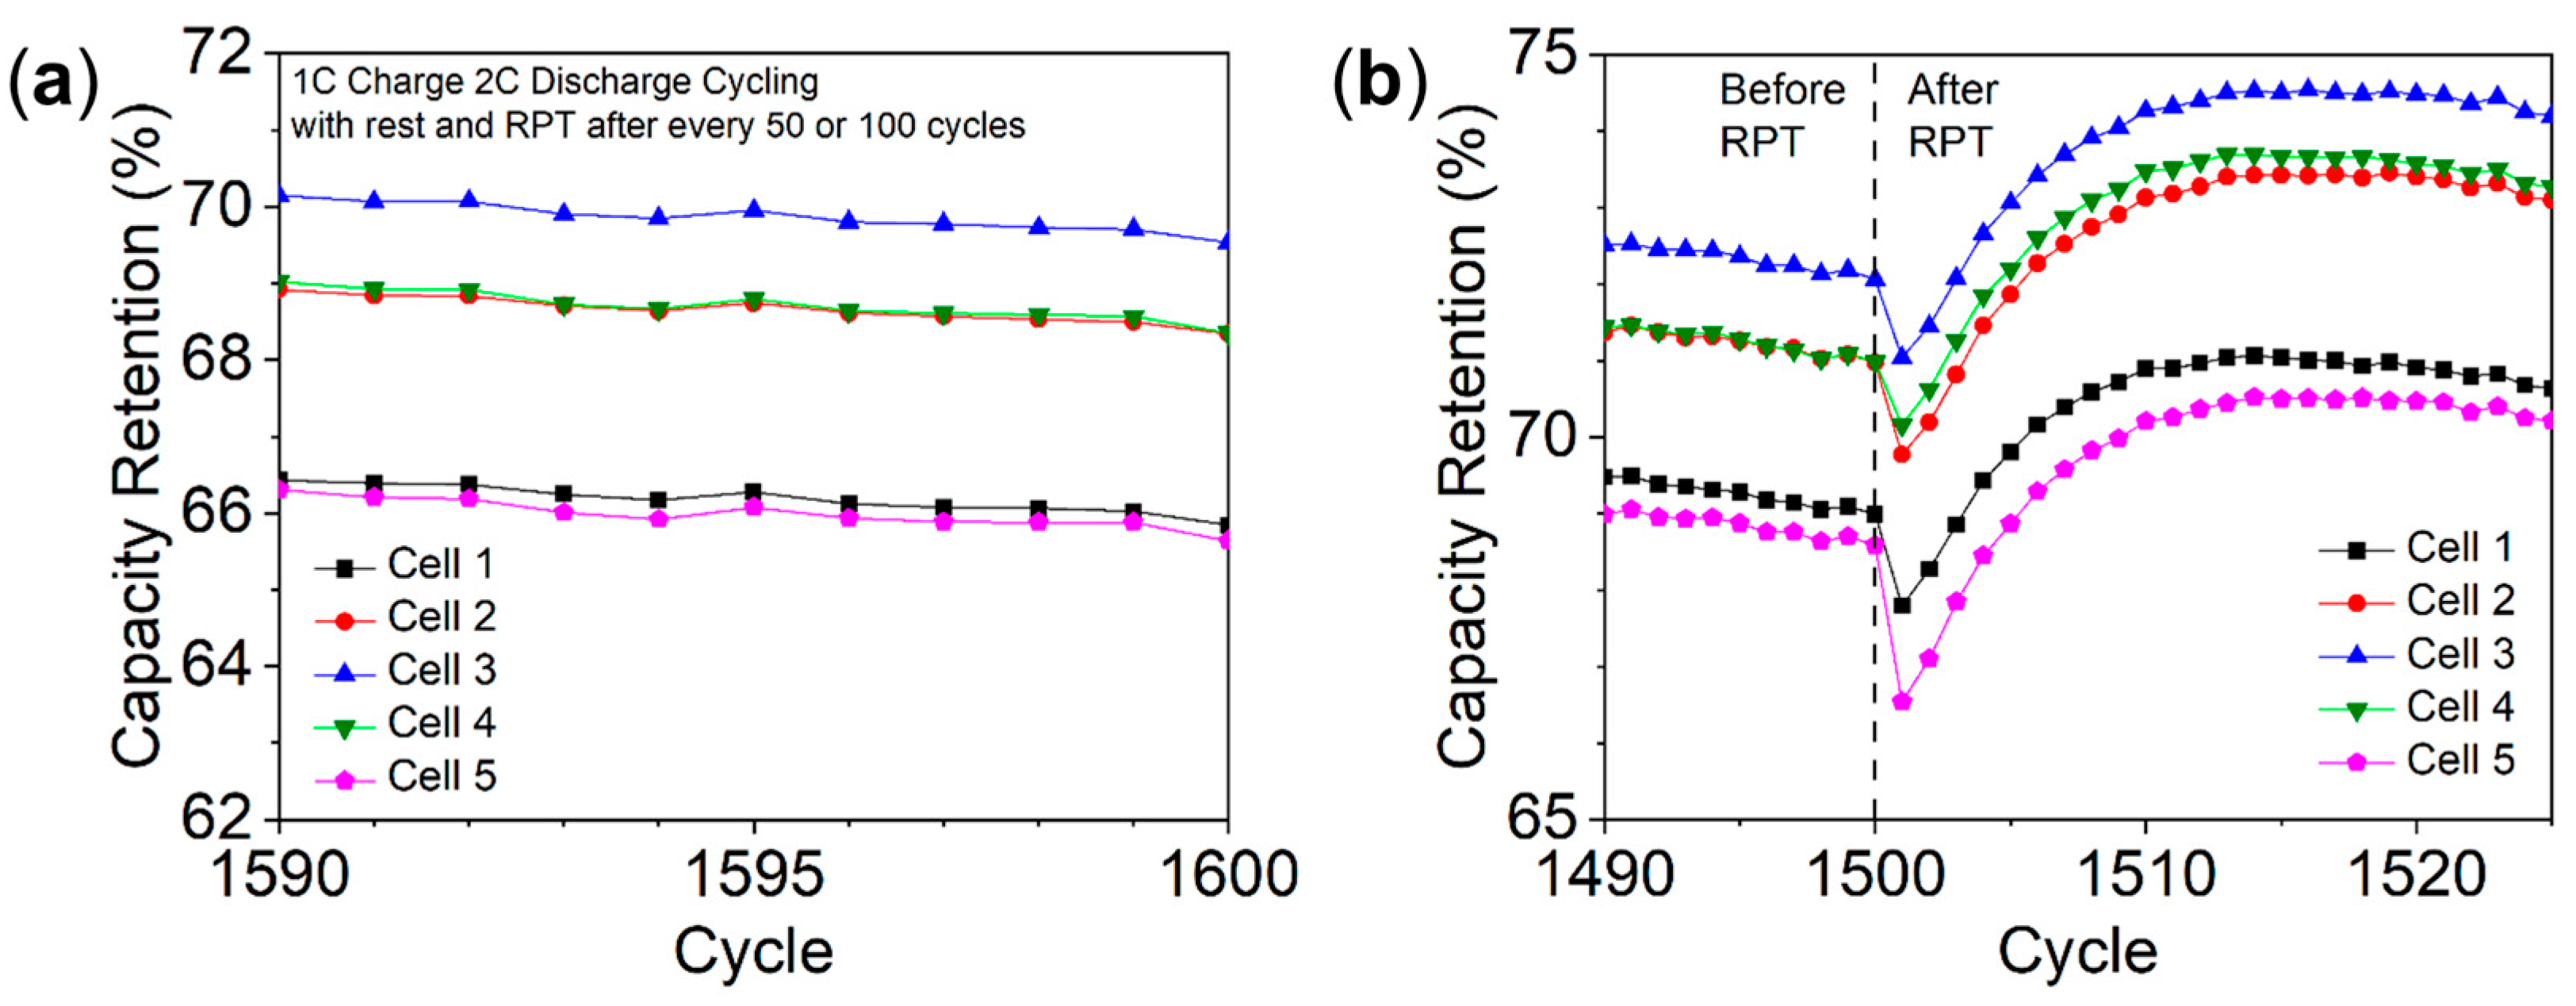
3.5. The Phenomenon of Capacity Drop and Recovery after RPT

As mentioned earlier and as clearly shown in Figure 5b, all the cells in the stack experienced a capacity drop and recovery after an RPT cycle. The discharge rate was C/3 during the RPT cycle, which is much lower than that during regular cycling. Therefore, it is possible that the phenomenon of capacity drop and recovery was related to the RPT cycles. To understand this phenomenon, individual 3-Ah cells from the same batch as cells in the stack were tested. These individual cells were cycled similarly to the cells in the stack using a constant current, constant voltage charge, and 2C discharge. However, the charging rate during cycling, the rest time after RPT, and the starting SOC for the reference performance test were adjusted.
Figure 8a shows the results of a cell with different charging rates during cycling. The cell was charged at 1C, C/2, C/3, and C/4 for 20 cycles before one RPT cycle. The rest time after RPT was kept at 2 h. It can be seen that the phenomenon of capacity drop and recovery exists in all cases. This result indicates that the charging rate or lithium plating was not the cause of the capacity drop and recovery.
Figure 8b shows the results of a cell with different rest times after RPT. The charging rate is 1C. It can be seen that rest time after RPT influences the capacity drop and recovery. Generally, longer rest time is associated with more capacity drop.
Figure 8c shows the results of a cell with different SOCs after RPT. In the 0% SOC case, the cell was simply discharged at the C/3 rate to 2.8 V during the RPT cycle and rested for two hours before regular cycling. In the 10% and 20% starting-SOC cases, the cell was first discharged to 0% SOC in the RPT cycle, then charged to 10% SOC or 20% SOC at the C/3 rate, and then rested for two hours before regular cycling. It can be seen that the phenomenon of capacity drop and recovery was less obvious in the 10% SOC case and completely disappeared in the 20% SOC case. The discharge capacity actually increased after resting in the 20% SOC case, which was opposite to the trend observed in the 0% SOC case. This result clearly showed that the 0% SOC after the C/3 RPT cycle was related to the phenomenon of capacity drop and recovery of cells in the water-cooled stack. During regular cycling, the cells were discharged at 2C to 2.8 V, and the average SOC would be higher than 20% SOC.
Based on the results in Figure 8b,c, it is clear that the low SOC and rest time after each RPT cycle are related to the phenomena of capacity drop and recovery. A literature search indicates that anode overhang effects [29] are the likely causes of the phenomenon. Anode overhang refers to the area of the anode outside the coverage of the cathode. The anode electrode sheet is typically manufactured to be slightly larger than the cathode sheet in Li-ion cells to avoid over-lithiation and lithium plating at the anode edge. Depending on the SOC of a Li-ion cell, the lithium concentration in the anode active area (covered by the cathode) and anode overhang area (outside the cathode) can be different. The concentration difference can cause diffusion between the active area and the overhang area, which can influence the usable discharge capacity. During the regular 1C charge/2C discharge cycling, the SOC of the cell varied from 100% SOC to ~30% SOC, so the SOC in the anode overhang would be in that range. When the cells experienced a C/3 discharge during the RPT cycles, the SOC in the anode active area would reach ~0%, which is significantly lower than that in the anode overhang area. This difference would cause diffusion of lithium from the overhang area to the active area. After extended rest, the diffusion would cause the lithium concentration in the overhang area to be much lower than that during regular cycling. Then, after the first charge after RPT, the lithium concentration in the anode active area would be much higher than that in the anode overhang, causing lithium diffusion to the anode overhang. The diffusion would continue during rest and discharge, reducing the amount of lithium that can be transported to the cathode, thereby causing the reduction in usable capacity as compared with that before RPT. Diffusion from the anode active area to the anode overhang would still occur during the following cycles until a new equilibrium is reached. However, the amount of diffusion would be less, and therefore the “reduced capacity” would be less, and the dischargeable capacity during cycling would recover until capacity degradation started to dominate again.
Based on the above explanation, the phenomenon of capacity drop and recovery would disappear if there were no RPT. To test this hypothesis, the stack was further cycled with rests of more than 24 h after every 100 cycles but without RPT. The capacity retention from cycles 1601 to 1900 is shown in Figure 9. The phenomenon of capacity drop and recovery indeed disappeared, suggesting that the above explanation based on anode overhang effects was reasonable. Note that the capacity increase after rest is commonly observed in Li-ion cell cycling with extended rest, which can be attributed to relaxation effects [30]. Lithium diffusion from the anode overhang area to the active area during rest with a higher starting SOC may have also played a role in the capacity increase [29].

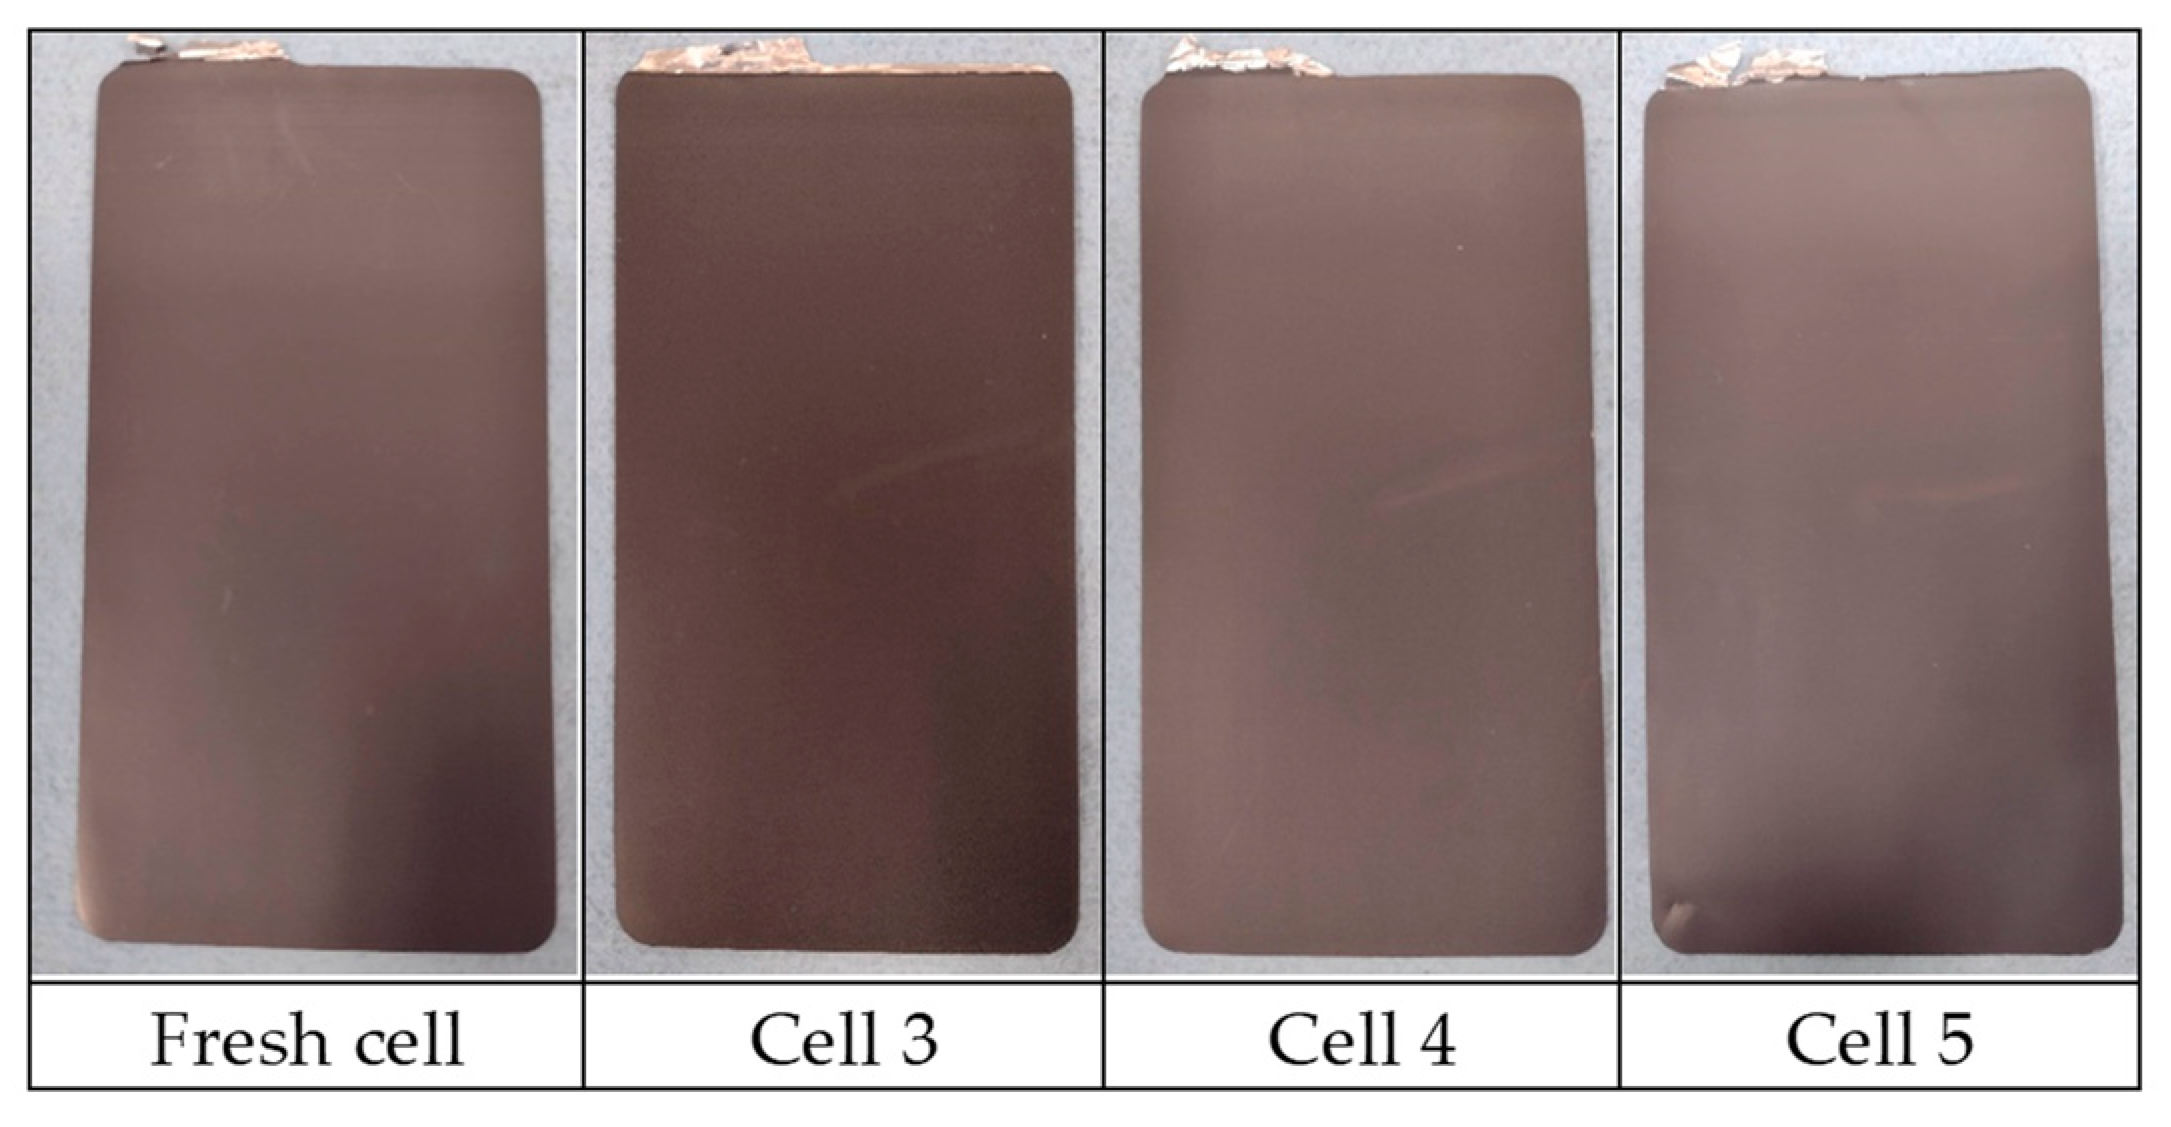
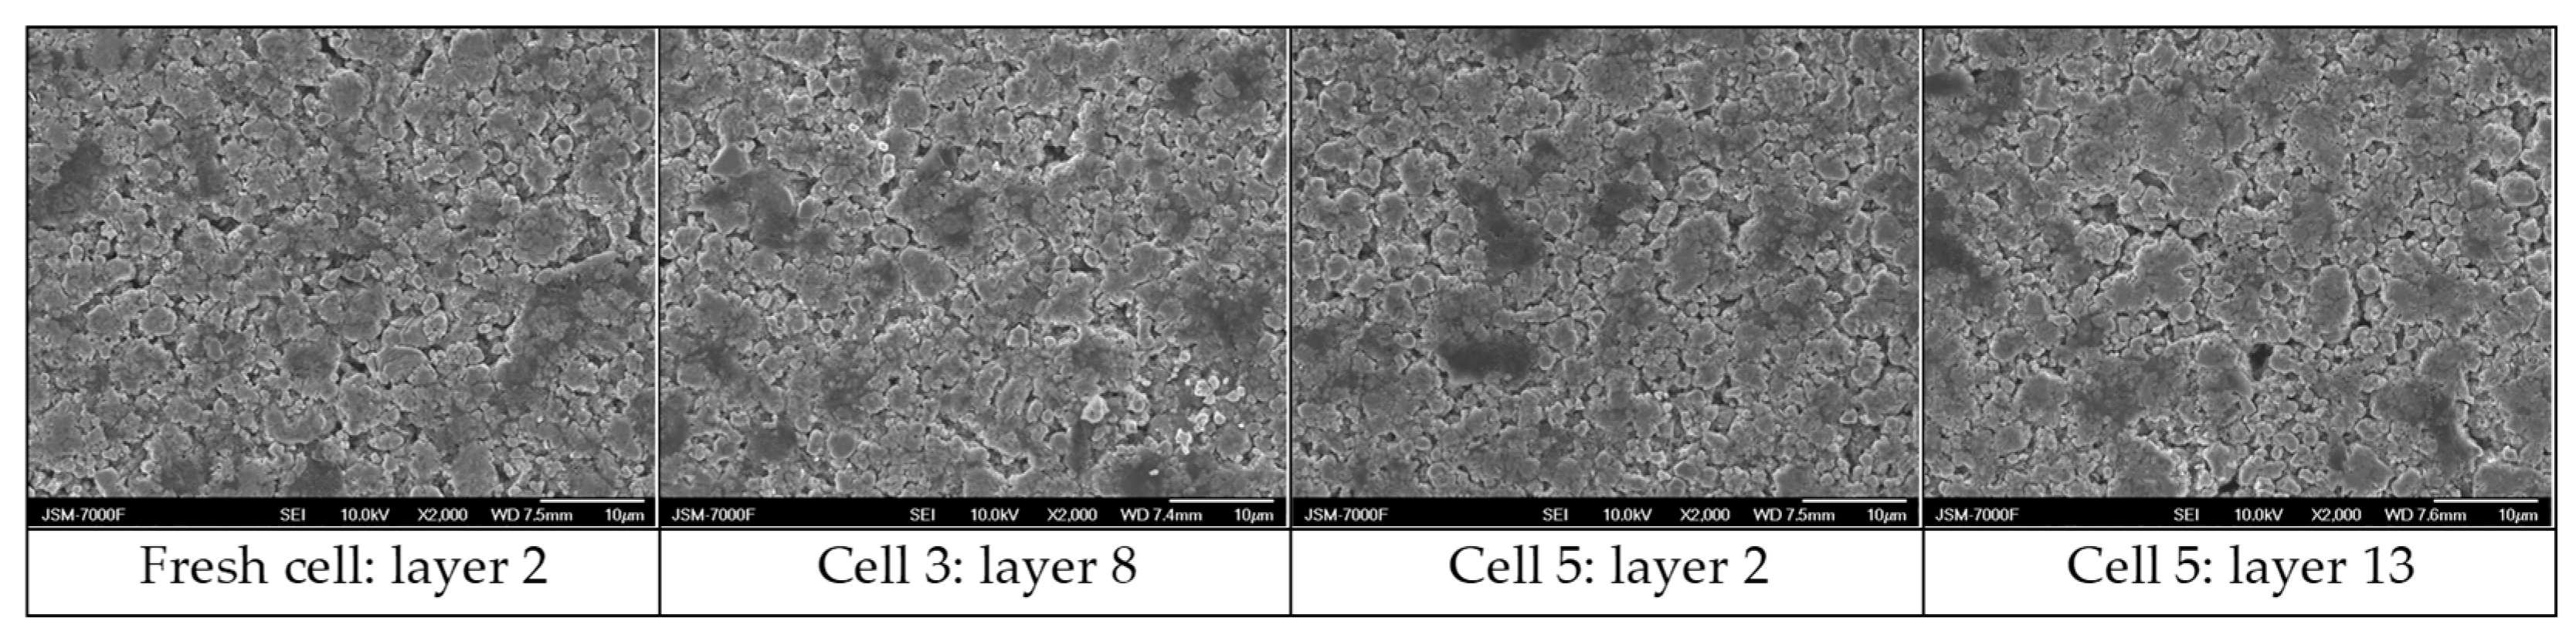
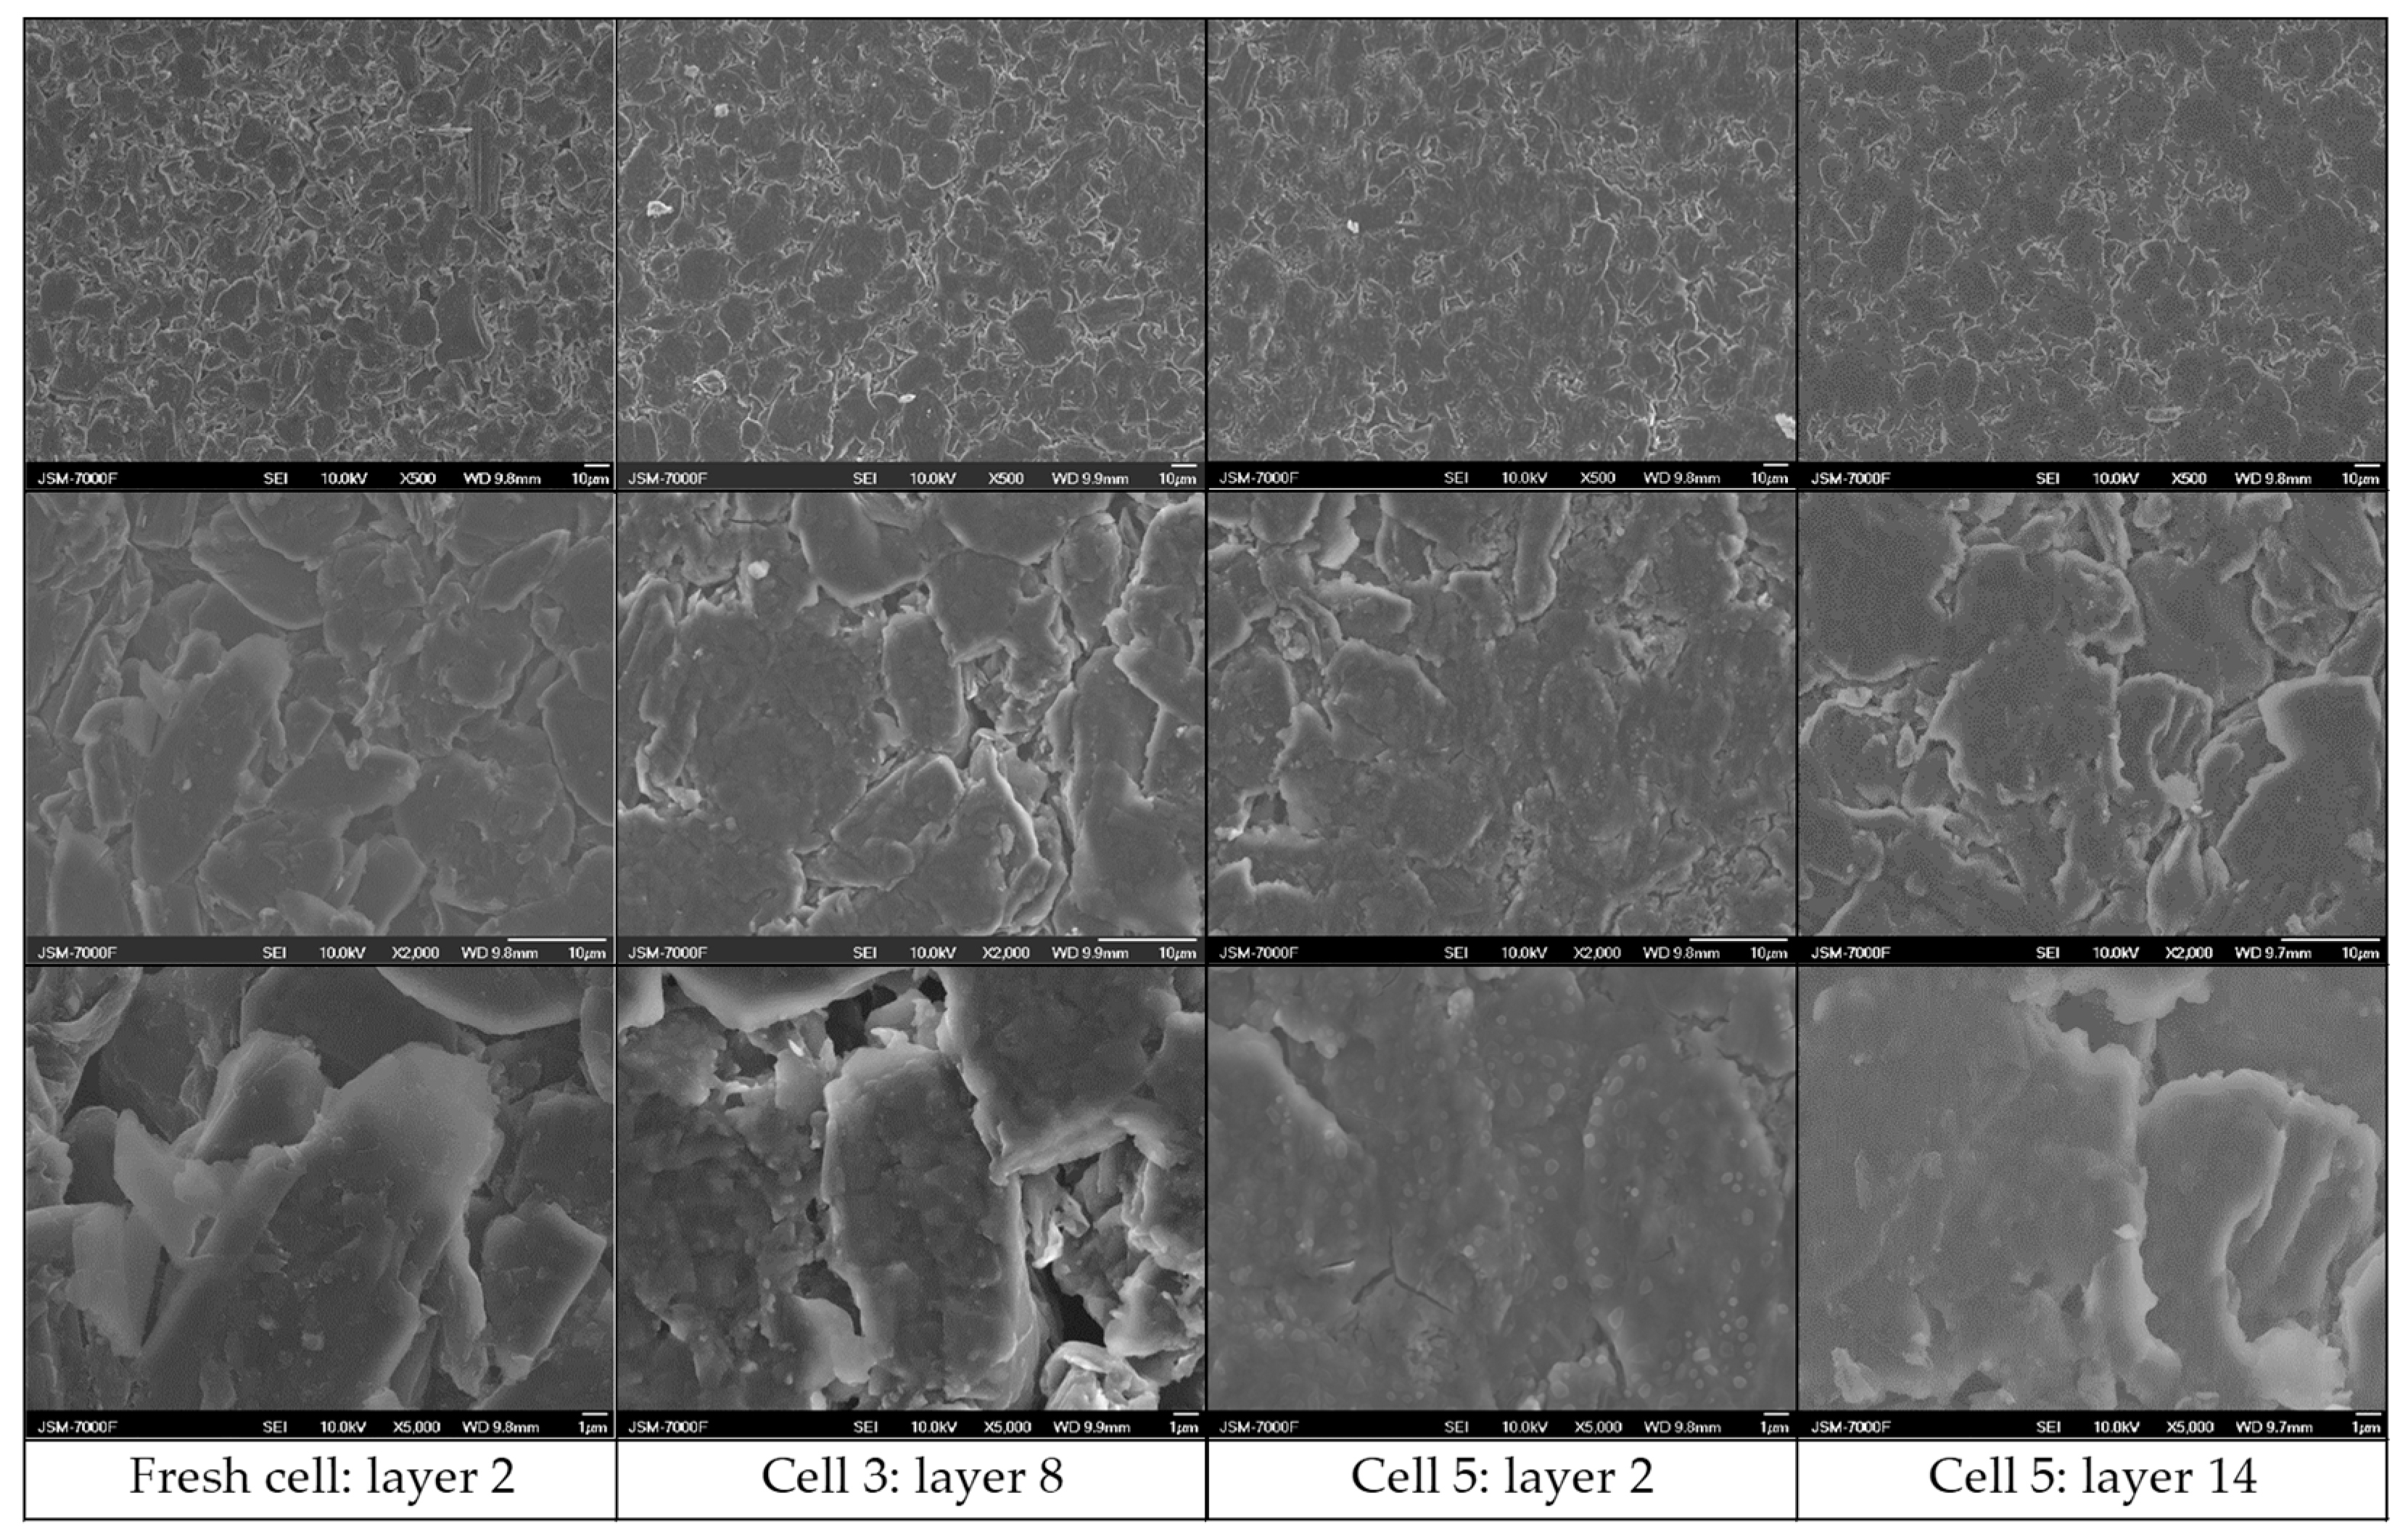
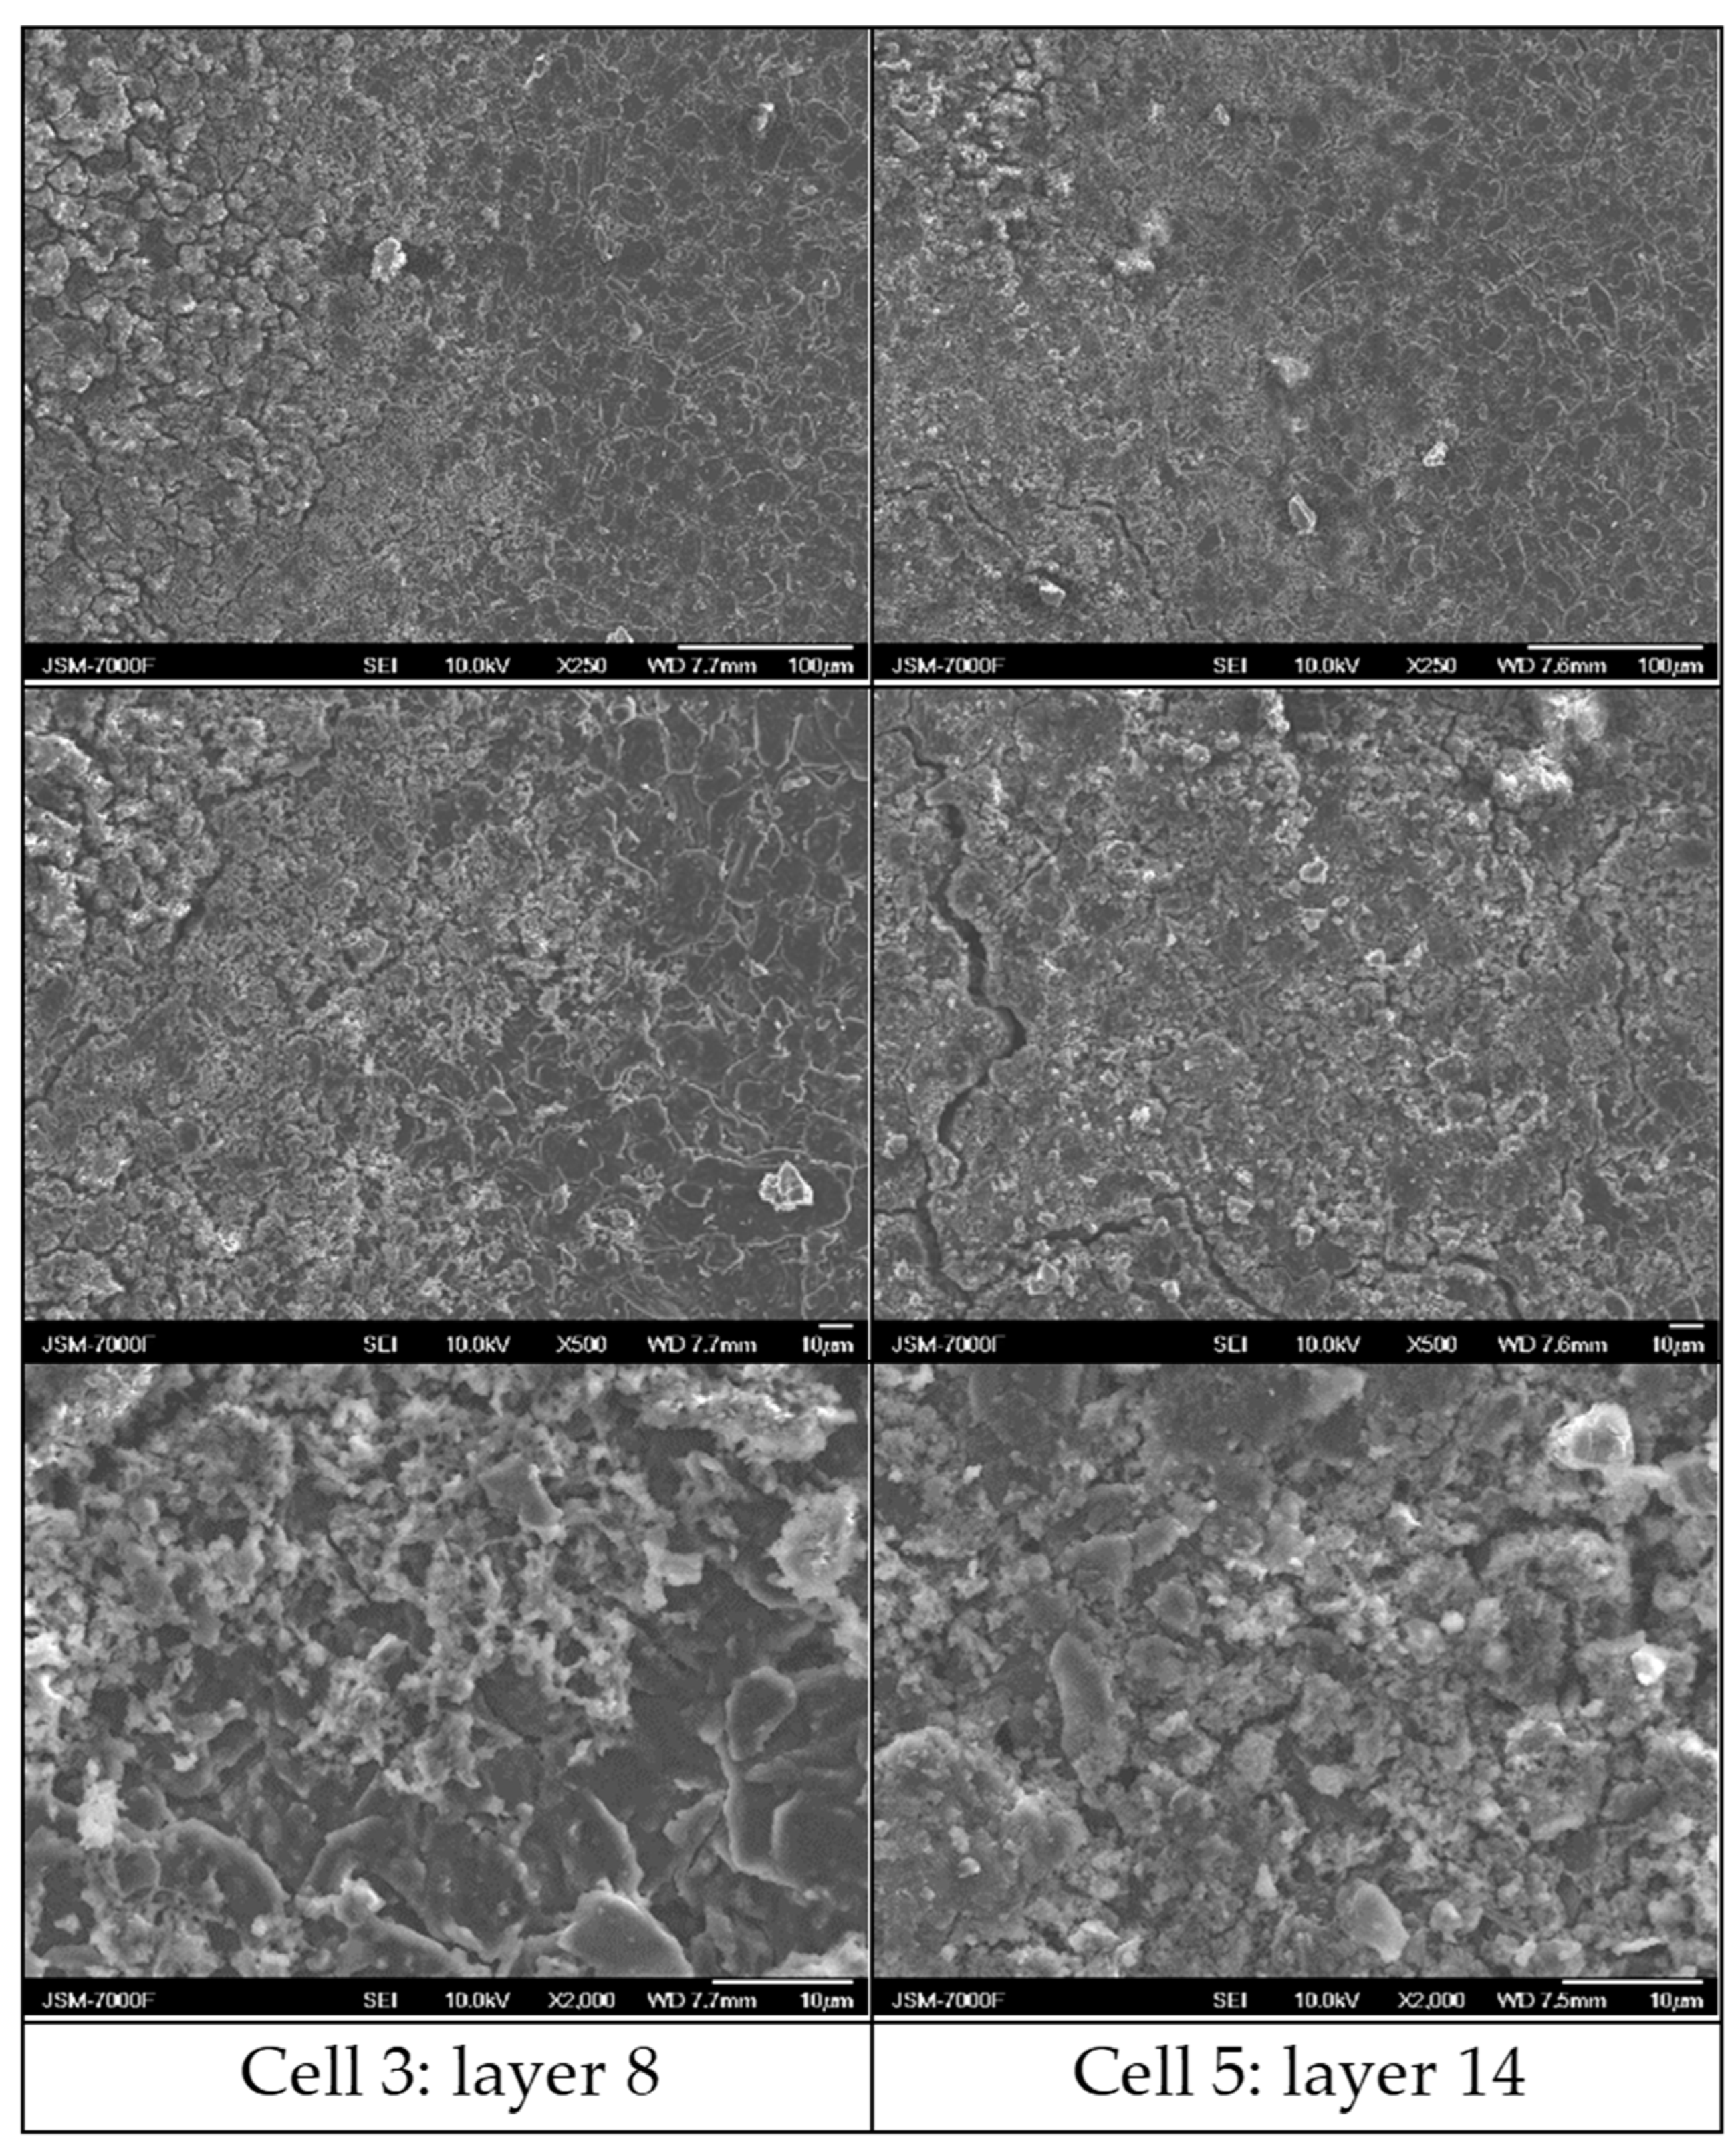
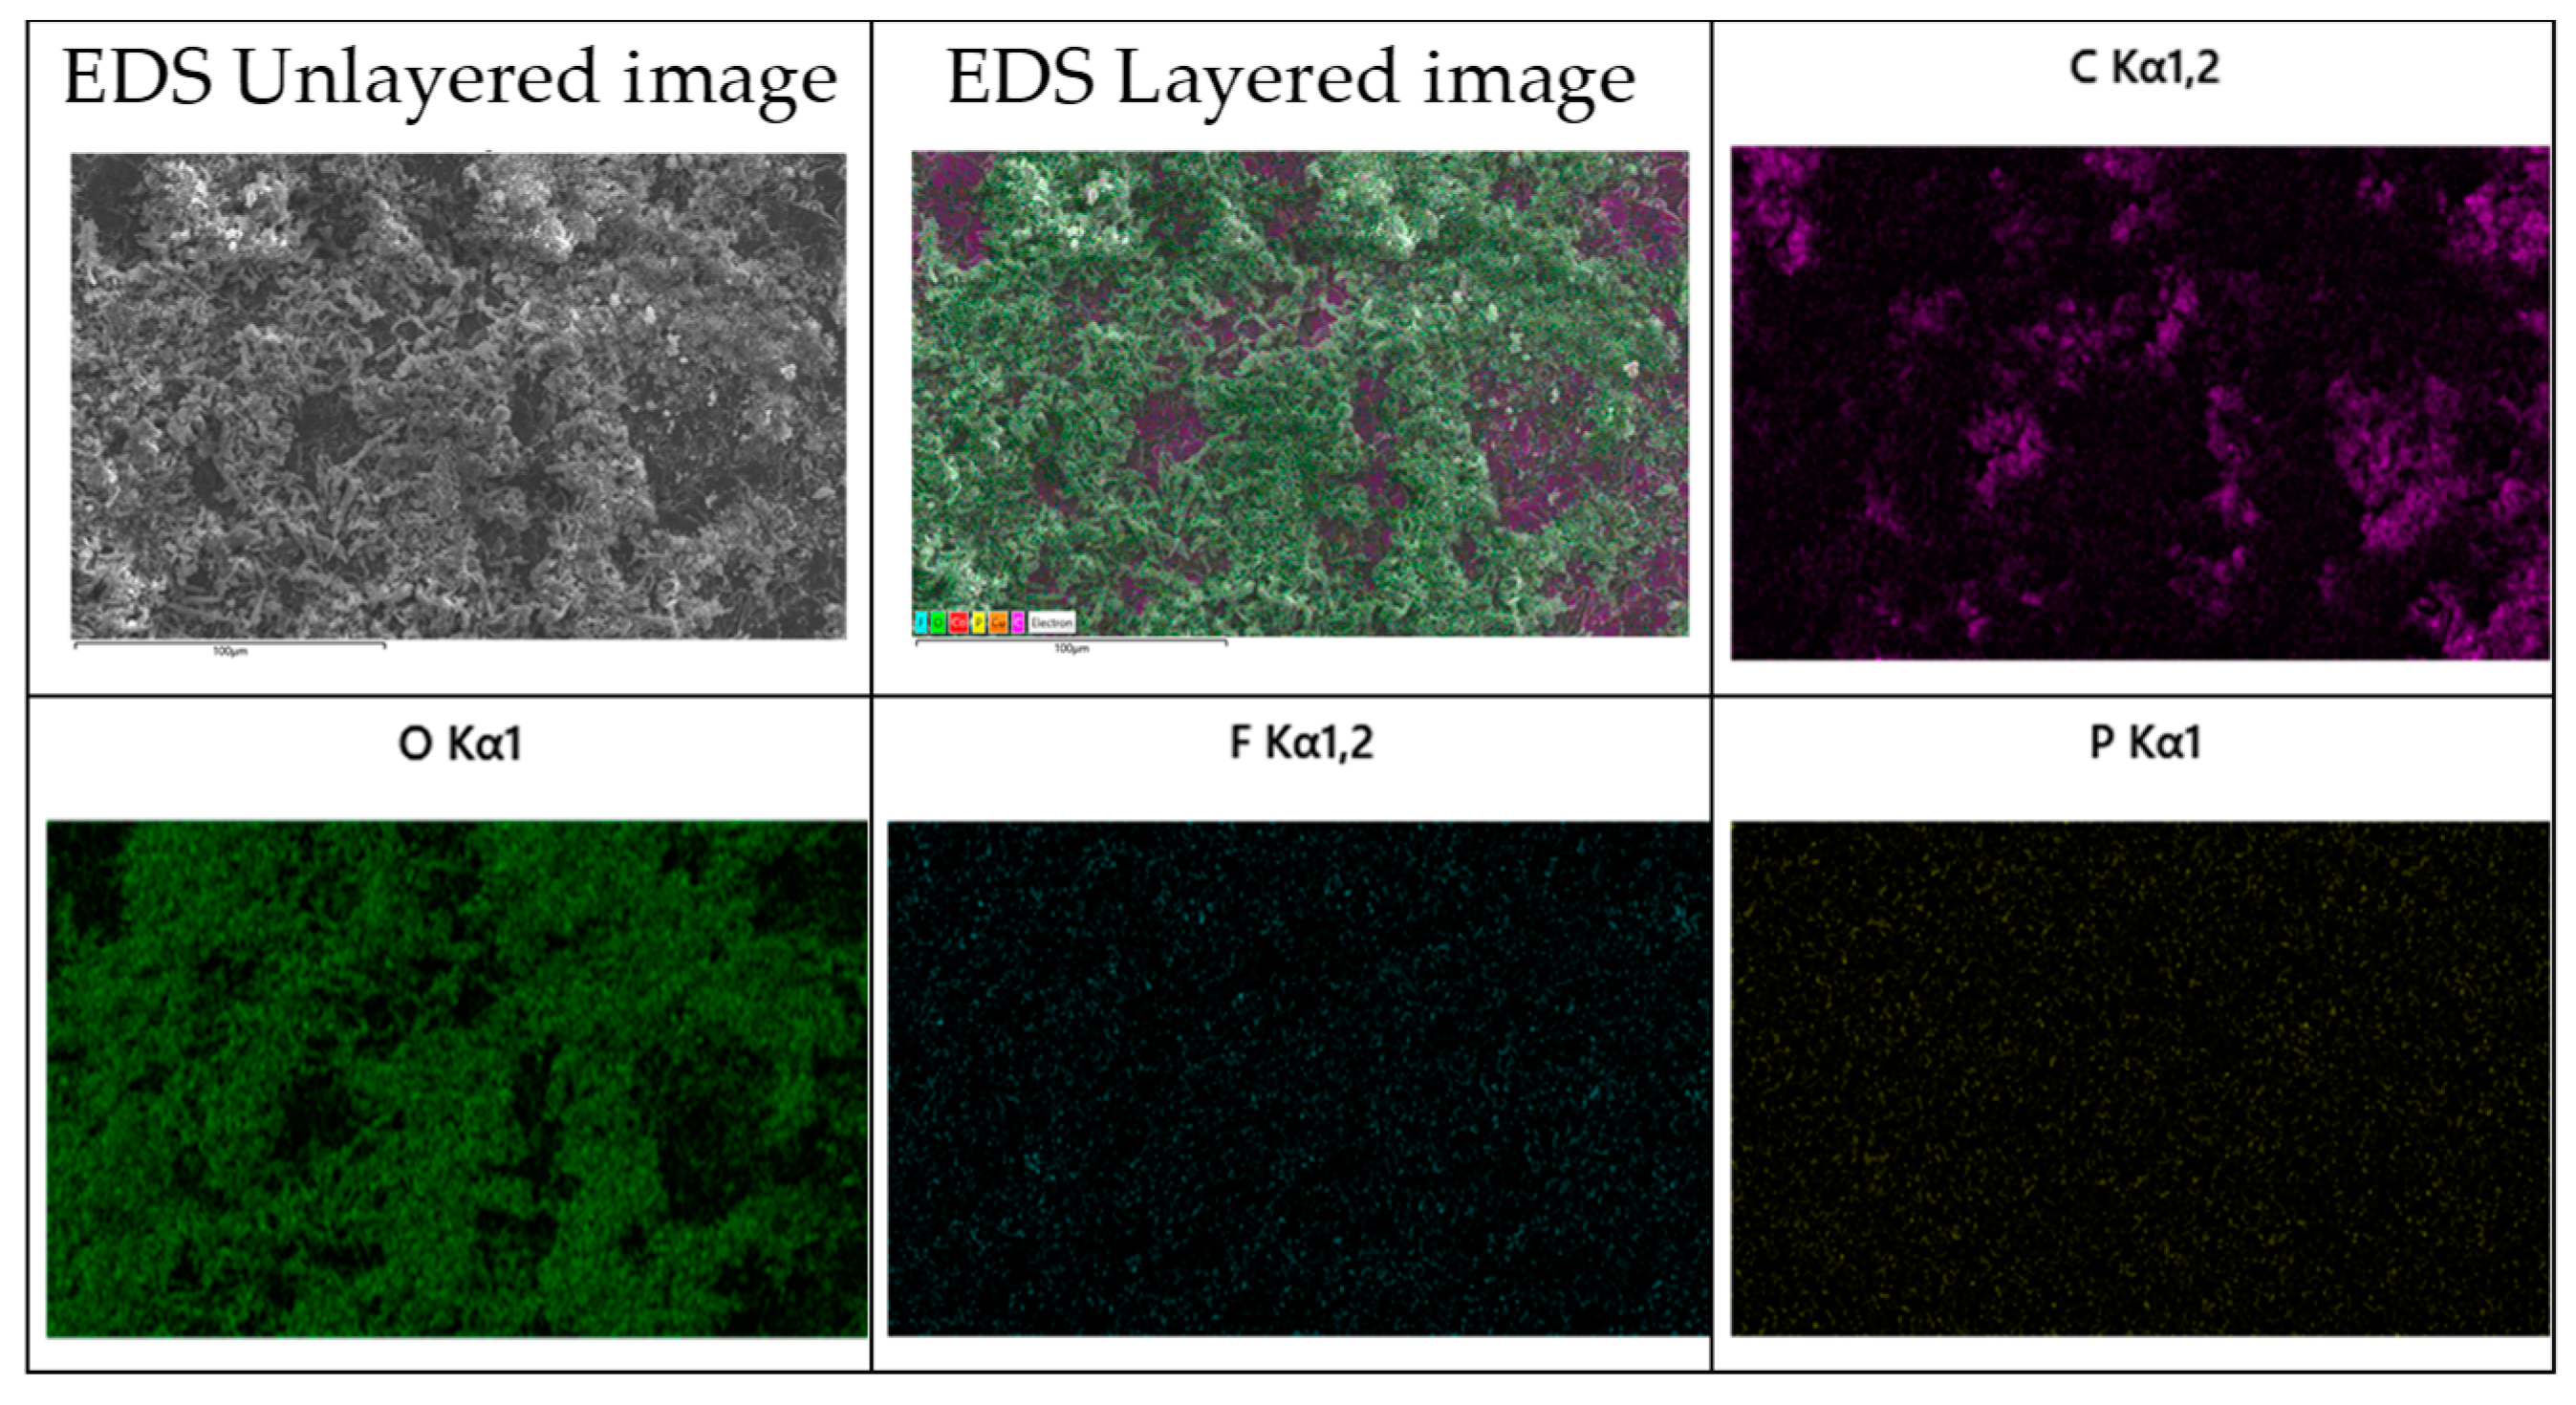
3.6. Post-Morterm Analysis

Cells 3, 4, and 5 in the stack, as well as a fresh cell, were fully discharged and then disassembled in an argon-filled glovebox for further analysis. Each cell has 15 double-coated anode layers and 14 double-coated cathode layers. Figure 10 shows pictures of representative cathode layers, while Figure 11 shows representative anode layers. A complete set of anode pictures is shown in Supplementary Figures S1–S8. All the cathode layers from the cycled cells and the fresh cell look very similar. This similarity is further supported by the SEM images in Figure 12. In comparison, the anode layers from the cycled cells look very different from each other and from the fresh cell. This implies that the degradation of the cycled cells mainly came from the anode, which is consistent with our earlier work of the air-cooled stack [20,21]. Therefore, the following discussion focuses on the differences of the anode layers.
Figure 11 and Supplementary Figures S1–S8 show a few interesting differences in the anode layers. First, some anode coating was tightly attached to the separators and delaminated from the Cu foil in cell 3 and cell 4 during disassembly. This phenomenon was not observed in cell 5. This difference indicates that the anodes were easier to delaminate from the Cu foil in cell 3 and cell 4 than in cell 5. This is consistent with earlier studies that attributed anode delamination to high temperatures [31,32]. Second, the color of the anode layers is lighter near the edge compared with that in the center. The color difference is most obvious for cell 3 and least obvious for cell 5. According to an earlier study [33], the light-colored edge is associated with anode overhang effects, which can lead to lithium plating at the cell edge. Third, there is significantly more light-colored deposition on the anode surface in cell 5 than in cell 3 and cell 4, which indicates that there is more lithium plating in cell 5. Fourth, there is some white deposition on most of the anode surface in cell 3. This white deposition looks unusual and very different from the deposition generally associated with lithium plating in terms of color and distribution. Most of this white deposition seemed to appear after evaporation of the liquid electrolyte during cell disassembly. This phenomenon is also noticeable in cells 4 and 5 but in much smaller amounts. Fifth, there is a tendency for deposition in the grooves caused by thermocouples between the cells, which indicates the effects of non-uniform compression on lithium plating [34]. Smaller thermocouples should be used in future research to reduce this effect.
It is worth comparing the anode layers in Figure 11 with those in the air-cooled stack [21]. The side cell showed increased lithium plating compared with that in the air-cooled stack, which can be attributed to the stronger cooling capability of the liquid, which maintained a lower temperature. The lithium plating of the side cells in the water-cooled stack may have contributed to the slightly faster degradation than for the middle cell.
Figure 13 shows SEM images of the front side of the anodes in the upper middle areas without deposition from a fresh cell, cell 3, and cell 5 at different magnifications. The anode surface looks smoother and less porous in the cycled cells compared with the fresh cell, indicating increased buildup on the anode surface of the cycled cells. Cell 5 seems to have a little more buildup on the graphite particles and lower porosity compared with cell 3, which may have contributed to the slightly faster degradation. However, further investigation is needed to determine the difference in chemical compositions of the buildup and the mechanisms.
Figure 14 shows SEM images of the front side of the anode near the top edge of layer 8 in cell 3 and layer 14 in cell 5, which had nearly the highest and the lowest temperature in the stack during cycling, respectively. Depositions can be clearly seen in both cells, indicating the occurrence of lithium plating at the edge [35]. The mossy deposition in cell 3 looks similar to the deposition on the anode of the middle cell in the previous air-cooled stack [21], which was attributed to lithium plating. This is consistent with the earlier study showing that lithium plating can occur near the cell edge due to anode overhang effects [33]. The morphology difference in the depositions between cell 3 and cell 5 could be attributed to the non-uniform temperature distribution and current distribution across the stack, but further investigation is needed.
Figure 15 shows EDS images of the deposition in the lower middle region of layer 2 in cell 5. Elemental oxygen is rich in the deposition area, while element carbon is rich in the area without deposition. The distribution of elemental oxygen supports the earlier discussion that the deposition in cell 5 was from lithium plating, which can react with components in air to form products enriched in oxygen (Li2O, LiOH, Li2CO3, etc.) [36,37]. There is a uniform distribution of the elements fluorine and phosphorus, which are likely from the residue of the electrolyte salt in the pores of the anode that could not be easily washed off. The elements cobalt and copper were also detected but in very low amounts. Supplementary Figure S9 shows EDS images of a region with deposition and delamination in the upper middle area of layer 8 in cell 3. The deposition is also rich in elemental oxygen but lower in elemental fluorine compared with the deposition in Figure 14. Further investigation is needed to understand the difference in deposition between cell 3 and cell 5.

3.7. Future Work

This study has shown that the degradation behaviors of parallel-connected Li-ion cells in a liquid-cooled stack behave differently from those cells in an air-cooled stack. Although efforts have been made to understand the different degradation behaviors and the phenomenon of capacity drop and recovery due to RPT, further investigation is still needed. In particular, it is noticed that anode delamination only occurred in the upper part (close to tabs) of the anode layers in cell 3 and cell 4, and not in the lower part. In comparison, the lithium plating in cell 5 occurred more often in the lower part of anode. Such non-uniformity could be related to the non-uniform distribution of the local current density and local temperature in the in-plane direction, which is higher closer to the tabs. These observations, as well as the lithium plating at the edge of the anodes, implies that non-uniform degradation occurs in both the through-plane direction and the in-plane direction for large-format Li-ion cells. A more systematic post-mortem analysis of anode samples in the cycled cells is needed. Due to the interactions of multiple parameters, such as local current density, local temperature, and local compression, numerical modeling would be useful to understand the coupled effects.

4. Conclusions

A water-cooled stack of five pouch-format Li-ion cells was assembled and cycled for comparison with a previous air-cooled stack. Two unexpected phenomena were observed. First, it was observed that the middle cell in the water-cooled stack degraded slightly more slowly than the side cells. This trend is opposite to that of cells in the air-cooled stack. The opposite degradation trends of the water-cooled stack and the air-cooled stack could be attributed to the combined effects of the temperature rise and temperature gradient. Second, it was observed that all the cells in the water-cooled stack experienced the phenomenon of capacity drop and recovery after a low C-rate reference performance test and extended rest. This phenomenon was attributed to lithium diffusion between the anode active area and the anode overhang area. In addition, post-mortem analysis showed the occurrence of lithium plating at the edge of the cell, which can also be attributed to the anode overhang effects. Further investigation is needed to confirm the mechanisms.

Supplementary Materials

The following supporting information can be downloaded at: https://www.mdpi.com/article/10.3390/batteries10080274/s1, Figure S1: Fresh cell anodes front side; Figure S2: Fresh cell anodes back side; Figure S3: Cell 3 anodes front sides; Figure S4: Cell 3 anodes back sides; Figure S5: Cell 4 anodes front sides; Figure S6: Cell 4 anodes back sides; Figure S7: Cell 5 anodes front sides; Figure S8: Cell 5 anodes back sides; Figure S9: EDS images of deposition in the upper middle region of layer 8 in cell 3 (at 100× magnification).

Author Contributions

Conceptualization, G.Z.; Methodology, T.I., G.M.C., G.J.N. and G.Z.; Formal analysis, T.I., M.C. and G.Z.; Investigation, T.I., M.C., G.M.C., P.P. and G.Z.; Resources, G.Z.; Data curation, T.I. and M.C.; Writing—original draft, T.I.; Writing—review & editing, M.C., G.M.C., P.P., G.J.N. and G.Z.; Supervision, G.Z.; Project administration, G.Z. All authors have read and agreed to the published version of the manuscript.

Funding

This research received no external funding.

Data Availability Statement

Data are contained within the article.

Acknowledgments

G.Z. acknowledges the financial support from The University of Alabama in Huntsville (UAH) Faculty Startup Fund. T.I. and G.Z. acknowledge helpful discussions with Siyi Liu at UAH.

Conflicts of Interest

The authors declare no conflict of interest.

References

  1. Birkl, C.R.; Roberts, M.R.; McTurk, E.; Bruce, P.G.; Howey, D.A. Degradation diagnostics for lithium ion cells. J. Power Sources 2017, 341, 373–386. [Google Scholar] [CrossRef]
  2. Edge, J.S.; O’Kane, S.; Prosser, R.; Kirkaldy, N.D.; Patel, A.N.; Hales, A.; Ghosh, A.; Ai, W.; Chen, J.; Yang, J.; et al. Lithium ion battery degradation: What you need to know. Phys. Chem. Chem. Phys. 2021, 23, 8200–8221. [Google Scholar] [CrossRef] [PubMed]
  3. Waldmann, T.; Wilka, M.; Kasper, M.; Fleischhammer, M.; Wohlfahrt-Mehrens, M. Temperature dependent ageing mechanisms in Lithium-ion batteries—A Post-Mortem study. J. Power Sources 2014, 262, 129–135. [Google Scholar] [CrossRef]
  4. Longchamps, R.S.; Yang, X.-G.; Wang, C.-Y. Fundamental Insights into Battery Thermal Management and Safety. ACS Energy Lett. 2022, 7, 1103–1111. [Google Scholar] [CrossRef]
  5. Bandhauer, T.M.; Garimella, S.; Fuller, T.F. A Critical Review of Thermal Issues in Lithium-Ion Batteries. J. Electrochem. Soc. 2011, 158, R1–R25. [Google Scholar] [CrossRef]
  6. Maleki, H.; Hallaj, S.A.; Selman, J.R.; Dinwiddie, R.B.; Wang, H. Thermal Properties of Lithium-Ion Battery and Components. J. Electrochem. Soc. 1999, 146, 947–954. [Google Scholar] [CrossRef]
  7. Richter, F.; Kjelstrup, S.; Vie, P.J.S.; Burheim, O.S. Thermal conductivity and internal temperature profiles of Li-ion secondary batteries. J. Power Sources 2017, 359, 592–600. [Google Scholar] [CrossRef]
  8. Steinhardt, M.; Barreras, J.V.; Ruan, H.; Wu, B.; Offer, G.J.; Jossen, A. Meta-analysis of experimental results for heat capacity and thermal conductivity in lithium-ion batteries: A critical review. J. Power Sources 2022, 522, 230829. [Google Scholar] [CrossRef]
  9. Forgez, C.; Vinh Do, D.; Friedrich, G.; Morcrette, M.; Delacourt, C. Thermal modeling of a cylindrical LiFePO4/graphite lithium-ion battery. J. Power Sources 2010, 195, 2961–2968. [Google Scholar] [CrossRef]
  10. Li, Z.; Zhang, J.; Wu, B.; Huang, J.; Nie, Z.; Sun, Y.; An, F.; Wu, N. Examining temporal and spatial variations of internal temperature in large-format laminated battery with embedded thermocouples. J. Power Sources 2013, 241, 536–553. [Google Scholar] [CrossRef]
  11. Zhang, G.; Cao, L.; Ge, S.; Wang, C.-Y.; Shaffer, C.E.; Rahn, C.D. In Situ Measurement of Radial Temperature Distributions in Cylindrical Li-Ion Cells. J. Electrochem. Soc. 2014, 161, A1499–A1507. [Google Scholar] [CrossRef]
  12. Amietszajew, T.; McTurk, E.; Fleming, J.; Bhagat, R. Understanding the limits of rapid charging using instrumented commercial 18,650 high-energy Li-ion cells. Electrochim. Acta 2018, 263, 346–352. [Google Scholar] [CrossRef]
  13. Huang, S.; Wu, X.; Cavalheiro, G.M.; Du, X.; Liu, B.; Du, Z.; Zhang, G. In Situ Measurement of Lithium-Ion Cell Internal Temperatures during Extreme Fast Charging. J. Electrochem. Soc. 2019, 166, A3254–A3259. [Google Scholar] [CrossRef]
  14. Du, X.; Wu, Q.; Wang, Y.-N.; Pan, T.-S.; Wei, Y.-M.; Chen, H.-S.; Song, W.-L.; Fang, D.-N. Visualizing two-dimensional internal temperature distribution in cylindrical Li-ion cells. J. Power Sources 2020, 446, 227343. [Google Scholar] [CrossRef]
  15. Hunt, I.A.; Zhao, Y.; Patel, Y.; Offer, G.J. Surface Cooling Causes Accelerated Degradation Compared to Tab Cooling for Lithium-Ion Pouch Cells. J. Electrochem. Soc. 2016, 163, A1846–A1852. [Google Scholar] [CrossRef]
  16. Carter, R.; Kingston, T.A.; Atkinson, R.W.; Parmananda, M.; Dubarry, M.; Fear, C.; Mukherjee, P.P.; Love, C.T. Directionality of thermal gradients in lithium-ion batteries dictates diverging degradation modes. Cell Rep. Phys. Sci. 2021, 2, 100351. [Google Scholar] [CrossRef]
  17. Klein, M.P.; Park, J.W. Current Distribution Measurements in Parallel-Connected Lithium-Ion Cylindrical Cells under Non-Uniform Temperature Conditions. J. Electrochem. Soc. 2017, 164, A1893–A1906. [Google Scholar] [CrossRef]
  18. Paarmann, S.; Cloos, L.; Technau, J.; Wetzel, T. Measurement of the Temperature Influence on the Current Distribution in Lithium-Ion Batteries. Energy Technol. 2021, 9, 2000862. [Google Scholar] [CrossRef]
  19. Werner, D.; Paarmann, S.; Wiebelt, A.; Wetzel, T. Inhomogeneous Temperature Distribution Affecting the Cyclic Aging of Li-Ion Cells. Part I: Experimental Investigation. Batteries 2020, 6, 13. [Google Scholar] [CrossRef]
  20. Cavalheiro, G.M.; Iriyama, T.; Nelson, G.J.; Huang, S.; Zhang, G. Effects of Nonuniform Temperature Distribution on Degradation of Lithium-Ion Batteries. J. Electrochem. Energy Convers. Storage 2020, 17, 021101. [Google Scholar] [CrossRef]
  21. Malabet, H.J.G.; Cavalheiro, G.M.; Iriyama, T.; Gabhart, A.; Nelson, G.J.; Zhang, G. Electrochemical and Post-Mortem Degradation Analysis of Lithium-Ion Cells Subjected to Long Term Cycling under Non-Uniform Thermal Conditions. J. Electrochem. Soc. 2021, 168, 100507. [Google Scholar] [CrossRef]
  22. Yang, X.-G.; Leng, Y.; Zhang, G.; Ge, S.; Wang, C.-Y. Modeling of lithium plating induced aging of lithium-ion batteries: Transition from linear to nonlinear aging. J. Power Sources 2017, 360, 28–40. [Google Scholar] [CrossRef]
  23. Liu, S.; Zhang, G.; Wang, C.-Y. Challenges and Innovations of Lithium-Ion Battery Thermal Management Under Extreme Conditions: A Review. ASME J. Heat. Mass. Transf. 2023, 145, 080801. [Google Scholar] [CrossRef]
  24. Iriyama, T.; Cavalheiro, G.M.; Liu, S.; Poudel, P.; Zhang, G. (Digital Presentation) Effects of Non-Uniform Temperature Distribution on the Degradation of Liquid-Cooled Lithium-Ion Cells. In ECS Meeting Abstracts; The Electrochemical Society, Inc.: Pennington, NJ, USA, 2022; Volume MA2022-01, p. 442. [Google Scholar]
  25. Schweiger, H.G.; Obeidi, O.; Komesker, O.; Raschke, A.; Schiemann, M.; Zehner, C.; Gehnen, M.; Keller, M.; Birke, P. Comparison of Several Methods for Determining the Internal Resistance of Lithium Ion Cells. Sensors 2010, 10, 5604–5625. [Google Scholar] [CrossRef] [PubMed]
  26. Gu, W.B.; Wang, C.Y. Thermal-Electrochemical Modeling of Battery Systems. J. Electrochem. Soc. 2000, 147, 2910–2922. [Google Scholar] [CrossRef]
  27. Thomas, K.E.; Newman, J. Heats of mixing and of entropy in porous insertion electrodes. J. Power Sources 2003, 119–121, 844–849. [Google Scholar] [CrossRef]
  28. Lin, N.; Röder, F.; Krewer, U. Multiphysics Modeling for Detailed Analysis of Multi-Layer Lithium-Ion Pouch Cells. Energies 2018, 11, 2998. [Google Scholar] [CrossRef]
  29. Gyenes, B.; Stevens, D.A.; Chevrier, V.L.; Dahn, J.R. Understanding Anomalous Behavior in Coulombic Efficiency Measurements on Li-Ion Batteries. J. Electrochem. Soc. 2014, 162, A278–A283. [Google Scholar] [CrossRef]
  30. Baghdadi, I.; Briat, O.; Gyan, P.; Vinassa, J.M. State of health assessment for lithium batteries based on voltage–time relaxation measure. Electrochim. Acta 2016, 194, 461–472. [Google Scholar] [CrossRef]
  31. Somerville, L.; Bareño, J.; Trask, S.; Jennings, P.; McGordon, A.; Lyness, C.; Bloom, I. The effect of charging rate on the graphite electrode of commercial lithium-ion cells: A post-mortem study. J. Power Sources 2016, 335, 189–196. [Google Scholar] [CrossRef]
  32. Lu, D.; Xu, M.; Zhou, L.; Garsuch, A.; Lucht, B.L. Failure Mechanism of Graphite/LiNi0.5Mn1.5O4Cells at High Voltage and Elevated Temperature. J. Electrochem. Soc. 2013, 160, A3138–A3143. [Google Scholar] [CrossRef]
  33. Grimsmann, F.; Gerbert, T.; Brauchle, F.; Gruhle, A.; Parisi, J.; Knipper, M. Hysteresis and current dependence of the graphite anode color in a lithium-ion cell and analysis of lithium plating at the cell edge. J. Energy Storage 2018, 15, 17–22. [Google Scholar] [CrossRef]
  34. Spingler, F.B.; Friedrich, S.; Kücher, S.; Schmid, S.; López-Cruz, D.; Jossen, A. The Effects of Non-Uniform Mechanical Compression of Lithium-Ion Cells on Local Current Densities and Lithium Plating. J. Electrochem. Soc. 2021, 168, 110515. [Google Scholar] [CrossRef]
  35. Birkenmaier, C.; Bitzer, B.; Harzheim, M.; Hintennach, A.; Schleid, T. Lithium Plating on Graphite Negative Electrodes: Innovative Qualitative and Quantitative Investigation Methods. J. Electrochem. Soc. 2015, 162, A2646–A2650. [Google Scholar] [CrossRef]
  36. Waldmann, T.; Hogrefe, C.; Flügel, M.; Pivarníková, I.; Weisenberger, C.; Delz, E.; Bolsinger, M.; Boveleth, L.; Paul, N.; Kasper, M.; et al. Efficient Workflows for Detecting Li Depositions in Lithium-Ion Batteries. J. Electrochem. Soc. 2024, 171, 070526. [Google Scholar] [CrossRef]
  37. Otto, S.-K.; Moryson, Y.; Krauskopf, T.; Peppler, K.; Sann, J.; Janek, J.; Henss, A. In-Depth Characterization of Lithium-Metal Surfaces with XPS and ToF-SIMS: Toward Better Understanding of the Passivation Layer. Chem. Mater. 2021, 33, 859–867. [Google Scholar] [CrossRef]
Figure 1. (a) Schematic of a water-cooled stack of five Li-ion cells connected in parallel (reused with permission from The Electrochemical Society [24]); (b) A photo of an experimental stack.
Batteries 10 00274 g001
Figure 2. Representative test protocol and temperature profiles during cycle 10. (a) Stack voltage and current; (b) Variation in local temperatures; (c) Temperature distribution during CC charging; (d) Temperature distribution during discharging (reused with permission from The Electrochemical Society [24]).
Batteries 10 00274 g002
Figure 3. (a) Variation in cell voltage during C/30 charging and C/30 discharging as well as the estimated OCV; (b) Estimated entropic coefficient at different SOC levels.
Batteries 10 00274 g003
Figure 4. (a) Capacity retention of the stack during regular cycling (data for cycles 1101 to 1200 were missing due to a data acquisition malfunction; the abnormal higher capacity between cycles 1301 and 1400 was due to insufficient cooling; the data between cycle 1 and 1000 were reused with permission from The Electrochemical Society [24]); (b) Capacity retention of the stack during RPT; (c) Variation in BOD resistance with cycle number; (d) Variation in EOD resistance with cycle number.
Batteries 10 00274 g004
Figure 5. (a) Details of the capacity retention from cycles 1590 to 1600. (b) Details of the capacity retention before and after RPT.
Batteries 10 00274 g005
Figure 6. Current of each cell during discharge in (a) cycle 10 and (b) cycle 1600. The current was normalized by dividing individual cell current by the average current of the cells in the stack (6 A).
Batteries 10 00274 g006
Figure 7. Temperature distribution at the end of discharge in different cycles.
Batteries 10 00274 g007
Figure 8. Results of individual cell testing (a) with different charging C-rates, (b) with different rest times after RPT, and (c) with different SOCs after RPT.
Batteries 10 00274 g008
Figure 9. Capacity retention of cells with extended rest but without RPT after 1700 and 1800 cycles.
Batteries 10 00274 g009
Figure 10. Comparison of the cathode layer of a fresh cell, cell 3, cell 4, and cell 5. Each cell has 14 cathode layers. There was no obvious difference among the different cathode layers in a cell.
Batteries 10 00274 g010
Figure 11. Front side (top row) and back side (bottom row) of anode layers from a fresh cell, cell 3, cell 4, and cell 5. Each cell has 15 anode layers. For cells 3, 4, and 5, the front side faces the top of the stack, and the back side faces the bottom of the stack in Figure 1a. The yellow squares indicate regions for SEM or EDS analysis.
Batteries 10 00274 g011
Figure 12. SEM images of the front side of the cathode from a fresh cell, cell 3, and cell 5 at 2000× magnification.
Batteries 10 00274 g012
Figure 13. SEM images of the front side of the anode in areas without deposition from a fresh cell, cell 3, and cell 5 at 500×, 2000×, and 5000× magnification.
Batteries 10 00274 g013
Figure 14. SEM images of the front side of the anode near the top edge of cell 3 and cell 5 at 250×, 500×, and 2000× magnification.
Batteries 10 00274 g014
Figure 15. EDS images of deposition in the lower middle region of layer 2 in cell 5.
Batteries 10 00274 g015
Disclaimer/Publisher’s Note: The statements, opinions and data contained in all publications are solely those of the individual author(s) and contributor(s) and not of MDPI and/or the editor(s). MDPI and/or the editor(s) disclaim responsibility for any injury to people or property resulting from any ideas, methods, instructions or products referred to in the content.

