Article

Life Cycle Assessment and Costing of Large-Scale Battery Energy Storage Integration in Lombok’s Power Grid

Center for Industrial Electronics, University of Southern Denmark, 6400 Sønderborg, Denmark
*
Author to whom correspondence should be addressed.
Batteries 2024, 10(8), 295; https://doi.org/10.3390/batteries10080295
Submission received: 29 April 2024 / Revised: 13 August 2024 / Accepted: 20 August 2024 / Published: 22 August 2024
(This article belongs to the Section Battery Performance, Ageing, Reliability and Safety)

Abstract

:
One of the main challenges of Lombok Island, Indonesia, is the significant disparity between peak load and base load, reaching 100 MW during peak hours, which is substantial considering the island’s specific energy dynamics. Battery energy storage systems provide power during peak times, alleviating grid stress and reducing the necessity for grid upgrades. By 2030, one of the proposed capacity development scenarios on the island involves deploying large-scale lithium-ion batteries to better manage the integration of solar generation. This paper focuses on the life cycle assessment and life cycle costing of a lithium iron phosphate large-scale battery energy storage system in Lombok to evaluate the environmental and economic impacts of this battery development scenario. This analysis considers a cradle-to-grave model and defines 10 environmental and 4 economic midpoint indicators to assess the impact of battery energy storage system integration with Lombok’s grid across manufacturing, operation, and recycling processes. From a life cycle assessment perspective, the operation subsystem contributes most significantly to global warming, while battery manufacturing is responsible for acidification, photochemical ozone formation, human toxicity, and impacts on marine and terrestrial ecosystems. Recycling processes notably affect freshwater due to their release of 4.69 × 10⁻⁴ kg of lithium. The life cycle costing results indicate that over 85% of total costs are associated with annualized capital costs at a 5% discount rate. The levelized cost of lithium iron phosphate batteries for Lombok is approximately 0.0066, demonstrating that lithium-ion batteries are an economically viable option for Lombok’s 2030 capacity development scenario. A sensitivity analysis of input data and electricity price fluctuations confirms the reliability of our results within a 20% margin of error. Moreover, increasing electricity prices for battery energy storage systems in Lombok can reduce the payback period to 3.5 years.

Graphical Abstract

1. Introduction

Lombok is one of the southern islands of Indonesia with a total land area of 4725 km2 and a population of 3.7 million; it is not connected to the national electricity grid [1]. Lombok faces a critical challenge in terms of peak demand–supply. Figure 1 shows the average daily load curve by 2020 [2]. As can be seen, the gap between the peak load and the base load reaches 100 MW during peak hours. In Lombok’s context, a 100 MW gap between peak and base load is substantial because it indicates a sharp increase in demand during peak times. Lombok’s power grid, being relatively small and isolated, may struggle to meet this surge in demand without adequate infrastructure. This can lead to grid instability, the need for expensive upgrades, or even blackouts. The integration of battery energy storage systems (BESSs) is, therefore, critical, as these systems can help balance the grid by storing excess power during low-demand periods and discharging it during peak demand, ensuring a more stable and reliable power supply.
In line with the zero-carbon strategies of the Indonesian government, it is expected that the share of the installed capacity of renewable resources, especially solar, in Lombok will reach 443 MW by 2030. Since renewable energy technologies are generally uncertain and quite investment-heavy, it seems that energy storage systems as an energy buffer can help integrate renewable resources as much as possible while shifting load from peak times.
The total suggested storage capacity in the form of a lithium-ion battery energy storage system (BESS) in the Lombok energy outlook scenario by 2030 is 192 MWh (48 MW, with a 4 h storage capacity), equivalent to about 10% of the solar capacity [2].
Along with all the advantages of storage systems, it should be noted that the battery is an electrochemical product that has significant effects on the environment during its manufacturing, operation, and recycling life [3,4]. On the other hand, the high cost of battery raw materials such as lithium, cathodes, power electronic equipment, and battery management systems can affect their development in the network. Therefore, an economic and environmental analysis of BESSs during the life cycle is necessary.
Life cycle assessment (LCA) is an innovative method to examine environmental consequences, measure advantages against downsides, and help decision-makers in choosing the most environmentally friendly options. It covers the energy, input material flows, emissions, etc., over the entire lifetime of a product. The environmental impact of batteries is studied in the literature [5,6]. In [7], a comparative LCA of lead–acid and lithium-ion batteries for grid integration applications was conducted. Results showed that the lithium iron phosphate battery is the top performance, with a 94% reduced effect in the mineral and metal resource consumption category. The LCA is used by [8] to evaluate the environmental impacts of batteries in electric vehicles (EVs). The purpose of this review’s research is to highlight the essential impacts of batteries on the environment. The LCA of different types of batteries in EVs for current and future EV penetration scenarios in 10 countries was studied by [9]. The cradle-to-grave model is developed to consider all environmental impacts of batteries during their life span without considering financial aspects. The results of that paper indicate that batteries in Norway have the lowest environmental impact according to the 2030 electricity mix scenario. In [10], the LCA is developed to assess the lithium-ion battery recycling process. The paper suggests pyrometallurgical technologies for battery recycling. However, the study did not consider the production and manufacturing phases and the environmental impacts during the recycling and could not prove the total advantages and disadvantages of lithium-ion batteries. In a similar study [11], both hydrometallurgical and pyrometallurgical technologies are used in lithium-ion battery recycling. The proposed LCA is more focused on sodium-ion batteries. The LCA of small-scale battery storage for residential utilization was studied in [12]. That paper reveals that the inverter and battery management system (BMS) contribute to more than 40% of total global warming. The LCA of battery operation and battery materials was evaluated in [13]. That paper mentioned that while batteries play a critical role in the decarbonization of energy systems, they have significant environmental impacts during production. The paper does not consider midpoint or endpoint indicators to indicate the global warming potential of the batteries. The lifespan perspective on the LCA of lithium-ion batteries for EV application was developed in [14]. While the cradle-to-cradle model is constructed to extend the LCA, this paper only considered the producing and recycling phases for carbon emission analysis. It should be noted that this research showed that carbon emissions can be extremely reduced under renewable energy utilization during battery manufacturing. In [15], an LCA of lithium-ion and vanadium redox flow batteries for renewable energy integration was investigated. That paper studied different scenarios to analyze the environmental impacts of batteries incorporated with wind and photovoltaic resources. Its results showed that the vanadium redox flow battery has lower environmental impacts. The comparative LCA model for four types of batteries, including lithium-ion, sodium–sulfur, vanadium redox flow, and lead–acid batteries, using 17 midpoint impact categories, was presented in [16]. Based on its presented results, the lithium-ion battery has lower environmental impacts for stationary grid applications. In [17], a social and environmental analysis of lithium-ion and vanadium redox flow batteries was conducted. The paper presents that depending on the application of each type of battery, the social and environmental advantages/disadvantages will be different. Also, the cost flow analysis during the lifespan should not be neglected in the sustainability assessment of BESSs.
Life cycle costing (LCC) includes all costs associated with the product’s life cycle [18]. These include all costs involved in investment, operation, replacement, maintenance, recycling, etc. In the case of grid-connected BESSs, investment costs, total annualized costs, levelized costs, and payback indicators can encapsulate all costs during the lifespan [19].
The comparative LCC analysis on large-scale BESSs to mitigate the fluctuation of renewable energy in the grid was proposed in [20]. The LCC analysis on multiple energy storage technologies, including compressed air energy storage, battery, and pumped-hydro storage was investigated in [21]. The LCC analysis of energy storage for offering flexibility services in the electricity market in the case of building-scale applications was investigated in [22]. This paper stated that EV batteries can be an appropriate strategy for providing economic benefits in building-scale applications. The LCC and CO2 footprint analysis of BESSs for stationary grid operation was investigated in [23]. The results of that paper without the presentation of unique financial indicators showed that lithium-ion batteries have a suitable performance compared to lead–acid batteries in terms of total cost and CO2 emissions. The paper only considered the levelized cost index to evaluate the LCC and results revealed that the pumped-hydro storage is the least costly and most reliable option. In [24], an LCC analysis for distributed BESSs in the power grid was presented. The paper minimized the fabricating cost, as well as energy loss in the BESS planning integrated with renewable energy. In other words, the LCC is just implemented in terms of investment cost, and no indicator is defined for it. In [25], an LCC and LCA for the optimal sizing of integrated energy storage, solar farm, and cold ironing systems were presented in a real case study in Italy. This paper suggested a 5750 kWh energy storage in terms of battery, which results in an 87% CO2 reduction and 32% investment cost reduction. In [26], an LCC analysis for BESS sizing in the power grid, considering renewable energy integration was conducted. The paper involved all production, operation, and disposal costs during the LCC analysis considering the levelized cost. The LCC analysis of lithium oxide batteries for industrial applications was developed in [27]. The paper showed that the charging scheme can completely influence the cost of batteries during the operation phase. In the case of EVs, and fuel-cell EVs, the LCC and CO2 footprint analysis was developed in [28]. The paper involved the traffic management problem in batteries for EVs and claimed that traffic policies can be an option to reduce the cost of batteries during their lifespan. In [29], an LCC of vanadium redox flow batteries was conducted considering maintenance strategy and cell design. The paper revealed that with a discount rate of 8%, the levelized cost of the battery was reduced to 0.3 EUR/kWh. In [30], an in-depth LCC analysis of lithium-ion batteries integrated with diesel-based electric railways was conducted. The paper proposed a scenario-based optimization approach to optimize diesel and battery sizing. The results of the paper showed that, under the proposed optimization framework, the total operation cost was reduced by up to 13%, considering the coordinated charging/discharging scheme for BESSs. An LCC analysis for lithium-ion and lead–acid grid-connected BESSs in islanded microgrid applications was developed in [31]. The paper only focused on the operation costs of BESSs and showed that the additional equipment, including BMSs, converters, etc., contributed to 42% of the total cost. An integrated LCC and CO2 footprint of a coordinated BESS–wind–PV and diesel generator in the case of a remote building application was presented in [32]. The paper investigated a tri-objective framework to minimize CO2 emissions, the LCC of the operation phase, and dump energy simultaneously. However, the cradle-to-grave model for batteries in the model is not addressed by that research. A techno/economic and LCC assessment of battery energy storage was studied in [33]. The paper just considered the annualized and levelized costs of energy storage in the model for short- and long-term models.
Considering the economic and environmental aspects of lithium-ion batteries simultaneously during their lifetime can influence installed capacity development strategies. Although each of these aspects has been examined separately in the literature review, it is necessary to address the economic and environmental impacts of BESSs under an LCA and LCC analysis based on a cradle-to-grave model by defining appropriate indicators for both aspects. In the case of Lombok Island, due to the urgent need to develop a grid-connected BESS for load shifting and help integrate solar resources under the 2030 energy mix strategy, the lack of LCA and LCC studies is more and more apparent. Hence, this paper focuses on an LCA and an LCC analysis of grid-connected LFP batteries on Lombok Island. Under the 2030 energy mix strategy on this island, a 483 MWh BESS will be installed. This paper involves the manufacturing, operation, and recycling phases in LCA and LCC using 10 environmental global warming potential (GWP) indicators, photochemical ozone creation potential (POCP), acidification potential (AP), eutrophication potential (EP), abiotic resources depletion potential (ADP), ozone layer depletion potential (ODP), human toxicity potential (HTP), terrestrial ecotoxicity potential (TETP), freshwater aquatic ecotoxicity potential (FAETP), and marine aquatic ecotoxicity potential (MAETP)) and 4 economic indicators (capital cost, total annualized cost, levelized cost, and payback period). The cash flow and environmental impact of each process are addressed separately. Also, a sensitivity analysis of the electricity price as a key factor in BESS arbitrage to indicate its effects on financial indicators will be represented. The main contributions of this paper are summarized as follows:
  • The integration of LCA and LCC analysis using 10 impact indicators for a large-scale BESS in Lombok for the first time.
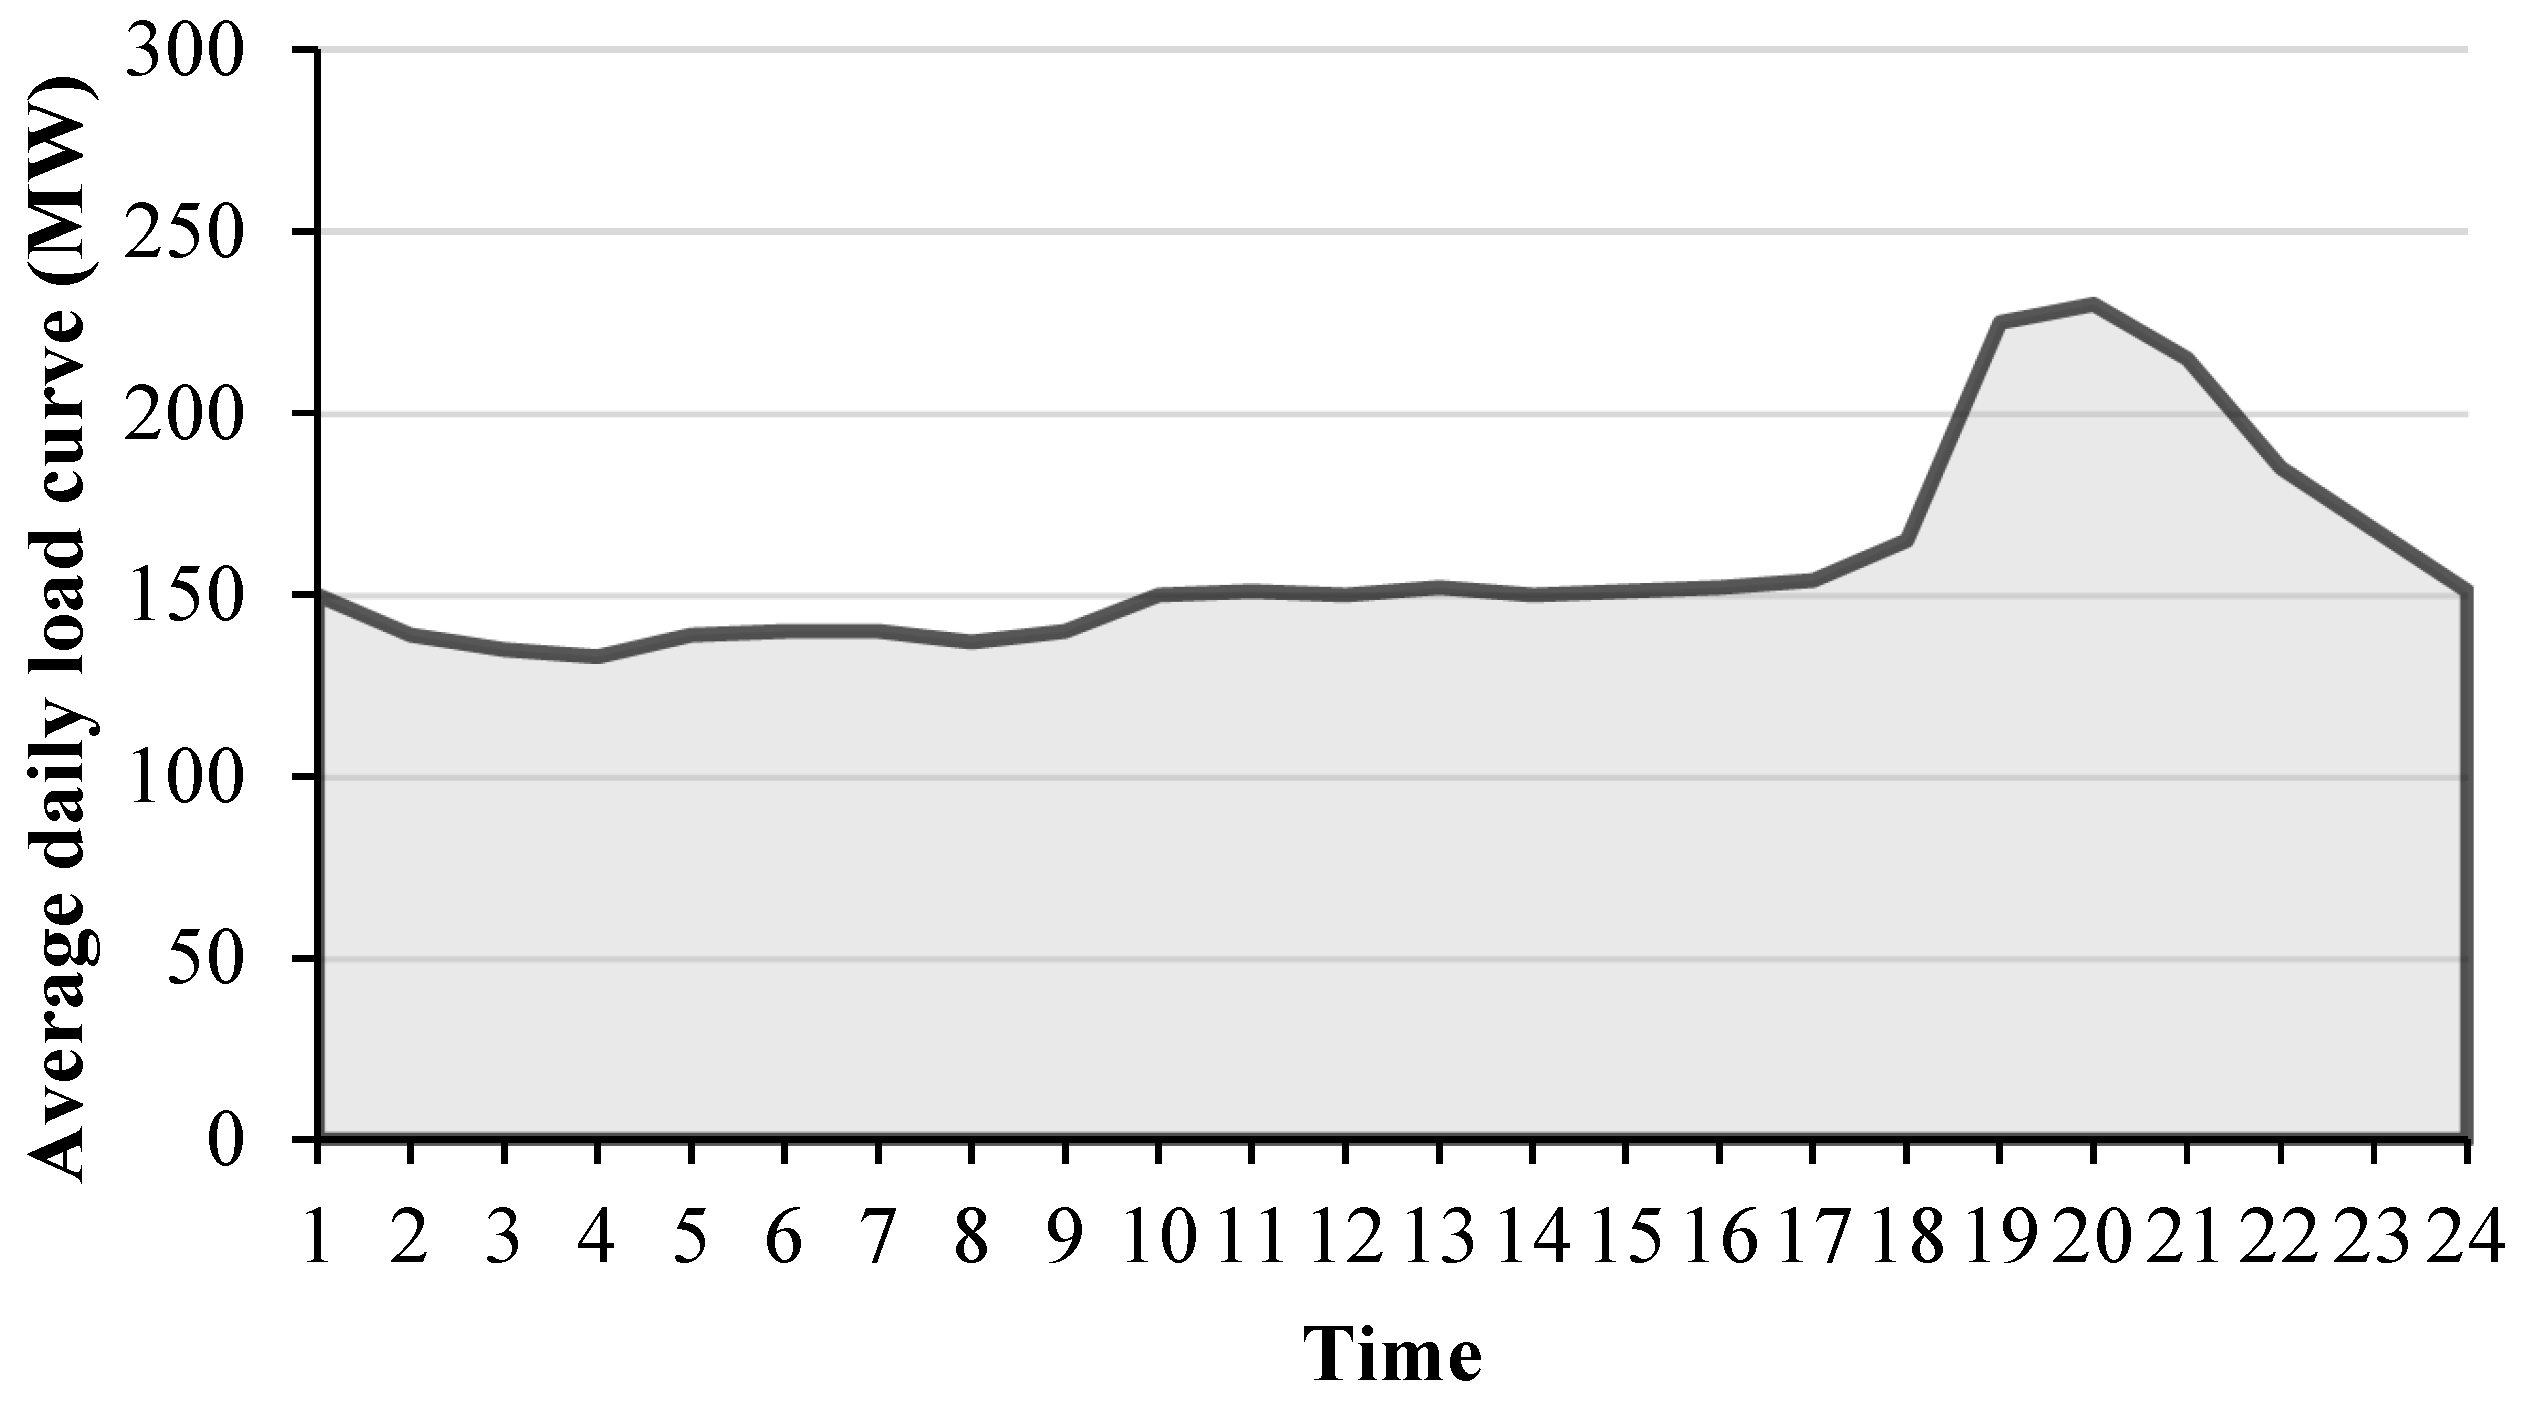
  • The analysis of the LFP-based BESS integration in the future energy mix of Lombok to overcome the peak load issues.
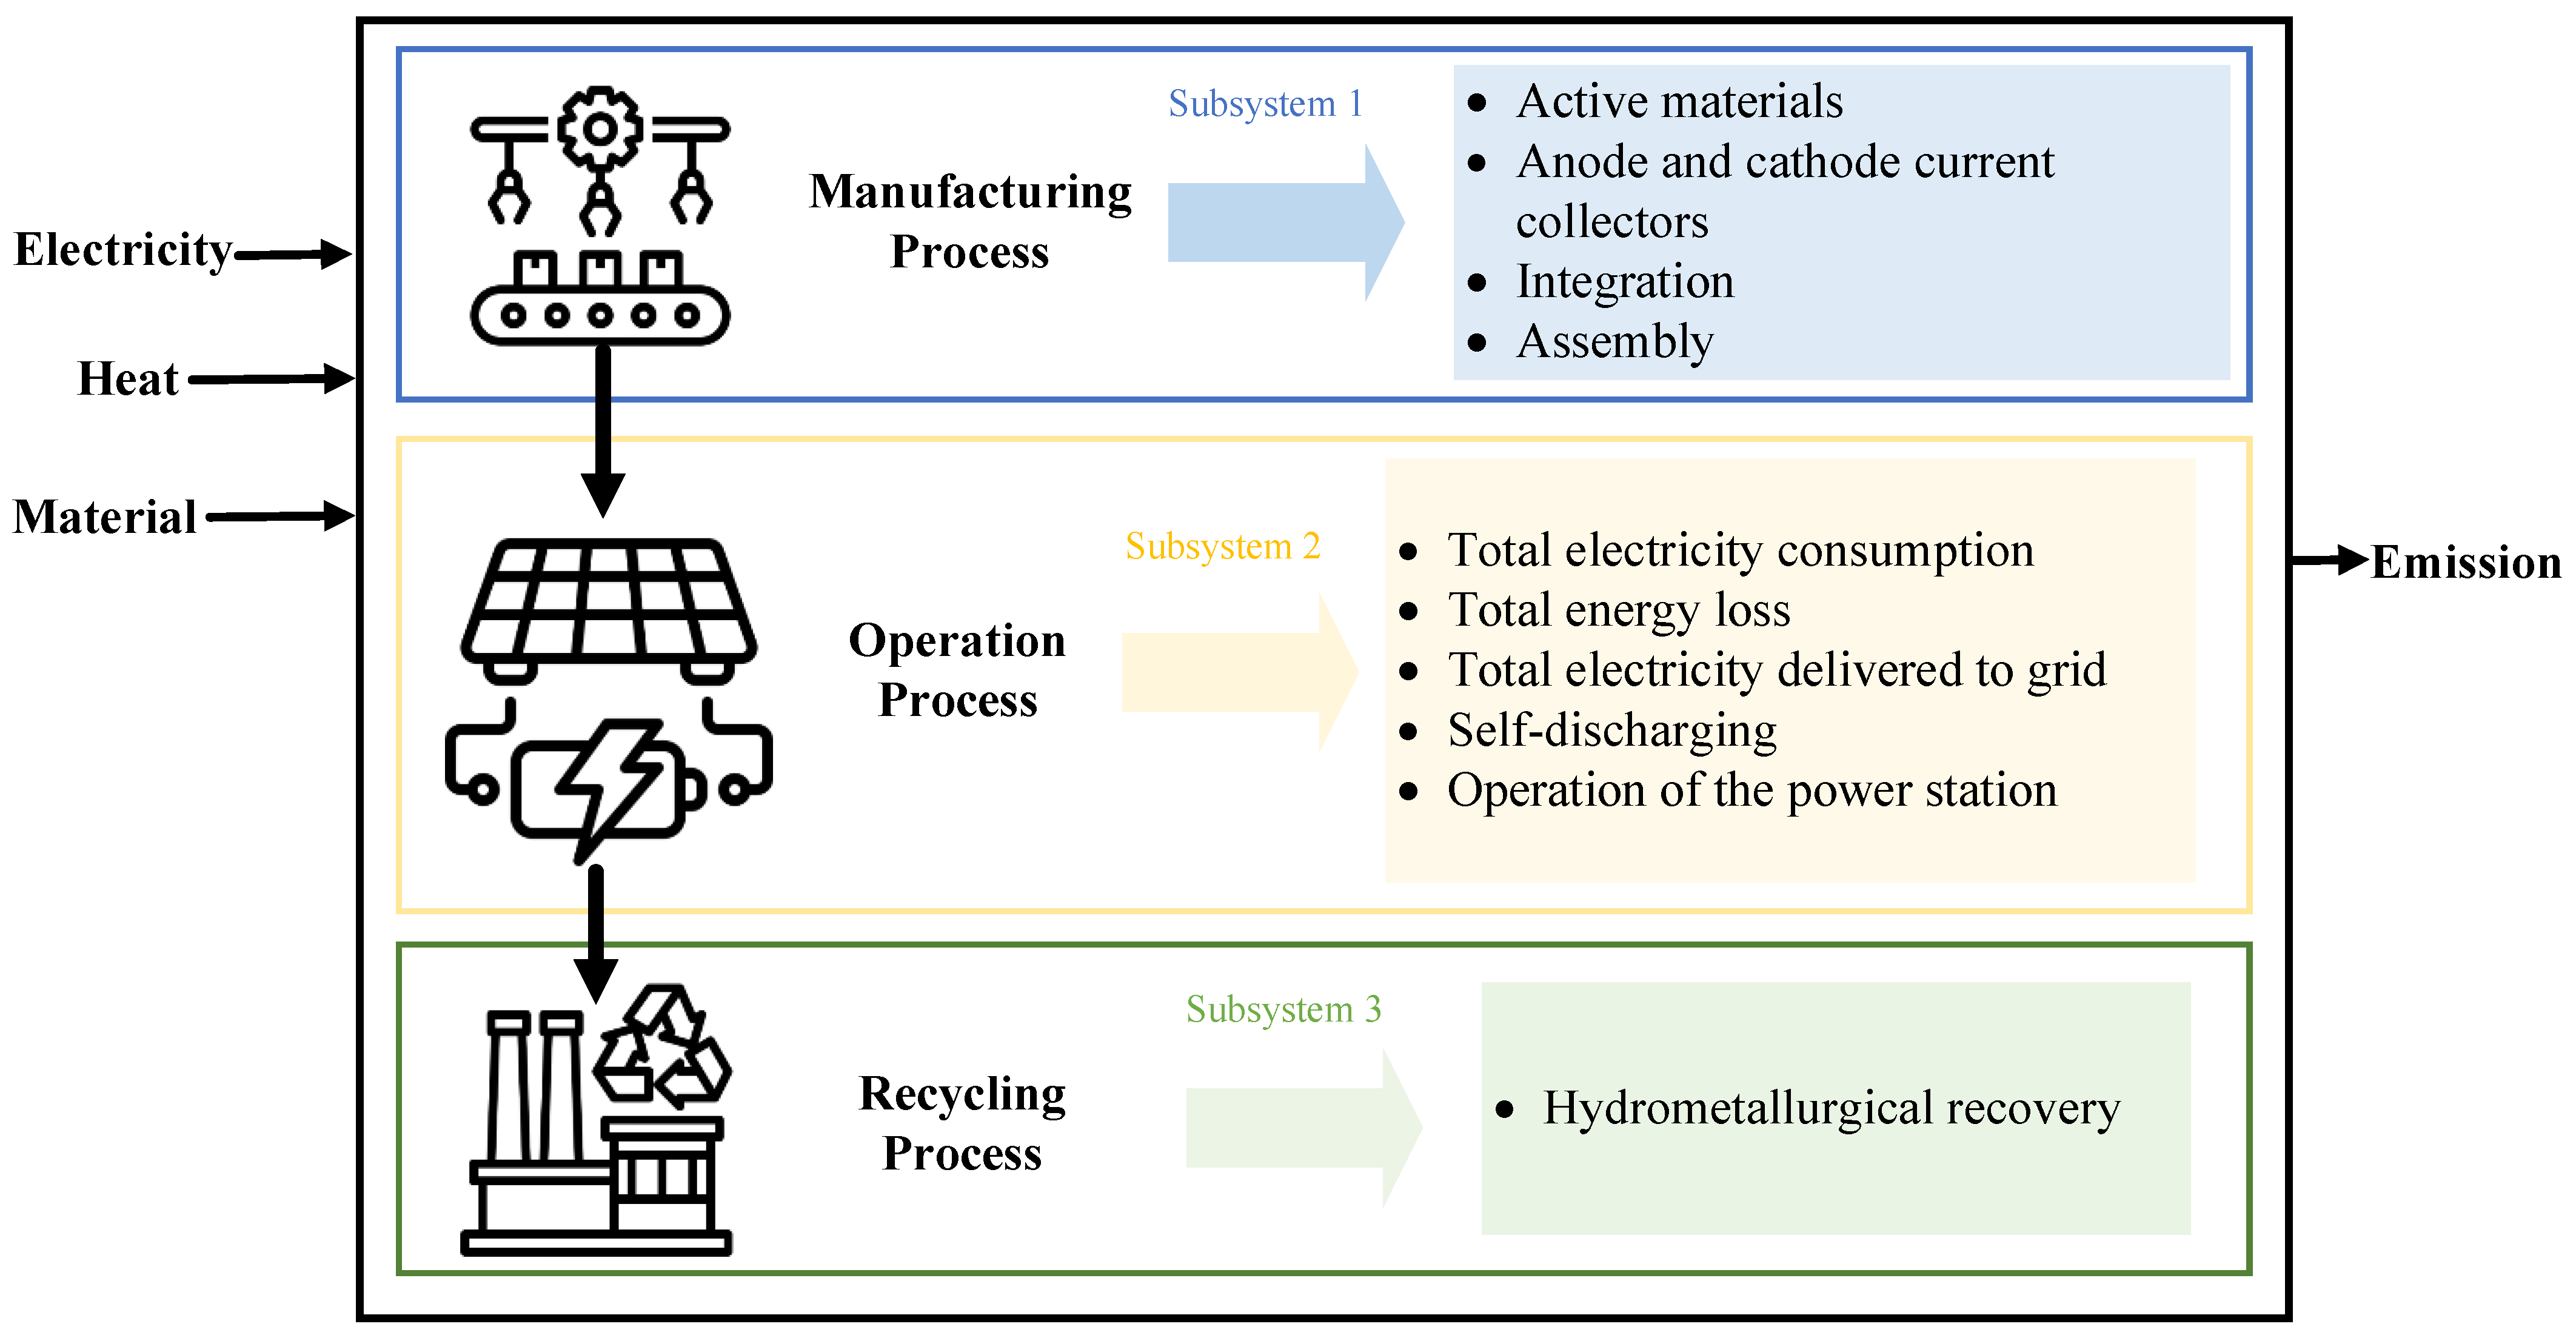
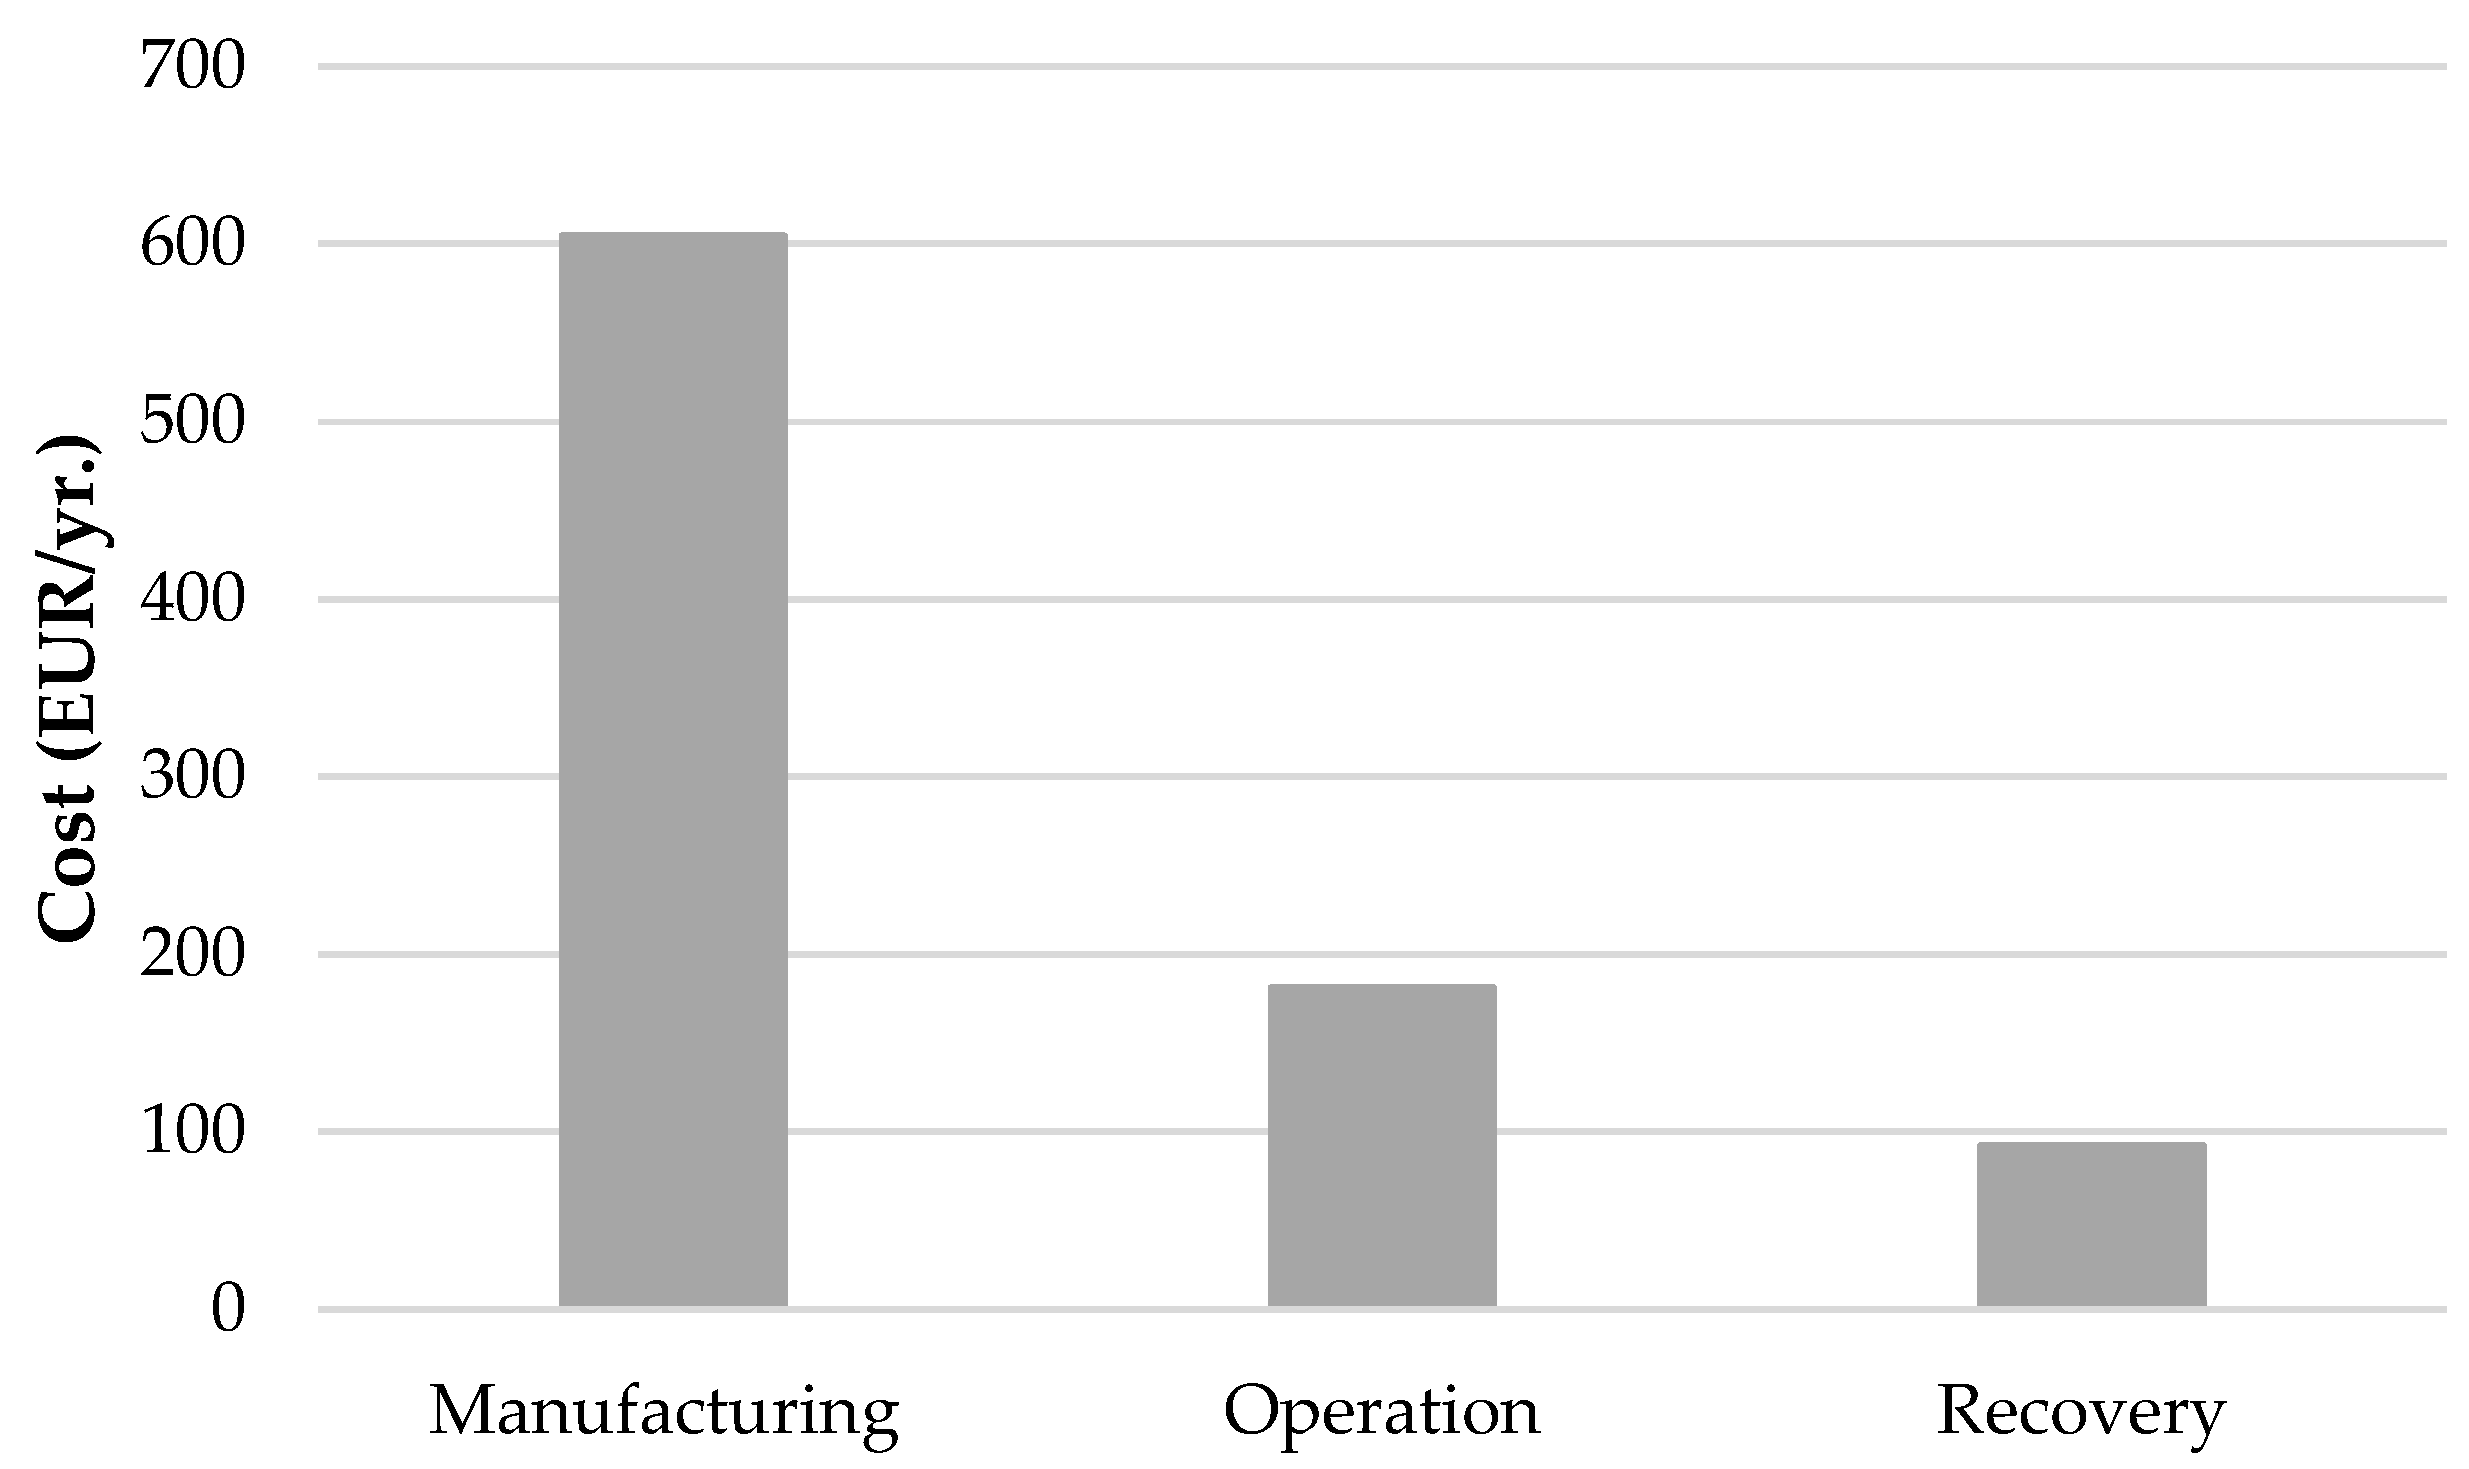
  • The cradle-to-grave analysis of the BESS life chain, including manufacturing, operation, and recycling, besides examining the environmental and financial effects of each step.
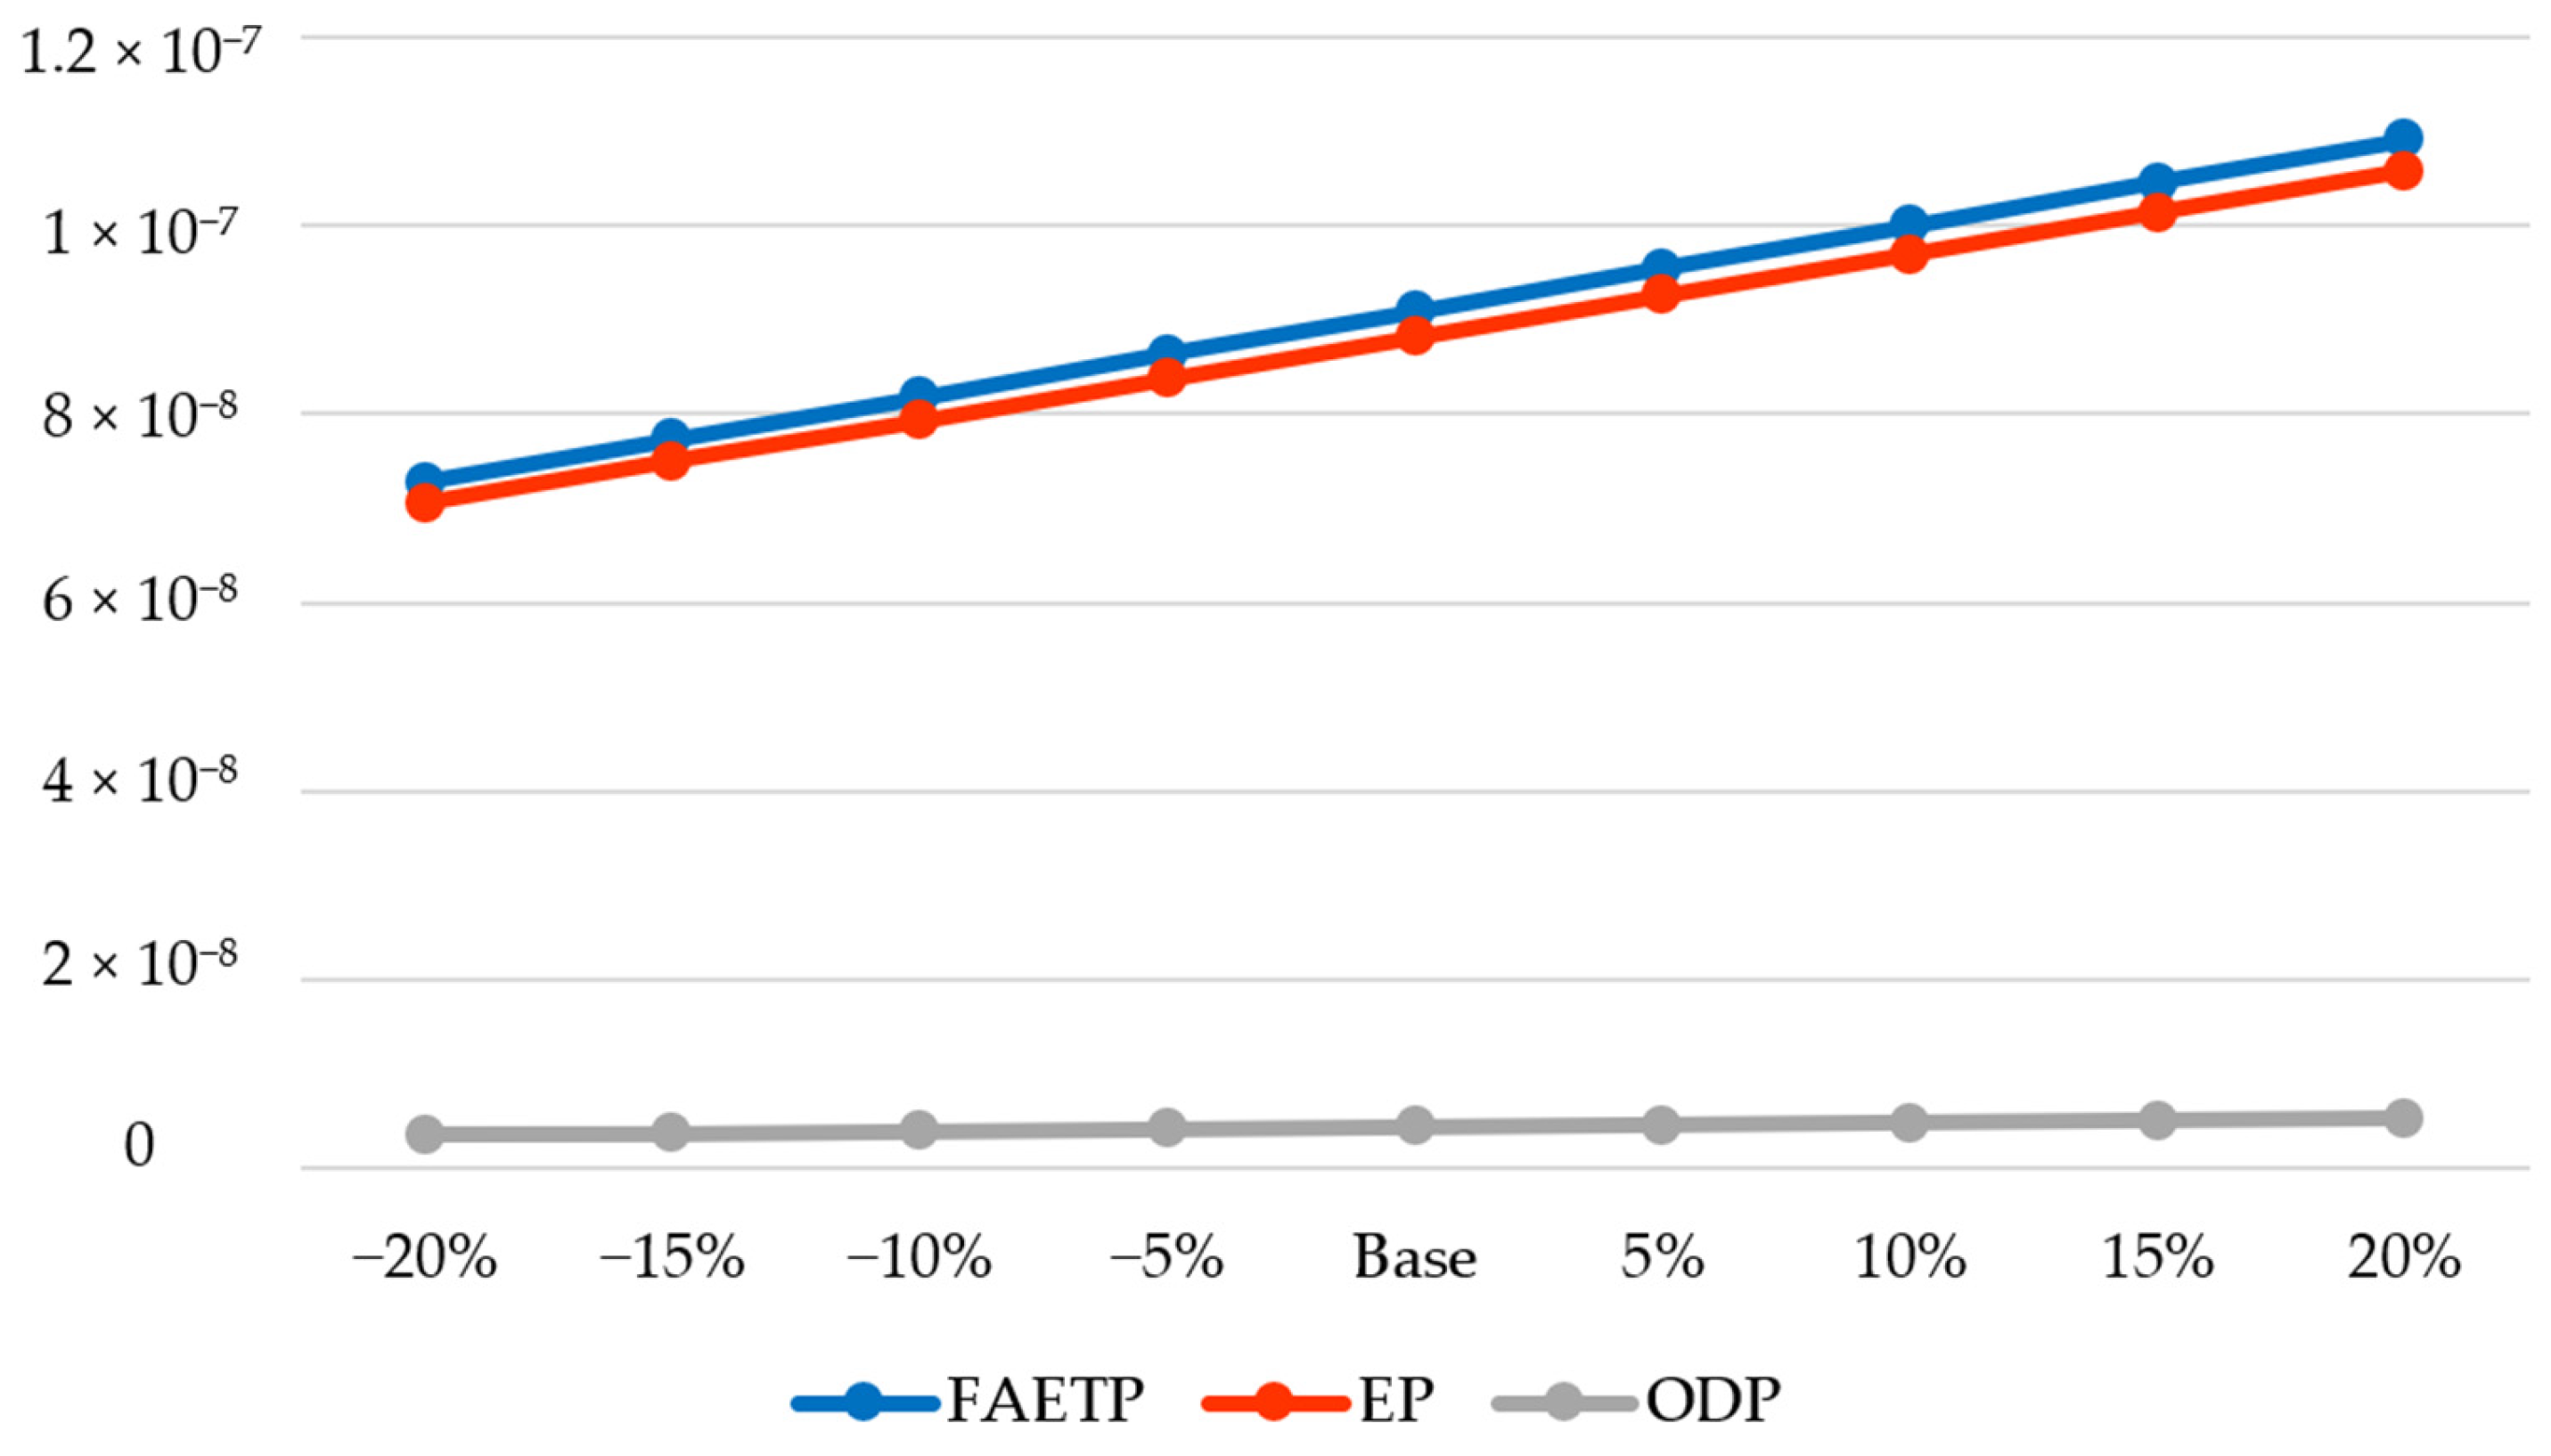
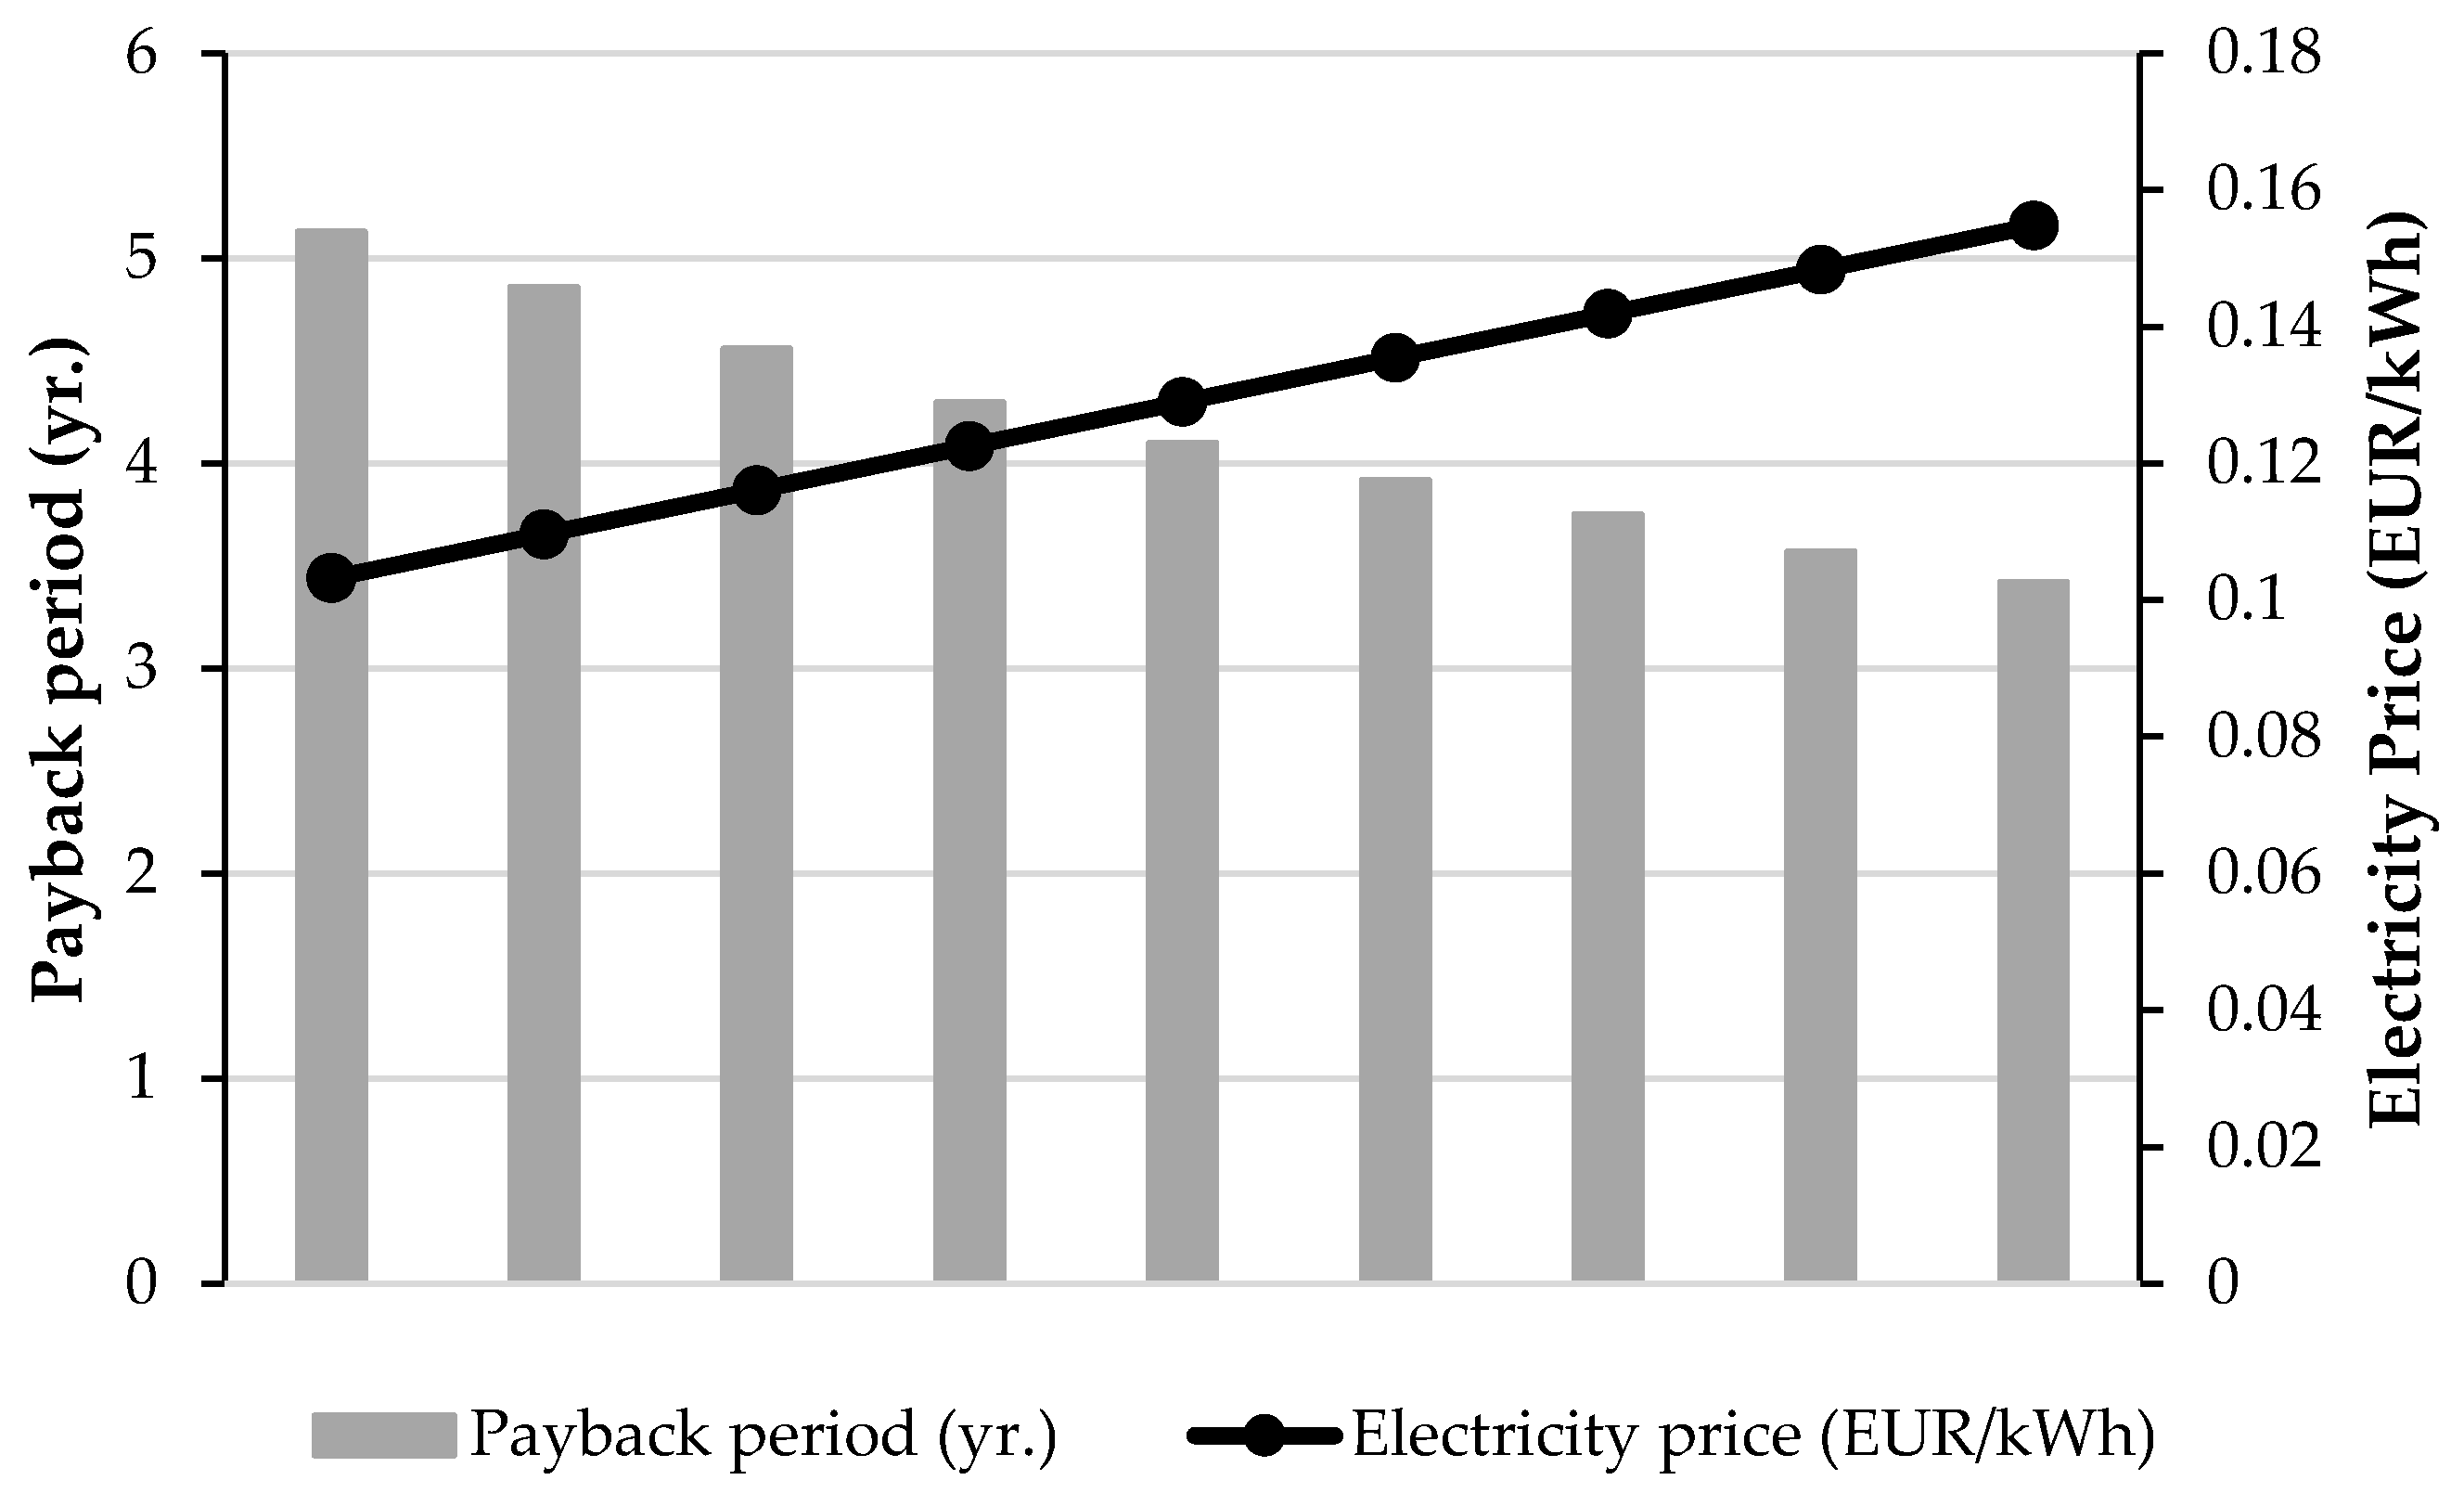
  • The provision of a sensitivity analysis of electricity price, as well as the uncertainty of input data on BESS, to investigate their effects on environmental and economic indicators that can influence the strategy of decision-makers.
The rest of this paper can be organized as follows: Section 2 provides the materials and method for LCA and LCC analysis, and the inventory for manufacturing, operation, and recycling processes is presented. In Section 3, the results of the LCA and LCC analysis are presented. Section 4 concludes the paper.

2. Materials and Methods
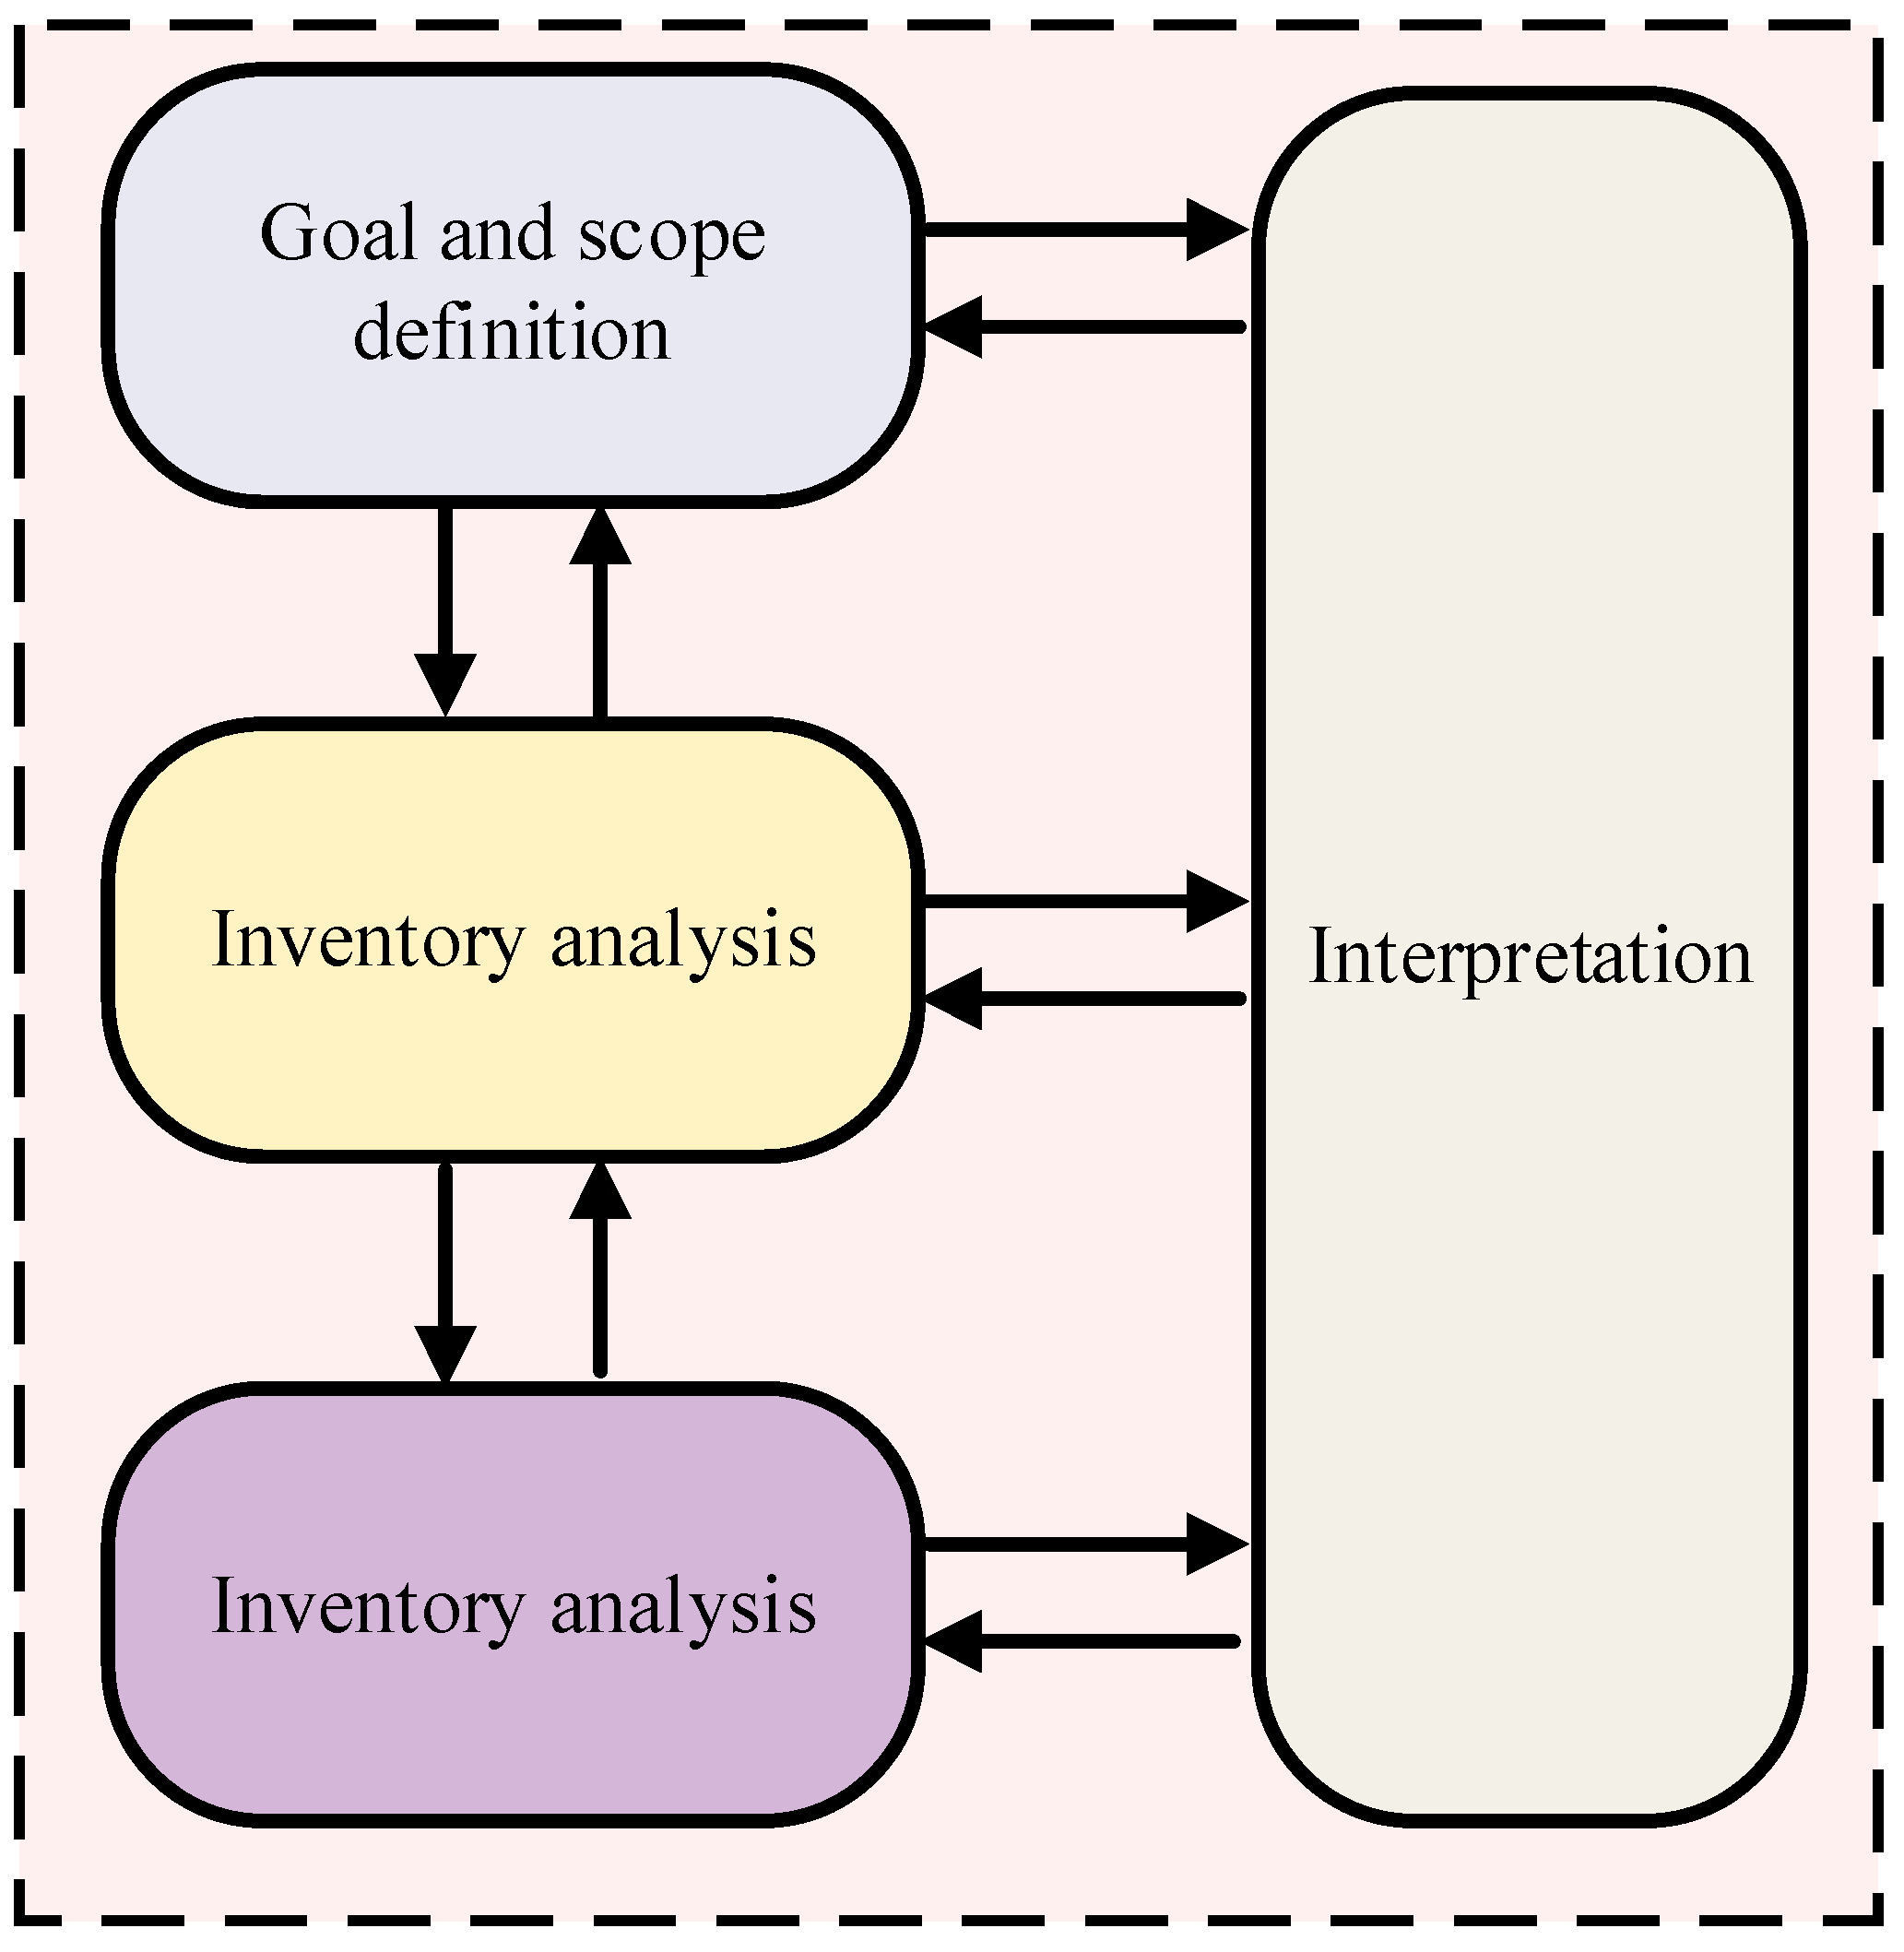
Thanks to the growing interest in renewable energy integration with a probabilistic nature, BESS units have assumed an important role in the power grids. BESSs are used for various purposes such as load shifting, increasing reliability, voltage support, reducing cost, minimizing power loss, etc. [34]. The mixture of a variety of metals and electrolytes in these types of batteries provides them with varied features that make them suitable for diverse situations. The lithium-ion battery is an electrochemical storage that uses a reversible intercalation process to store and transfer electrical energy [35,36]. This process involves the movement of Li+ ions between two different types of electrode materials that are kept apart by an electrolyte solution that conducts lithium ions. Lithium-ion batteries have a wider range of rated power and endurance and offer greater flexibility in terms of grid services. With unique features, lithium-ion BESSs are considered inseparable parts of the future energy mix strategy in Lombok by 2030. In this section, the concepts of LCA and LCC and their corresponding indicators are discussed. Also, the scope and goal of the model based on the 1 kWh capacity of the battery as a function unit are represented. It should be noted that the proposed LCA and LCC analysis are carried out on lithium iron phosphate (LiFePO4), which is abbreviated LFP. Figure 2 shows the overview of Lombok Island, as well as the location of integrated solar and large-scale BESSs in eastern Lombok.

2.1. LCA Concept

The LCA is a highly regarded technique that evaluates the environmental effects of a process, product, or service over its lifetime [37]. The ISO 14040/14044 standards provide the foundation for the LCA process as given in Figure 3 [38]. The goal/scope specification is the first step. The main action of this step is to define the function unit. In the case of a BESS, 1 kWh of stored electricity is considered a function unit. Next, an inventory list is gathered that describes the interactions that occur between the organizations that conduct the operations in the product’s life cycle and the outside world. The inventory data are allocated to environmental impact indicators in the ensuing life cycle impact assessment (LCIA). In this step, all input, output, and materials per function unit are classified and characterized based on the considered indicators using the CML-IA method. Also, the normalization phase can be used as an optional phase for the better analysis of results based on the standard normalization factor [39]. The CML-IA uses a collection of characterization parameters to measure environmental impacts across several categories, including human health, ecosystem quality, and resources. This approach assesses emissions and resource consumption across a product’s life cycle, allowing for the assessment of possible environmental impacts connected with its manufacture, use, and disposal stages. This technique helps identify hotspots and guide decision-making to environmentally friendly activities and product designs.
In the interpretation phase, all results from LCIA are extended. The most significant indicators and midpoint impacts are discussed more. Also, the sensitivity analysis will be conducted in this phase.

2.1.1. Goal and Scope

The goal of this study is to develop the LCA and LCC on 1 kWh of stored electricity in an LFP BESS integrated into Lombok’s power grid. To this end, battery production, operation, and recycling phases are considered. Figure 4 shows the scope of the study, including three subsystems for manufacturing, operation, and recycling. During the lifespan of the battery, all active materials, anode and cathode current collectors, containers, BMSs, converters, electricity, and heat for production are considered as the input. It should be noted that the input energy for battery production (which can be provided by a variety of sources) has a significant impact on the emissions, which should be considered in the LCA and LCC.

2.1.2. Life Cycle Inventory

The life cycle inventory technique phase consists of creating an inventory of a product system’s input and output flows. In other words, the life cycle inventory is an essential part of LCA, comprising the systematic gathering and measurement of the inputs, outputs, and environmental consequences associated with a product’s complete lifetime. Such flows include imports of water, energy, and raw materials, as well as outputs into the atmosphere, ground, and water. Considering the proposed goal and scope of the study, as well as 1 kWh of stored energy in the LFP battery as a function unit, the inventory analysis on all materials, inputs, outputs, and emissions is carried out. Table 1, Table 2 and Table 3 show the inventory list for three subsystems [41]. It should be noted that data from previous research, technical reports, and annual reports have been used to calculate input and output processes like energy, materials, and emissions. Also, this paper considers the hydrometallurgical recovery for LFP batteries [41] as given in Table 3.

2.1.3. Impact Assessment

In the third stage of the LCA process, known as LCIA, impact categories are created using the LCI data from the previous step. Determining and choosing the impact categories to characterize the emissions caused by the BESS energy-saving process was the first required step in the LCIA. As previously stated, the CML-IA baseline technique was used in this study to classify all inputs and outputs from the inventory into midpoint indicators. To this end, 10 indicators, including GWP, AP, EP, HTP, ODP, POCP, ADP, MAETP, FAETP, and TETP, are considered, which are described in Table 4 [41].
In addition to the economic details presented in the tables above, it is important to note that the charging/discharging efficiency of the BESS is assumed to be 80%. Furthermore, the self-discharge rate is estimated to range between 3 and 4% per month.
After the classification and characterization of data using the CML-IA baseline approach, the normalization step is carried out based on the World 2000 normalization factor [43]. It should be noted that the economic indicators are introduced in the next section.

2.1.4. Interpretation

In this phase, all results from LCIA are extended. The most significant indicators and midpoint impacts are discussed more. Also, the sensitivity analysis on the most important parameters like electricity price is conducted in this phase.

2.2. LCC Concept

The keeping of physical asset cost records throughout an asset’s life is known as LCC. This implies that choices about the purchase, use, or disposal of assets may be made in a way that maximizes asset utilization while minimizing costs to the entity. LCC is an approach to economic evaluation for all costs related to products, processes, and services throughout an entire lifetime [44]. Traditionally, it focuses primarily on expenses associated with investment, operation, maintenance, and disposal at the end of life. Under this methodology, all the facility costs gained throughout the processing period are evaluated.
All steps in LCA (goal, inventory, impact assessment, and interpretation) are carried out for LCC. As mentioned, four economic indicators, including capital cost, total annualized cost, levelized cost, and payback period, are calculated during the LFP lifespan. The capital cost shows the total investment and construction costs of the BESS. Total annual cost represents the annual capital cost, fuel cost, annual operation and maintenance costs, replacement cost, etc. The levelized cost of electricity shows the electricity unit cost. Also, the payback period is the most important indicator during energy strategy planning, which can determine the return on investment of battery construction, operation, and recycling. All formulations and descriptions related to economic indicators can be found in [45]. Table 5 shows the main financial input data for LCC analysis on an LFP-based BESS in Lombok.

3. Results and Discussion
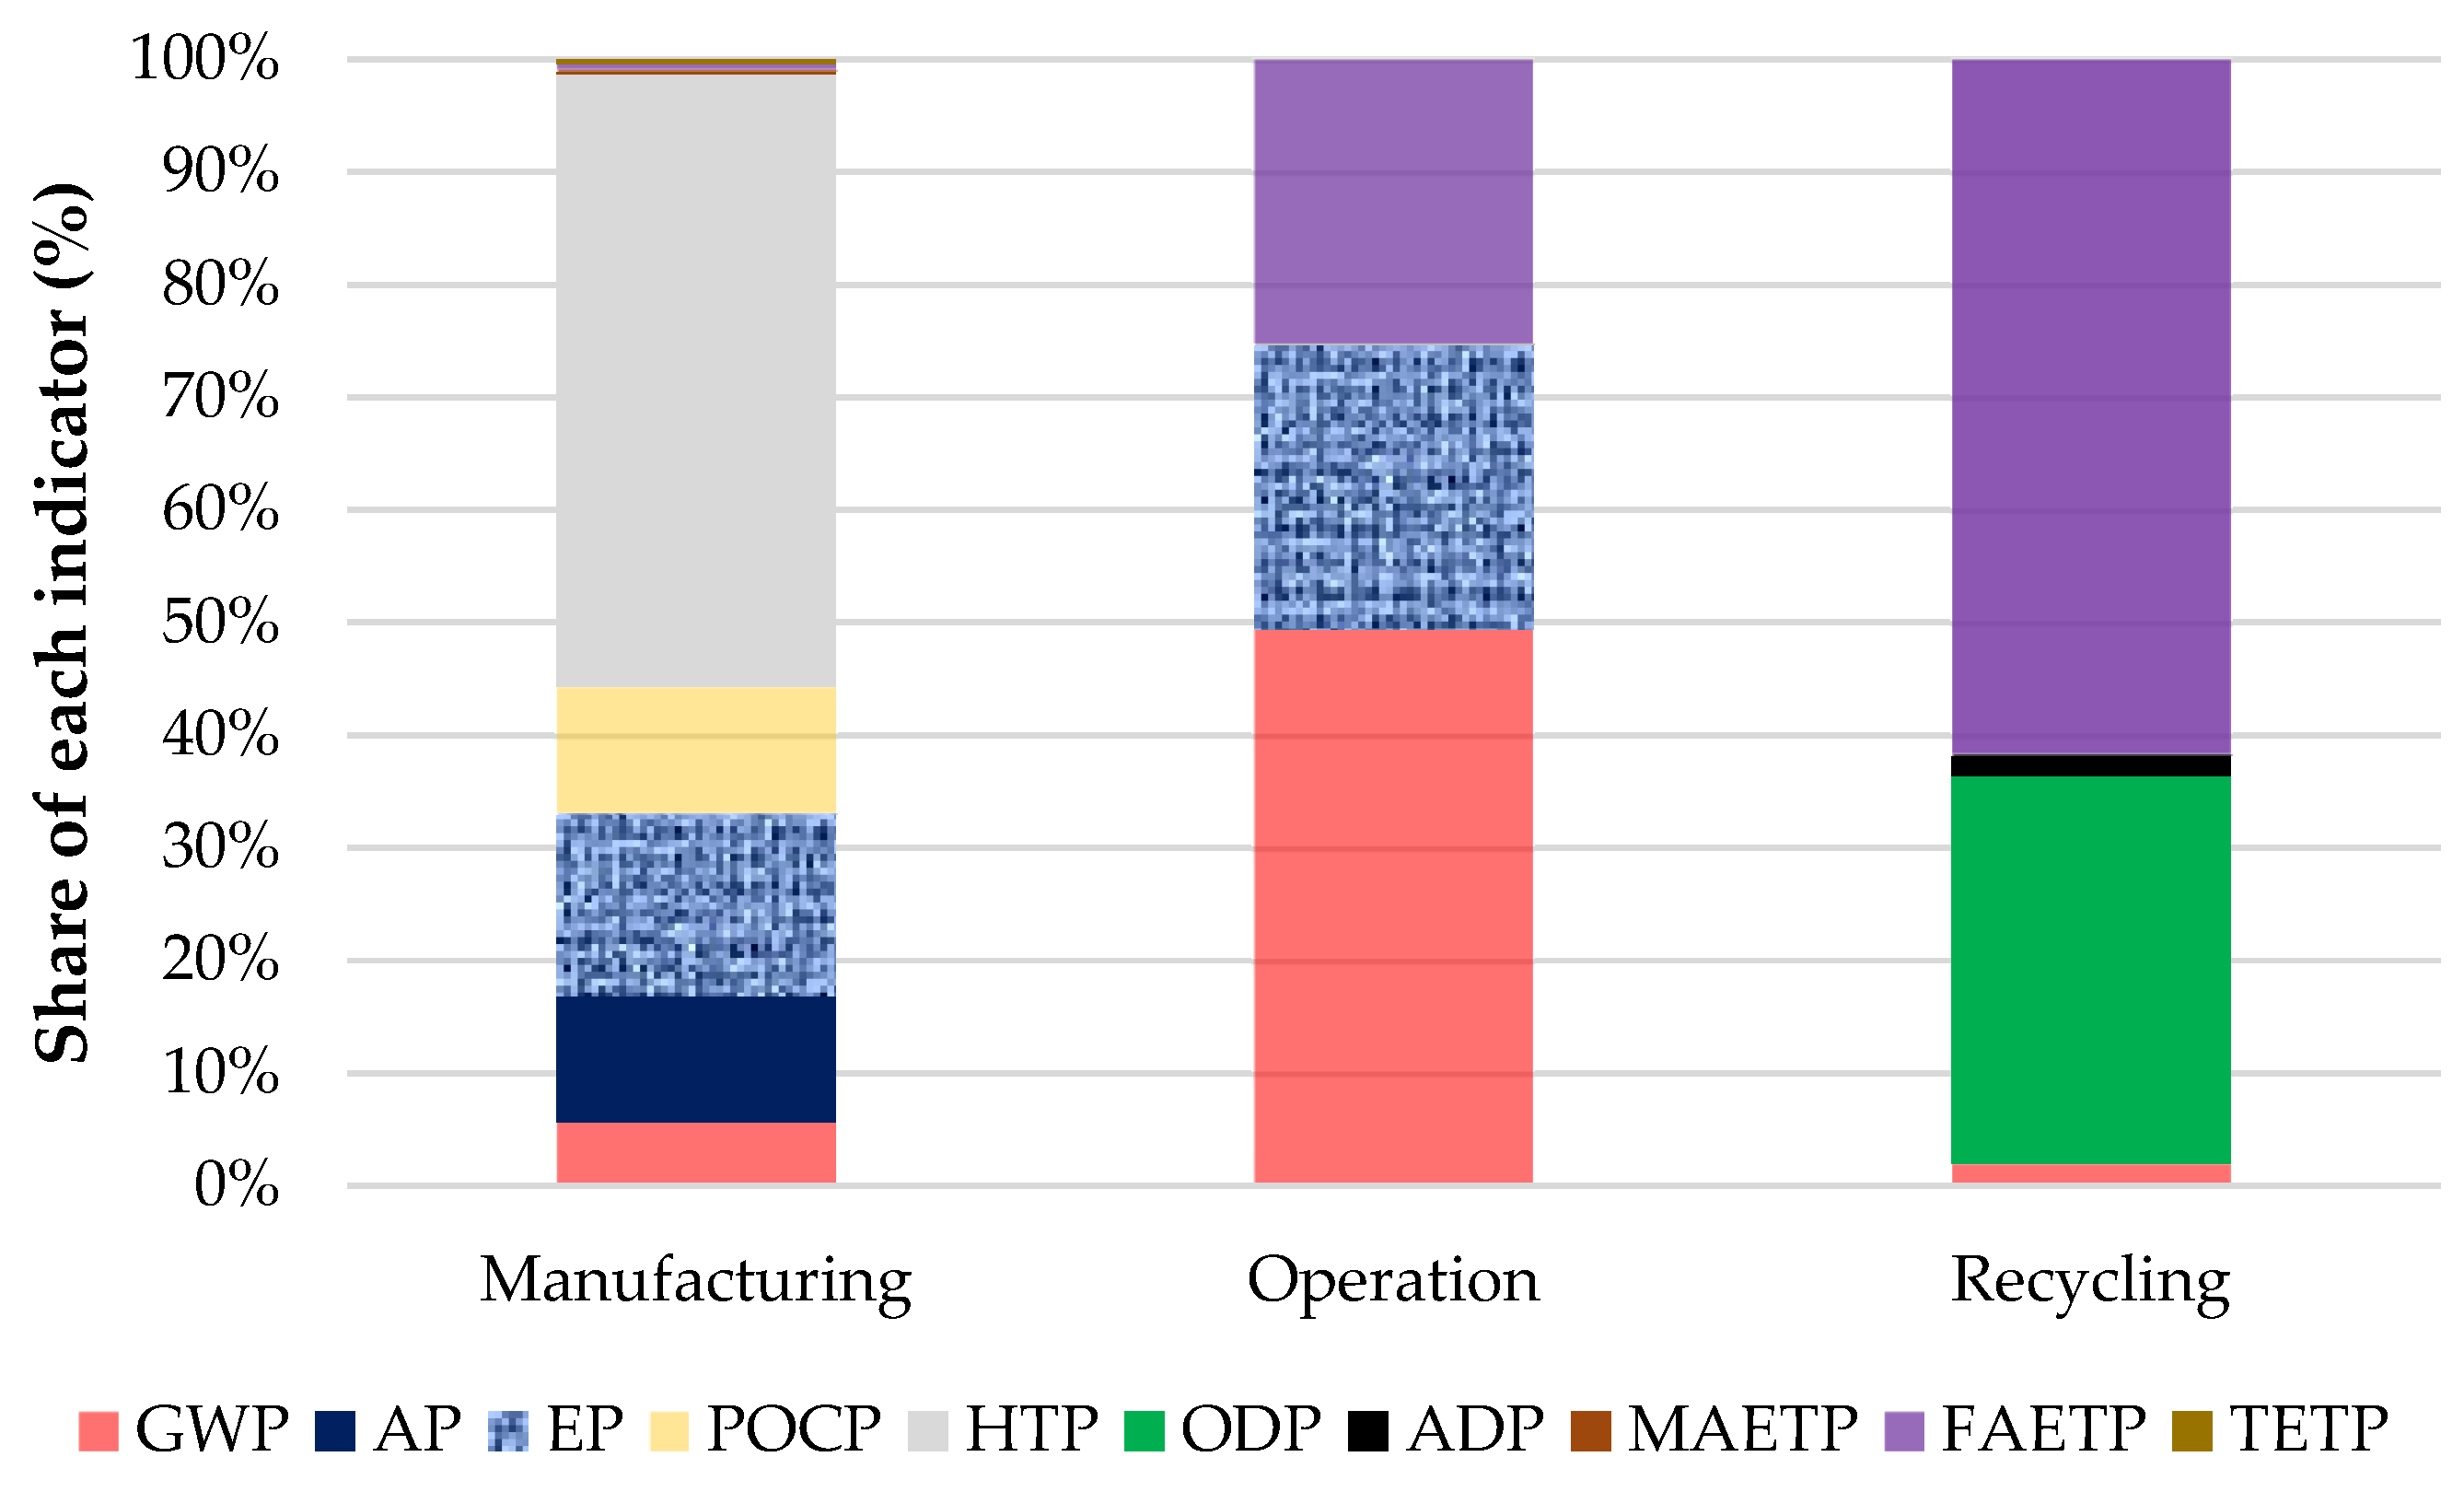
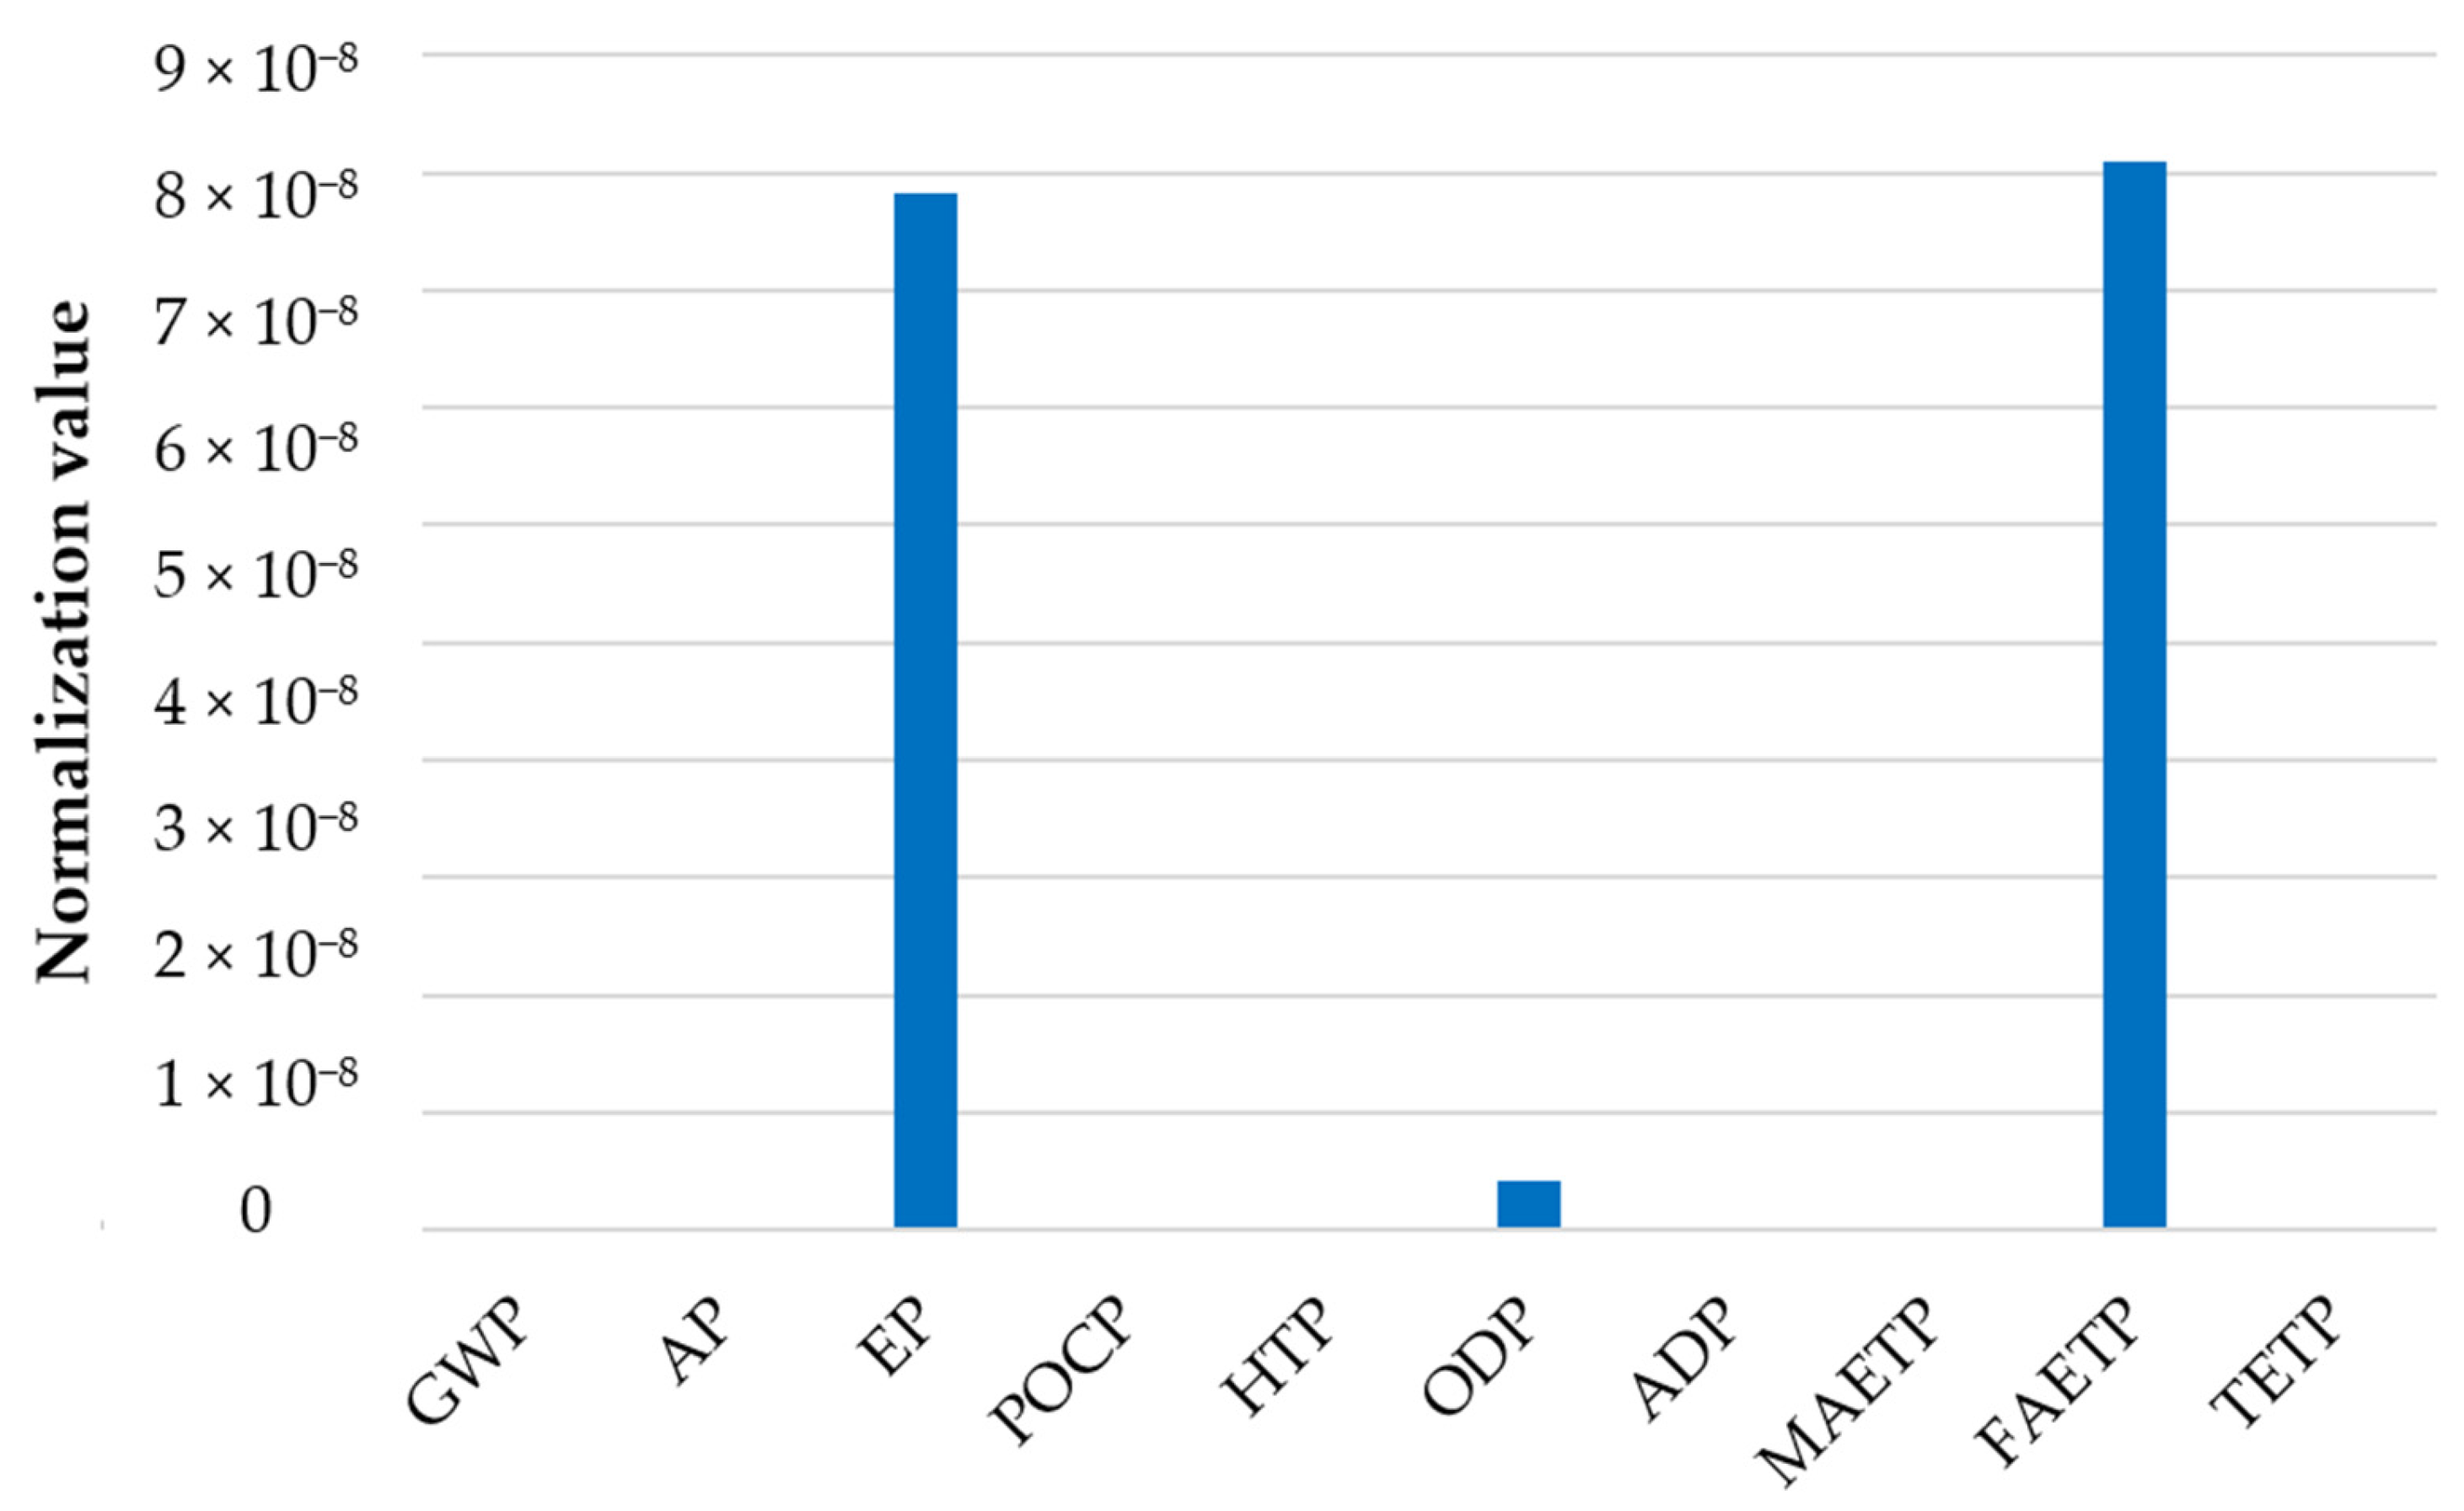
In this section, numerical results for the LCA and LCC of a BESS on Lombok Island are discussed. In addition to interpreting and analyzing these results, this section demonstrates the robustness of the input data through a comprehensive sensitivity analysis developed for both LCA and LCC. All processes and energy flow are calculated in OpenLCA 2.1.1. It should be noted that to normalize the environmental indicators, the World 2000 dataset is implemented [46].

3.1. Results on LCA

This section provides the numerical results on LCA based on the previous description. As mentioned, 10 environmental indicators are considered during the LFP lifespan. The share of impact indicators on each subsystem (manufacturing, operation, and recycling) is given in Figure 5. As can be seen, the operation subsystem is responsible for much GHP due to electricity provided during the charging scheme. However, if the share of renewable energy integration increases in Lombok, this value will be reduced in the 2030 energy mix scenario. Due to higher non-methane volatile organic and nitrogen oxide generation during the manufacturing process, this subsystem contributes to the HTP indicator. The freshwater indicator strongly affects the recycling process. As shown in Table 3, because this subsystem creates a high rate of emission to water, the FAETP contributes much more compared to other indicators in this subsystem (1.45 × 10² CTUe/kWh). Due to the presence of hydrochloric acid in the recycling process, the ODP indicator of this subsystem is higher than other subsystems.
To show how subsystems affect the characterized indicators, the contribution of each indicator on each subsystem is shown in Table 6. By comparing this diagram with Figure 4, it can be seen that the recycling subsystem has the least effect on the environment. The operating subsystem, which includes power supply, converters, cables, and other grid connection equipment, has a significant impact on global warming. Due to higher emissions to air and water in the manufacturing process, including non-methane violate organic, sulfur dioxide, carbon monoxide, ammonia, phosphorus, and COD, almost 100% of AP, POCP, MAETP, and TETP indicators are caused by the manufacturing subsystem.
The main part of LCA is to determine the impact indicator share on the reference value. So, the normalization phase based on the normalization factor of the World 2000 dataset is conducted, which is shown in Figure 6. Based on normalization results, FAETP has the most significant impact indicator. After that, EP, and ODP are most effective, respectively. As can be seen in Figure 6, the values of the other indicators are very small compared to the EP, ODP, and FAETP indicators; hence, the value of zero has been included for them on the graph.
The quality of input data is crucial in LCA because the impact assessments rely heavily on accurate data. The sensitivity analysis is carried out for the three most contributive indicators, namely FAETP, EP, and ODP, by examining the impact of input data deviation by ±20%. Figure 7 shows the sensitivity analysis.
The purpose of sensitivity analysis in LCA is due to the large amount of input data that can change the final results. However, according to Figure 7, a ±20% change in the input data still shows that the BESS has the greatest impact on the FAETP. The changes in ODP are not noticeable. This analysis shows that the obtained results are reliable with a high percentage of confidence. The proposed sensitivity analysis demonstrates that even with a 20% variation in the input data (error), the outcomes of our model remain robust and reliable. This indicates that the proposed model is resilient to data uncertainties.
In general, the results of this section show that without normalization, the global warming indicator has the greatest impact on the environment. As mentioned, this is due to Lombok’s energy mix. So, if the installed capacity of solar resources reaches 443 megawatts—according to the 2030 scenario—and a large-scale BESS is integrated to mitigate the fluctuation of these resources, carbon dioxide production and, consequently, global warming, will be significantly reduced. However, solar panels can change environmental indicators during their production phase.
By normalizing the indicators, it was found that due to the volume of lithium (4.69 × 10⁻⁴ kg) released in the water during the recycling process, LFP affects the FAETP indicator much more.

3.2. Results on LCC

LCC, often known as whole-life costing, is the practice of calculating how much cash will be spent on an asset during its useful life. The final price of the battery depends on various factors, and due to the dependence on the raw materials, its price changes fluctuate. Although in this article the uncertainty of the price of raw materials is not considered, the use of real data presented in Table 7 can provide reliable results.
The investment cost of the LFP includes raw materials, converters, network connection equipment, cables, lithium, iron, etc., and is equal to 696.75 EUR/kWh.
The total annualized cost, including fixed O&M cost, fuel cost, variable operation cost, and annualized capital cost equals 703.65 EUR/yr. It should be noted that the annualized capital cost is calculated considering the discount rate of 5%. Figure 8 shows that more than 85% of the total annualized cost is due to the annualized capital cost (604 EUR/yr.). The other compositions of the annualized total cost are shown in this figure.
As mentioned, the levelized cost is an indicator of the average net present cost of electricity production for the BESS during its lifespan. This indicator is calculated by dividing the total annualized cost per annual energy output, which equals 0.0066 EUR/kWh.
The payback period on investment is highly dependent on the price of electricity sold in discharge mode for BESSs. Although there is no outlook for electricity prices in Lombok, it is expected that the selling price of electricity for integrated BESSs and solar resources will be much higher than electricity generated by fossil fuels. Considering the current electricity price of 0.13 EUR/kWh in Lombok, the payback period for LFP batteries is 4.1 years.
The price of electricity serves as a pivotal parameter in evaluating the economic viability of BESS, particularly in the context of facilitating the integration of PV power output. The sensitivity analysis on the electricity price is shown in Figure 9. It indicates that with a 20% increase in the price of electricity, the payback period on investment will decrease to 3.5 years. However, this analysis can be violated under the influence of the uncertainty of raw material prices until 2030.
In this study, the LCA is conducted based on the scope defined in the initial phase. All stages and elements involved in the LCA, including manufacturing, transportation, maintenance, usage, recycling, and replacement, are determined according to the EN15804 standard [47]. This standard provides comprehensive criteria for LCA, ensuring that all environmental and economic aspects of the systems are accurately evaluated.
When focusing on the performance of the battery in ancillary services such as frequency control, it is necessary to consider the time dimension and dynamic analysis. This type of analysis includes studying all costs and revenues resulting from the operation of the storage battery over a specified time period. In this study, as shown in Figure 4, revenue from electricity sales to the grid has been considered without focusing specifically on any particular type of revenue.
Therefore, the price of electricity is a critical parameter that significantly impacts the revenue from sales and, consequently, the cost–benefit analysis. Although the battery can also participate in the ancillary services market or reserve market, the primary aim of this study is to examine the LCA and LCC of the BESS in conjunction with solar resources, thereby facilitating their integration. Focusing on the operation stage and various electricity markets requires dynamic LCA analysis, which is beyond the scope of this research.
The analysis of Figure 9 reveals a notable relationship between the payback period and the cost of electricity, which is critical for assessing the economic feasibility of a BESS within the context of Lombok Island’s energy grid. As illustrated, the payback period decreases as electricity prices increase. This outcome arises from the strategic market participation of the BESS, where it exploits price arbitrage opportunities.
In markets with significant price fluctuations, the spread between purchasing and selling electricity at low prices during peak periods often widens as electricity costs rise, leading to increased revenue. Despite the storage system’s Round-Trip Efficiency (RTE) being less than 1, which indicates some energy loss during storage and retrieval, the financial gains from selling electricity at higher prices during peak times outweigh the charging costs incurred during lower-priced periods. This market dynamic explains why higher electricity prices can lead to an improved economic performance of BESSs, resulting in a shorter payback period.
The model used for this analysis simplifies certain aspects, focusing primarily on the direct revenue generated from electricity sales without accounting for factors such as battery degradation over time or ancillary service revenues. Additionally, a sensitivity analysis on electricity prices was conducted, confirming that even with substantial variations in input data (up to 20%), the payback period remains relatively stable. This finding underscores the economic viability of BESSs under the current and projected electricity market conditions on Lombok Island.

4. Conclusions

This paper provided a life cycle assessment and life cycle costing of large-scale battery storage based on lithium iron phosphate batteries for mitigating the power shortage on Lombok Island, Indonesia, under the 2030 energy mix strategy. The cradle-to-grave model was developed to consider the manufacturing, operation, and recycling phases for LFP batteries. Using realistic input data, the life cycle inventory was conducted, and then, 10 environmental indicators were classified and categorized based on the CML-IA midpoint approach. For the financial assessment, capital cost, annualized cost, levelized cost, and payback period indicators have been calculated for a BESS in Lombok. The results showed that the construction subsystem has the greatest impact on environmental and economic indicators. Almost 100% acidification, photochemical ozone, human toxicity, and marine and terrestrial ecosystem indicators are caused by manufacturing. Freshwater is severely affected due to the release of 4.69 × 10⁻⁴ kg of lithium into the water during recycling. In terms of financial indicators, 85% of the total cost is related to the annualized capital cost in the manufacturing subsystem. It is notable to mention that due to price fluctuations in raw battery materials, financial results have high uncertainty. Results also indicate that the levelized cost of LFP batteries for Lombok is about 0.0066, which reveals that lithium-ion batteries are an economic option for Lombok’s 2030 capacity development scenario. Based on the current price of electricity in Lombok, the payback period on investment was 4.1 years. The presented sensitivity analysis shows that the payback period on investment is strongly affected by the price of the electricity sold, and if incentive tariffs for the sale of electricity stored in the battery are included, the payback period decreases to 3.5 years. In this article, the uncertainty of the price of electricity and the price of battery raw materials were not taken into account. However, the presented results are reliable with up to 20% error. An uncertainty analysis of the input data, especially in terms of cash flow, along with dynamic and temporal life cycle assessments, is left for future works.

Author Contributions

Conceptualization, methodology, software, validation, writing—original draft preparation, M.H.; supervision, N.B.; writing—review and editing, T.E. All authors have read and agreed to the published version of the manuscript.

Funding

This research was funded by DANIDA Fellowship Centre and the Ministry of Foreign Affairs of Denmark (grant number 21-M06-AAU).

Data Availability Statement

The data are available upon request.

Conflicts of Interest

The authors declare no conflicts of interest.

References

  1. KPMG. Investing in Lombok—Prefeasibility Studies on Renewable Energy Solutions in Lombok; KPMG: Amstelveen, The Netherlands, 2019. [Google Scholar]
  2. Nasional, D.E. Technology Data for the Indonesian Power Sector: Catalogue for Generation and Storage of Electricity; Dewan Energi Nasional, Kemetrian Energi dan Sumber Daya Mineral: Jakarta, Indonesia, 2017. [Google Scholar]
  3. Hemmati, M.; Mohammadi-Ivatloo, B.; Abapour, M.; Anvari-Moghaddam, A. Day-ahead profit-based reconfigurable microgrid scheduling considering uncertain renewable generation and load demand in the presence of energy storage. J. Energy Storage 2020, 28, 101161. [Google Scholar] [CrossRef]
  4. Hosseini, A.; Yazdan, A.S.; Hemmati, M.; Abapour, M. Hybrid Robust Stochastic Bidding Strategy for Wind Farms Integrated with Compressed Air Energy Storage and Power to Gas Technology. J. Model. Eng. 2021, 19, 137–148. [Google Scholar]
  5. Arshad, F.; Lin, J.; Manurkar, N.; Fan, E.; Ahmad, A.; Tariq, M.-U.; Wu, F.; Chen, R.; Li, L. Life cycle assessment of lithium-ion batteries: A critical review. Resour. Conserv. Recycl. 2022, 180, 106164. [Google Scholar] [CrossRef]
  6. Pellow, M.A.; Ambrose, H.; Mulvaney, D.; Betita, R.; Shaw, S. Research gaps in environmental life cycle assessments of lithium ion batteries for grid-scale stationary energy storage systems: End-of-life options and other issues. Sustain. Mater. Technol. 2019, 23, e00120. [Google Scholar] [CrossRef]
  7. Yudhistira, R.; Khatiwada, D.; Sanchez, F. A comparative life cycle assessment of lithium-ion and lead-acid batteries for grid energy storage. J. Clean. Prod. 2022, 358, 131999. [Google Scholar] [CrossRef]
  8. Tolomeo, R.; De Feo, G.; Adami, R.; Osséo, L.S. Application of life cycle assessment to lithium ion batteries in the automotive sector. Sustainability 2020, 12, 4628. [Google Scholar] [CrossRef]
  9. Shafique, M.; Luo, X. Environmental life cycle assessment of battery electric vehicles from the current and future energy mix perspective. J. Environ. Manag. 2022, 303, 114050. [Google Scholar] [CrossRef] [PubMed]
  10. Rajaeifar, M.A.; Raugei, M.; Steubing, B.; Hartwell, A.; Anderson, P.A.; Heidrich, O. Life cycle assessment of lithium-ion battery recycling using pyrometallurgical technologies. J. Ind. Ecol. 2021, 25, 1560–1571. [Google Scholar] [CrossRef]
  11. Mohr, M.; Peters, J.F.; Baumann, M.; Weil, M. Toward a cell-chemistry specific life cycle assessment of lithium-ion battery recycling processes. J. Ind. Ecol. 2020, 24, 1310–1322. [Google Scholar] [CrossRef]
  12. Le Varlet, T.; Schmidt, O.; Gambhir, A.; Few, S.; Staffell, I. Comparative life cycle assessment of lithium-ion battery chemistries for residential storage. J. Energy Storage 2020, 28, 101230. [Google Scholar] [CrossRef]
  13. Porzio, J.; Scown, C.D. Life-Cycle assessment considerations for batteries and battery materials. Adv. Energy Mater. 2021, 11, 2100771. [Google Scholar] [CrossRef]
  14. Lai, X.; Chen, Q.; Tang, X.; Zhou, Y.; Gao, F.; Guo, Y.; Bhagat, R.; Zheng, Y. Critical review of life cycle assessment of lithium-ion batteries for electric vehicles: A lifespan perspective. eTransportation 2022, 12, 100169. [Google Scholar] [CrossRef]
  15. Da Silva Lima, L.; Quartier, M.; Buchmayr, A.; Sanjuan-Delmás, D.; Laget, H.; Corbisier, D.; Mertens, J.; Dewulf, J. Life cycle assessment of lithium-ion batteries and vanadium redox flow batteries-based renewable energy storage systems. Sustain. Energy Technol. Assess. 2021, 46, 101286. [Google Scholar] [CrossRef]
  16. Hiremath, M.; Derendorf, K.; Vogt, T. Comparative life cycle assessment of battery storage systems for stationary applications. Environ. Sci. Technol. 2015, 49, 4825–4833. [Google Scholar] [CrossRef]
  17. Koese, M.; Blanco, C.F.; Vert, V.B.; Vijver, M.G. A social life cycle assessment of vanadium redox flow and lithium-ion batteries for energy storage. J. Ind. Ecol. 2023, 27, 223–237. [Google Scholar] [CrossRef]
  18. Hemmati, M.; Bayati, N.; Ebel, T. Integrated life cycle sustainability assessment with future energy mix: A review of methodologies for evaluating the sustainability of multiple power generation technologies development. Renew. Energy Focus 2024, 49, 100581. [Google Scholar] [CrossRef]
  19. Rossi, F.; Heleno, M.; Basosi, R.; Sinicropi, A. Environmental and economic optima of solar home systems design: A combined LCA and LCC approach. Sci. Total. Environ. 2020, 744, 140569. [Google Scholar] [CrossRef]
  20. Zakeri, B.; Syri, S. Electrical energy storage systems: A comparative life cycle cost analysis. Renew. Sustain. Energy Rev. 2015, 42, 569–596. [Google Scholar] [CrossRef]
  21. Nikolaidis, P.; Chatzis, S.; Poullikkas, A. Life cycle cost analysis of electricity storage facilities in flexible power systems. Int. J. Sustain. Energy 2019, 38, 752–772. [Google Scholar] [CrossRef]
  22. Tang, H.; Wang, S. Life-cycle economic analysis of thermal energy storage, new and second-life batteries in buildings for providing multiple flexibility services in electricity markets. Energy 2023, 264, 126270. [Google Scholar] [CrossRef]
  23. Baumann, M.; Peters, J.F.; Weil, M.; Grunwald, A. CO2 footprint and life-cycle costs of electrochemical energy storage for stationary grid applications. Energy Technol. 2017, 5, 1071–1083. [Google Scholar] [CrossRef]
  24. Xu, T.; Meng, H.; Zhu, J.; Wei, W.; Zhao, H.; Yang, H.; Li, Z.; Ren, Y. Considering the life-cycle cost of distributed energy-storage planning in distribution grids. Appl. Sci. 2018, 8, 2615. [Google Scholar] [CrossRef]
  25. Colarossi, D.; Principi, P. Optimal sizing of a photovoltaic/energy storage/cold ironing system: Life Cycle cost approach and environmental analysis. Energy Convers. Manag. 2023, 291, 117255. [Google Scholar] [CrossRef]
  26. Marchi, B.; Pasetti, M.; Zanoni, S. Life cycle cost analysis for BESS optimal sizing. Energy Procedia 2017, 113, 127–134. [Google Scholar] [CrossRef]
  27. Cicconi, P.; Postacchini, L.; Pallotta, E.; Monteriù, A.; Prist, M.; Bevilacqua, M.; Germani, M. A life cycle costing of compacted lithium titanium oxide batteries for industrial applications. J. Power Sources 2019, 436, 226837. [Google Scholar] [CrossRef]
  28. Li, J.; Liang, M.; Cheng, W.; Wang, S. Life cycle cost of conventional, battery electric, and fuel cell electric vehicles considering traffic and environmental policies in China. Int. J. Hydrogen Energy 2021, 46, 9553–9566. [Google Scholar] [CrossRef]
  29. Minke, C.; Ledesma, M.A.D. Impact of cell design and maintenance strategy on life cycle costs of vanadium redox flow batteries. J. Energy Storage 2019, 21, 571–580. [Google Scholar] [CrossRef]
  30. Olmos, J.; Gandiaga, I.; Lopez, D.; Larrea, X.; Nieva, T.; Aizpuru, I. Li-Ion battery-based hybrid diesel-electric railway vehicle: In-depth life cycle cost analysis. IEEE Trans. Veh. Technol. 2021, 71, 5715–5726. [Google Scholar] [CrossRef]
  31. Torkashvand, M.; Khodadadi, A.; Sanjareh, M.B.; Nazary, M.H. A life cycle-cost analysis of Li-ion and lead-acid BESSs and their actively hybridized ESSs with supercapacitors for islanded microgrid applications. IEEE Access 2020, 8, 153215–153225. [Google Scholar] [CrossRef]
  32. Ogunjuyigbe, A.; Ayodele, T.; Akinola, O. Optimal allocation and sizing of PV/Wind/Split-diesel/Battery hybrid energy system for minimizing life cycle cost, carbon emission and dump energy of remote residential building. Appl. Energy 2016, 171, 153–171. [Google Scholar] [CrossRef]
  33. Mostafa, M.H.; Aleem, S.H.E.A.; Ali, S.G.; Ali, Z.M.; Abdelaziz, A.Y. Techno-economic assessment of energy storage systems using annualized life cycle cost of storage (LCCOS) and levelized cost of energy (LCOE) metrics. J. Energy Storage 2020, 29, 101345. [Google Scholar] [CrossRef]
  34. Hemmati, M.; Ghasemzadeh, S.; Mohammadi-Ivatloo, B. Optimal scheduling of smart reconfigurable neighbour micro-grids. IET Gener. Transm. Distrib. 2019, 13, 380–389. [Google Scholar] [CrossRef]
  35. Wang, Y.; Chen, X.; Li, C.; Yu, Y.; Zhou, G.; Wang, C.; Zhao, W. Temperature prediction of lithium-ion battery based on artificial neural network model. Appl. Therm. Eng. 2023, 228, 120482. [Google Scholar] [CrossRef]
  36. Tian, J.; Liu, X.; Li, S.; Wei, Z.; Zhang, X.; Xiao, G.; Wang, P. Lithium-ion battery health estimation with real-world data for electric vehicles. Energy 2023, 270, 126855. [Google Scholar] [CrossRef]
  37. Liu, M.; Zhang, K.; Liang, Y.; Yang, Y.; Chen, Z.; Liu, W. Life cycle environmental and economic assessment of electric bicycles with different batteries in China. J. Clean. Prod. 2023, 385, 135715. [Google Scholar] [CrossRef]
  38. Schaubroeck, T.; Schrijvers, D.; Schaubroeck, S.; Moretti, C.; Zamagni, A.; Pelletier, N.; Huppes, G.; Brandão, M. Definition of product system and solving multifunctionality in ISO 14040-14044: Inconsistencies and proposed amendments—Toward a more open and general LCA framework. Front. Sustain. 2022, 3, 9. [Google Scholar] [CrossRef]
  39. Hauschild, M.Z.; Rosenbaum, R.K.; Olsen, S.I. Life Cycle Assessment; Springer: Berlin/Heidelberg, Germany, 2018. [Google Scholar]
  40. Mälkki, H.; Alanne, K. An overview of life cycle assessment (LCA) and research-based teaching in renewable and sustainable energy education. Renew. Sustain. Energy Rev. 2017, 69, 218–231. [Google Scholar] [CrossRef]
  41. Han, X.; Li, Y.; Nie, L.; Huang, X.; Deng, Y.; Yan, J.; Kourkoumpas, D.-S.; Karellas, S. Comparative life cycle greenhouse gas emissions assessment of battery energy storage technologies for grid applications. J. Clean. Prod. 2023, 392, 136251. [Google Scholar] [CrossRef]
  42. Hemmati, M.; Bayati, N.; Ebel, T. Life-Cycle Assessment of Renewable-based Hydrogen Production via PEM Electrolyzer in Indonesia. In Proceedings of the 2024 12th International Conference on Smart Grid (icSmartGrid), Setúbal, Portugal, 27–29 May 2024; pp. 112–117. [Google Scholar]
  43. Sinaga, P.D.L.; Moersidik, S.S.; Hamzah, U.S. Life Cycle Assessment of a combined cycle power plant in Indonesia. IOP Conf. Series Earth Environ. Sci. 2021, 716, 012122. [Google Scholar] [CrossRef]
  44. Duyan, Ö.; Ciroth, A. Life Cycle Costing Quick Explanation: Two Different Methods to Perform Life Cycle Costing in OPENLCA; GreenDelta: Berlin, Germany, 2013. [Google Scholar]
  45. Atilgan, B.; Azapagic, A. An integrated life cycle sustainability assessment of electricity generation in Turkey. Energy Policy 2016, 93, 168–186. [Google Scholar] [CrossRef]
  46. Yao, R.; Wang, L.; Huang, X.; Cao, Q.; Wei, J.; He, P.; Wang, S.; Wang, L. Global seamless and high-resolution temperature dataset (GSHTD), 2001–2020. Remote. Sens. Environ. 2023, 286, 113422. [Google Scholar] [CrossRef]
  47. Allacker, K.; Mathieux, F.; Pennington, D.; Pant, R. The search for an appropriate end-of-life formula for the purpose of the European Commission Environmental Footprint initiative. Int. J. Life Cycle Assess. 2017, 22, 1441–1458. [Google Scholar] [CrossRef]
Figure 1. Average daily load curve of Lombok.
Batteries 10 00295 g001
Figure 2. The installation area of the integrated solar farm and large-scale BESS in Lombok by 2030.
Batteries 10 00295 g002
Figure 3. The LCA framework [40].
Batteries 10 00295 g003
Figure 4. The LFP battery impact assessment boundary, including 3 subsystems.
Batteries 10 00295 g004
Figure 5. Share of impact indicators on each subsystem.
Batteries 10 00295 g005
Figure 6. Normalization value for 10 environmental indicators based on the World 2000 normalization factor.
Batteries 10 00295 g006
Figure 7. Sensitivity analysis on ±20% of input data and its effects on the three most contributions indicators.
Batteries 10 00295 g007
Figure 8. Composition of the total annualized cost of BESS.
Batteries 10 00295 g008
Figure 9. Sensitivity analysis on electricity price and its effects on payback periods.
Batteries 10 00295 g009
Table 1. The inventory of LPF batteries during the manufacturing phase [41,42].
ItemUnitValue
Input
Waterkg1.54 × 101
Dimethyl carbonatekg1.07
Aluminum sheetkg6.70 × 10−1
Copper sheetkg1.00
Ethylene carbonatekg6.50 × 10−1
Carbon blackkg7.00 × 10−2
Graphitekg1.16
Carboxymethyl cellulosekg2.00 × 10−2
Acrylonitrile–butadiene–styrene copolymerkg5.80 × 10−1
Lithium hexafluorophosphatekg3.80 × 10−1
N-methyl-2-pyrrolidonekg1.20 × 10−1
Polypropylenekg2.00 × 10−2
Polyethylenekg2.00 × 10−2
Nitrogenkg9.29 × 10−3
Glucosekg1.00 × 10−1
Iron phosphatekg1.00
Lithium carbonatekg2.50 × 10−1
Phosphoric acidkg7.63 × 10−1
Sulfuric acidkg6.72 × 10−1
Hydrogen peroxidekg3.75 × 10−1
Polyvinylidene fluoridekg1.20 × 10−1
ElectricitykWh3.55 × 101
HeatMJ1.80 × 101
Natural gasm31.67
Cell containerkg1.02
Lithium iron phosphatekg2.67
Emission to air
NMVOCkg1.32 × 10−2
Sulfur dioxidekg2.21 × 10−4
Nitrogen oxideskg3.12 × 10−3
Carbon monoxidekg4.33 × 10−6
Carbon dioxidekg1.71 × 10−3
Ammoniakg1.23 × 10−4
Emission to water
Wastewaterkg1.26 × 101
CODkg1.55 × 10−3
Ammonia, as Nkg9.71 × 10−5
Phosphorus, totalkg2.63 × 10−6
Suspended substanceskg1.26 × 10−4
Table 2. This inventory of LFP batteries during the operation phase [20,41,42].
ItemsUnitValue
Input
BMS
Integrated circuitkg5.28 × 10−2
Steelkg4.00 × 10−1
Wire drawingkg5.00 × 10−1
Sheet rollingkg4.00 × 10−1
Rail transportkm2.00 × 10−1
Transportkm1.00 × 10−1
Copperkg5.00 × 10−1
Plastic processing factoryp2.30 × 10−10
Printed wiring boardkg8.90 × 10−2
Module and battery packing
Injection modulekg1.00
Polyethylene terephthalatekg1.00
Rail transportkm2.00 × 10−1
Transportkm1.00 × 10−1
Plastic processing factoryp7.40 × 10−10
Cell container
Sheet rollingkg1.00
Metalworking factoryp4.60 × 10−10
Transportkm2.00 × 10−1
Transportkm1.00 × 10−1
Aluminum sheetkg1.00
Electrode
Raw carbon feltkg2.00
Process steam from natural gasMJ6.12
Natural gasMJ7.96 × 10−2
Cable
Tap waterkg1.45
Copperkg9.40 × 10−1
Polyvinylchloridekg6.26 × 10−2
Wire drawingkg9.40 × 10−1
Extrusionkg6.26 × 10−2
Transportkm9.37 × 10−2
Emissions to air
Carbon dioxidekg1.31
Nitrogenkg6.70 × 10−1
Emissions to water
Wastewaterm31.36 × 10−3
Hazardous wastekg3.17 × 10−4
Table 3. The inventory of LPF batteries during the recycling process.
ItemUnitValue
Input
Used LFP batterykWh1.00
Waterkg2.16
Sodium carbonatekg1.14
Sodium hydroxidekg3.55
Hydrochloric acidkg8.09
Hydrogen peroxidekg1.36
ElectricitykWh2.61 × 10−2
Emission to water
Wastewaterkg1.45 × 101
Lithiumkg4.69 × 10−4
Table 4. The description of environmental indicators.
No.IndicatorDescriptionUnit
1GWPIndicator of possible global warming brought on by greenhouse gas releases into the atmospherekg CO2-eq/kWh
2APIndicator of the possible gas release-induced acidity of soils and waterkg mol H+/kWh
3EPIndicator of the terrestrial ecosystem’s enrichmentmol N-eq/kWh
4POCPIndications of gas emissions that influence the
production of photochemical ozone
kg NMVOC-eq/kWh
5HTPEffects of harmful compounds released into the
environment on humans.
CTUh/kWh
6ODPIndication of air pollution that destroys the ozone layerkg CFC-11-eq/kWh
7ADPIndicator of the depletion of natural non-fossil sourceskg Sb-eq/kWh
8MAETPIndicator of the enrichment of the marine
ecosystem
CTUe/kWh
9FAETPImpact on freshwater organisms of toxic substancesCTUe/kWh
10TETPIndicator of the enrichment of the terrestrial
ecosystem
CTUe/kWh
Table 5. Economic input data for LCC analysis [20].
ItemUnitValue
Power conversion system costEUR/kW463
Cost of storage section (container, electrolyte, etc.)EUR/kWh795
Fixed O&M costEUR/kW-yr.6.9
Replacement costEUR/kWh369
Capital costEUR/kW1160
Discount rate%5
LifetimeYear25
Fuel cost for productionEUR/MWh20
Table 6. Economic input data for LCC analysis.
GWPAPEPPOCPHTPODPADPMAETPFAETPTETP
Manufacturing1.71 × 10−33.34 × 10−34.89 × 10−33.35 × 10−31.63 × 10−202.63 × 10−61.26 × 10−41.26 × 10−41.26 × 10−4
Operation1.3106.70 × 10−10003.17 × 10−406.70 × 10⁻¹⁰
Recycling4.69 × 10−400008.09 × 10−34.69 × 10−401.45 × 10⁻²⁰
Table 7. The LCC results on LPF batteries.
Capital Cost (EUR/kWh)Total Annualized Cost (EUR/yr.)Levelized Cost (EUR/kWh)Payback (yr.)
696.75703.650.00664.1
Disclaimer/Publisher’s Note: The statements, opinions and data contained in all publications are solely those of the individual author(s) and contributor(s) and not of MDPI and/or the editor(s). MDPI and/or the editor(s) disclaim responsibility for any injury to people or property resulting from any ideas, methods, instructions or products referred to in the content.

