
Experimental and Reduced-Order Modeling Research of Thermal Runaway Propagation in 100 Ah Lithium Iron Phosphate Battery Module


 ,
, 
Abstract
1. Introduction
- (1)
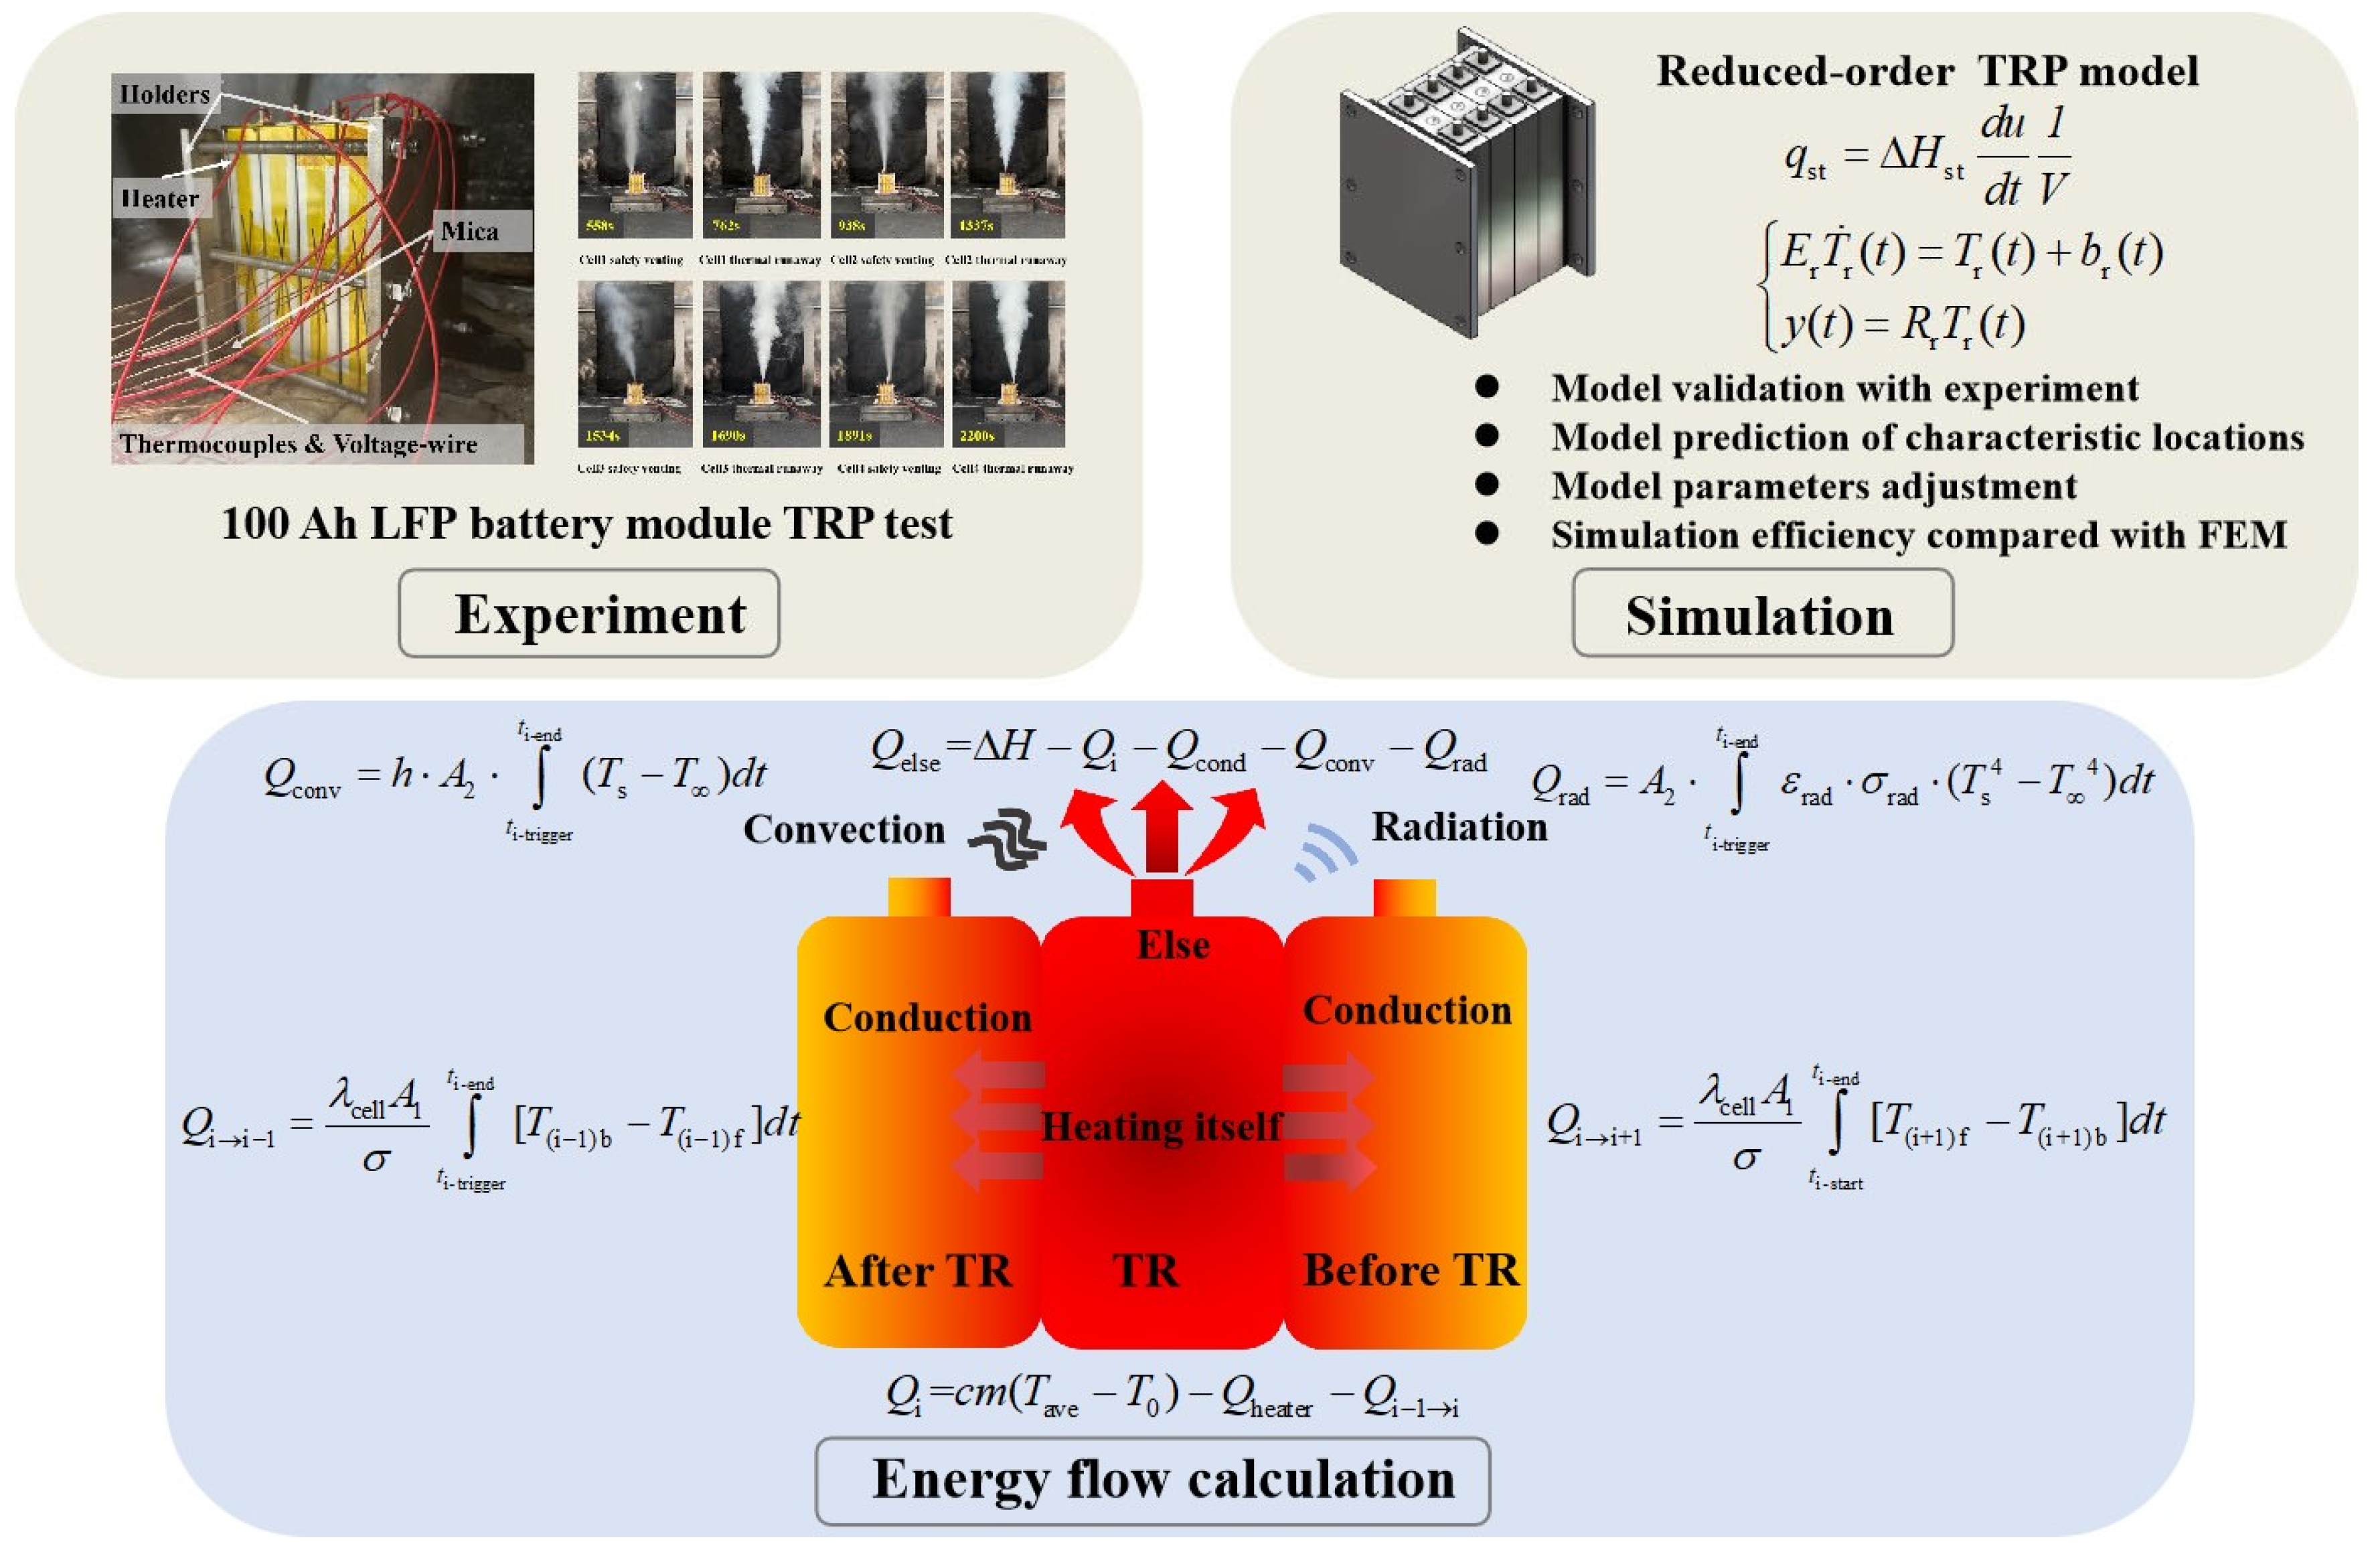
- A TRP experiment was conducted on a four-cell 100 Ah LFP battery module. The experimental phenomena, temperature characteristics of each battery cell, and characteristic time were analyzed.
- (2)
- A reduced-order TRP model that is highly consistent with experimental data was established using the Arnoldi method based on Krylov subspaces. The temperature change at characteristic locations of the battery was predicted through the model. In addition, by adjusting the key parameters of the model, the parameter values for inhibiting TRP in the battery module were obtained. Finally, a finite element TRP model of the same specification was constructed for a comparison of simulation efficiency.
- (3)
- Energy flow calculations were performed based on experimental and simulation data. By calculating the heat conduction between batteries during the TRP of the module, the thermal convection and radiation heat dissipation of each battery cell, as well as the heat lost through ejection and other behaviors, the flow patterns of energy released during battery TRP through different paths were obtained.
2. Methodology
2.1. Battery Sample
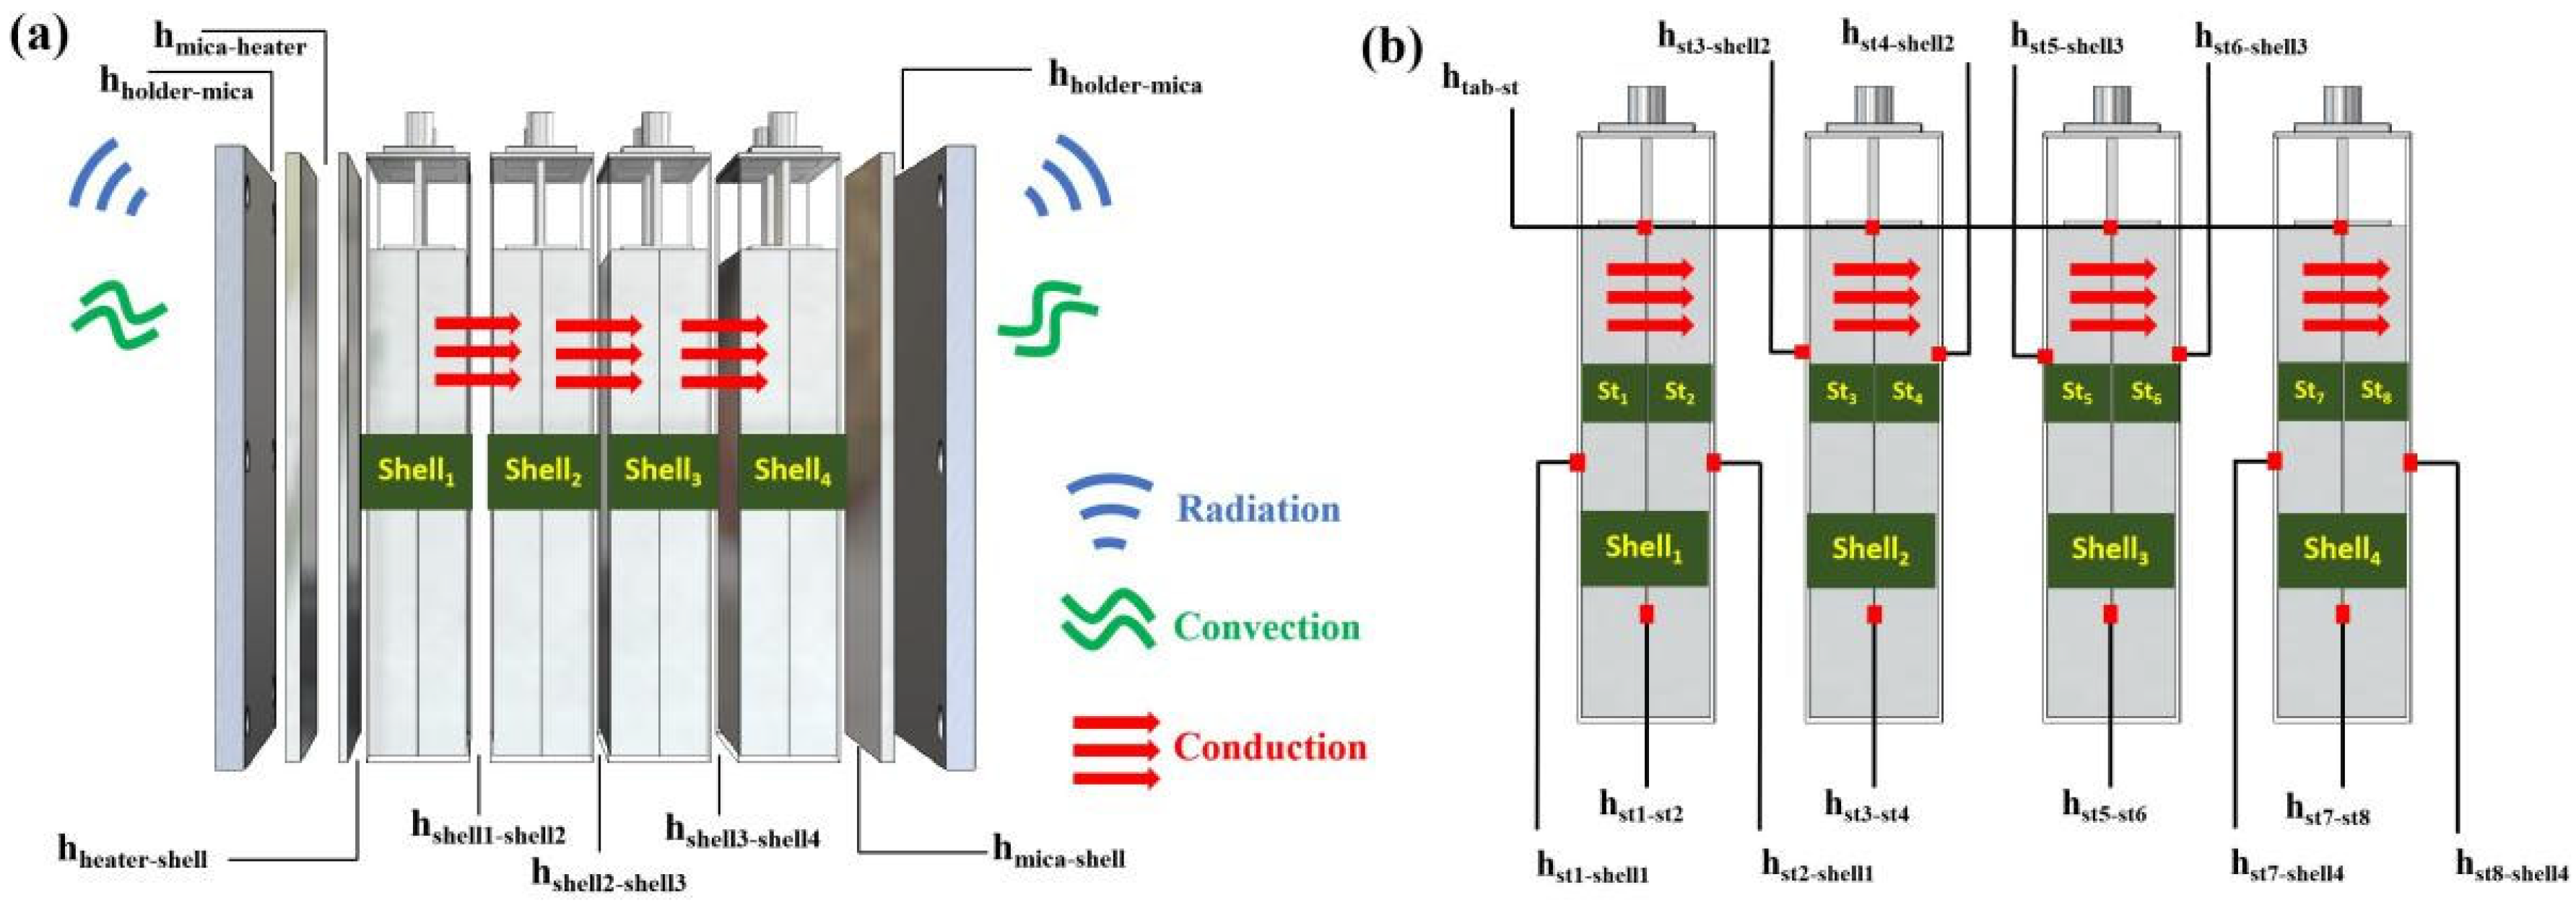
2.2. Geometry
2.3. Reduced-Order TRP Model
2.3.1. Reduced-Order Thermal Model
2.3.2. TR Model
2.3.3. Boundary Condition
Thermal Conduction
Thermal Convection
Thermal Radiation
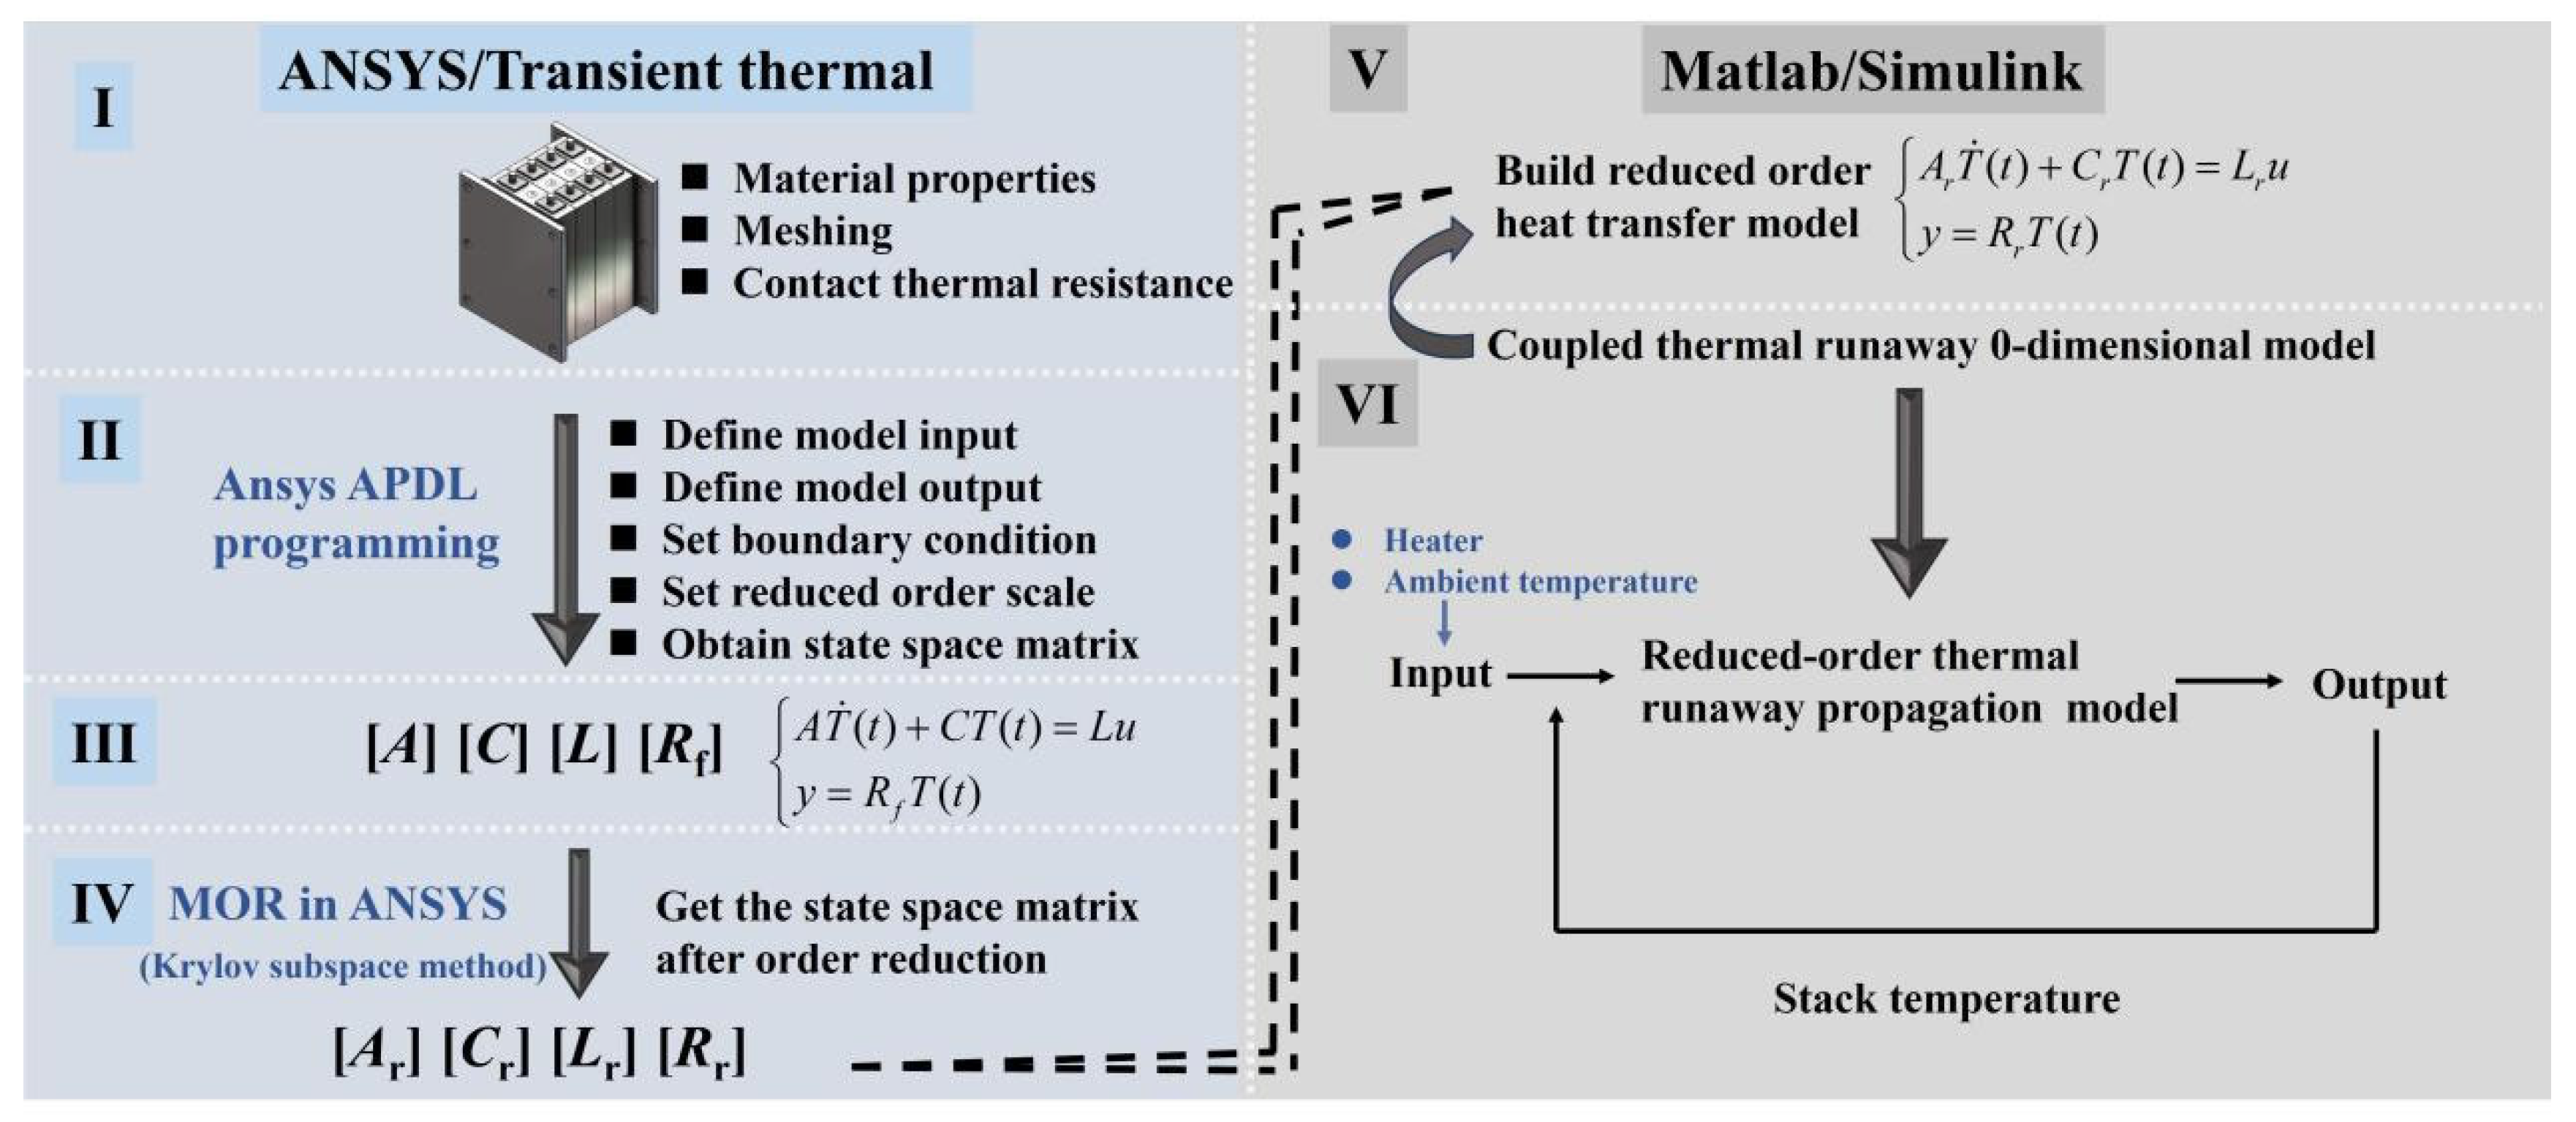
2.3.4. Modeling Procedures
- (I)
- First, import the established geometric model into ANSYS/Transient Thermal to define the material properties, perform mesh generation, and set the contact thermal resistance of the model.
- (II)
- Program using ANSYS Parametric Design Language (APDL) to define model inputs and outputs, set boundary conditions, and specify the reduced-order scale.
- (III)
- Obtain the matrices [A], [C], [L], and [Rf] from the heat transfer state-space equations by APDL.
- (IV)
- Launch the “MOR for ANSYS” plugin to perform order reduction, resulting in reduced-order matrices [Ar], [Cr], [Lr], and [Rr].
- (V)
- Use the “Discrete State Space” block in MATLAB/Simulink 2024b to build the reduced-order heat transfer model.
- (VI)
- Couple the pre-built 0-dimensional TR model with the reduced-order heat transfer model to obtain the reduced-order TRP model. In this model, the heater and ambient temperature serve as the initial inputs, and the resulting stack temperature from the model output are fed back as inputs to the reduced-order TRP model, forming a closed-loop system.
2.4. Experimental Design
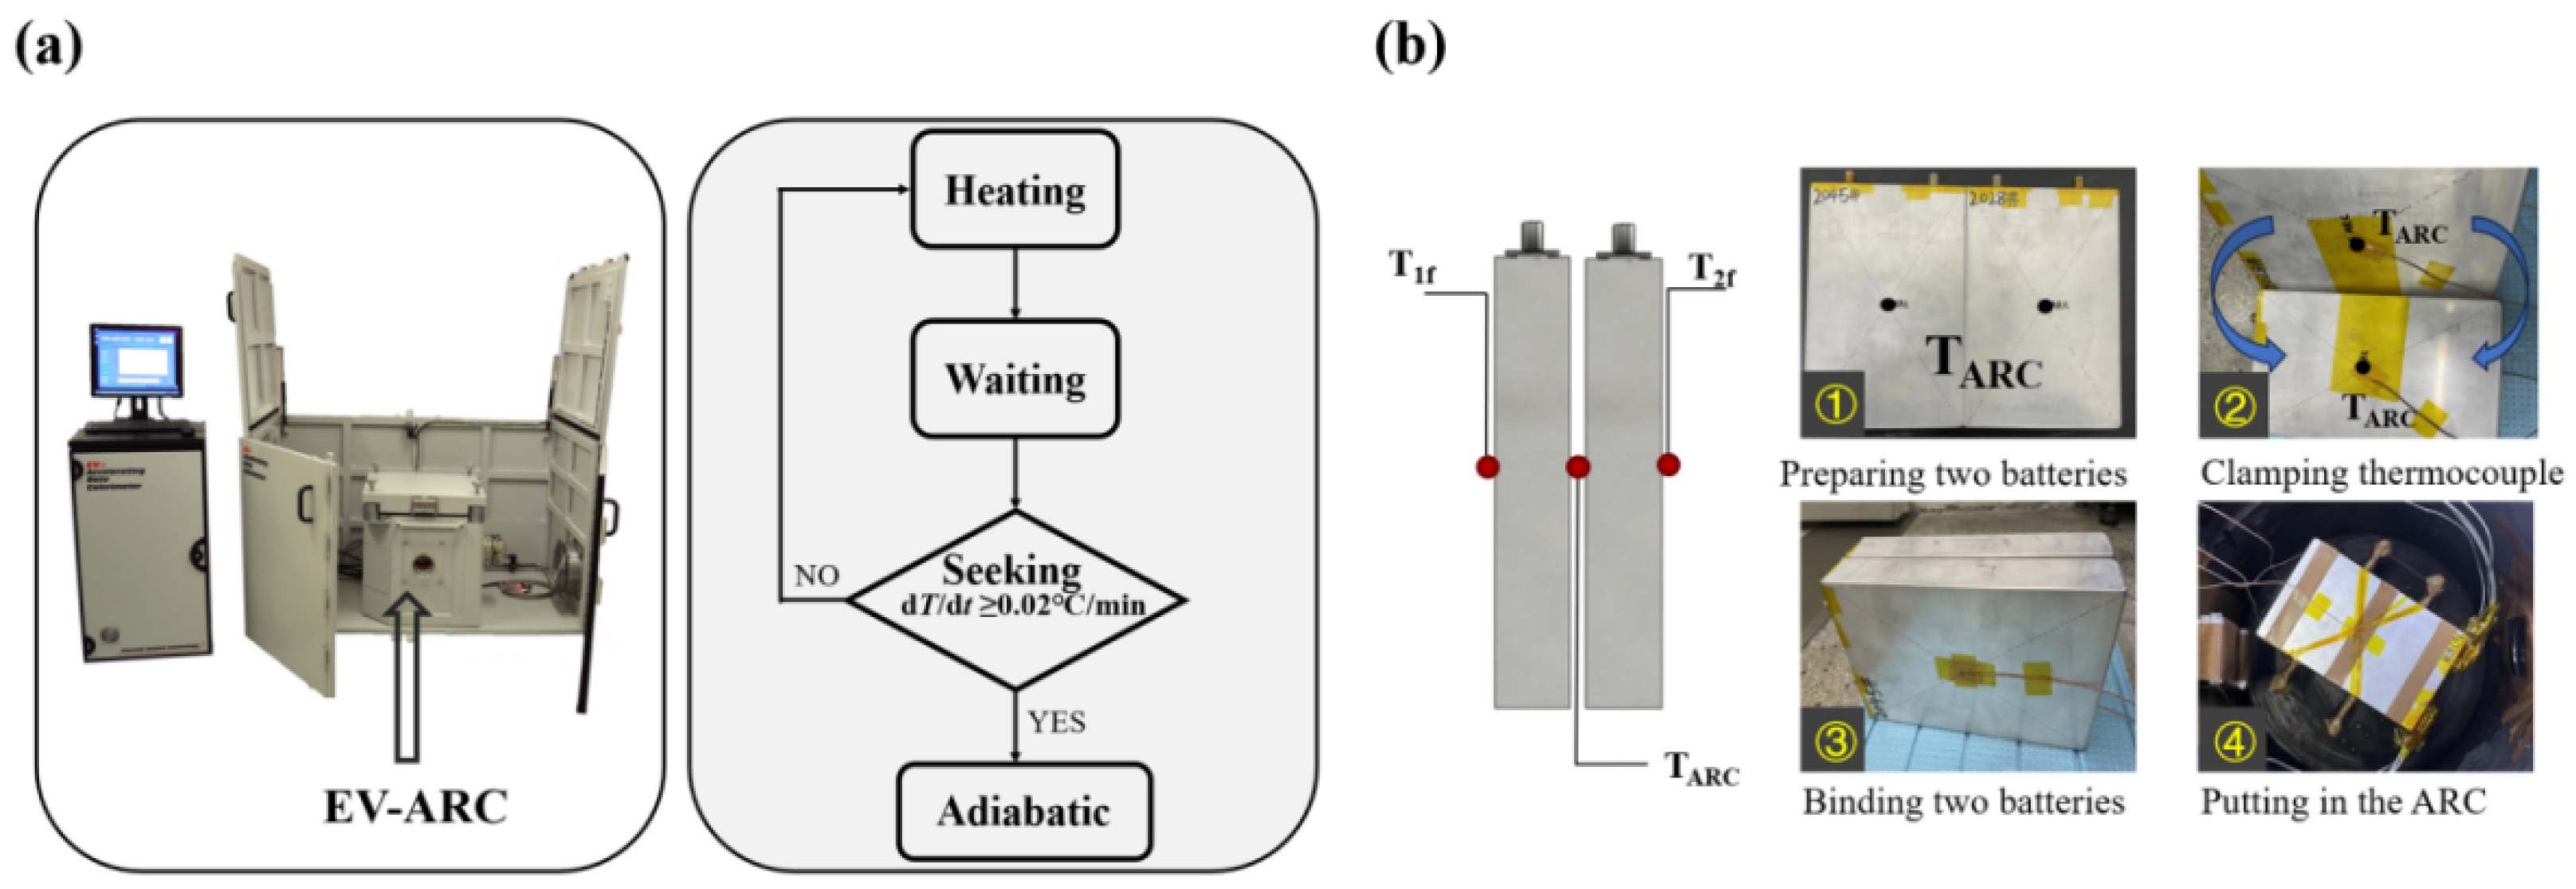
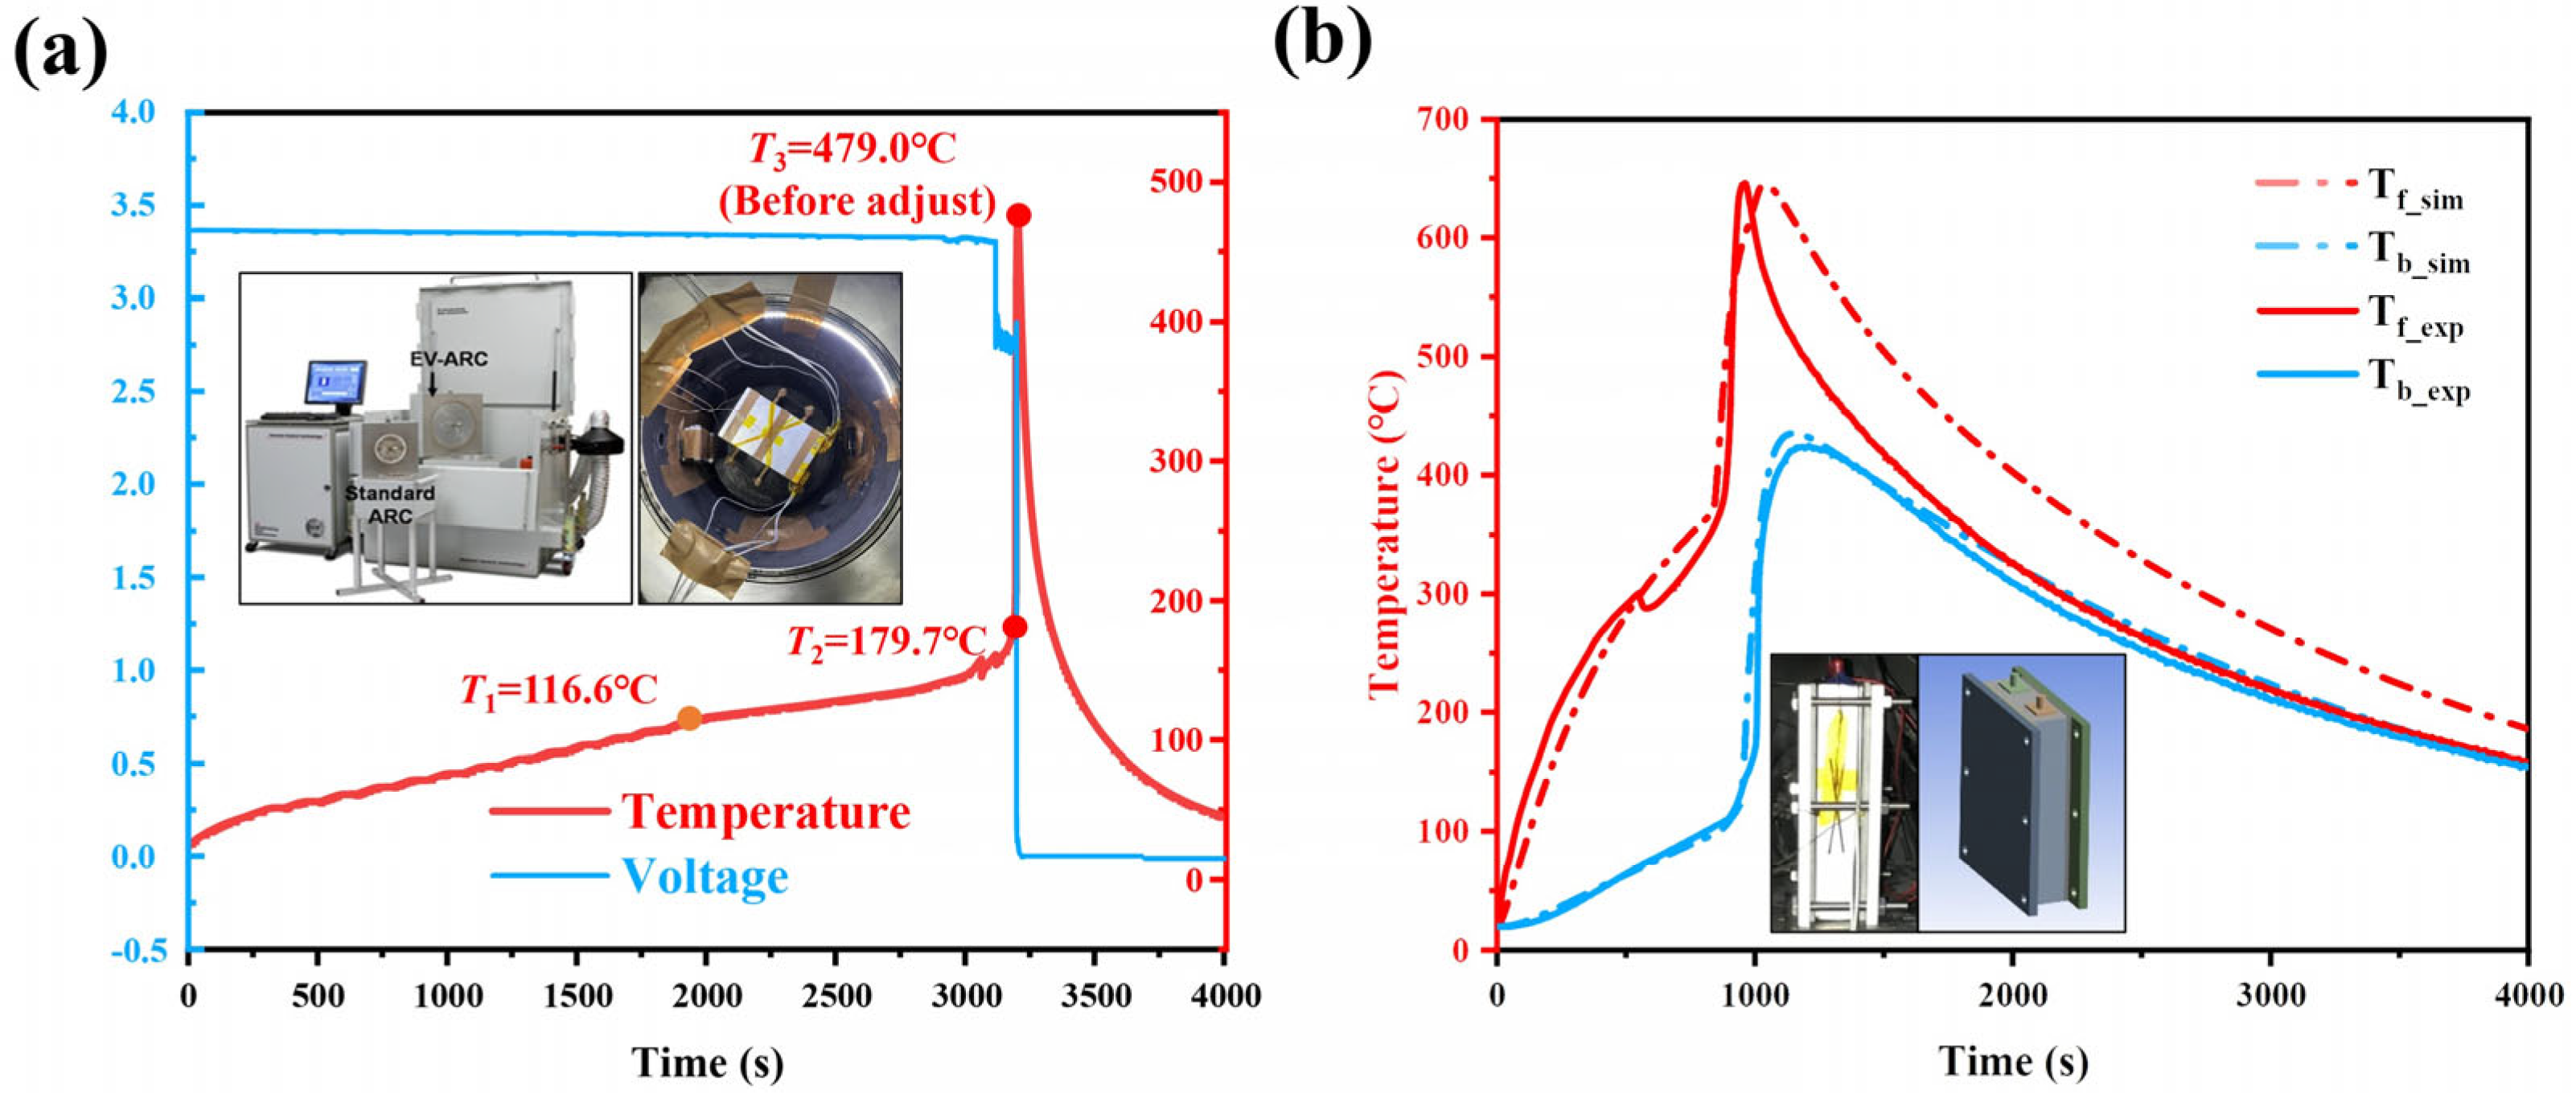
2.4.1. EV-ARC Test
2.4.2. Module TRP Test
3. Results and Discussion
3.1. Experimental Result
3.1.1. EV-ARC Test Result
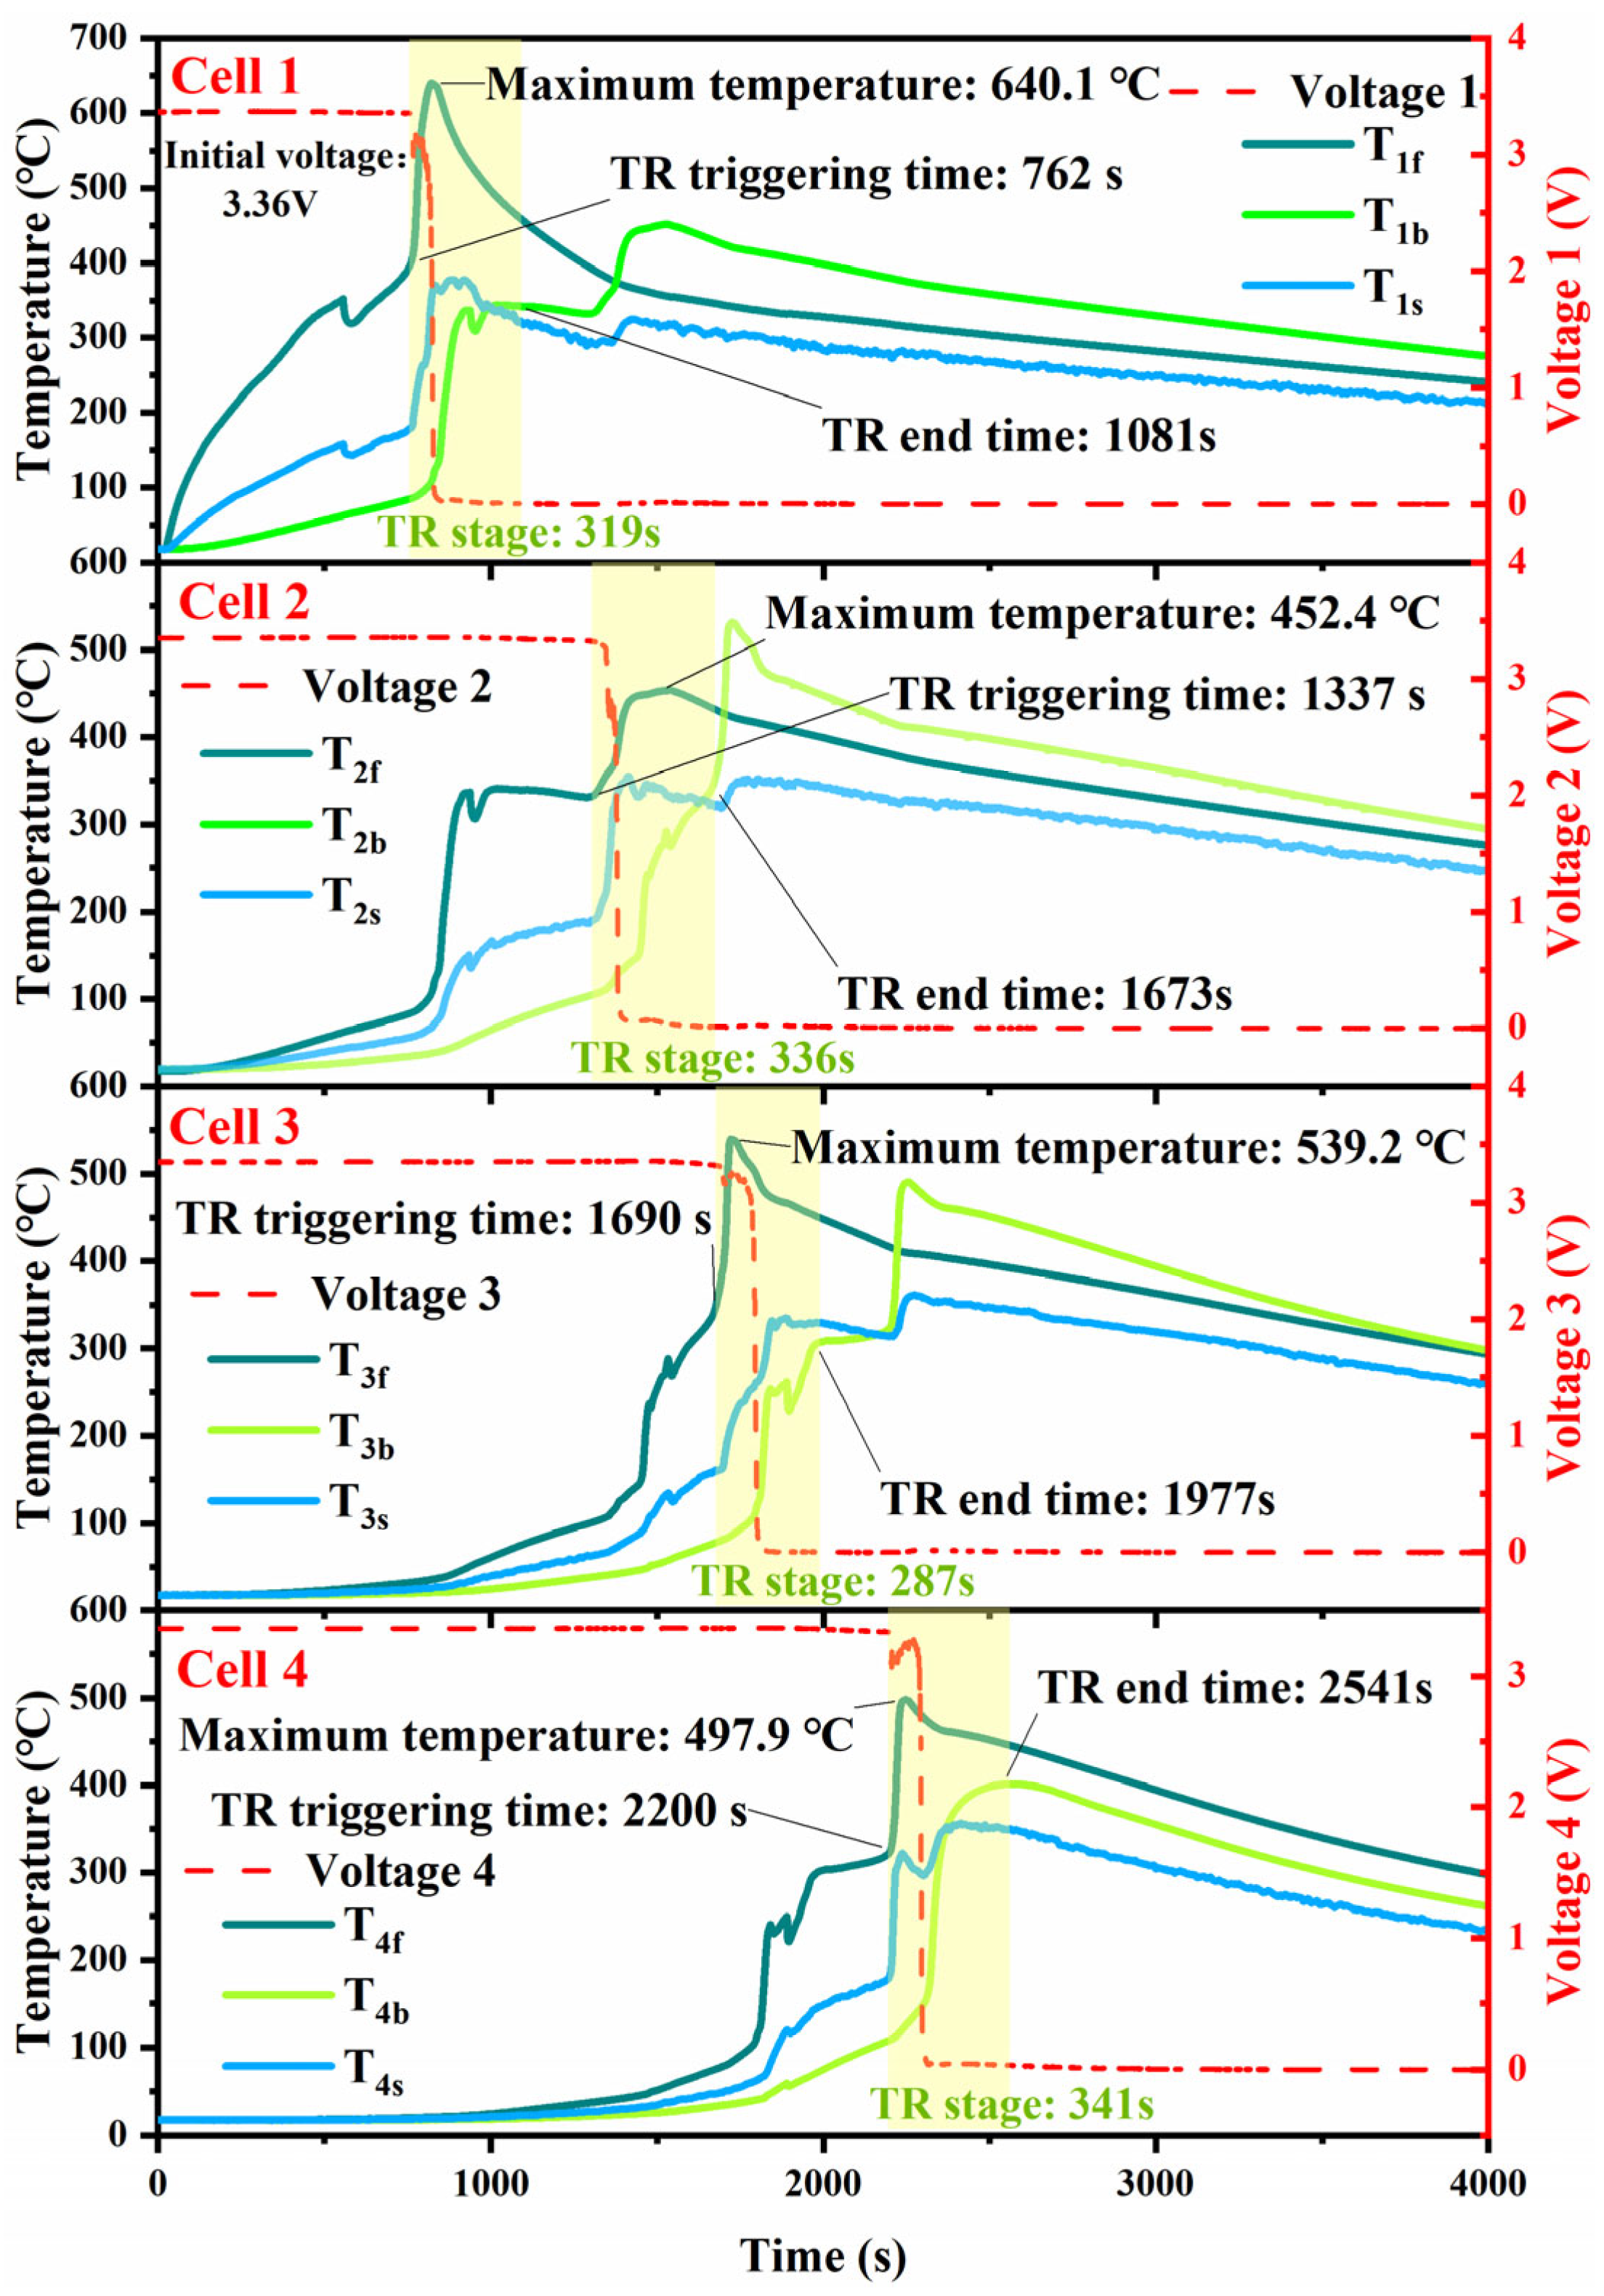
3.1.2. TRP Test Result
TRP Phenomenon
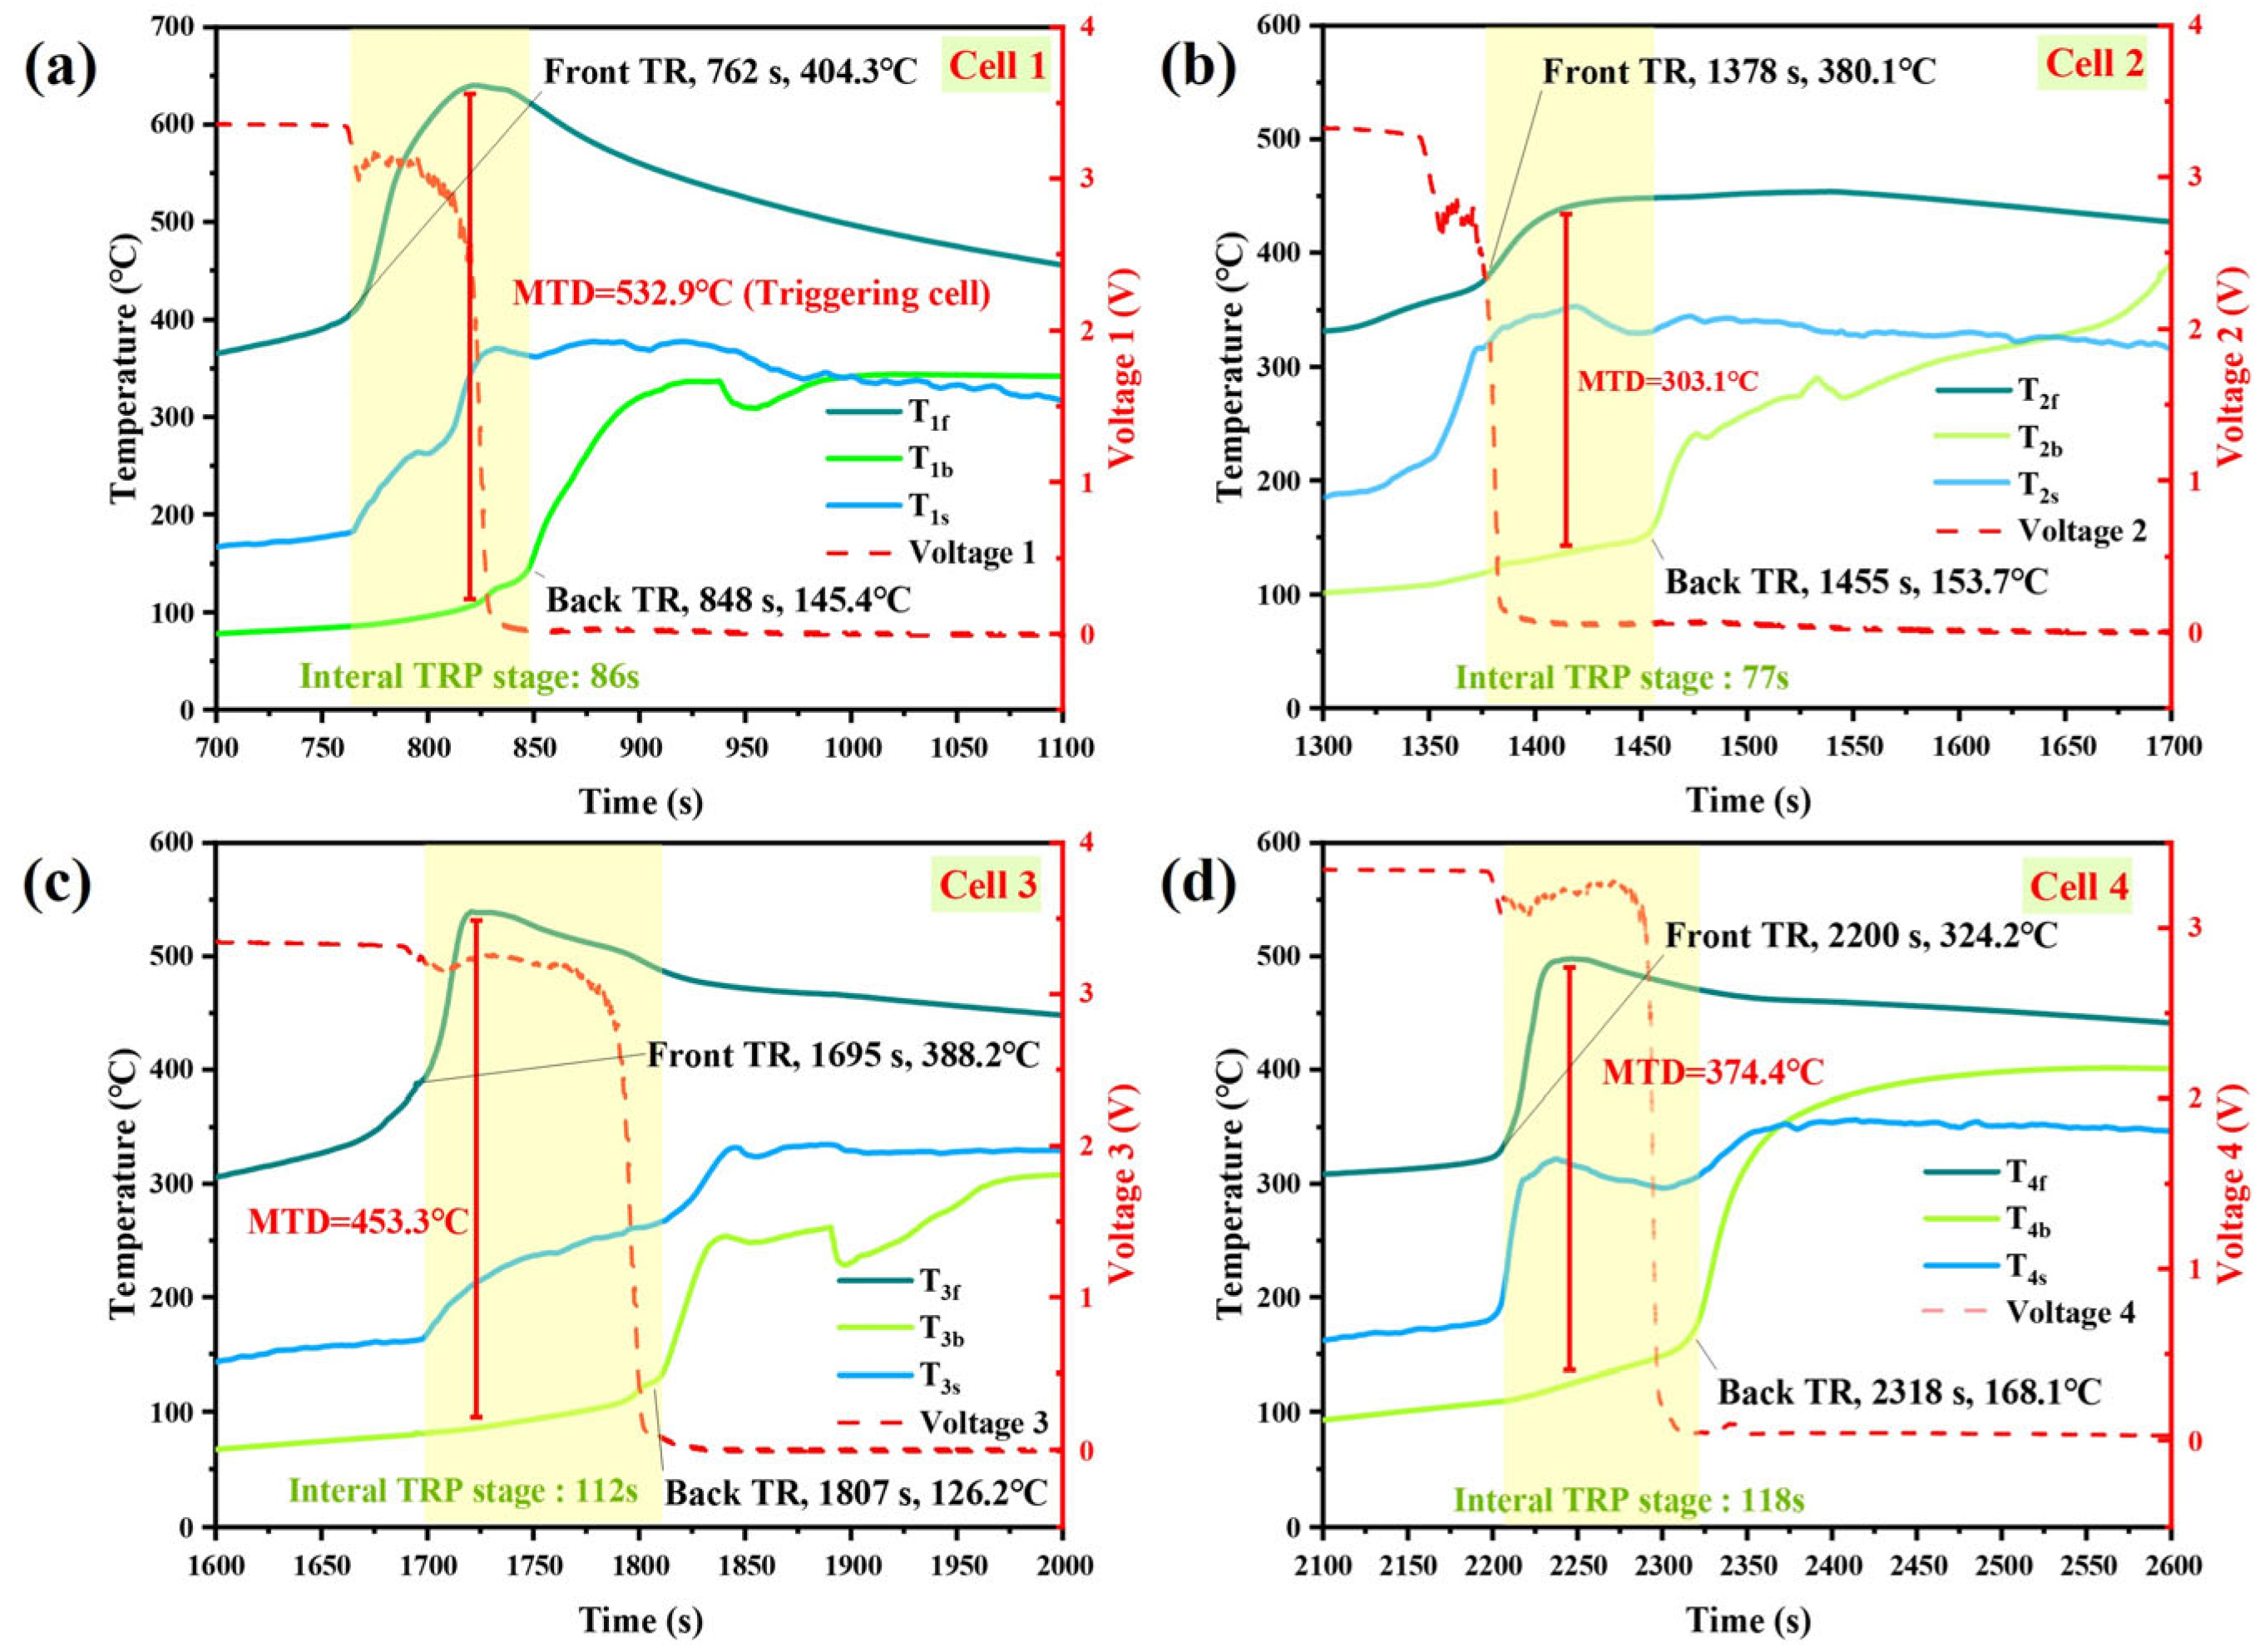
Temperature Characteristics During TRP
3.2. Simulation Result
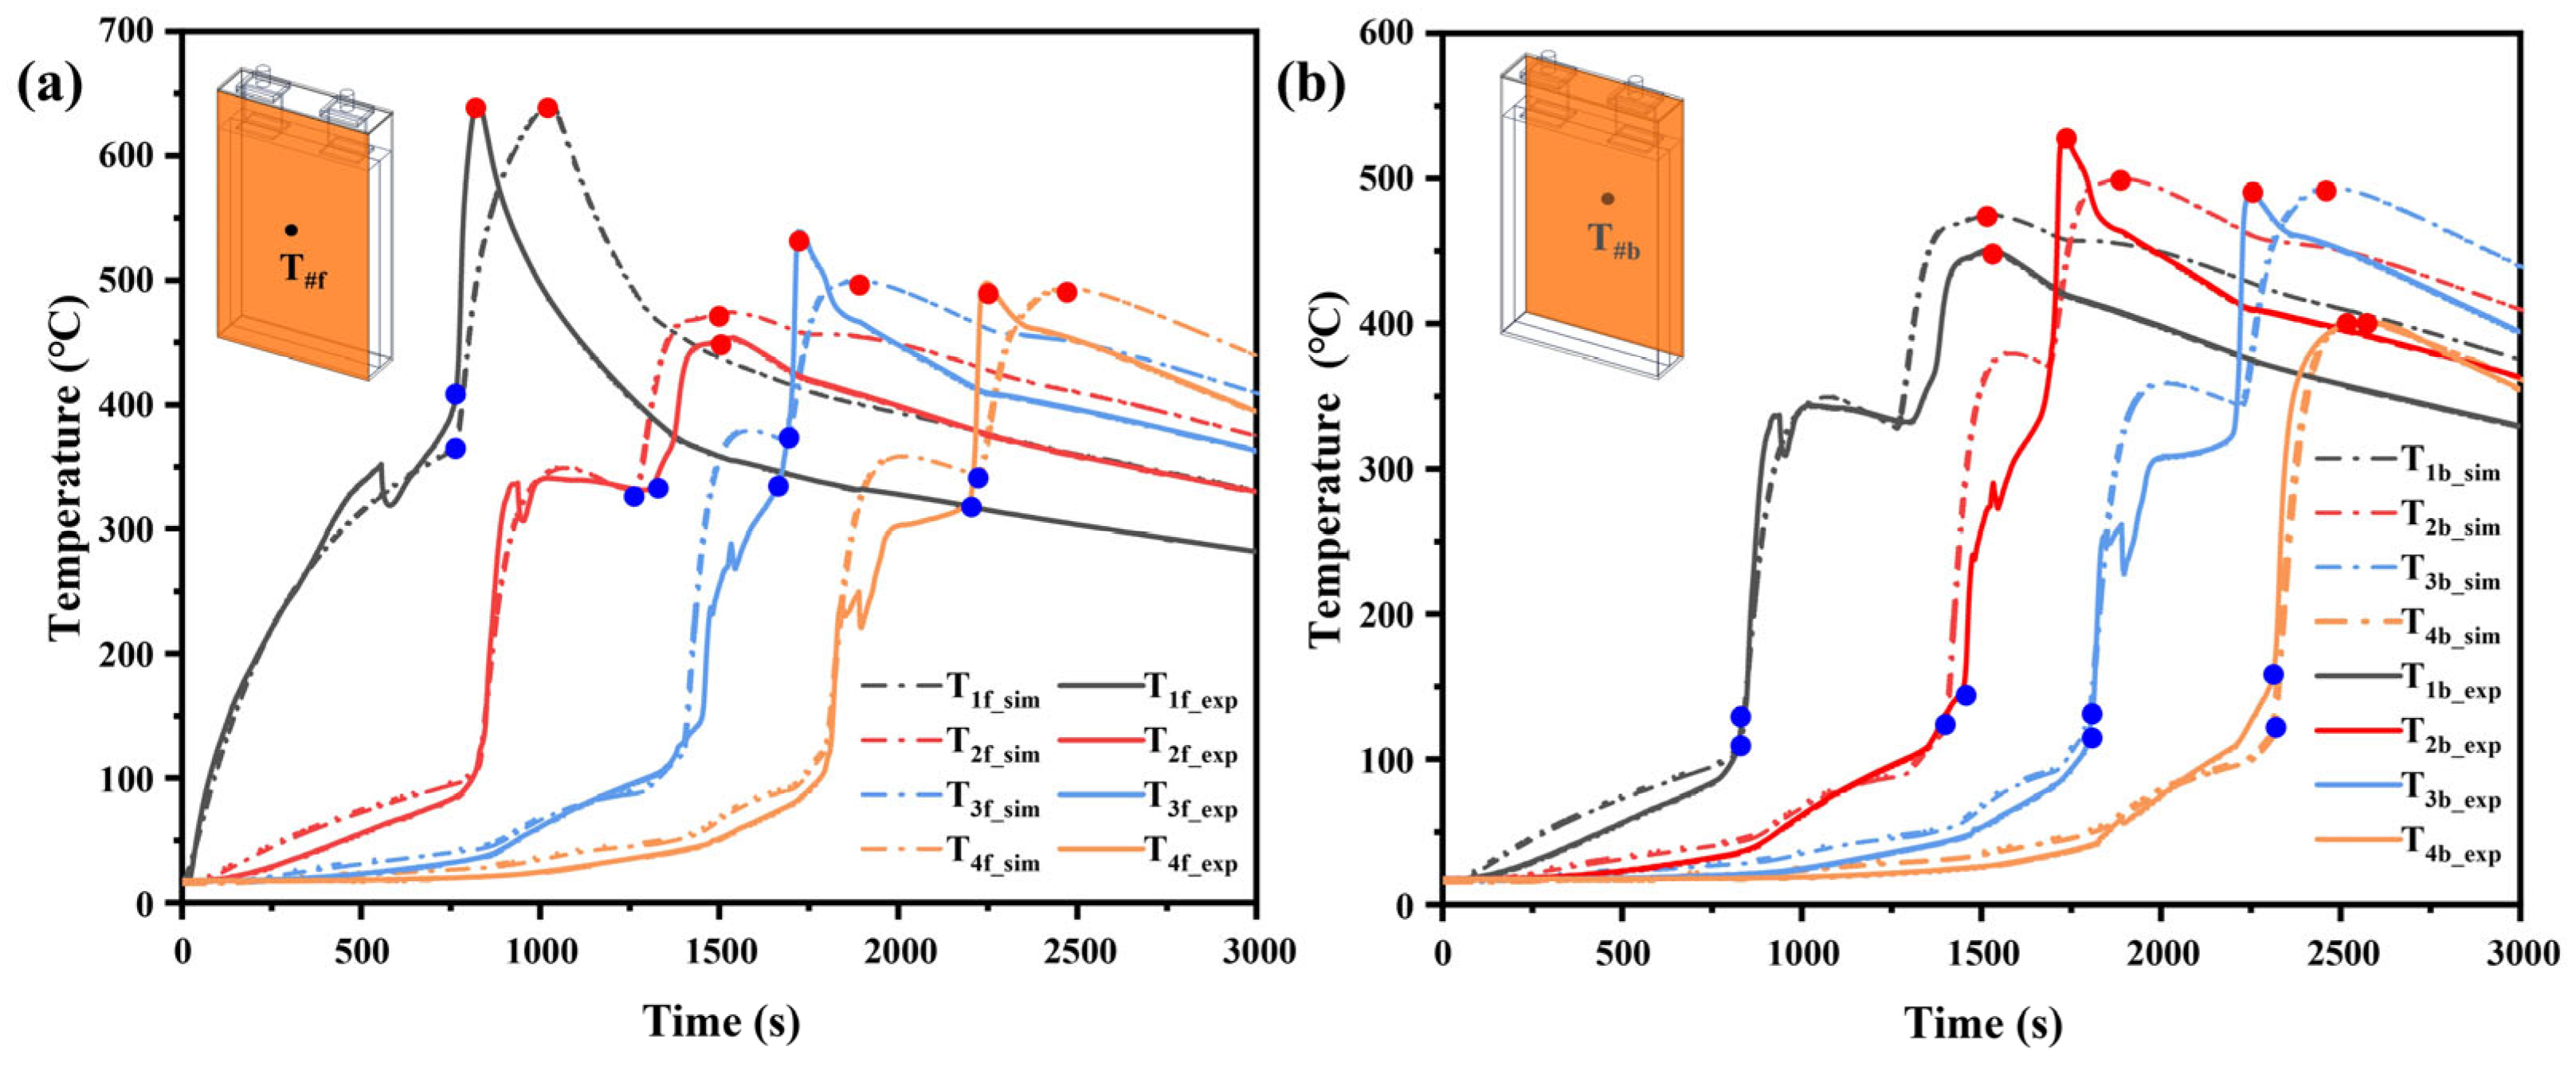
3.2.1. Model Validation
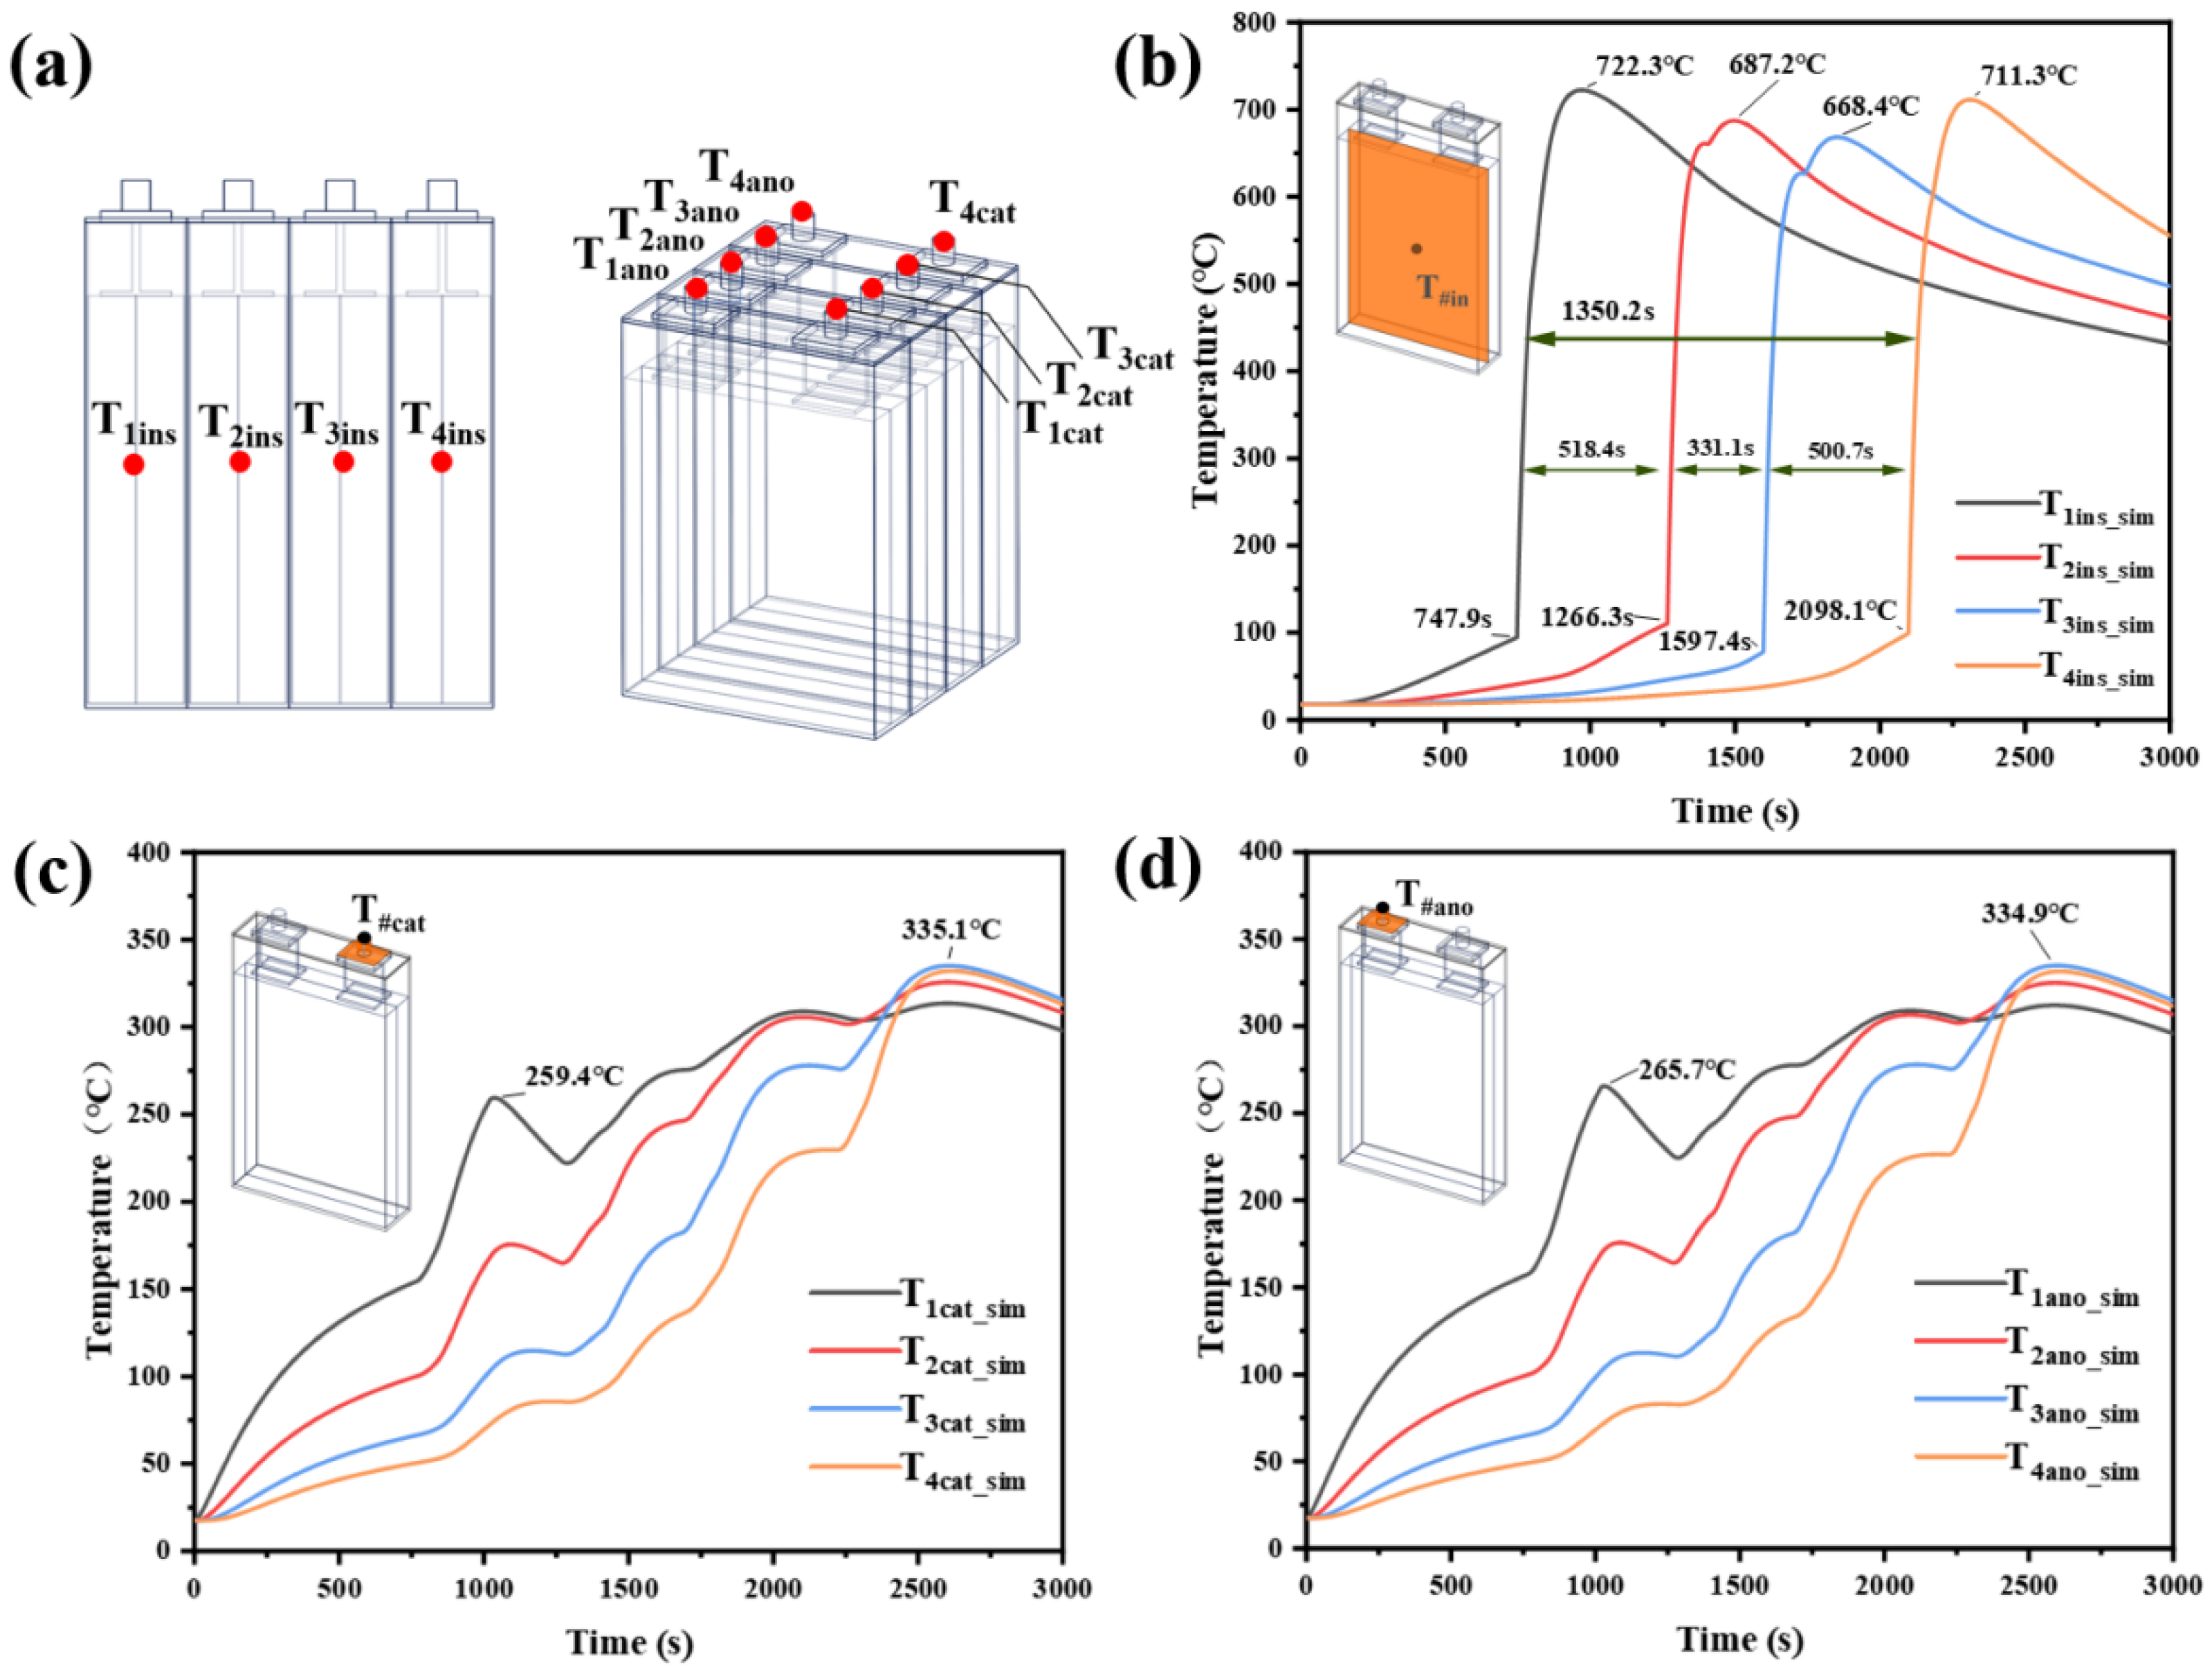
3.2.2. Model Prediction of Characteristic Location
- (1)
- Internal temperature predictions: As depicted in Figure 12b, the model predicts that the internal TR triggering times for Cells 1–4 are 747.9 s, 1266.3 s, 1597.4 s, and 2098.1 s, respectively. Due to the time required for heat transfer, the internal TR triggering times slightly precede those observed on the front surfaces of the cells. The maximum internal temperatures for each battery are 722.3 °C, 687.2 °C, 668.4 °C, and 711.3 °C, respectively. The energy for this temperature rise primarily originates from the energy input of the heating plate and the energy generated by the TR of the stacks. The total TRP time for the module is 1350.2 s, with inter-cell TRP times of 518.4 s, 331.1 s, and 500.7 s. The difference between the internal temperature and the surface temperature of the square-shell battery is more than 150 °C [37], and the difference between the simulated internal temperature and the surface temperature is 150–200 °C, which proves that the predicted temperature is within a reasonable range.
- (2)
- Tab temperature predictions: Figure 12c,d illustrates that as the TRP process progresses within the battery module, the temperatures of both cathode and anode tabs exhibit a wavelike increasing trend. This temperature rise is primarily attributed to heat conduction from the TR of the stacks to the current collectors and heat transfer from adjacent battery casings. The maximum temperatures of each tab ultimately reach approximately 355 °C. The slight differences between the tabs are primarily due to the higher thermal conductivity of the anode material copper compared to the cathode material aluminum.
3.2.3. Model Parameters’ Adjustment Analysis
Increasing the TR Triggering Temperature T2
Reducing the Total Heat Release ΔH
Increasing Convective Heat Transfer Coefficient h
Adding an Additional Insulation Layer
3.2.4. Simulation Efficiency Compared with FEM
3.3. Energy Flow Analysis
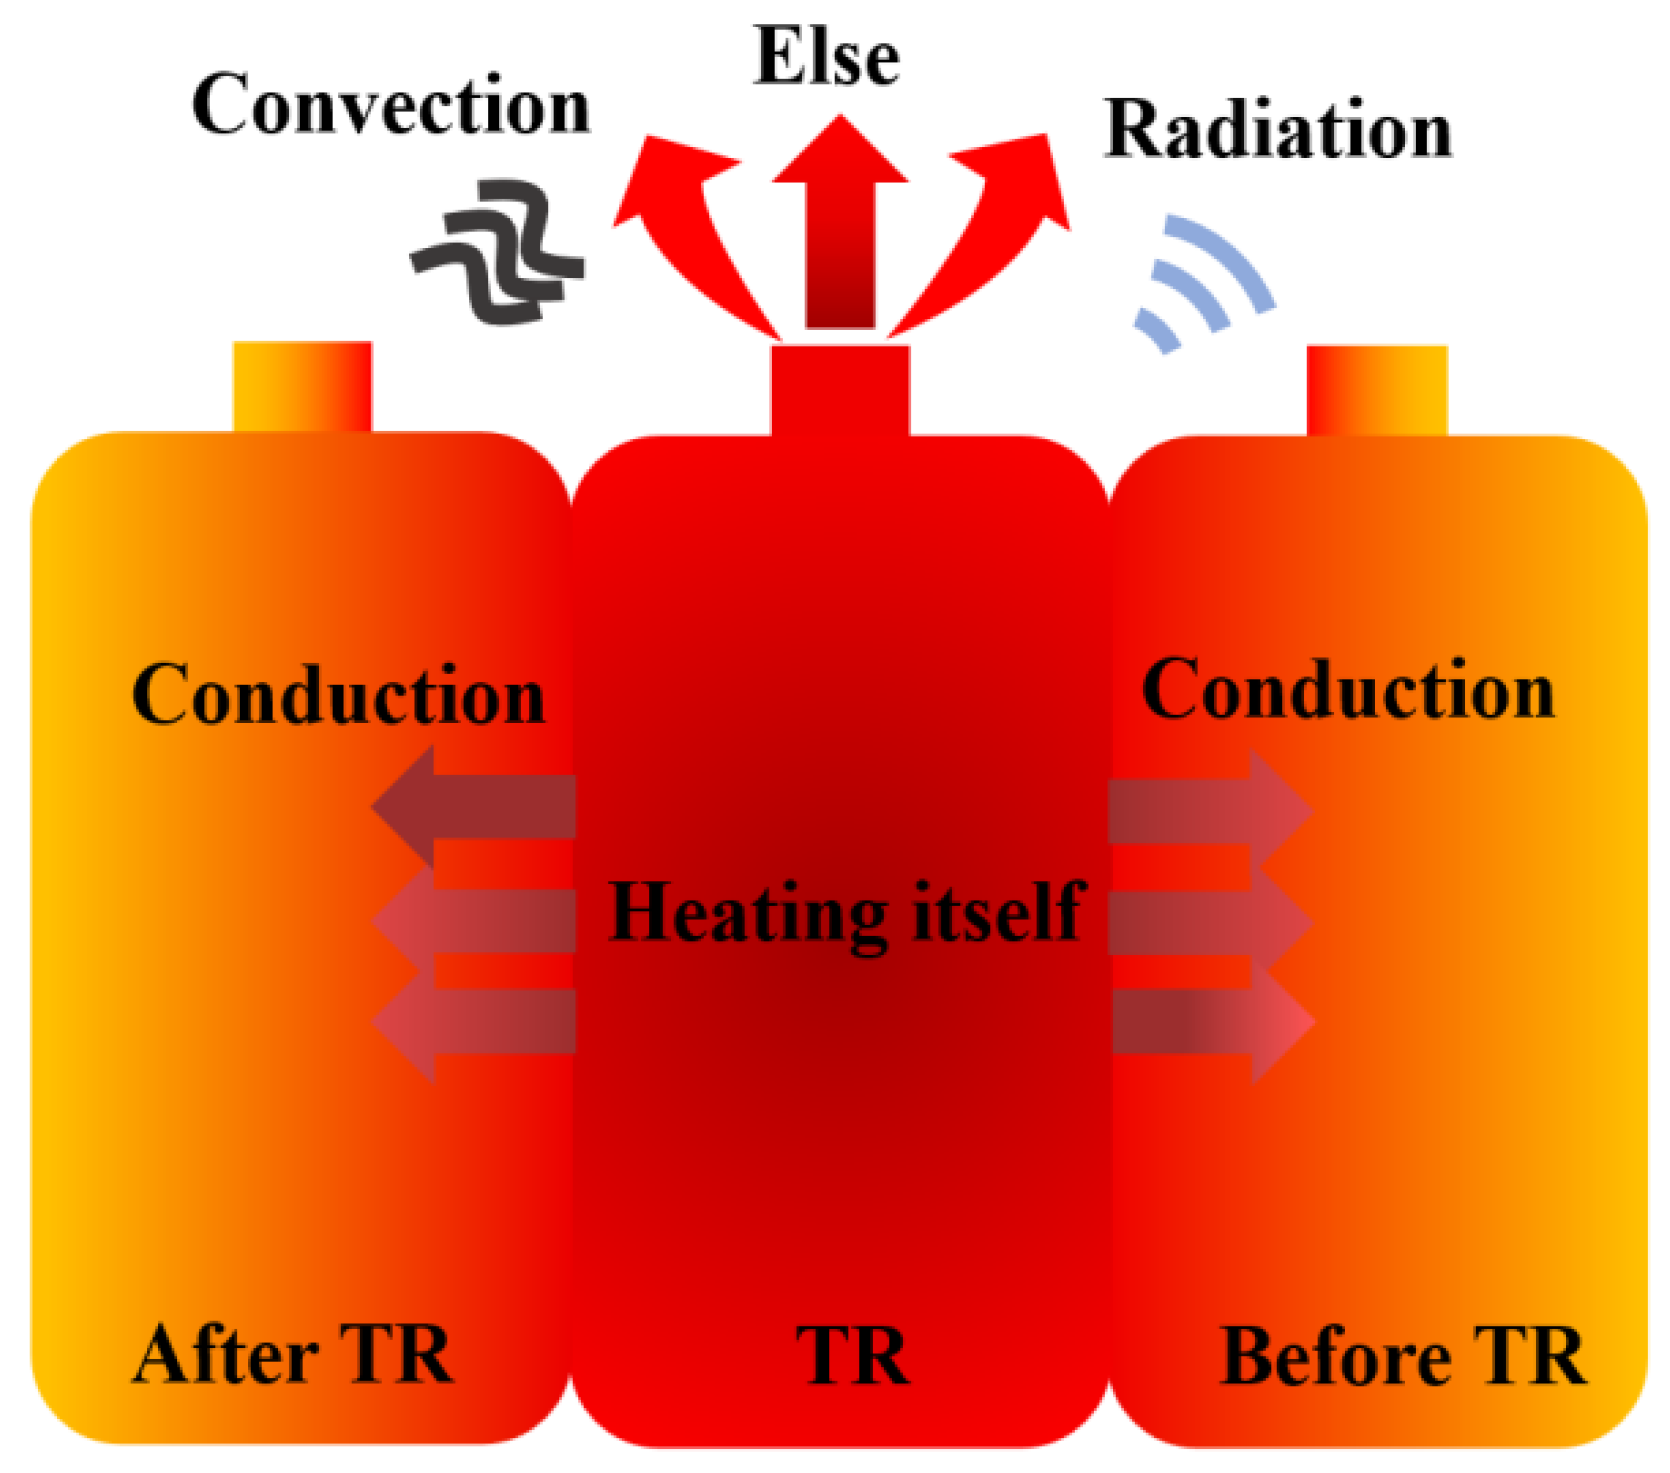
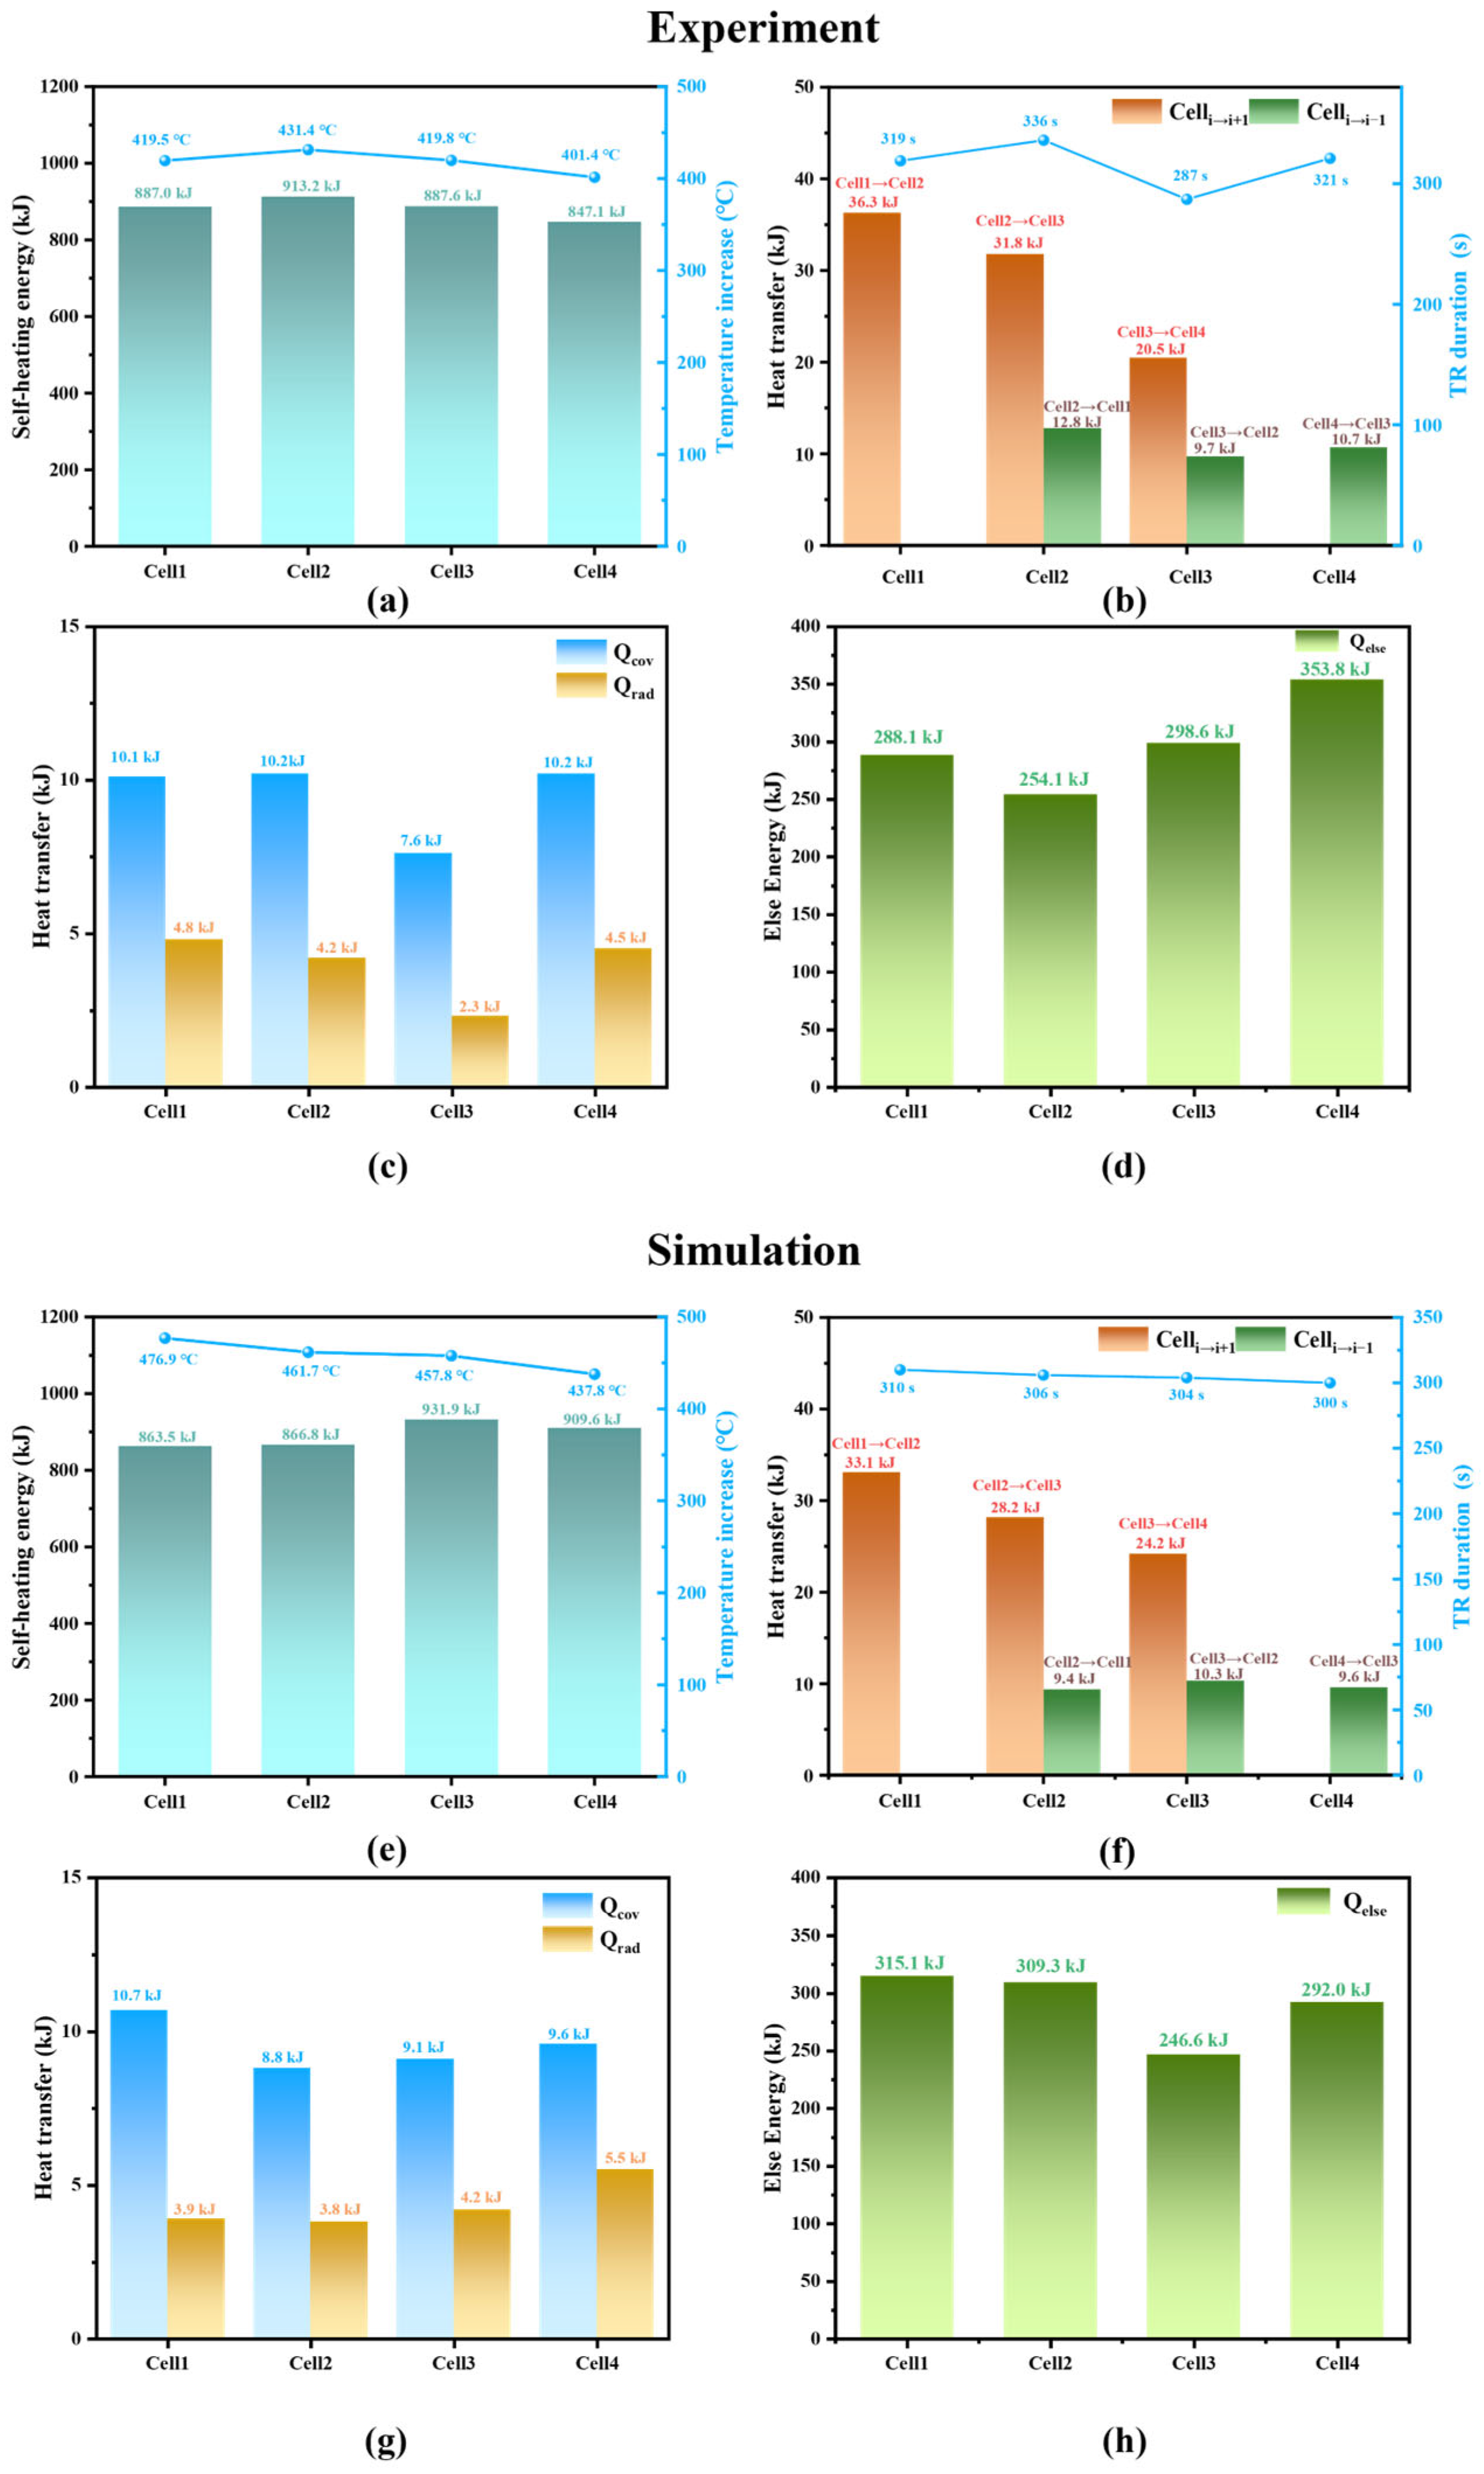
3.3.1. Energy Flow Composition
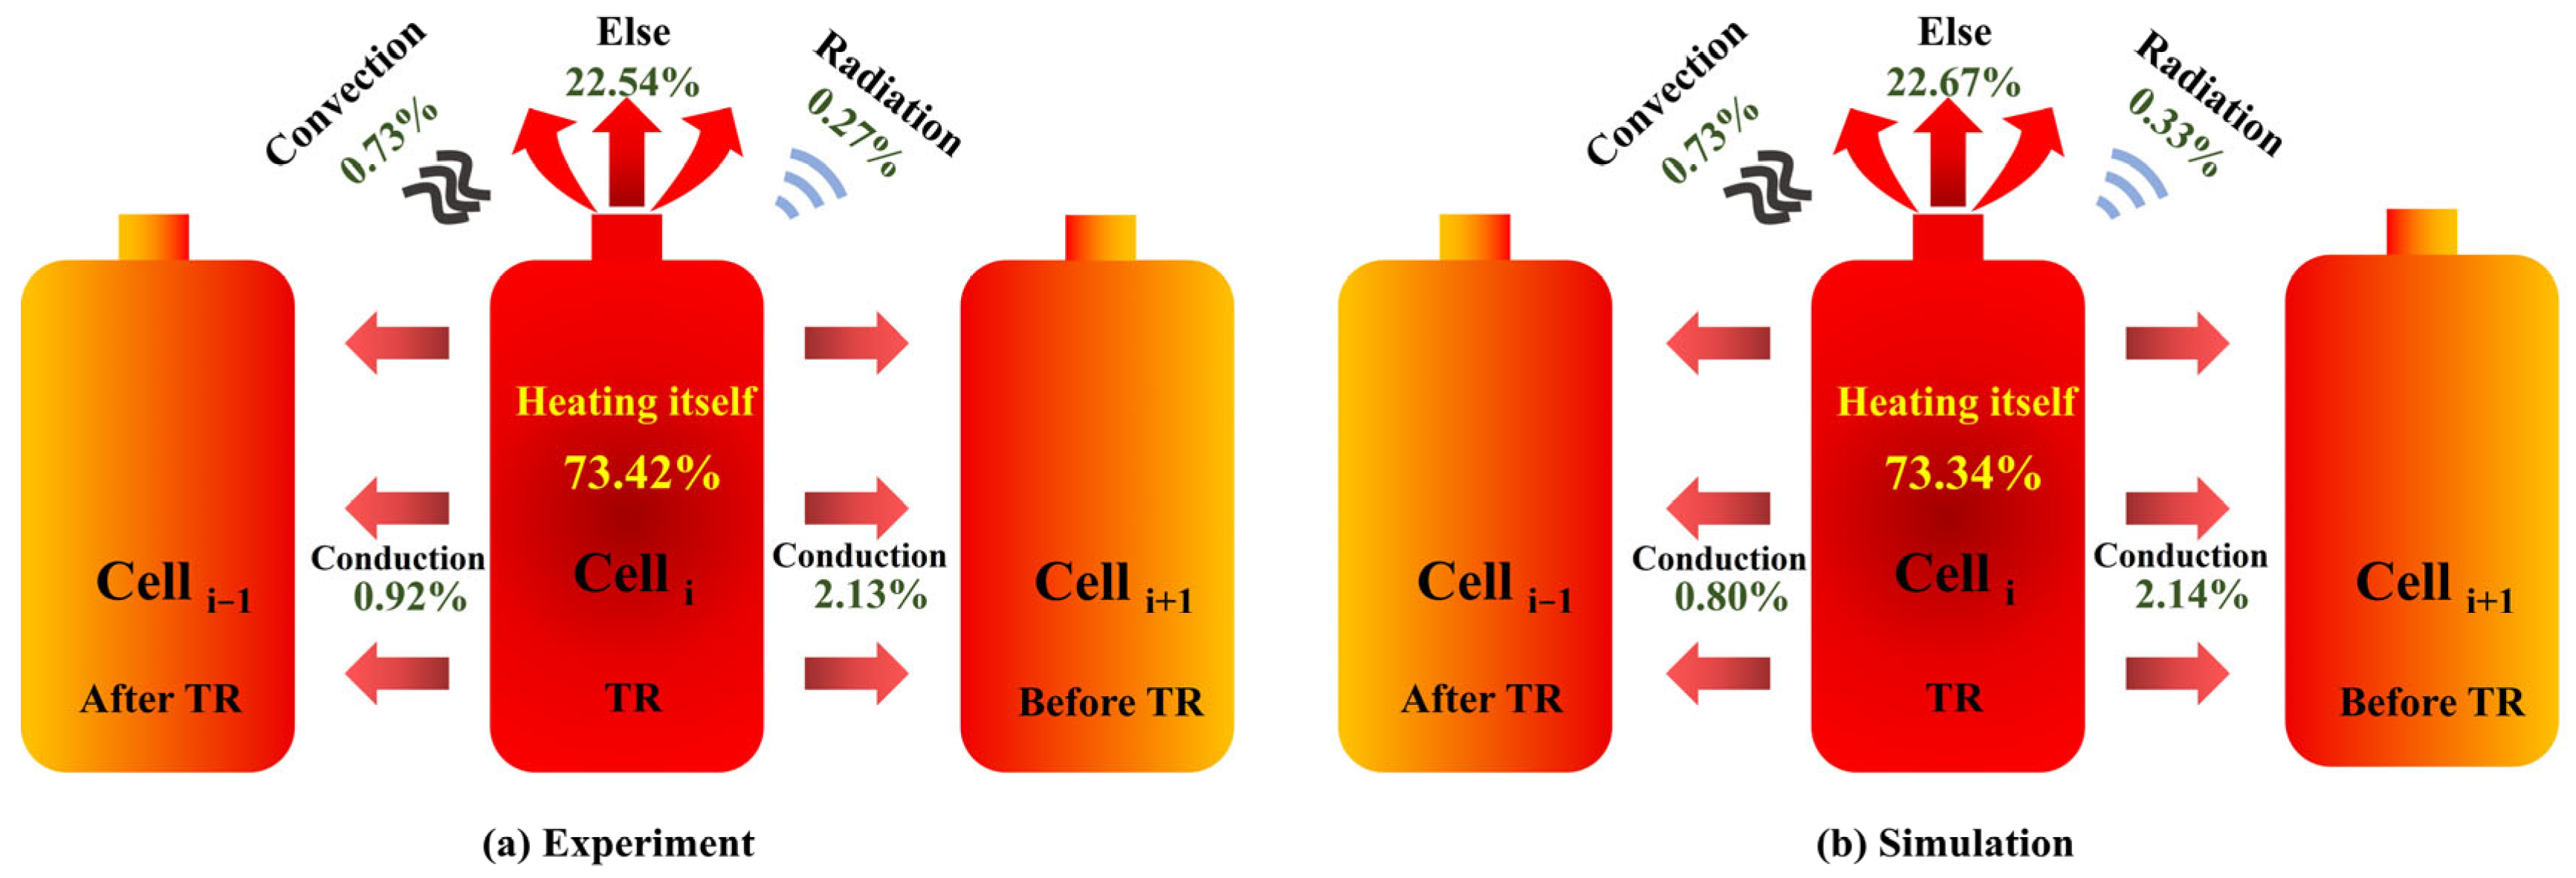
3.3.2. Energy Flow Distribution Characteristic
4. Conclusions
- (1)
- The experimental results of the battery module’s TRP indicate that the 100 Ah LFP battery module experienced TRP. The maximum surface temperatures of each cell range between 452.4 °C and 539.2 °C, and there is a time interval of 77 s to 118 s between the triggering of TR on the front and back surfaces of the battery. The MTD inside the battery is between 303.1 °C and 453.3 °C, and the internal TRP speed of the battery is approximately 0.12 mm/s.
- (2)
- The simulation results show that the ROM achieves good accuracy with critical feature errors within 10%. The model predicts that the internal maximum temperature of the four cells is approximately 700 °C, and the temperatures of the cathode and anode tabs show a wave-like increasing trend with a maximum temperature of about 355 °C. The total duration for the ROM is 8 min 54 s, while the FEM requires 328 min 49 s. The ROM can improve computational efficiency by approximately 40 times compared to the FEM.
- (3)
- The adjustment results of key model parameters indicate that increasing the TR triggering temperature T2 from 190 °C to 200 °C, reducing the total heat release ΔH from 100% to 90%, increasing the convective heat transfer coefficient h from 15 W·m−2·K−1 to 35 W·m−2·K−1, and adding a thermal resistance of hR = 100 W·m−2·K−1 can all suppress TRP in the battery module.
- (4)
- Energy flow calculations were performed based on the simulation and experimental results of the four cells, revealing the energy flow patterns during the TRP process of the cells within the module. Of the total energy released during TR of an individual cell within the module, more than 70% of the energy is used to heat itself, over 20% is lost through venting and other behaviors, about 2% is transferred to the next cell, 1% is transferred to the previous cell, and approximately 1% is dissipated through convection and radiation.
Author Contributions
Funding
Data Availability Statement
Conflicts of Interest
References
- Li, Q.; Yu, X.; Li, H. Batteries: From China’s 13th to 14th Five-Year Plan. eTransportation 2022, 14, 100201. [Google Scholar] [CrossRef]
- Yang, M.; Rong, M.; Ye, Y.; Yang, A.; Chu, J.; Yuan, H.; Wang, X. Comprehensive analysis of gas production for commercial LiFePO4 batteries during overcharge-thermal runaway. J. Energy Storage 2023, 72, 108323. [Google Scholar] [CrossRef]
- Liu, X.; Wang, M.; Cao, R.; Lyu, M.; Zhang, C.; Li, S.; Guo, B.; Zhang, L.; Zhang, Z.; Gao, X. Review of Abnormality Detection and Fault Diagnosis Methods for Lithium-Ion Batteries. Automot. Innov. 2023, 6, 256–267. [Google Scholar] [CrossRef]
- Huang, Z.; Liu, J.; Zhai, H.; Wang, Q. Experimental investigation on the characteristics of thermal runaway and its propagation of large-format lithium ion batteries under overcharging and overheating conditions. Energy 2021, 233, 121103. [Google Scholar] [CrossRef]
- Zhao, C.; Wang, T.; Huang, Z.; Wu, J.; Wang, Q. Experimental study on thermal runaway of fully charged and overcharged lithium-ion batteries under adiabatic and side-heating test. J. Energy Storage 2021, 38, 102519. [Google Scholar] [CrossRef]
- Zhang, G.; Wei, X.; Chen, S.; Zhu, J.; Han, G.; Dai, H. Unlocking the thermal safety evolution of lithium-ion batteries under shallow over-discharge. J. Power Sources 2022, 521, 230990. [Google Scholar] [CrossRef]
- Jia, Z.; Wang, S.; Qin, P.; Li, C.; Song, L.; Cheng, Z.; Jin, K.; Sun, J.; Wang, Q. Comparative investigation of the thermal runaway and gas venting behaviors of large-format LiFePO4 batteries caused by overcharging and overheating. J. Energy Storage 2023, 61, 106791. [Google Scholar] [CrossRef]
- Kong, D.; Wang, G.; Ping, P.; Wen, J. Numerical investigation of thermal runaway behavior of lithium-ion batteries with different battery materials and heating conditions. Appl. Therm. Eng. 2021, 189, 116661. [Google Scholar] [CrossRef]
- Sun, Y.; Jin, Y.; Jiang, Z.; Li, L. A review of mitigation strategies for li-ion battery thermal runaway. Eng. Fail. Anal. 2023, 149, 107259. [Google Scholar] [CrossRef]
- Bai, J.; Wang, Z.; Gao, T.; Bai, W.; Wang, J. Effect of mechanical extrusion force on thermal runaway of lithium-ion batteries caused by flat heating. J. Power Sources 2021, 507, 230305. [Google Scholar] [CrossRef]
- Jones, C.; Sudarshan, M.; Serov, A.; Tomar, V. Investigation of physical effects on prismatic lithium-ion cell electrodes after partial nail puncture using Raman spectroscopy and incremental capacity analysis. eTransportation 2022, 12, 100174. [Google Scholar] [CrossRef]
- Mao, B.; Chen, H.; Cui, Z.; Wu, T.; Wang, Q. Failure mechanism of the lithium ion battery during nail penetration. Int. J. Heat Mass Transf. 2018, 122, 1103–1115. [Google Scholar] [CrossRef]
- Zhou, G.; Liu, Y.; Li, Y.; Yang, S.; Zhang, Q.; Wang, J.; Kong, Y.; Niklas, K.; Yu, W. Experimental study on the thermal runaway acceleration mechanism and characteristics of NCM811 lithium-ion battery with critical thermal load induced by nail penetration. J. Clean. Prod. 2024, 434, 12. [Google Scholar] [CrossRef]
- Zhu, M.; Yao, J.; Qian, F.; Luo, W.; Chen, Y.; Zhao, L.; Chen, M. Study on Thermal Runaway Propagation Characteristics of Lithium Iron Phosphate Battery Pack under Different SOCs. Electronics 2022, 12, 200. [Google Scholar] [CrossRef]
- Schberl, J.; Ank, M.; Schreiber, M.; Wassiliadis, N.; Lienkamp, M. Thermal runaway propagation in automotive lithium-ion batteries with NMC-811 and LFP cathodes: Safety requirements and impact on system integration. eTransportation 2024, 19, 100305. [Google Scholar] [CrossRef]
- Huang, Z.; Li, X.; Wang, Q.; Duan, Q.; Li, Y.; Li, L.; Wang, Q. Experimental investigation on thermal runaway propagation of large format lithium ion battery modules with two cathodes. Int. J. Heat Mass Transf. 2021, 172, 121077. [Google Scholar] [CrossRef]
- Chen, H.; Yang, K.; Liu, Y.; Zhang, M.; Liu, H.; Liu, J.; Qu, Z.; Lai, Y. Experimental Investigation of Thermal Runaway Behavior and Hazards of a 1440 Ah LiFePO4 Battery Pack. Energies 2023, 16, 3398. [Google Scholar] [CrossRef]
- Zhai, H.; Chi, M.; Li, J.; Li, D.; Huang, Z.; Jia, Z.; Sun, J.; Wang, Q. Thermal runaway propagation in large format lithium ion battery modules under inclined ceilings. J. Energy Storage 2022, 51, 104477. [Google Scholar] [CrossRef]
- Zhu, M.; Zhang, S.; Chen, Y.; Zhao, L.; Chen, M. Experimental and analytical investigation on the thermal runaway propagation characteristics of lithium-ion battery module with NCM pouch cells under various state of charge and spacing. J. Energy Storage 2023, 72, 108380. [Google Scholar] [CrossRef]
- Song, L.; Huang, Z.; Mei, W.; Jia, Z.; Yu, Y.; Wang, Q.; Jin, K. Thermal runaway propagation behavior and energy flow distribution analysis of 280 Ah LiFePO4 battery. Process Saf. Environ. Prot. 2023, 170, 1066–1078. [Google Scholar] [CrossRef]
- Wang, G.; Ping, P.; Peng, R.; Lv, H.; Zhao, H.; Gao, W.; Kong, D. A semi reduced-order model for multi-scale simulation of fire propagation of lithium-ion batteries in energy storage system. Renew. Sustain. Energy Rev. 2023, 186, 113672. [Google Scholar] [CrossRef]
- Smyshlyaev, A.; Krstic, M.; Chaturvedi, N.; Ahmed, J.; Kojic, A. PDE Model for Thermal Dynamics of a Large Li-ion Battery Pack. In Proceedings of the American Control Conference, San Francisco, CA, USA, 29 June–1 July 2011. [Google Scholar]
- Yeow, K.F.; Ho, T. Characterizing Thermal Runaway of Lithium-ion Cells in a Battery System Using Finite Element Analysis Approach. SAE Int. J. Altern. Powertrains 2013, 2, 179–186. [Google Scholar] [CrossRef]
- Spotnitz, R.M.; Weaver, J.; Yeduvaka, G. Simulation of abuse tolerance of lithium-ion battery packs. J. Power Sources 2007, 163, 1080–1086. [Google Scholar] [CrossRef]
- Wang, G.; Gao, W.; He, X.; Peng, R.; Zhang, Y.; Dai, X.; Ping, P.; Kong, D. Numerical investigation on thermal runaway propagation and prevention in cell-to-chassis lithium-ion battery system. Appl. Therm. Eng. 2024, 236, 121528. [Google Scholar] [CrossRef]
- He, C.X.; Liu, Y.H.; Huang, X.Y.; Wan, S.B.; Lin, P.Z.; Huang, B.L.; Sun, J.; Zhao, T.S. A reduced-order thermal runaway network model for predicting thermal propagation of lithium-ion batteries in large-scale power systems. Appl. Energy 2024, 373, 123955. [Google Scholar] [CrossRef]
- Coman, P.T.; Darcy, E.C.; Veje, C.T.; White, R.E. Numerical analysis of heat propagation in a battery pack using a novel technology for triggering thermal runaway. Appl. Energy 2017, 203, 189–200. [Google Scholar] [CrossRef]
- Liu, J.; Wang, L.; Wang, J.; Pan, R.; Zhou, X. Experimental and simulated study of thermal runaway characteristics of 16Ah nickel-cobalt-manganese (523) square soft-pack lithium-ion battery. Appl. Therm. Eng. 2024, 242, 122449. [Google Scholar] [CrossRef]
- Mishra, D.; Jain, A. Multi-Mode Heat Transfer Simulations of the Onset and Propagation of Thermal Runaway in a Pack of Cylindrical Li-Ion Cells. J. Electrochem. Soc. 2021, 168, 020504. [Google Scholar] [CrossRef]
- Wang, J.; Mei, W.; Cui, Z.; Shen, W.; Duan, Q.; Jin, Y.; Nie, J.; Tian, Y.; Wang, Q.; Sun, J. Experimental and numerical study on penetration-induced internal short-circuit of lithium-ion cell. Appl. Therm. Eng. 2020, 171, 115082. [Google Scholar] [CrossRef]
- Asgari, S.; Hu, X.; Tsuk, M.; Kaushik, S. Application of POD plus LTI ROM to Battery Thermal Modeling: SISO Case. SAE Int. J. Commer. Veh. 2014, 7, 278–285. [Google Scholar] [CrossRef]
- Rudnyi, E.B. Effective Electrothermal Simulation for Battery Pack and Power Electronics in HEV/EV. 2009. Available online: https://www.researchgate.net/publication/229006268_Effective_Electrothermal_Simulation_for_Battery_Pack_and_Power_Electronics_in_HEVEV (accessed on 5 February 2025).
- Xu, C.; Wang, H.; Jiang, F.; Feng, X.; Lu, L.; Jin, C.; Zhang, F.; Huang, W.; Zhang, M.; Ouyang, M. Modelling of thermal runaway propagation in lithium-ion battery pack using reduced-order model. Energy 2023, 268, 126646. [Google Scholar] [CrossRef]
- Brush, S.G. The Development of the Kinetic Theory of Gases: VII. Heat Conduction and the Stefan-Boltzmann Law. Arch. Hist. Exact Sci. 1973, 11, 38–96. [Google Scholar] [CrossRef]
- Feng, X.; Zheng, S.; Ren, D.; He, X.; Wang, L.; Cui, H.; Liu, X.; Jin, C.; Zhang, F.; Xu, C. Investigating the thermal runaway mechanisms of lithium-ion batteries based on thermal analysis database. Appl. Energy 2019, 246, 53–64. [Google Scholar] [CrossRef]
- Wang, Q.; Wang, H.; Xu, C.; Jin, C.; Wang, S.; Xu, L.; Ouyang, J.; Feng, X. Multidimensional fire propagation of lithium-ion phosphate batteries for energy storage. eTransportation 2024, 20, 100328. [Google Scholar] [CrossRef]
- Xu, C.; Feng, X.; Huang, W.; Duan, Y.; Chen, T.; Gao, S.; Lu, L.; Jiang, F.; Ouyang, M. Internal temperature detection of thermal runaway in lithium-ion cells tested by extended-volume accelerating rate calorimetry. J. Energy Storage 2020, 31, 101670. [Google Scholar] [CrossRef]
- Li, W.; Ostanek, J. Heat transfer experiments and correlations for vent gases emerging from a Li-ion battery and impinging on a flat surface. Int. J. Heat Mass Transf. 2023, 200, 123516. [Google Scholar] [CrossRef]


| Parameters | Value |
|---|---|
| Cathode | Lithium iron phosphate |
| Anode | Graphite |
| Nominal voltage | 3.2 V |
| Nominal capacity | 100 Ah |
| Upper voltage limit | 3.65 V |
| Lower voltage limit | 2.5 V |
| Maximum charging rate | 2 C |
| Maximum discharge rate | 4 C |
| Mass | 2245 ± 5 g |
| Size (length × width × height) | 130 × 36 × 211.8 mm |
| State of charge | 100% |
| Component | Material | ρ (kg·m−3) | Cp (J·kg−1·K−1) | λ (W·m−1·K−1) |
|---|---|---|---|---|
| Shell | Aluminum alloy | 2770 | 875 | 170 |
| Stack | Stack composite material | 2407.7 | 985.3 | λx = λy = 24.93; λz = 0.98 |
| Cathode | Aluminum | 2689 | 951 | 237.5 |
| Anode | Copper | 8933 | 385 | 400 |
| Heater | Stainless steel | 7750 | 480 | 15.1 |
| Mica plate | Mica | 2500 | 500 | 0.34 |
| Holder | Aluminum alloy | 2770 | 875 | 170 |
| Matrix | Formula | Influence Factors |
|---|---|---|
| [A] | ρ; Cp | |
| [C] | λ; h | |
| [L] | h | |
| [u] | q; T∞ |
| Characteristic Temperature | T1 | T2 | T3adj |
|---|---|---|---|
| Values (°C) | 116.6 | 179.7 | 672.4 |
| Time (min) | 2069.40 | 3187.85 | 3204.09 |
| Cell i | Cell 1 | Cell 2 | Cell 3 | Cell 4 |
|---|---|---|---|---|
| Before test (g) | 2243.3 | 2247.4 | 2242.4 | 2240.7 |
| After test (g) | 1800.5 | 1796 | 1818.5 | 1804.5 |
| Mass loss (g) | 442.8 | 451.4 | 423.9 | 436.2 |
| Mass loss rate | 19.74% | 20.09% | 18.90% | 19.47% |
| Position | Symbol | Triggering Time (s) | Maximum Temperature (°C) | ||||
|---|---|---|---|---|---|---|---|
| Sim | Exp | Error | Sim | Exp | Error | ||
| Front | T1f | 763 | 762 | 0.13% | 644.7 | 640.1 | 0.72% |
| T2f | 1263 | 1337 | 5.53% | 475.0 | 452.4 | 5.00% | |
| T3f | 1684 | 1690 | 0.36% | 500.0 | 539.2 | 7.27% | |
| T4f | 2221 | 2200 | 0.95% | 493.8 | 497.9 | 0.82% | |
| Back | T1b | 848 | 827 | 2.54% | 475.1 | 451.4 | 5.25% |
| T2b | 1455 | 1398 | 4.08% | 500.3 | 529.8 | 5.57% | |
| T3b | 1807 | 1797 | 0.56% | 493.7 | 490.8 | 0.59% | |
| T4b | 2318 | 2308 | 0.43% | 402.1 | 401.5 | 0.15% | |
| Category | Duration |
|---|---|
| ROM (Order reduction and Calculation) | 8 min 45 s |
| FEM | 328 min 49 s |
Disclaimer/Publisher’s Note: The statements, opinions and data contained in all publications are solely those of the individual author(s) and contributor(s) and not of MDPI and/or the editor(s). MDPI and/or the editor(s) disclaim responsibility for any injury to people or property resulting from any ideas, methods, instructions or products referred to in the content. |
© 2025 by the authors. Licensee MDPI, Basel, Switzerland. This article is an open access article distributed under the terms and conditions of the Creative Commons Attribution (CC BY) license (https://creativecommons.org/licenses/by/4.0/).
Share and Cite
Li, H.; Xu, C.; Wang, Y.; Zhang, X.; Zhang, Y.; Zhang, M.; Wang, P.; Shi, H.; Lu, L.; Feng, X. Experimental and Reduced-Order Modeling Research of Thermal Runaway Propagation in 100 Ah Lithium Iron Phosphate Battery Module. Batteries 2025, 11, 109. https://doi.org/10.3390/batteries11030109
Li H, Xu C, Wang Y, Zhang X, Zhang Y, Zhang M, Wang P, Shi H, Lu L, Feng X. Experimental and Reduced-Order Modeling Research of Thermal Runaway Propagation in 100 Ah Lithium Iron Phosphate Battery Module. Batteries. 2025; 11(3):109. https://doi.org/10.3390/batteries11030109
Chicago/Turabian StyleLi, Han, Chengshan Xu, Yan Wang, Xilong Zhang, Yongliang Zhang, Mengqi Zhang, Peiben Wang, Huifa Shi, Languang Lu, and Xuning Feng. 2025. "Experimental and Reduced-Order Modeling Research of Thermal Runaway Propagation in 100 Ah Lithium Iron Phosphate Battery Module" Batteries 11, no. 3: 109. https://doi.org/10.3390/batteries11030109
APA StyleLi, H., Xu, C., Wang, Y., Zhang, X., Zhang, Y., Zhang, M., Wang, P., Shi, H., Lu, L., & Feng, X. (2025). Experimental and Reduced-Order Modeling Research of Thermal Runaway Propagation in 100 Ah Lithium Iron Phosphate Battery Module. Batteries, 11(3), 109. https://doi.org/10.3390/batteries11030109