Article

Remaining Available Energy Prediction for Energy Storage Batteries Based on Interpretable Generalized Additive Neural Network

1
Shenzhen Power Supply Co., Ltd., Guangdong Provincial Key Laboratory of Source-Grid-Load-Storage Interactive Collaborative Technology (No. 2024B1212020004), Shenzhen 518000, China
2
School of Electrical Engineering, Beijing Jiaotong University, Beijing 100091, China
3
National Active Distribution Network Technology Research Center, Beijing Jiaotong University, Beijing 100044, China
*
Author to whom correspondence should be addressed.
Batteries 2025, 11(7), 276; https://doi.org/10.3390/batteries11070276 (registering DOI)
Submission received: 24 June 2025 / Revised: 11 July 2025 / Accepted: 18 July 2025 / Published: 20 July 2025
(This article belongs to the Special Issue Advances in Lithium-Ion Battery Safety and Fire: 2nd Edition)

Abstract

Precise estimation of the remaining available energy in batteries is not only key to improving energy management efficiency, but also serves as a critical safeguard for ensuring the safe operation of battery systems. To address the challenges associated with energy state estimation under dynamic operating conditions, this study proposes a method for predicting the remaining available energy of energy storage batteries based on an interpretable generalized additive neural network (IGANN). First, considering the variability in battery operating conditions, the study designs a battery working voltage threshold that accounts for safety margins and proposes an available energy state assessment metric, which enhances prediction consistency under different discharge conditions. Subsequently, 12 features are selected from both direct observation and statistical characteristics to capture the operating condition information of the battery, and a dataset is constructed using actual operational data from an energy storage station. Finally, the model is trained and validated on the feature dataset. The validation results show that the model achieves an average absolute error of 2.39%, indicating that it effectively captures the energy variation characteristics within the 0.2 C to 0.6 C dynamic current range. Furthermore, the contribution of each feature is analyzed based on the model’s interpretability, and the model is optimized by utilizing high-contribution features. This optimization improves both the accuracy and runtime efficiency of the model. Finally, a dynamic prediction is conducted for a discharge cycle, comparing the predictions of the IGANN model with those of three other machine learning methods. The IGANN model demonstrates the best performance, with the average absolute error consistently controlled within 3%, proving the model’s accuracy and robustness under complex conditions.

1. Introduction

Energy storage batteries are widely used in fields such as grid peak shaving, energy storage, and backup power, providing essential support for the efficient operation of power systems [1]. Among these, lithium-ion batteries have become an important component of modern energy storage stations in new power systems due to their high energy density, fast response capability, and modular deployment advantages [2]. The remaining available energy (ERAE) of a battery directly represents the amount of energy that can be released under various operating conditions [3]. The dynamic perception and assessment of the remaining energy state can effectively prevent safety incidents such as over-discharge and thermal runaway, providing data support for power dispatch optimization and fault prediction in various scenarios. However, due to the complex operating conditions encountered during the operation of energy storage stations [4], real-time prediction of ERAE presents significant challenges.
Several methods have been proposed for estimating ERAE, which can be categorized as direct calculation methods, model-driven filtering algorithms, condition-based prediction methods, and machine learning-based methods. The direct calculation method treats the remaining energy state of the battery as an extension of the state of charge (SOC) [5]. The calculation is performed by subtracting the accumulated discharge from the nominal capacity and then taking the ratio relative to the nominal capacity. The accumulated discharge is calculated as the product of the battery’s nominal capacity, nominal voltage, and the change in SOC. However, during actual discharge, the battery voltage is significantly affected by operational conditions, such as current and temperature, and the nominal voltage is inadequate for representing dynamic voltage responses, leading to considerable estimation errors. Therefore, the direct calculation method is only suitable for static conditions and lacks accuracy under dynamic operating conditions.
In recent years, many studies have focused on calculating the ERAE of batteries using model-driven filtering algorithms. Wang et al. [6,7] combined an equivalent circuit model (ECM) with a particle filter (PF) to achieve a state of energy (SOE) estimation error of less than 3% under both constant current and dynamic current conditions. Li et al. [8] designed a multi-step model parameter identification method and used an adaptive fractional order extended Kalman filter (AF-EKF) to accurately estimate the battery SOE. Shen et al. [9] proposed a hybrid method that combines particle swarm optimization (PSO) with a forgetting factor recursive least squares (RLS) and an improved curve-growing PSO-based extended particle filter algorithm. This method was validated under different temperature conditions to demonstrate the accuracy of the predictions. Zhang et al. [10] analyzed the energy characteristics of the battery under different operating temperatures and developed a multi-timescale unscented Kalman filter (UKF) to estimate the battery’s terminal voltage and remaining energy. These methods estimate the SOE and derive the ERAE using an ECM combined with state observers such as a Kalman filter (KF) and PF. Although these methods yield relatively accurate ERAE estimates, the accuracy of these methods under real dynamic operating conditions requires further research.
The advantage of condition-based prediction methods for ERAE is that they effectively address the issue of low accuracy under complex operating conditions. Ren et al. [5] employed an RLS method to identify the parameters of an ECM to simulate the battery voltage response. Using historical data, they iteratively predicted the battery state during future discharge processes to estimate the remaining discharge energy, with the performance validated under dynamic current and temperature conditions. Lai et al. [4] proposed an ERAE estimation method based on average operating conditions prediction and multi-parameter updates. This method recognizes the battery’s ohmic resistance online, incorporates a temperature-aging factor to account for battery aging and temperature variations, and then predicts based on average operating conditions. However, these ERAE prediction methods have only been validated under known current and temperature inputs, without predicting future operating conditions, which significantly limits their practical application.
With the rapid development and continuous innovation of neural networks and machine learning technologies, various advanced machine learning algorithms are increasingly being applied in battery management systems, demonstrating significant advantages in the accurate estimation of ERAE. Liu et al. [11] used back-propagation neural networks (BPNN) to establish nonlinear mapping relationships. Ma et al. [12] investigated a novel method for estimating the SOC and SOE of lithium-ion batteries using a deep learning approach based on the long short-term memory (LSTM) neural network. Deng et al. [13] proposed a data-driven algorithm, the least squares support vector machine (LSSVM), to estimate the maximum available energy, considering the effects of temperature and degradation. Tu et al. [14] addressed the issue of battery energy availability depending on its c-rate by proposing a machine learning method based on a feedforward neural network (FNN) to predict the remaining discharge energy under any C-rate and predefined voltage and temperature cutoff limits. Dong et al. [15] proposed a novel method for estimating SOE of lithium-ion batteries. The method combines a wavelet neural network (WNN) model with a PF estimator to improve the accuracy and robustness of SOE estimation. Although machine learning algorithms offer high accuracy after training, they rely on large datasets and have limited generalization ability. Furthermore, present studies are confined to laboratory test data and have not been validated under real operational environments, making it difficult to fully assess the model’s robustness under dynamic conditions, temperature variations, and other practical factors.
To address the issues of insufficient adaptability to dynamic operating conditions and the lack of validation using real operational data in existing studies, this paper proposes a machine learning method based on real battery operational data. The method utilizes the IGANN model to estimate the ERAE. Using historical battery data as the model dataset, the method considers the impact of dynamic operating conditions on the ERAE of the battery and validates the accuracy of the results under real operational data. The specific contributions of this paper are as follows:
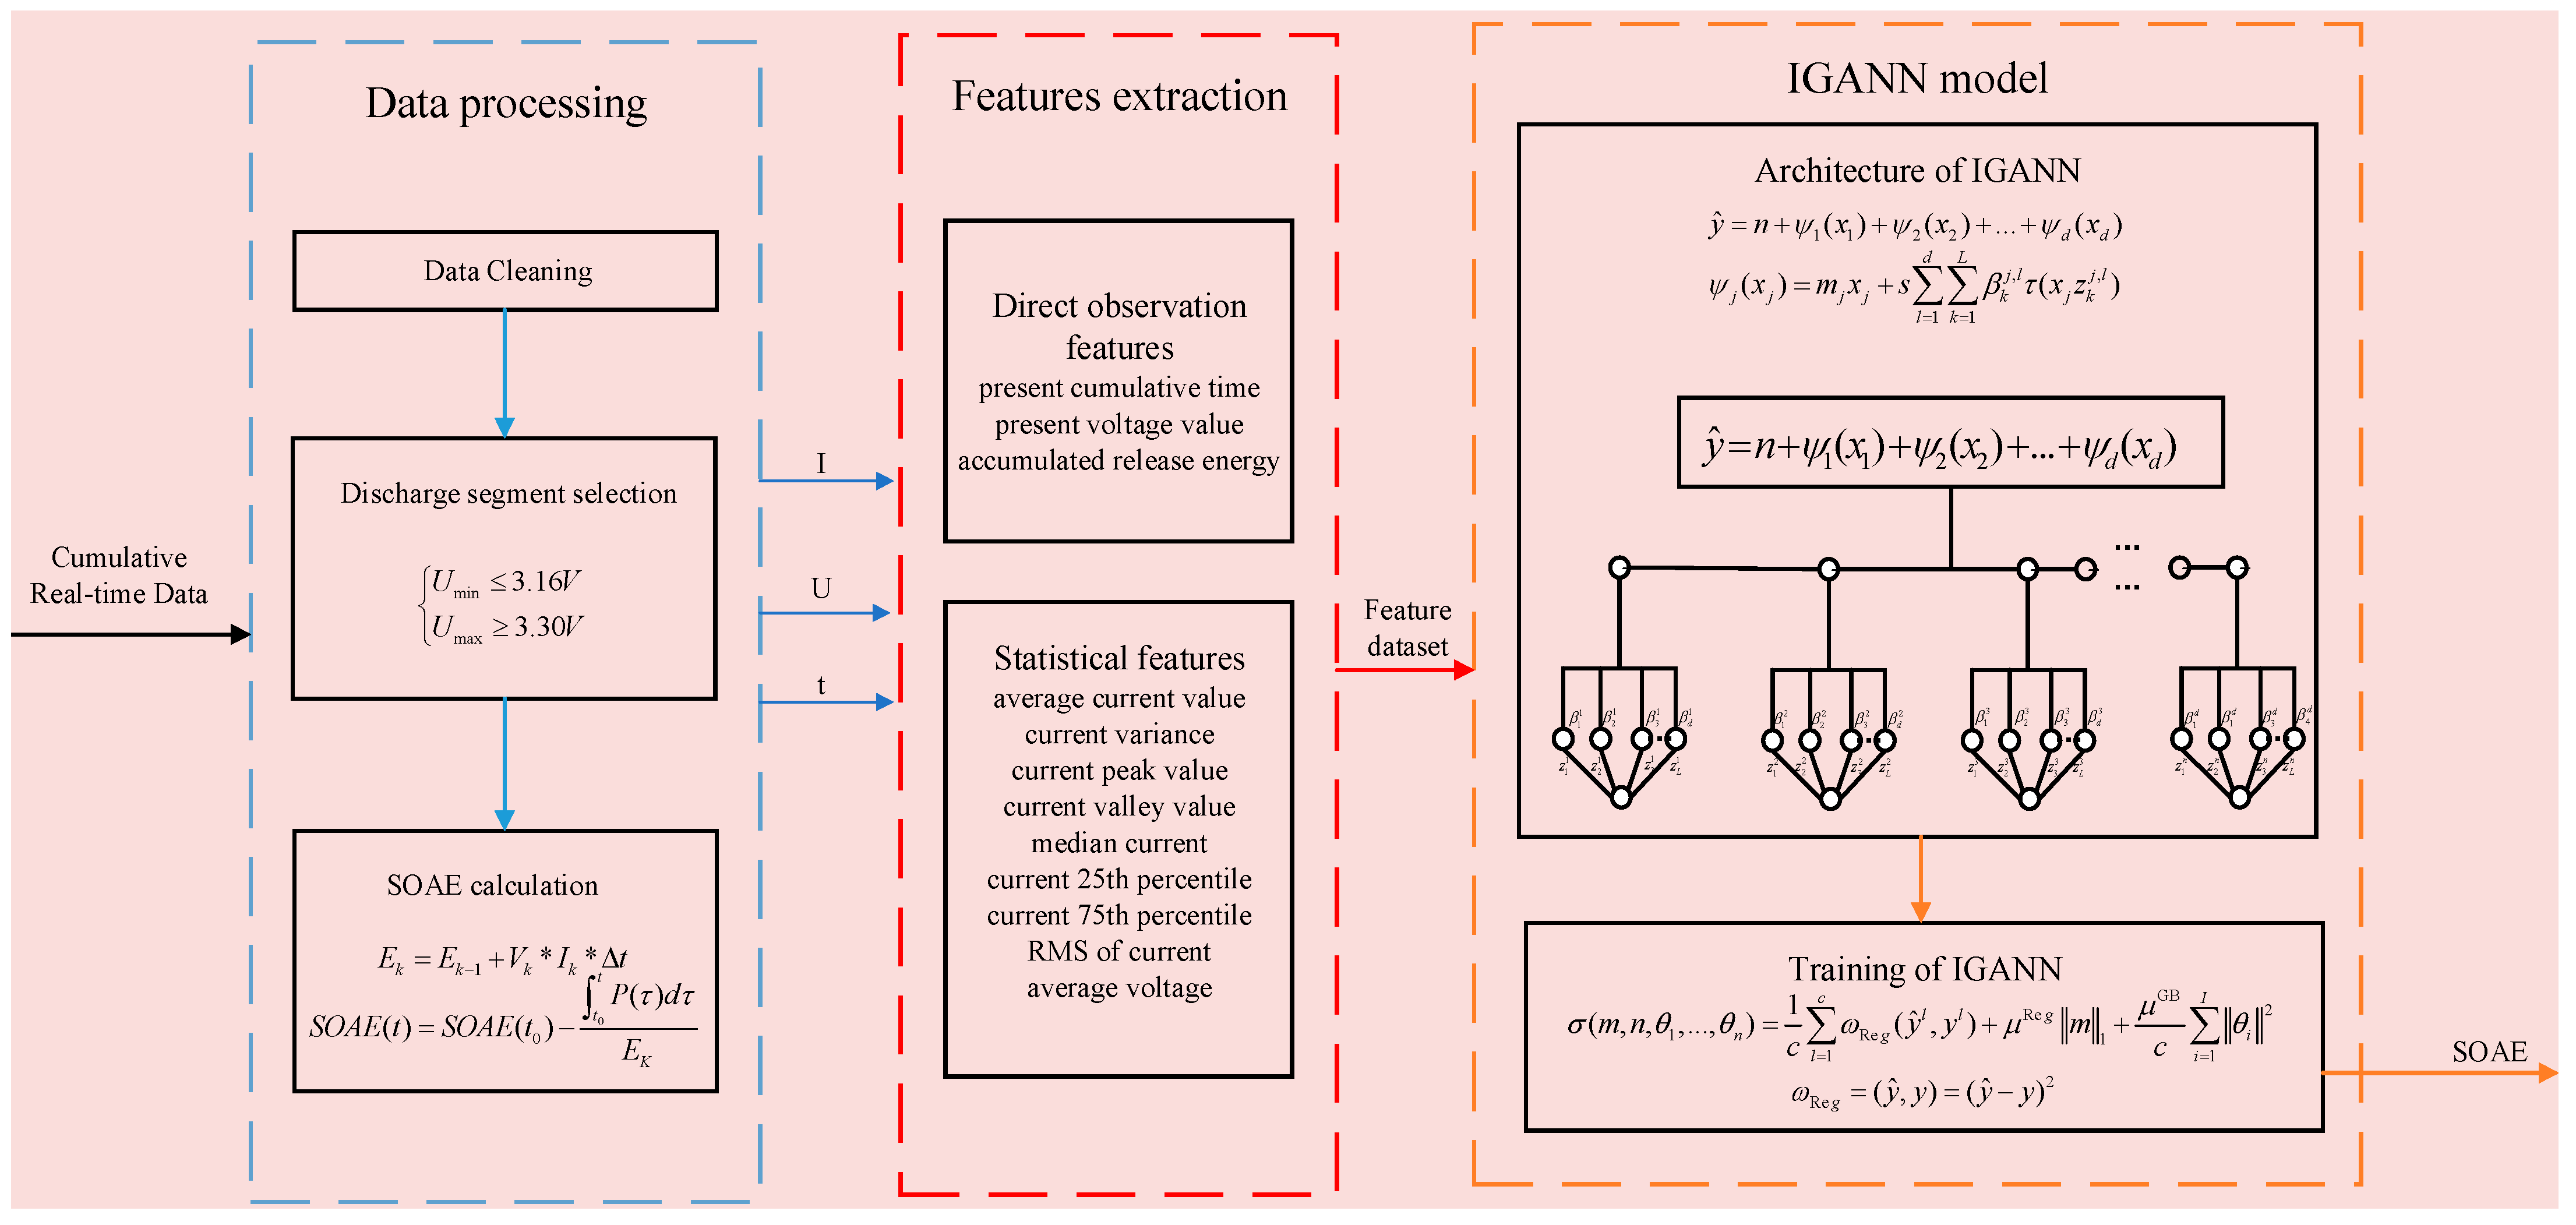
  • Based on the operating conditions in real battery operation, a battery working voltage threshold considering safety margins is designed, along with the proposed state of available energy (SOAE) metric. This approach helps prevent excessive discharge caused by high current pulses, while also addressing the adaptability issue of energy state evaluation under different operating conditions.
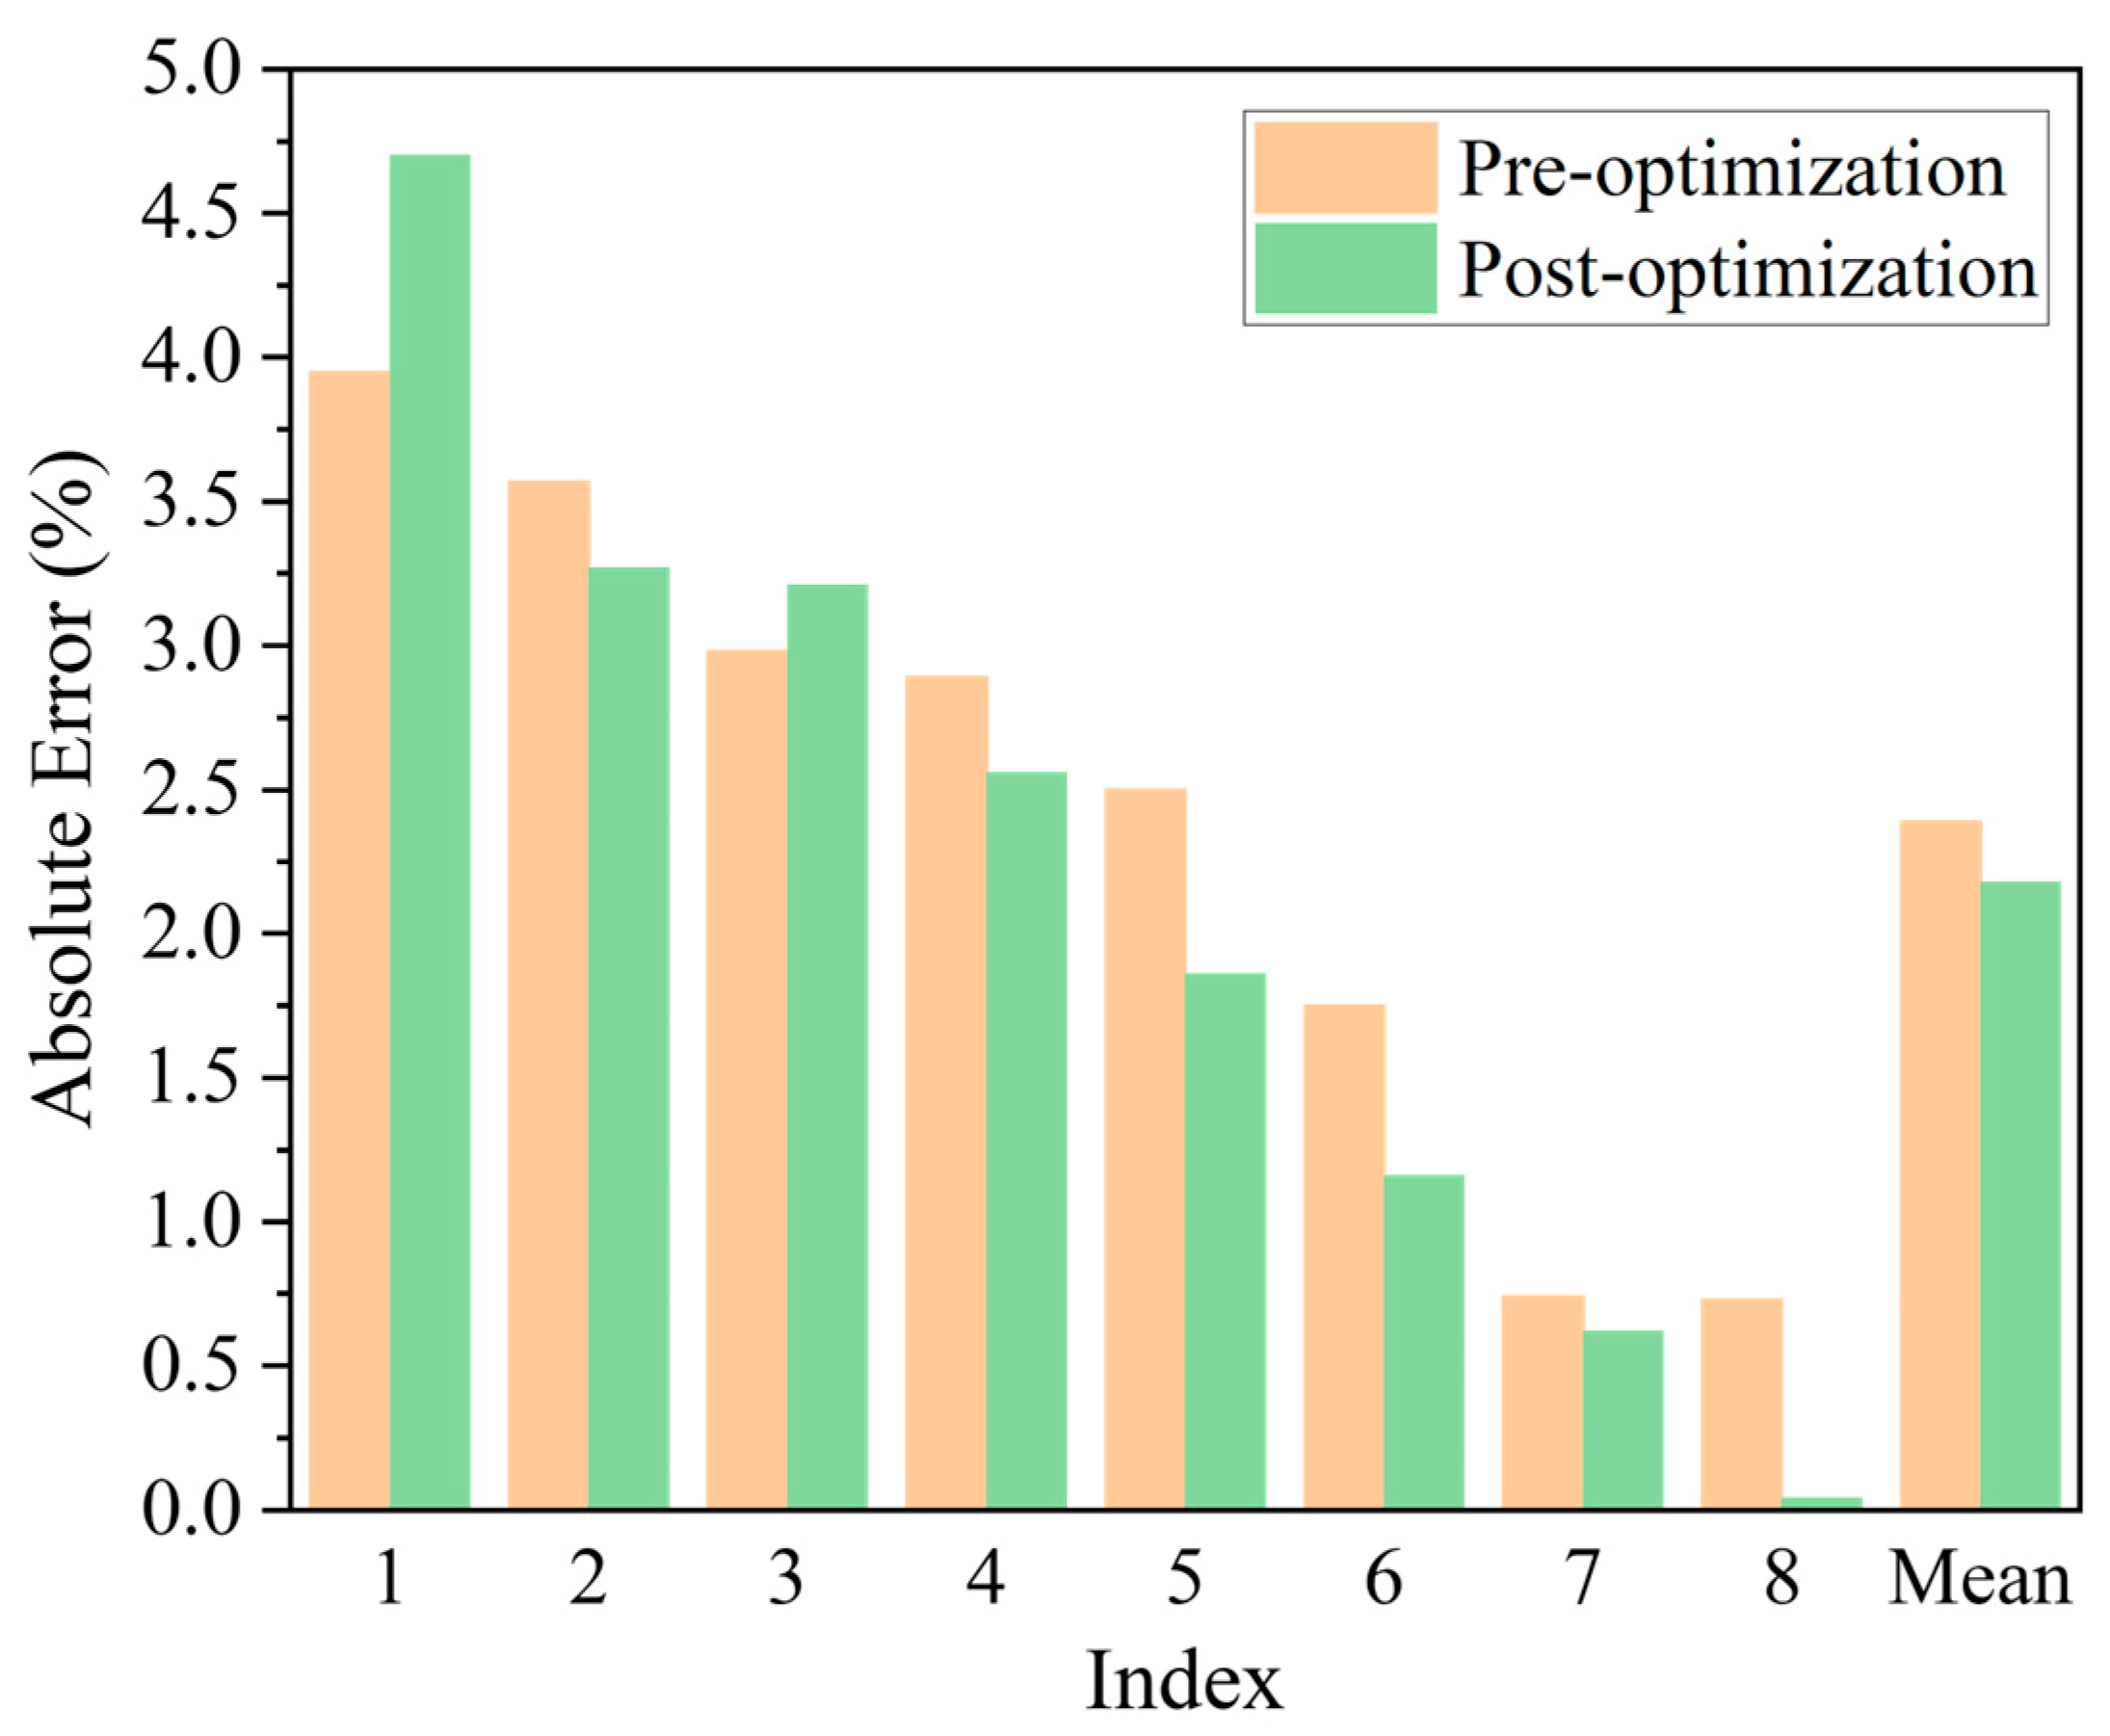
  • The IGANN model combines a neural network and generalized additive model, enabling accurate mapping of the relationship between the features and target while also providing the interpretability through feature contribution visualization, which optimizes the model. In this study, the tailored IGANN model is applied to SOAE prediction, yielding promising results. The average absolute error at a single test point is 2.39%. After optimizing the model based on interpretability, the average absolute error improves to 2.18%, and the runtime is reduced by 70.55%. In dynamic prediction validation, the average absolute error is less than 3%, demonstrating the model’s robust performance in SOAE prediction tasks.
  • The model is trained and validated using real operational data from an energy storage station. Laboratory data, which are results under fixed designed conditions, often lead to underfitting in the trained model, causing a decline in prediction accuracy under complex real-world conditions. This makes the model less adaptable to the dynamic operational conditions required for SOAE prediction. In contrast, the dataset used in this study more comprehensively covers actual dynamic operating conditions and validates the model’s prediction accuracy under real-world data, thereby enhancing the model’s engineering applicability.
The remainder of this paper is organized as follows. Section 2 introduces and processes the data. Section 3 constructs the dataset for subsequent analysis. Section 4 presents the method of predicting the remaining discharge energy of the energy storage battery using the IGANN. Section 5 covers model training and validation. Section 6 provides the conclusions of this paper.

2. Data Preprocessing
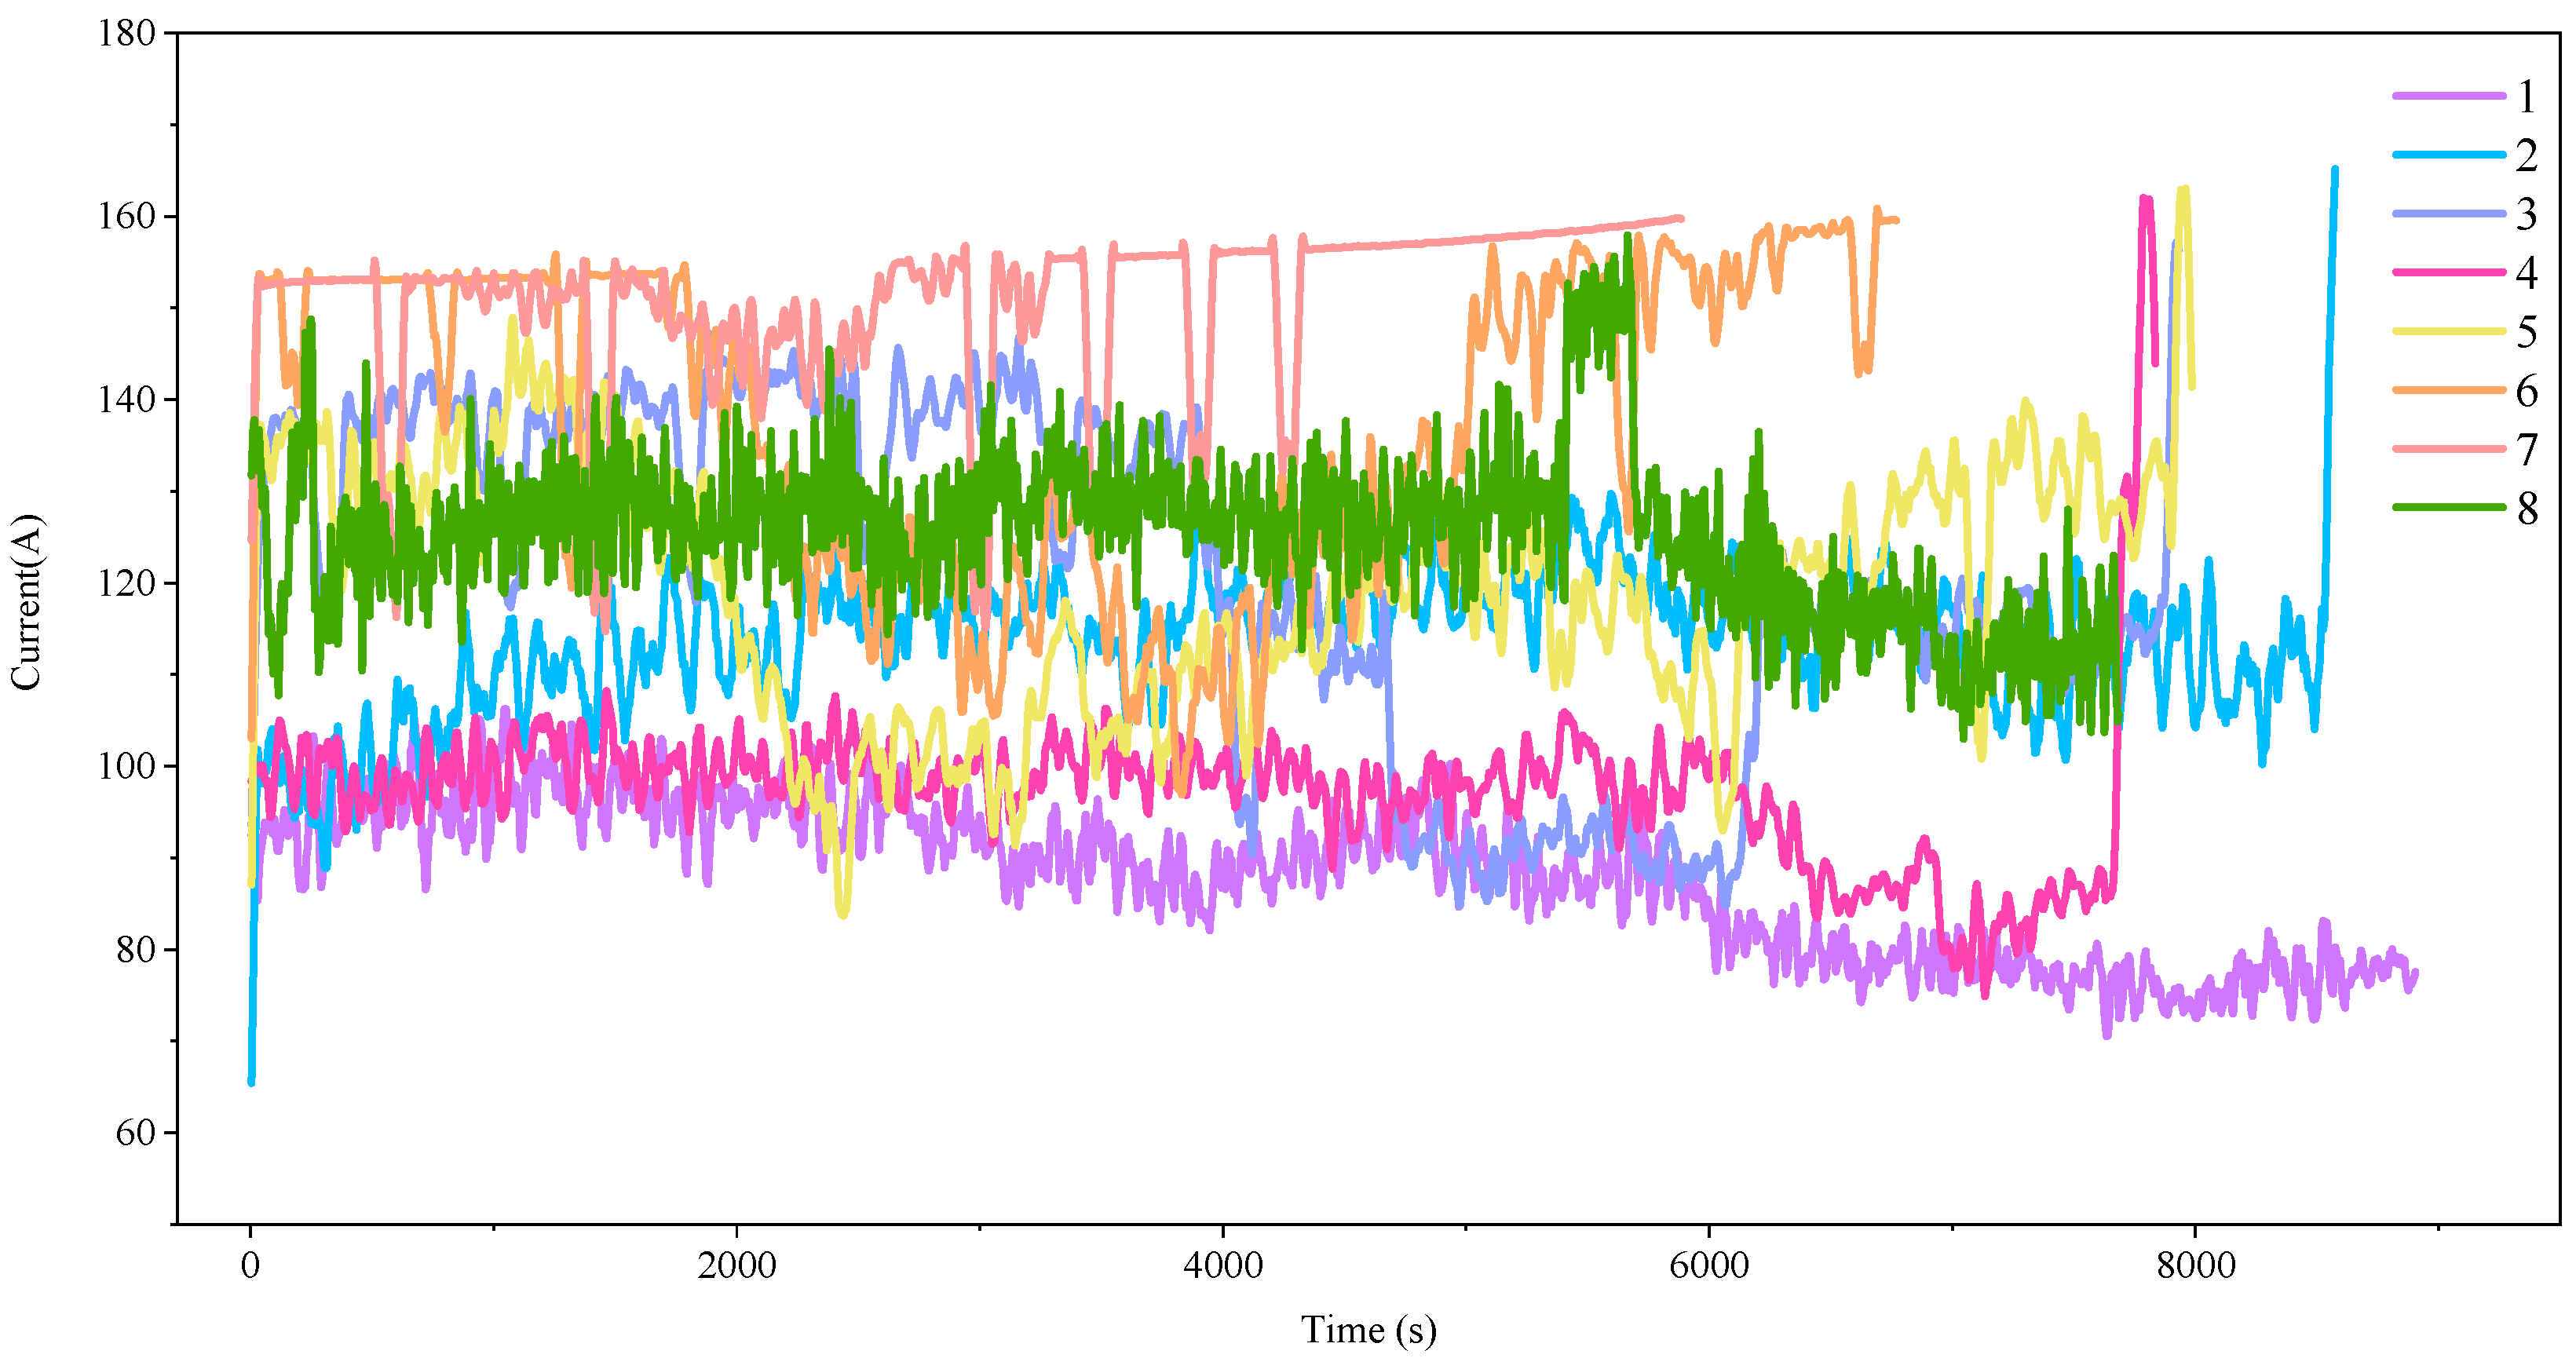
This study uses actual operational data from an energy storage system of a certain company. However, in the battery historical data platform, there is an issue of having a large quantity of data but of a low quality. Battery operation data is collected and uploaded to the cloud, and during this process, issues such as sampling errors, data transmission problems, missing data, and inconsistent formats can arise, which pose challenges for subsequent analysis. Therefore, data preprocessing is required before conducting the analysis.

2.1. Data Overview

The energy storage system uses 314 Ah lithium iron phosphate (LiFePO4) battery cells. The battery configuration for the entire system is “260S1P”. The basic parameter information of this battery is provided in Table 1.
The battery data spans from 6 December 2024 to 15 March 2025, with a sampling interval of 5 s. The dataset consists of 1,451,520 rows and 709 columns, primarily containing information such as time, temperature, battery cluster current, total voltage, and individual cell voltage. The key fields required for this study include time, battery cluster current, battery cluster voltage, individual cell voltage, and individual cell temperature. Table 2 presents the key field information.

2.2. Data Cleaning

Before conducting data analysis, it is necessary to clean the invalid data and extract the discharge segment data. First, the outliers in the historical data, caused by data transmission issues resulting in a value of 65,535, are addressed by deleting all samples containing the 65,535 values. In the dataset used in this study, once data loss occurs, it leads to prolonged periods of missing data rather than isolated missing data points. Therefore, interpolation is not applied. During the dataset construction in Section 3, discharge segments that do not meet the required criteria are excluded.
Next, all discharge segment data are filtered based on the current information. The calculation of energy information will be carried out during the dataset construction process in Section 3.

3. Dataset Construction

3.1. Definition of State of Available Energy

The traditional definition of the remaining energy is the amount of energy a battery can release from its current state until the state of charge (SOC) reaches zero. However, in practical operations of energy storage stations, to ensure battery safety and prolong its lifespan, the battery is typically not fully discharged. An important condition for determining the end of discharge is when the lowest voltage among the battery cells reaches the prescribed minimum discharge voltage, Umin.
Additionally, due to the start-up or shutdown of large electrical equipment at the load end, current pulses may occur. For example, as shown in Figure 1, the discharge current curve from 14 December 2024 exhibits current pulses as high as 151.399 A. If such current pulses occur when the battery’s charge is low, the battery voltage could suddenly drop below Umin due to polarization effects, which may significantly shorten the battery’s lifespan or even damage the battery.
Therefore, this study proposes a new definition of ERAE, which refers to the amount of energy that the battery can release from its current state until the lowest safe discharge voltage, Ulim, is reached. The calculation method for Ulim is given using the following formula:
U lim = U min + 1.2 I p e a k R
where Ipeak is the maximum value of the pulse current, R is the internal resistance of the battery, and 1.2 is the safety margin, which is a common practice in engineering applications [16].
Based on historical data analysis, the maximum value of the current pulse, Ipeak, in the battery operation data is 160 A. According to the battery specifications, the maximum DC discharge internal resistance, R, during normal battery operation is 0.722 mΩ. Statistics show that the minimum discharge cutoff SOC for this energy storage station is 5%, and the maximum discharge rate is less than 0.6 C. Additional experiments were conducted in this study, and the results show that when the battery is discharged to 5% SOC at a rate of 0.6 C, the voltage is 3.024 V, which is used as the minimum discharge voltage, Umin, for the energy storage station.
Substituting these values into Equation (1), the lowest safe discharge voltage, Ulim, for this energy storage station is calculated to be 3.16 V.
In the actual operation of the energy storage station, due to the unknown operating conditions of the battery from the previous cycle, which may involve varying durations of idle time, charging, or discharging, the polarization level of the battery can vary significantly. As a result, the voltage at the start of each discharge cycle is different. However, in the actual operation and scheduling of the energy storage station, the primary concern is not the degree of battery polarization but rather preventing over-discharge, which can damage the battery’s lifespan, determining how much energy the battery can release within a reasonable operating range.
Therefore, in this study, a starting voltage prediction upper limit is defined. The purpose is to align the prediction range of batteries in different states, thus allowing the prediction of the remaining energy over a larger range while minimizing the risk of over-discharge. The selection of the voltage prediction upper limit must accommodate as many discharge conditions as possible without allowing the battery to release too much energy before reaching the upper limit.
Through statistical analysis of the historical data from this energy storage station, it was found that the discharge starting voltage for nearly all discharge segments is above 3.3 V. Moreover, during stable operation, the current for all discharge segments operates within the range of 0.2 C to 0.6 C. Through experiments, it was found that the SOC range at a voltage of 3.3 V for the battery at C-rates from 0.2 C to 0.6 C is between 98.56% and 99.8%. Based on this, it can be concluded that setting the voltage prediction upper limit to 3.3 V is reasonable. To verify the adaptability of the selected voltage range under different discharge conditions, a random selection of discharge data from a half-month period was made. The voltage-energy curve was plotted as shown in Figure 2. The analysis results indicate that 12 out of 15 discharge cycles fall within the selected voltage range, and 80% of the discharges can be validated using the proposed model. This confirms the adaptability of the voltage range to various discharge conditions.
Existing studies have shown that the energy released by a battery during a complete discharge process varies under different discharge rates. This study analyzes the differences in the energy that can be released within the selected range. The results indicate that the maximum available total energy of the battery in the range is 882.1 Wh, while the minimum available total energy is 553.22 Wh. The range of the available total energy is 328.89 Wh, which accounts for 43.04% of the average available energy. This reflects a significant disparity in the available energy of the battery under different conditions, highlighting the need for accurate assessment of the remaining available energy.
Based on the above analysis, this study defines the voltage range of 3.16 V to 3.30 V as the reasonable voltage range for predicting the ERAE. To more intuitively characterize the remaining endurance of the battery, this study introduces the state of available energy metric, which is defined as the ratio of the present remaining discharge energy to the total available discharge energy within the specified voltage range. The specific calculation formula is as follows:
S O A E ( t ) = S O A E ( t 0 ) t 0 t P ( τ ) d τ E R A E 0
where SOAE(t) represents the state of available energy at time t, and P(t) denotes the effective power at time t. In this study, ERAE0 refers to the energy released by the battery under the present operating conditions, accumulated from discharging from 3.3 V to 3.16 V.
It is important to note that due to the dynamic changes in the operational conditions of the energy storage station, ERAE0 is not a fixed value but rather a variable that changes with the operating conditions. Compared to the traditional SOE metric, the SOAE algorithm introduces voltage range constraints and a dynamic reference value, ERAE0, which alleviates the adaptability issues of energy state estimation under different operating conditions. This approach helps enhance the reliability of the metric in practical applications.
To facilitate subsequent analysis, the specific data processing steps based on the previously designed voltage range for data extraction are as follows:
  • Filter the discharge segments that fall within the valid voltage range according to Equation (3).
U min 3.16 V U max 3.30 V
2.
Remove data outside the valid voltage range for each discharge segment, set the cumulative energy to 0 at the start of discharge, and then calculate the cumulative energy at each sampling point for each discharge segment according to Equation (4),
E k = E k 1 + V k I k Δ t
where Ek (Wh) is the cumulative energy at the kth sampling point; Ek−1 (Wh) is the cumulative energy at the previous sampling point, initially set to 0; Vk (V) is the battery voltage at the kth sampling point; and Ik (A) is the battery current at the kth sampling point.
3.
Use Equation (2) to calculate the SOAE for each discharge sampling point.

3.2. Feature Extraction

The main reason for the difference in the ERAE of the same battery under different operating conditions is the battery’s polarization effect [17]. The polarization phenomenon causes the actual output voltage of the battery to deviate from its theoretical equilibrium voltage, thereby reducing the effective discharge energy [18]. In the actual operation of energy storage systems, the degree of polarization is primarily influenced by the discharge current and ambient temperature [19]. However, statistical analysis of the historical operation data of the energy storage system reveals that when the cell voltage is between 3.16 V and 3.3 V, the average temperature of the battery is 25.81 °C, with a variance of 3.773. The daily temperature fluctuation trend remains generally consistent. Therefore, this study treats the data as being sampled under constant temperature conditions, excluding the temperature from the feature engineering scope, and instead focusing on the current-driven polarization dynamic characteristics.
Based on an in-depth analysis of existing research, this study systematically classifies feature variables into two main categories, which are direct observation features and statistical features [20]. Direct observation features mainly include real-time parameters during the battery operation process, such as the present accumulated discharge time, real-time voltage values, and accumulated released energy [21,22]. Statistical features are obtained by performing mathematical transformations and statistical analysis on the raw data [23], including the mean, variance, extreme values, such as peak and trough, and the various quantile values of each parameter [24]. These features can more comprehensively reflect the data distribution pattern and dynamic variation characteristics. Based on this feature selection method, the final set of features determined in this study is shown in Table 3.
To dynamically represent the battery polarization process and achieve real-time SOAE prediction, this study uses a voltage-range-based time-series slicing method. Specifically, for the discharge curve of the same individual cell, the voltage range is divided into three intervals for progressive training: 3.24–3.3 V, 3.22–3.3 V, and 3.2–3.3 V. Within each interval, the multi-dimensional features listed in Table 2 are extracted to quantify the non-linear evolution of the polarization with respect to the depth of discharge (DOD).
This segmented modeling strategy explicitly captures the dynamic coupling relationship between the polarization and discharge energy, overcoming the limitation of traditional full-voltage-range modeling, which lacks sensitivity to local polarization.

4. Model Construction

4.1. IGANN Architecture and Principle

This section will elaborate on the framework and principles of the interpretable generalized additive neural network. Compared to traditional black-box machine learning models, the innovation of the IGANN lies in its interpretable additive structure, which represents the non-linear relationship between the battery parameters and performance indicators in a mathematically transparent way.
In the prediction of the SOAE for energy storage batteries, the IGANN can generate visual feature contribution analyses without sacrificing predictive accuracy. This allows it to clearly show how specific parameters influence the battery’s SOAE, thereby aiding in optimizing battery design and usage strategies. Moreover, the IGANN’s robustness regarding data fluctuations makes it suitable for dynamic battery operating environments. By combining interpretability with predictive capability, the IGANN provides a reliable and easy-to-understand solution for SOAE prediction in energy storage batteries.
The IGANN follows the framework of a generalized additive model (GAM), representing the prediction output as an additive combination of independent non-linear mappings of each input feature [25]. The overall model architecture is shown in Figure 3.
Let the training data be given as ( x i , y i ) i = 1 δ , where δ is the number of training samples, x i R d , d represents the dimensionality of the covariate feature space, and y i is the target value, y i R . The mathematical definition of the predictive model is as follows:
y ^ = m , x + n + i = 1 N s i g i ( x )
where m R d is the parameter of the linear part, n R is the intercept, g i G S N N is the basis function, s i > 0 is the ith step size, and N is the number of basic functions.
G S N N is the shape function generated based on a single hidden layer neural network. The design concept is to subdivide the hidden layer into d components (one for each feature dimension) in the first layer. Each component contains a predefined number of hidden neurons, and each component is associated with only one feature dimension to eliminate feature interactions. The definition of the basis function is as follows:
g θ ( x ) = j = 1 d k = 1 L β k j τ ( x j z k j )
where τ is a non-constant piecewise continuous activation function (e.g., ReLU, ELU). Let the number of hidden neurons be L, z k j represents the weight of the kth hidden neuron for the jth feature, and β k j R l denotes the output layer weights. The regularization loss function is given in Equation (7).
G S N N = g θ : θ R 2 d L
The training process of the IGANN model is achieved by minimizing the loss function:
σ ( m , n , θ 1 , , θ n ) = 1 c l = 1 c ω Re g ( y ^ l , y l ) + μ Re g m 1 + μ GB c i = 1 I θ i 2
ω Re g = ( y ^ , y ) = ( y ^ y ) 2
where μ G B is the regularization parameter, and θ i is the parameter vector of the ith basis function. For regression tasks, the squared loss function in Equation (9) is used.
An optimization algorithm based on gradient boosting is used to ensure optimal parameter estimation.
y ^ l , k 1 = m , x l + n + j = 1 k 1 s j g θ j ( x l )
Increase g θ k to minimize the loss function.
σ ( t ) ( θ t ) = 1 c l = 1 c ω Re g ( y ^ l , k 1 + s k g θ k ( x l ) , y l ) + μ G B c θ k 2
According to Equation (5), the shape function for the jth feature in the IGANN model is derived as Equation (12).
ψ j ( x j ) = m j x j + s l = 1 d k = 1 L β k j , l τ ( x j z k j , l )
The predicted output is then represented as an additive combination of independent non-linear mappings (i.e., shape functions) for each input feature. The input form of the IGANN model is shown as Equation (13).
y ^ = n + ψ 1 ( x 1 ) + ψ 2 ( x 2 ) + + ψ d ( x d )

4.2. Model Details

The objective of configuring the IGANN model’s parameters is to balance model performance and interpretability. The model parameters are determined through trial-and-error, and the specific parameters are shown in Table 4.
The core parameters of the IGANN model include task (the model’s task type), n_estimators (the number of base learners), n_hid (the number of hidden layers in the neural network), boost_rate (the learning rate), init_reg and elm_alpha (regularization parameters), and early_stopping (the early stopping criterion).

5. Result and Discussion

After constructing the SOAE feature set, a random selection of single-cell operation data for 8 days from the energy storage station was used as the validation set, while the remaining 12,582 sets of data were used as the training set. These were then fed into the pre-constructed IGANN prediction model for training. This chapter will present the prediction results of the method in terms of the model interpretability, model validation results, and dynamic prediction accuracy. Figure 4 shows the overall prediction framework diagram.

5.1. IGANN Model Training

The training process of the IGANN model is achieved by minimizing the loss function. In this study, the IGANN model completed training after 3884 iterations, with a total time of 64.92 s, demonstrating efficient convergence characteristics. The training process exhibits typical gradient boosting features, and the training log is shown in Table 5.
As seen from Table 5, at the start of the training, the training loss was 0.02008, and the final loss was 0.00550, achieving a 72.61% reduction in loss. After 35 iterations, the model’s training loss was 0.01021, indicating that 50% of the loss reduction was achieved within the first 35 iterations, highlighting the algorithm’s rapid training characteristic. From iteration 35 to iteration 3854, the model entered a stable optimization phase. Between iterations 3854 and 3884, the model entered the fine-tuning phase. To prevent overfitting, the early stopping mechanism was triggered. At this point, further training had little impact on model optimization, so the training process stopped at iteration 3884. The entire process took 64.92 s, ensuring the timeliness of the energy state prediction for the energy storage station while achieving accurate prediction results.

5.2. The Validation of the IGANN Based Model

Figure 5 shows the discharge current curve for the randomly selected 8-day validation set. It can be observed that the operating conditions exhibit significant volatility, with the discharge current dynamically varying between 0.2 C and 0.5 C. Through statistical analysis of the historical data, the discharge data over these 8 days adequately covers the discharge conditions and current fluctuations, sufficiently representing the various actual operating states of the energy storage station. This data fully reflects the inherent complexity and uncertainty of the energy storage station’s operation.
To evaluate the accuracy of the model’s predictions, the selection of the test point for SOAE prediction is crucial. By statistically analyzing the historical operational data of the energy storage station, it was found that the state of available energy from the start of discharge until the individual cell voltage reaches 3.22 V ranges from 30% to 60%. This voltage point covers a wide range of available energy states and is effective for testing the model’s adaptability to different DOD. Therefore, the voltage of 3.22 V was selected from the 8-day validation set as the test point of SOAE prediction to assess the model’s prediction accuracy and its ability to handle complex operating conditions. The prediction results are shown in Table 6.
In the 8 validation sets, the average state of available energy is 43.91%, with a maximum of 55.20% and a minimum of 35.6%. The maximum deviation from the average is 44.64%, confirming the significant impact of operational condition fluctuations on the battery’s remaining discharge energy. As shown in Table 6, the state of available energy predicted by the IGANN model has a mean absolute error (MAE) of 2.39%, with the maximum difference between predicted and actual values being 3.95%. An error scatter plot is shown in Figure 6. The model demonstrates good prediction stability.

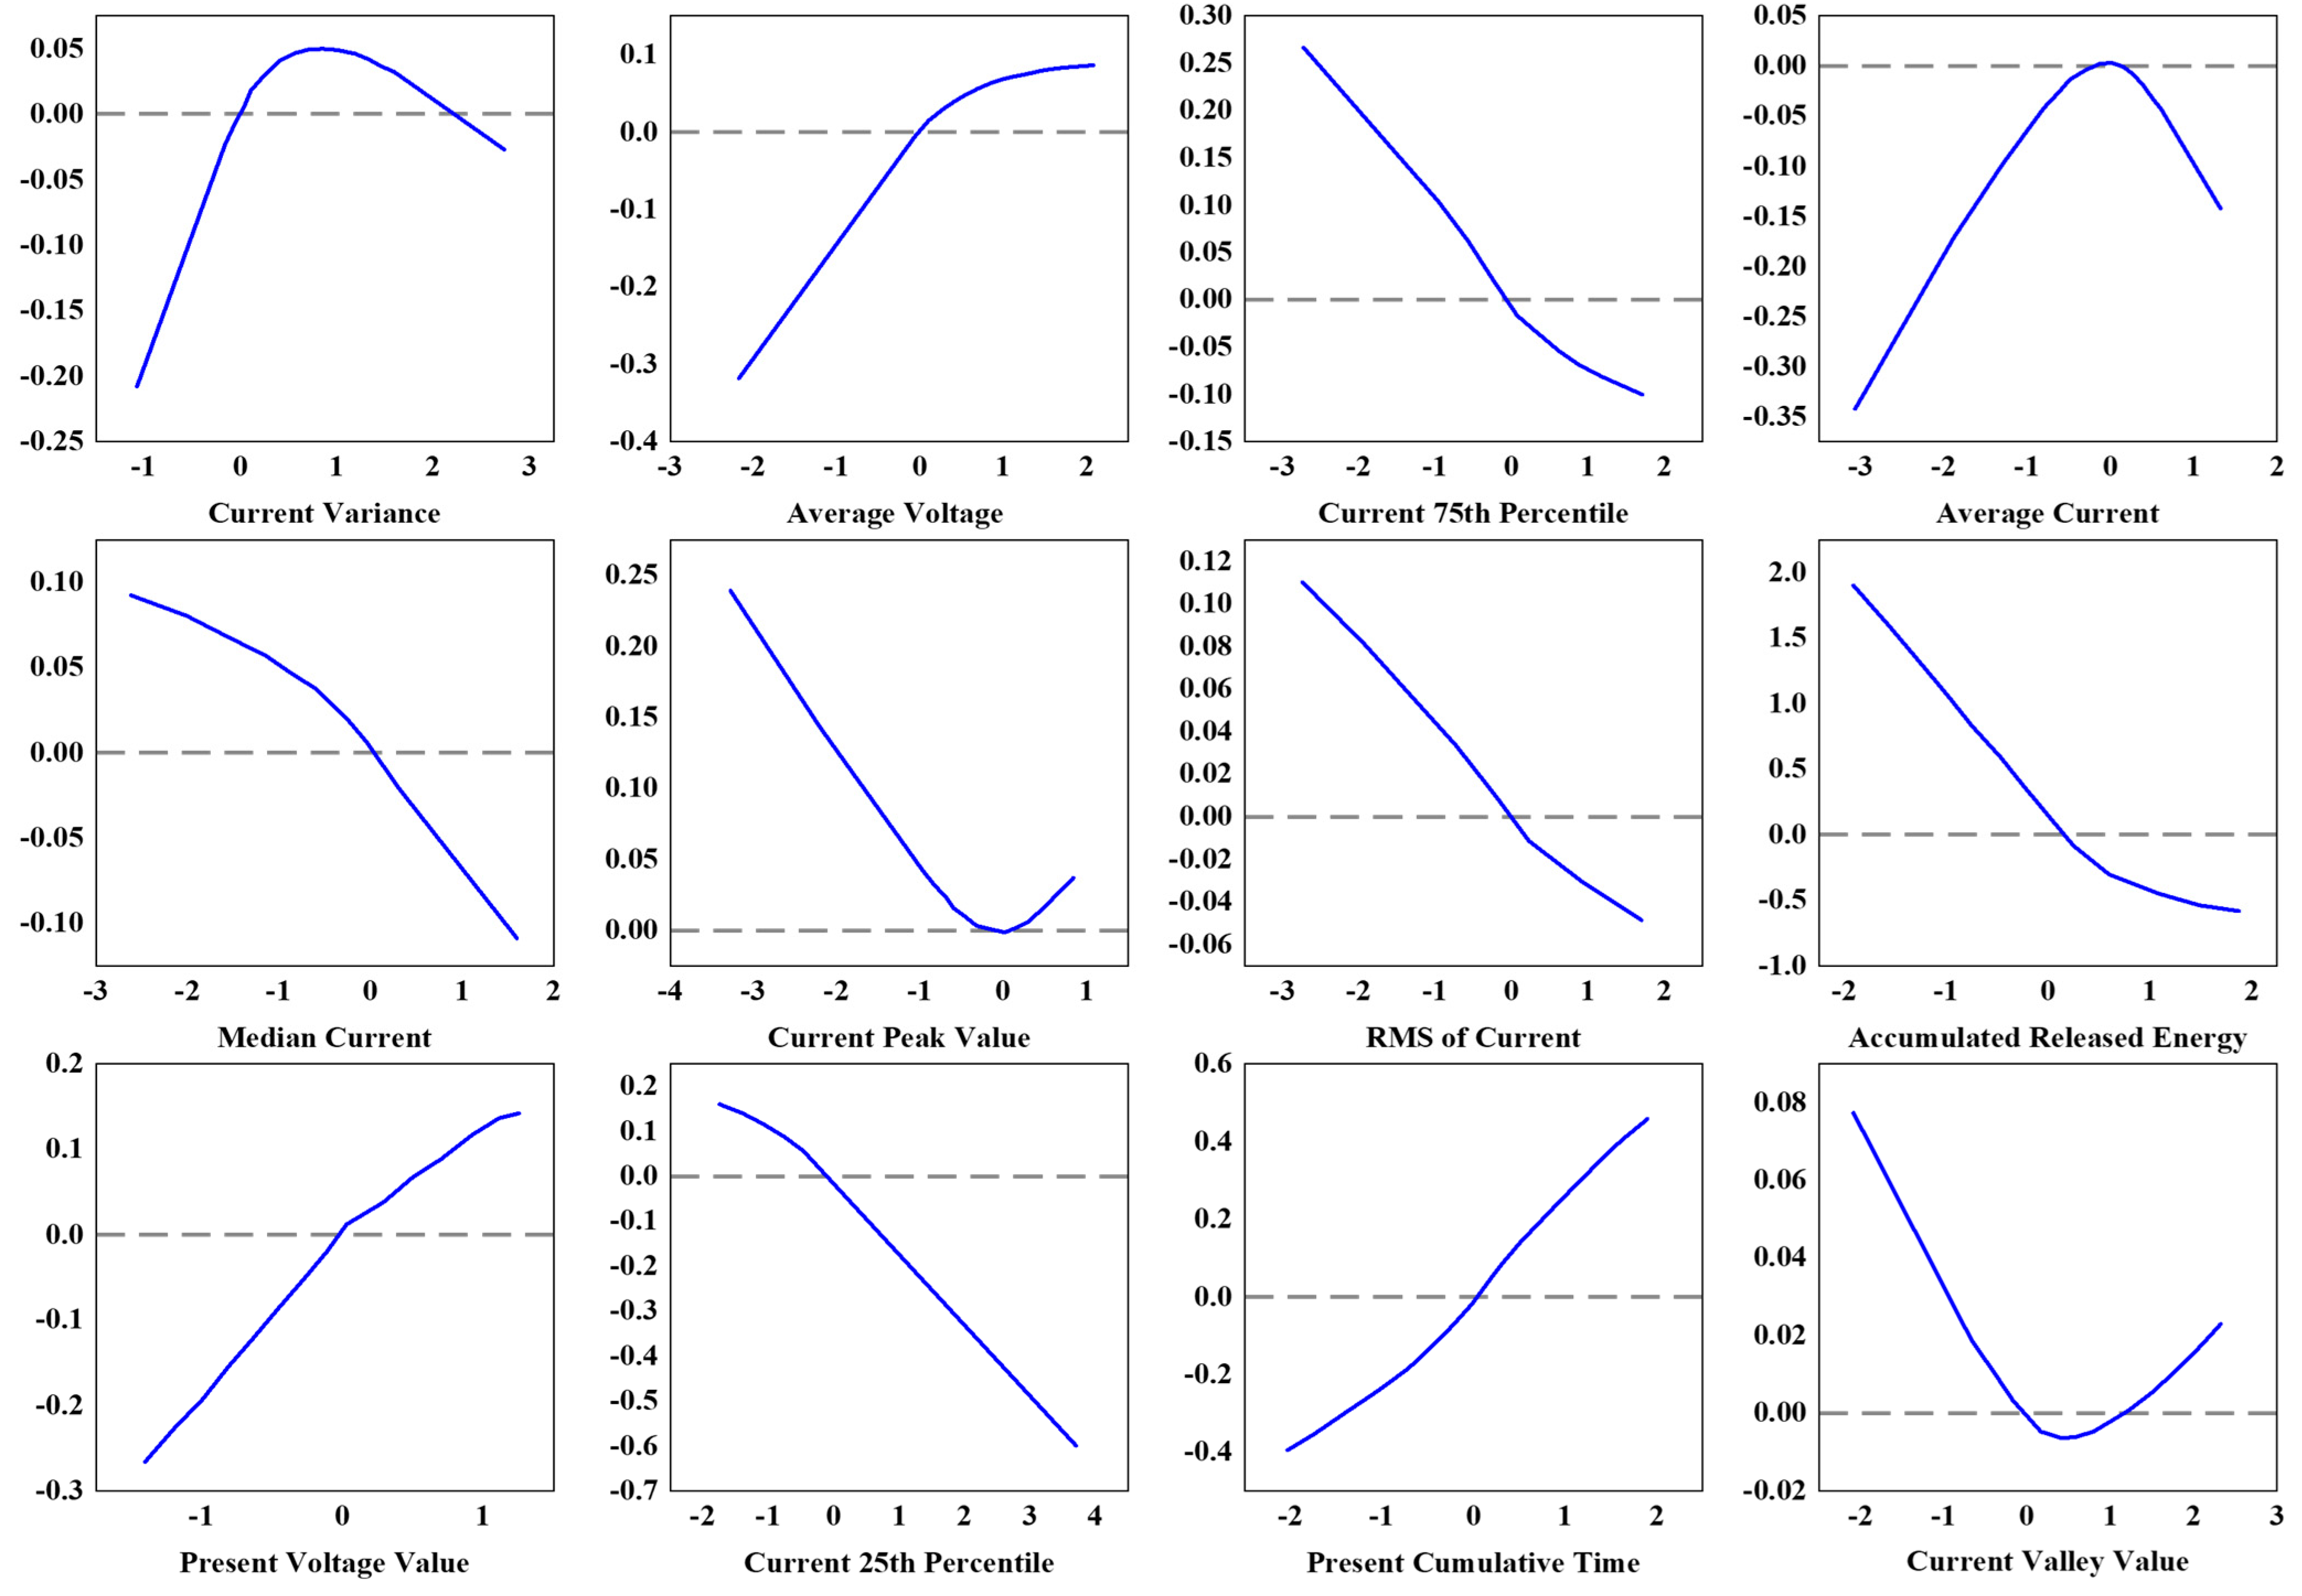
5.3. Model Interpretability

Unlike traditional black-box models, the IGANN not only outputs the prediction results but also explicitly quantifies the impact of each feature on the prediction of the battery’s available energy state. It provides the shape function and contribution of each feature. Figure 7 shows the shape function of each feature, and Figure 8 displays the contribution of each feature. Based on the feature contributions, the model’s accuracy and computational speed can be further optimized.
Through the analysis of contribution values, the features ranked by their influence on the battery’s state of available energy are as follows: accumulated released energy (37.4%), present cumulative time (14.28%), present voltage (9.77%), current 25th percentile (7.5%), current variance (6.67%), average voltage (5.76%), current 75th percentile (4.85%), average current (4.38%), median current (3.42%), current peak value (2.93%), rms of current (2.07%), and current valley value (0.94%).
From a physical perspective, the contribution of each feature to the model’s predictions can be analyzed as follows:
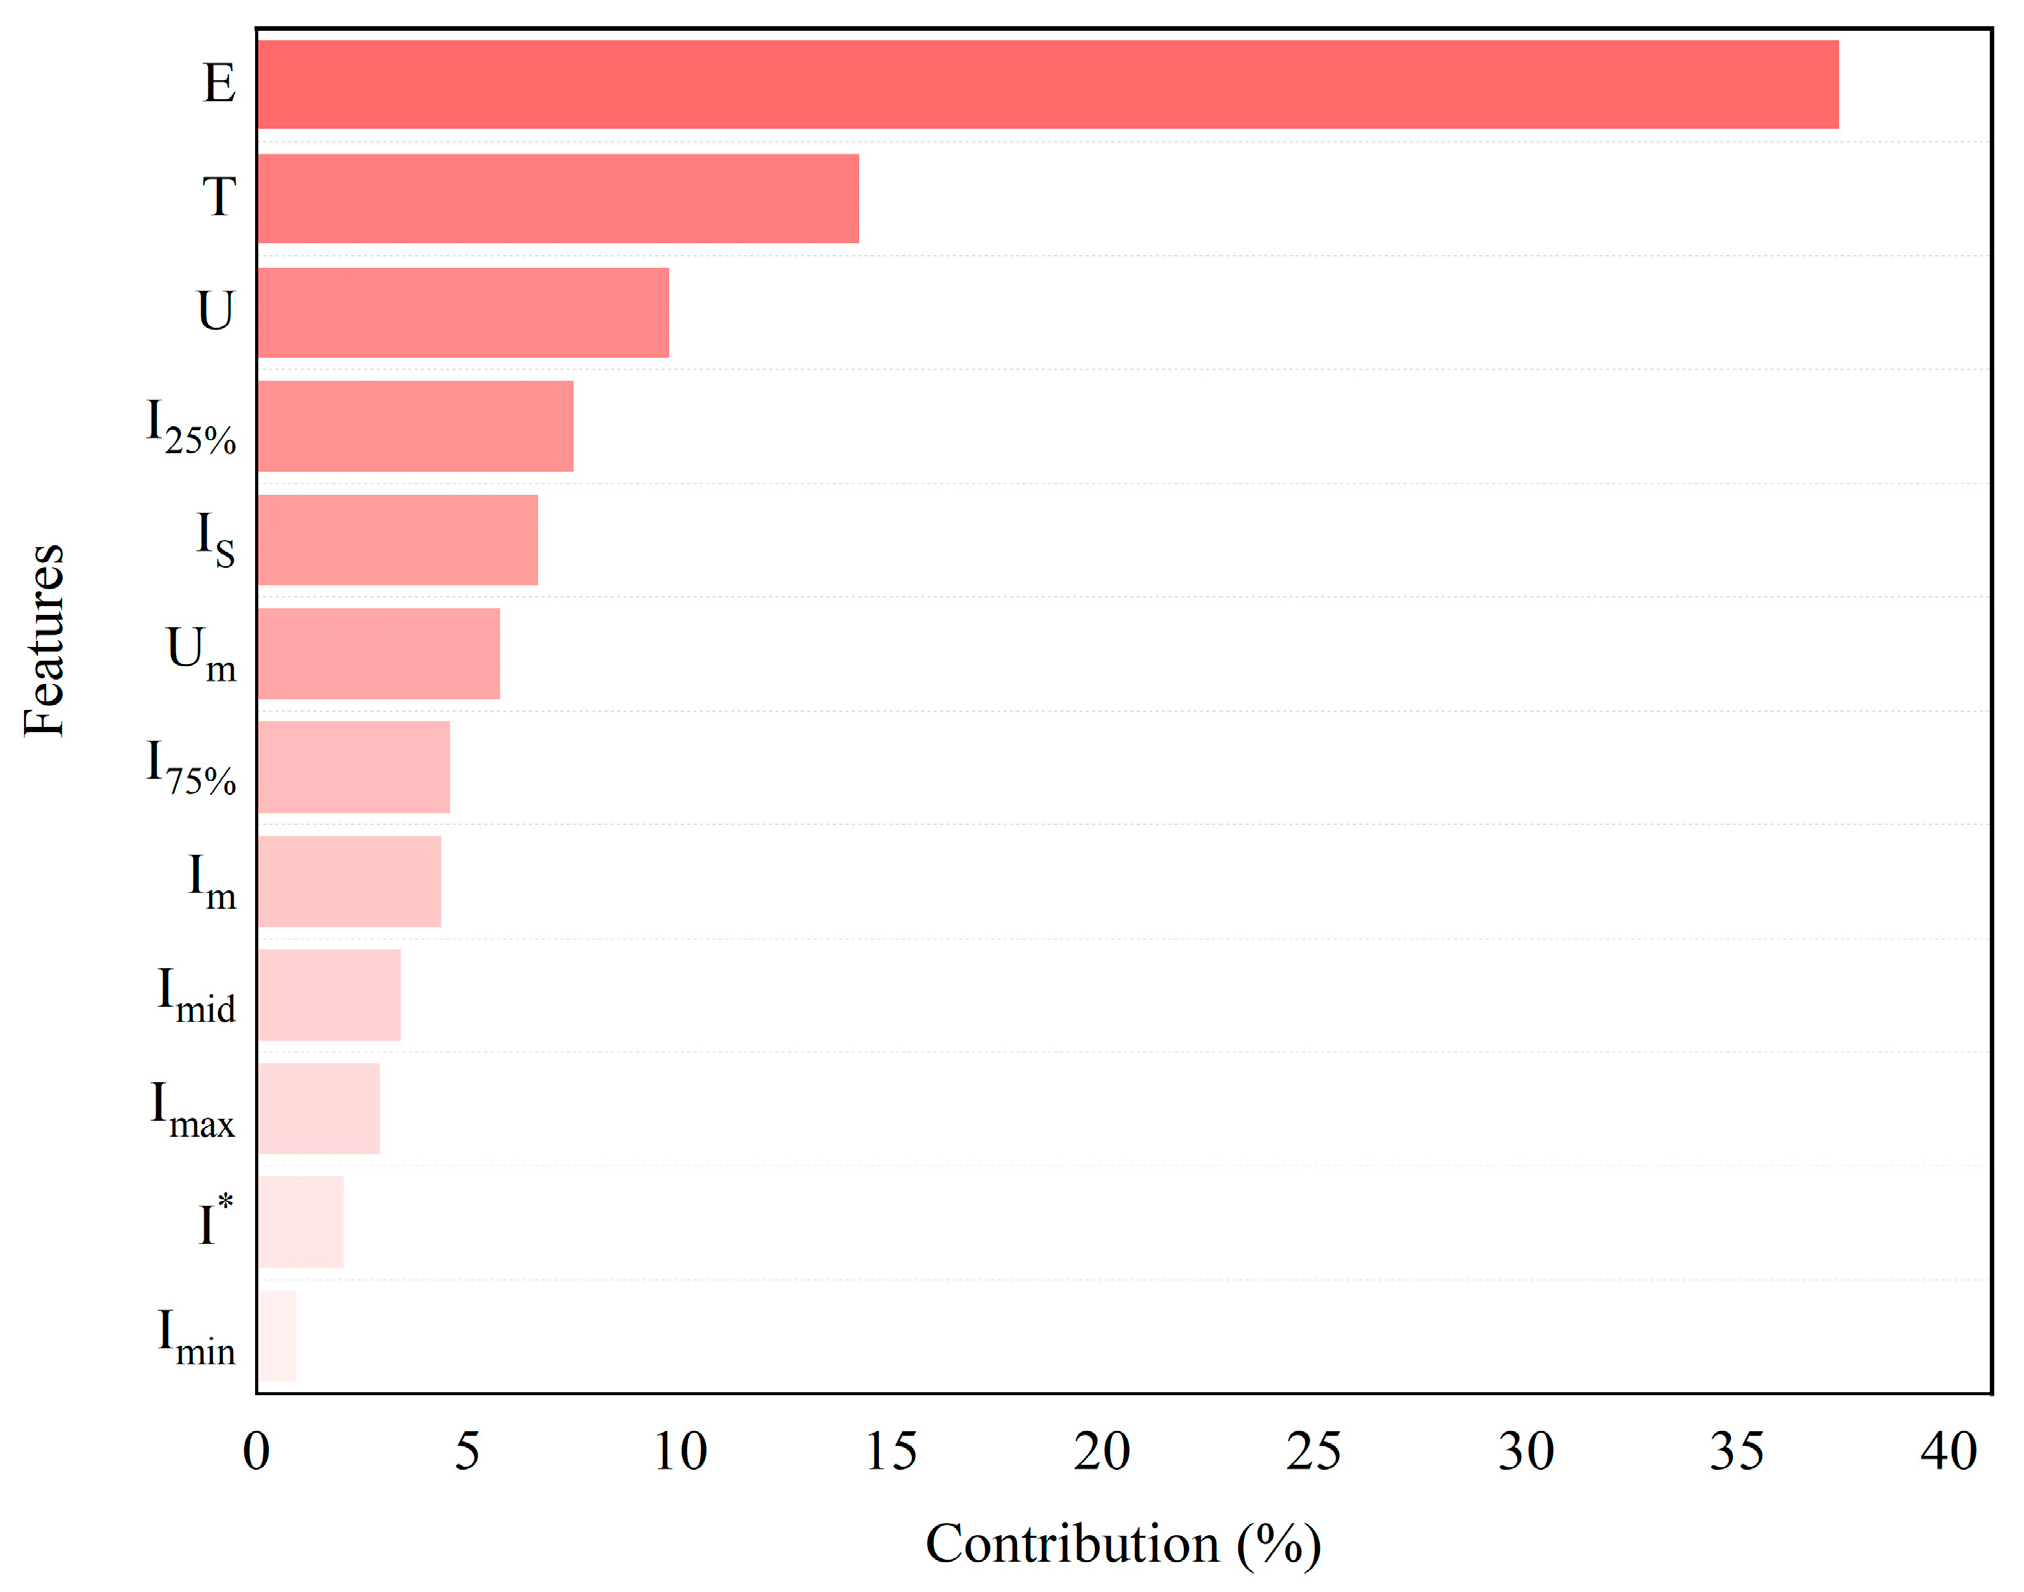
  • For high-contribution features, accumulated released energy directly represents the battery’s real-time energy and serves as a concentrated indicator of the battery’s operating conditions during the discharge process, reflecting the synergistic effect of voltage and current. Thus, it has the largest contribution to the prediction of the battery’s state of available energy. Present voltage reflects the battery’s present discharge phase, which in turn reveals the remaining available energy, making it the second most influential feature for prediction.
  • For medium-contribution features, the current 25th percentile and current 75th percentile both represent the current trends within a discharge phase. Present cumulative time directly reflects the battery’s operating stage, while current variance quantifies fluctuations in operating conditions. Due to the varying rates of voltage decrease under different conditions, the average voltage reflects the battery’s operating state. These features collectively contribute significantly to the prediction of the battery’s state of available energy.
  • For low-contribution features, the current valley value and current peak value represent the minimum and maximum load states, respectively. However, during actual battery operation, the current exhibits ripples and pulses. The rms of the current reflects the effective value of the current, while the average current value reflects the overall discharge intensity, but both are heavily influenced by ripples. The median current lacks sensitivity to abnormal conditions, so these features have a smaller contribution to energy prediction.
Based on the feature contribution analysis, the top 7 features, which together contribute 86.23%, were selected for retraining and validation. The results, as shown in Figure 9, demonstrate that at 3.22 V, the predicted MAE improved to 2.18%, better than the previous 2.39%. Additionally, the training time was reduced to 19.12 s, which optimized the training time by 70.55%. Through the interpretability-driven optimization, both the model’s accuracy and training speed were improved.

5.4. Dynamic Prediction

To validate the model’s dynamic prediction performance over a discharge cycle, this section performs dynamic SOAE predictions for 8 test samples. The predictions are made from the point where the voltage drops to 3.24 V until it reaches 3.20 V (the voltage window used in this study ranges from 3.3 V to 3.16 V). The absolute errors of prediction for each sample, as well as the MAE across the 8 samples, are shown in Table 7.
At 3.24 V, the true values of the SOAE for the 8 sample points range from a maximum of 83.4% to a minimum of 56.2%. This indicates that at this test point, the real-time data for the battery are limited, and the future operating conditions of the battery are unclear. Additionally, polarization caused by unknown conditions can influence the future voltage trend, which in turn affects the accuracy of the predictions. The prediction results show that the maximum prediction error at this test point is 7.67%, the minimum prediction error is 0.73%, and the MAE is 2.79%. The maximum error was observed on day 8, with the corresponding discharge current profile depicted as curve 8 in Figure 5. Comparative analysis indicates that the current waveform on this day exhibited pronounced oscillatory behavior, demonstrating substantially greater amplitude variability than the seven comparative datasets. This anomalous current fluctuation phenomenon represents the predominant factor contributing to the significantly elevated prediction error observed during this operational period. This demonstrates that the model can accurately predict the battery’s state of available energy, even with limited real-time data, by effectively learning the battery’s operating condition information from historical data.
At 3.22 V, the true values of the SOAE range from a maximum of 55.2% to a minimum of 35.6%. At this point, the battery has sufficient data for prediction, but there may still be significant changes in the operating conditions that could affect the prediction accuracy. The prediction results show that the maximum prediction error at this test point is 4.7%, the minimum error is 0.04%, and the MAE is 2.18%, indicating good prediction performance. Day 8 remained the predominant outlier with respect to prediction errors.
At 3.20 V, the true values of the state of available energy range from a maximum of 32.5% to a minimum of 13.5%, indicating that the battery discharge is nearing its end. Real-time data can fully reflect the changes in operating conditions during the discharge phase. The prediction results show that the maximum error at this test point is 4.58%, the minimum error is 0.03%, and the MAE is 1.66%. The maximum error was observed on day 4. As shown in curve 4 of Figure 5, since the voltage is already close to the predicted cutoff voltage, and as seen in the figure, curve 4 exhibits a significant current pulse towards the end of the discharge, causing the voltage to drop prematurely to the cutoff level. This resulted in the predicted SOAE being lower than expected.
The average prediction errors at these three test points gradually decrease, indicating that as the DOD increases, the model can more fully capture the characteristics of the operating conditions throughout the discharge process, and the prediction accuracy improves over time. The validation at the three test points demonstrates that the model can achieve accurate real-time predictions when varying the DOD.
To highlight the advantages of the proposed IGANN algorithm, a comparison is made among the IGANN, a FNN [14], a WNN [15], and LSTM [12] algorithms. FNNs, WNNs, and LSTM are all used for battery energy state estimation, benefiting from their ability to handle the complex nonlinear behaviors and dynamic changes of battery systems. As stated in the literature review, FNNs, WNNs, and LSTM have demonstrated extremely high prediction accuracy in energy forecasting in recent years. WNNs have the advantage of dealing with nonlinearities and complex dynamic characteristics. Due to the intricate nonlinear relationships between the battery energy state and parameters such as the voltage and current, WNNs leverage the benefits of wavelet transforms to efficiently decompose the signal into different frequency components. This is crucial for battery systems, which have both high-frequency and low-frequency components. Especially in rapidly changing battery states, WNNs can capture the instantaneous variations in features such as battery voltage and temperature, making their predictions more accurate and sensitive. FNNs, with their multi-layer perceptron structure, fit global nonlinear mappings for efficient learning and prediction. FNNs are particularly suitable for real-time energy state prediction due to their fast-learning ability, especially when handling large amounts of data. LSTM, a type of recurrent neural network (RNN), is widely used in time series forecasting due to its ability to capture long-term dependencies in sequential data. LSTM can dynamically learn and predict battery energy states by processing the temporal sequence of data. This ability to learn from the entire time sequence makes LSTM particularly suitable for predicting energy states in systems with highly dynamic and evolving behaviors. The LSTM model is especially useful when there is a need to predict future battery states based on historical data, capturing the time-dependent patterns and trends. Therefore, these three methods are selected for comparison. The comparative results are shown in Table 8 and Figure 10.
We analyze the MAE, maximum absolute error and minimum absolute error in the model comparison. The comparison results indicate that the MAE values for the IGANN model at the three test points of SOAE prediction are 2.79%, 2.18%, and 1.66%, respectively. For the WNN model, the MAE values are 4.54%, 2.94%, and 1.87%, and for the FNN model, the MAE values are 2.99%, 2.68%, and 4.6%. The MAE values for the LSTM model are 3.17%, 2.77%, and 3.45%. The IGANN model consistently outperforms the other three models in terms of prediction accuracy across different DODs, demonstrating the superiority of the method.
At the three voltage test points, the IGANN model consistently achieves the lowest minimum absolute error, with values of 0.73%, 0.04%, and 0.03%, respectively, outperforming the other methods. This demonstrates that the model has the highest prediction accuracy in the context of this study. At the 3.24 V test point, the maximum absolute error for the IGANN model is 7.67%, which is higher than both the FNN and LSTM but lower than the WNN. This is due to the limited amount of training data available. When extreme discharge conditions occasionally occur, the model may lack sufficient training on such specific conditions within the limited dataset. As a result, during these special conditions, particularly in the early stages of discharge where the discharge patterns are erratic and real-time data is sparse, occasional large errors may arise. However, for other validation sets at this test point, the maximum absolute error is only 3.85%, indicating that the model can stably predict the state of available energy at a low DOD. Additionally, the MAE at this test point is superior to the other three methods, demonstrating the prediction accuracy and stability of the model at a low DOD. At the 3.22 V test point, the maximum absolute error for the IGANN model is 4.7%, which is better than the WNN and FNN and comparable to LSTM’s 4.41%. At the 3.2 V test point, the maximum absolute error for the IGANN model is 4.58%, which is better than the FNN and LSTM and close to the WNN’s 4.16%. This shows that the maximum absolute error for the IGANN model gradually stabilizes as the discharge deepens, and it performs well in model comparisons, reflecting the prediction reliability of the IGANN under dynamic conditions. As the discharge depth increases, the MAE, maximum absolute error, and minimum absolute error of the IGANN model all decrease gradually, indicating that the model is able to learn the operational characteristics more effectively as the discharge deepens, resulting in progressively more accurate predictions.

6. Conclusions

This paper proposes a battery SOAE prediction method based on neural networks to address the issue of battery energy state estimation. The core of this method lies in using real operational data from the energy storage station as the dataset, extracting features that can represent the battery’s operating conditions to handle complex real-world operating scenarios and validating the accuracy of the results under actual dynamic conditions.
An overview of the work and results is as follows. First, a state of available energy metric for the battery is proposed, defining the operational range of the prediction model. Real operational data from the energy storage station is used as the dataset, and through feature extraction, 12 features that express battery conditions are selected as the model inputs, with the set remaining available energy state as the prediction target.
Next, the model is trained using IGANN. The model’s performance is validated with datasets containing different amounts of data to demonstrate its accurate prediction capabilities under real-time data with varying levels of accumulation.
In the validation work, samples from different operating conditions are randomly selected for the validation set. Initially, validation is carried out based on data before the battery reaches 3.22 V, with the MAE being 2.39%, confirming that the model can adapt to different dynamic conditions. Then, based on the model’s interpretability, feature contribution information is obtained. By optimizing the model with the most important features, which contribute a total of 86.23%, the MAE is 2.18%, and the training time is optimized by 70.55%, demonstrating that the model can optimize the training time while maintaining prediction accuracy. Finally, to validate the model’s real-time performance, the results at 3.24 V, 3.22 V, and 3.20 V are compared. The MAEs are 2.79%, 2.18%, and 1.66%, respectively, indicating that the model can make accurate predictions under different DODs.
In summary, the energy state prediction method proposed in this paper can provide reliable predictions while also improving prediction accuracy and accelerating computation speed through data optimization. In terms of model deployment, most second-generation battery management systems have integrated computing units, and the model used in this study operates through offline training, periodic retraining, and online prediction. This research provides an important reference for the large-scale deployment of future energy state prediction systems. However, in the dataset used in this study, the battery operating temperature remains relatively stable, and the impact of temperature is not considered when constructing the feature set. In the future, we will collect more battery data from various battery types under different influencing factors and complex operating conditions, fully considering the impact of temperature on battery polarization, in order to enhance the model’s generalizability.

Author Contributions

Conceptualization, J.Q.; methodology, J.Q., P.L. and Y.D.; software, P.L. and Y.D.; validation, J.Q.; formal analysis, P.L. and Y.D.; investigation, J.Q.; resources, Y.Y. and J.T.; data curation, J.Q.; writing—original draft preparation, P.L. and Y.D.; writing—review and editing, Z.F. and Z.W.; visualization, Y.D.; supervision, Z.F. and Z.W.; project administration, Y.Y.; funding acquisition, J.T. All authors have read and agreed to the published version of the manuscript.

Funding

This research was funded by the Science and Technology Project of China Southern Power Grid Co., Ltd. under the grant 090026KC23080001.

Data Availability Statement

Data is available from the corresponding authors upon request.

Conflicts of Interest

Authors Ji Qi, Yong Yi and Jie Tian are employed by the Shenzhen Power Supply Co., Ltd. The remaining authors declare that the research was conducted in the absence of any commercial or financial relationships that could be construed as a potential conflict of interest.

References

  1. Carrasco Ortega, P.; Durán Gómez, P.; Mérida Sánchez, J.C.; Echevarría Camarero, F.; Pardiñas, Á.Á. Battery Energy Storage Systems for the New Electricity Market Landscape: Modeling, State Diagnostics, Management, and Viability—A Review. Energies 2023, 16, 6334. [Google Scholar] [CrossRef]
  2. Chavhan, S.; Mohale, V.; Kumbhar, M. A Review of Recent Advancements and Challenges in Battery Energy Storage System (BESS). In Proceedings of the 2024 1st International Conference on Innovative Sustainable Technologies for Energy, Mechatronics, and Smart Systems (ISTEMS), Dehradun, India, 26–27 April 2024; pp. 1–6. [Google Scholar] [CrossRef]
  3. Chen, Y.; Yang, X.; Luo, D.; Wen, R. Remaining available energy prediction for lithium-ion batteries considering electrothermal effect and energy conversion efficiency. J. Energy Storage 2021, 40, 102728. [Google Scholar] [CrossRef]
  4. Lai, X.; Weng, J.; Yang, Y.; Qiu, C.; Huang, Y.; Yuan, M.; Yao, Y.; Zheng, Y. Remaining discharge energy estimation of lithium-ion batteries based on average working condition prediction and multi-parameter updating. J. Solid State Electrochem. 2024, 28, 229–242. [Google Scholar] [CrossRef]
  5. Ren, D.; Lu, L.; Shen, P.; Feng, X.; Han, X.; Ouyang, M. Battery remaining discharge energy estimation based on prediction of future operating conditions. J. Energy Storage 2019, 25, 100836. [Google Scholar] [CrossRef]
  6. Wang, Y.; Zhang, C.; Chen, Z. An adaptive remaining energy prediction approach for lithium-ion batteries in electric vehicles. J. Power Sources 2016, 305, 80–88. [Google Scholar] [CrossRef]
  7. Wang, Y.; Zhang, C.; Chen, Z. A method for joint estimation of state-of-charge and available energy of LiFePO4 batteries. Appl. Energy 2014, 135, 81–87. [Google Scholar] [CrossRef]
  8. Li, X.; Pan, K.; Fan, G.; Lu, R.; Zhu, C.; Rizzoni, G.; Canova, M. A physics-based fractional order model and state of energy estimation for lithium ion batteries. Part II: Parameter identification and state of energy estimation for LiFePO4 battery. J. Power Sources 2017, 367, 202–213. [Google Scholar] [CrossRef]
  9. Shen, X.; Wang, S.; Yu, C.; Li, Z.; Fernandez, C. An improved forgetting factor recursive least square and extended particle filtering algorithm for accurate lithium-ion battery state of energy estimation. Ionics 2024, 30, 6179–6195. [Google Scholar] [CrossRef]
  10. Zhang, W.; Wang, L.; Wang, L.; Liao, C.; Zhang, Y. Joint State-of-Charge and State-of-Available-Power Estimation Based on the Online Parameter Identification of Lithium-Ion Battery Model. IEEE Trans. Ind. Electron. 2022, 69, 3677–3688. [Google Scholar] [CrossRef]
  11. Liu, X.; Wu, J.; Zhang, C.; Chen, Z. A method for state of energy estimation of lithium-ion batteries at dynamic currents and temperatures. J. Power Sources 2014, 270, 151–157. [Google Scholar] [CrossRef]
  12. Ma, L.; Hu, C.; Cheng, F. State of Charge and State of Energy Estimation for Lithium-Ion Batteries Based on a Long Short-Term Memory Neural Network. J. Energy Storage 2021, 37, 102440. [Google Scholar] [CrossRef]
  13. Deng, Z.; Yang, L.; Cai, Y.; Deng, H. Maximum Available Capacity and Energy Estimation Based on Support Vector Machine Regression for Lithium-ion Battery. Energy Procedia 2017, 107, 68–75. [Google Scholar] [CrossRef]
  14. Tu, H.; Borah, M.; Moura, S.; Wang, Y.; Fang, H. Remaining discharge energy prediction for lithium-ion batteries over broad current ranges: A machine learning approach. Appl. Energy 2024, 376, 124086. [Google Scholar] [CrossRef]
  15. Dong, G.; Zhang, X.; Zhang, C.; Chen, Z. A method for state of energy estimation of lithium-ion batteries based on neural network model. Energy 2015, 90, 879–888. [Google Scholar] [CrossRef]
  16. Jiang, N.; Pang, H. Study on Co-Estimation of SoC and SoH for Second-Use Lithium-Ion Power Batteries. Electronics 2022, 11, 1789. [Google Scholar] [CrossRef]
  17. Guo, J.; Guo, Q.; Liu, J.; Wang, H. The Polarization and Heat Generation Characteristics of Lithium-Ion Battery with Electric–Thermal Coupled Modeling. Batteries 2023, 9, 529. [Google Scholar] [CrossRef]
  18. Qiu, C.; He, G.; Shi, W.; Zou, M.; Liu, C. The polarization characteristics of lithium-ion batteries under cyclic charge and discharge. J. Solid State Electrochem. 2019, 23, 1887–1902. [Google Scholar] [CrossRef]
  19. Pang, H.; Yan, X.; Jiang, N.; Fan, G.; Du, J.; Lin, G. Towards co-estimation of lithium-ion battery state of charge and state of temperature using a thermal-coupled extended single-particle model. Energy 2025, 326, 136186. [Google Scholar] [CrossRef]
  20. Zhao, B.; Zhang, W.; Zhang, Y.; Zhang, C.; Zhang, C.; Zhang, J. Research on the remaining useful life prediction method for lithium-ion batteries by fusion of feature engineering and deep learning. Appl. Energy 2024, 358, 122325. [Google Scholar] [CrossRef]
  21. Barré, A.; Deguilhem, B.; Grolleau, S.; Gérard, M.; Suard, F.; Riu, D. A review on lithium-ion battery ageing mechanisms and estimations for automotive applications. J. Power Sources 2013, 241, 680–689. [Google Scholar] [CrossRef]
  22. Xiao, Y.; Lu, Z.; Huang, C.; Yang, F. Battery State of Health Estimation Based on Energy Features and ResNet-SVR Model. Qual. Reliab. Eng. 2025, 41, 1789–1803. [Google Scholar] [CrossRef]
  23. Tian, J.; Zhang, J.; Luo, H.; Huang, C.; Chow, M.; Jiang, Y.; Yin, S. A Feature Extraction and Analysis Method for Battery Health Monitoring. In Proceedings of the 2024 IEEE 33rd International Symposium on Industrial Electronics (ISIE), Ulsan, Republic of Korea, 18–21 June 2024; pp. 1–6. [Google Scholar] [CrossRef]
  24. Sun, R.; Chen, J.; Piao, C. Battery health features extraction and state of health estimation based on real-time online vehicle driving data. J. Power Sources 2025, 645, 236784. [Google Scholar] [CrossRef]
  25. Kraus, M.; Tschernutter, D.; Weinzierl, S.; Zschech, P. Interpretable generalized additive neural networks. Eur. J. Oper. Res. 2024, 317, 303–316. [Google Scholar] [CrossRef]
Figure 1. Discharge current curve of the energy storage device on 14 December 2024.
Batteries 11 00276 g001
Figure 2. The voltage-energy curve of the energy storage station from 16 December to 30 December 2024.
Batteries 11 00276 g002
Figure 3. IGANN architecture [25].
Batteries 11 00276 g003
Figure 4. Prediction framework.
Batteries 11 00276 g004
Figure 5. Discharge current curve for the randomly selected 8-day validation set.
Batteries 11 00276 g005
Figure 6. Scatter plot of prediction errors for the randomly selected 8-day validation set.
Batteries 11 00276 g006
Figure 7. Shape function of the 12 extracted features.
Batteries 11 00276 g007
Figure 8. Contribution of the 12 extracted features.
Batteries 11 00276 g008
Figure 9. Comparison of absolute errors before and after model optimization, sorted in descending order of absolute error.
Batteries 11 00276 g009
Figure 10. (ac) The absolute error comparison between IGANN and WNN at 3.24 V, 3.22 V, and 3.20 V; (df) the absolute error comparison between IGANN and FNN at 3.24 V, 3.22 V, and 3.20 V; (gi) the absolute error comparison between IGANN and LSTM at 3.24 V, 3.22 V.
Batteries 11 00276 g010
Table 1. Parameter information of lithium iron phosphate batteries.
Battery ParametersValueCondition
Width/mm174.7 ± 0.8
Thickness/mm71.57 ± 0.540%SOC, 300 ± 20 kgf
Hight/mm207.20 ± 0.5
Weight/g5560
Rated capacity/Ah314temperature 25 ± 2 °C, discharge rate 0.5 C
Charging cut-off voltage/V3.650 °C < temperature ≤ 60 °C
Discharging cut-off voltage/V2.50 °C < temperature ≤ 60 °C
Table 2. Key field information.
ParameterResolutionSampling Frequency
Time1 s5 s
Cluster current1 mA5 s
Cluster voltage1 mV5 s
Cell voltage1 mV5 s
Cell temperature1 °C5 s
Table 3. Working condition characteristic parameter.
FeatureSignificance
T/sPresent cumulative time
Im/AAverage current
Is/ACurrent variance
Imax/ACurrent peak value
Imin/ACurrent valley value
Imid/AMedian current
I25%/ACurrent 25th percentile
I75%/ACurrent 75th percentile
I*/ARMS of current
U/VPresent voltage
Um/VAverage voltage
Ek/WhPresent accumulated released energy
Table 4. Model parameter configuration.
ParameterValue
task“regression”
n_estimations6000
n_hid20
boost_rate0.1
init_reg1
elm_alpha1
early_stopping30
Table 5. Training log.
Number of Training IterationsBoost RateTrain Loss
00.10.02008
10.10.01784
350.10.01021
38540.10.00550
38840.10.00550
Table 6. Prediction results and errors of the 8 randomly selected 8-day validation set.
IndexReal SOAEPredicted SOAEAbsolute Error
150.40%53.29%2.89%
240.30%42.80%2.50%
335.60%38.58%2.98%
455.20%55.94%0.74%
542.80%42.07%0.73%
641.00%37.05%3.95%
746.03%44.55%1.75%
839.70%43.27%3.57%
Mean43.91%44.69%2.39%
Table 7. Prediction results and absolute errors of the optimized model at 3.24 V, 3.22 V, and 3.2 V.
Index 3.24 V 3.22 V 3.2 V
Real
SOAE
Predicted SOAEAbsolute ErrorReal
SOAE
Predicted SOAEAbsolute ErrorReal
SOAE
Predicted SOAEAbsolute Error
172.70%74.85%2.15%50.40%53.61%3.21%32.50%33.81%1.31%
275.90%74.91%0.99%40.30%43.57%3.27%22.60%22.17%0.43%
383.40%80.27%3.14%35.60%38.16%2.56%15.30%16.87%1.57%
467.80%71.65%3.85%55.20%55.17%0.04%26.90%22.32%4.58%
570.70%71.43%0.73%42.80%43.42%0.62%13.50%12.00%1.50%
666.70%68.21%1.51%41.00%39.14%1.86%16.80%15.99%0.81%
767.30%69.60%2.30%46.30%45.14%1.16%17.40%14.32%3.08%
856.20%63.87%7.67%39.70%44.40%4.70%25.20%25.23%0.03%
MAE70.09%71.85%2.79%43.91%45.33%2.18%21.28%20.34%1.66%
Table 8. Comparison of the mean absolute errors for IGANN, WNN, FNN, and LSTM.
Model Type3.24 V MAE3.22 V MAE3.2 V MAE
IGANN2.79%2.18%1.66%
WNN4.54%2.94%1.87%
FNN2.99%2.68%4.6%
LSTM3.17%2.77%3.45%
Disclaimer/Publisher’s Note: The statements, opinions and data contained in all publications are solely those of the individual author(s) and contributor(s) and not of MDPI and/or the editor(s). MDPI and/or the editor(s) disclaim responsibility for any injury to people or property resulting from any ideas, methods, instructions or products referred to in the content.

