1. Introduction
The entrance of the electric vehicle (EV), the growth in industry, and world energy demand together, with a raise in environmental consciousness, force the transformation of the electricity grid in many countries. New electricity services are under study for their expected economic or functional benefits such as: peak shaving, load leveling, area regulation, transmission deferral, renewable firming, among others [
1,
2,
3,
4], in addition to new concepts, like distributed generation [
5] or the need for smart grid implementation [
6]. Energy storage systems (ESS) offer solutions to these new businesses [
7], but their possible entrance to the electricity market depends of the particularities of each country. For example, the important penetration of wind and solar energy generation and the high-energy and ancillary services prices in Spain are highly attractive factors. On the contrary, its major drawback resides in the lack of subsidies and impeding regulation [
8].
Nonetheless, batteries seem to be able to provide optimal responses for many of these services. In particular, lithium-ion batteries are the ones having a wider range of applications [
9]. However, although lithium-ion batteries’ prices are expected to decrease in the following years, they are still too expensive to be massively deployed on stationary applications [
10].
To overcome this economic barrier, the idea to reuse batteries from electric vehicles has been proposed. It is generally accepted that EV batteries are expected to be inappropriate for traction purposes after they reach an 80% of their state of health (SoH) [
11]. Still having a significant amount of functional capacity, Foster et al. [
12] consider that 85% of all EV batteries may be reused on the aforementioned stationary applications at a much lower cost [
13], giving them a second life and possibly leading to a cost reduction of EV prices [
14]. In fact, different ways to affront remanufacturing processes have been already proposed, such as direct reuse [
15,
16] or module and cell dismantling [
17].
Second-life batteries in electricity grid quality services find an important market with profitable businesses. In fact, area or frequency regulation—which increases or decreases the energy injected into the grid to instantly balance generation and demand, or maintain the frequency between the working limits—seems to be the most promising [
18,
19].
Nowadays, area and frequency regulation services are provided by turbine generators due to their relatively fast response in comparison to other mechanic systems. Moreover, hydraulic turbines generally provide this service due to their low operation cost, as they have no need to buy and burn any fuel. However, season and weather conditions may disrupt their functionality, giving gas turbines and other cogeneration plants the opportunity to participate into the business. Trying to increase their participation in the electricity regulation market, gas turbines may profit from second-life batteries to gain competitiveness. This study presents two study cases where second-life batteries give support to a gas turbine power plant and estimates their rest-of-useful life (RUL) under these two scenarios.
In order to precisely estimate RUL, it is necessary to use an aging model that considers all factors that have an influence on battery aging. Devie and Dubarry [
20] reported that most studies use inaccurate aging models. In fact, many use simple models based on the expected number of cycles; the accumulated ampere hour (Ah) throughput; or expected lifetime, adjusted by temperature, Depth of Discharge (
DoD) [
19], or, in the best cases, adjusted by more than one factor. The aging model used in this paper considers calendar and cycling aging adjusted by the following factors: State of Charge (SoC) or voltage (
V),
DoD, current or intensity (C-rate), temperature (
T), Ah throughput, and time (
t) [
21].
In summary, this study estimates the RUL of a second-life EV battery applied to real area regulation signals by means of an equivalent electric circuit model. To do so, this study considers a directly reused 24 kWh battery from a single EV installed on a 500 kW up/down power plant built on multiple gas turbines, specifically dedicated to area regulation services under two possible work scenarios.
The paper is structured as follows: first, primary results are shown, followed by a Discussion section. Next, the Material and Methods section presents the details of the scenarios and the battery aging model used in order to fully understand the results presented beforehand. Finally, a Conclusion section summarizes the study and highlights major findings.
2. Results
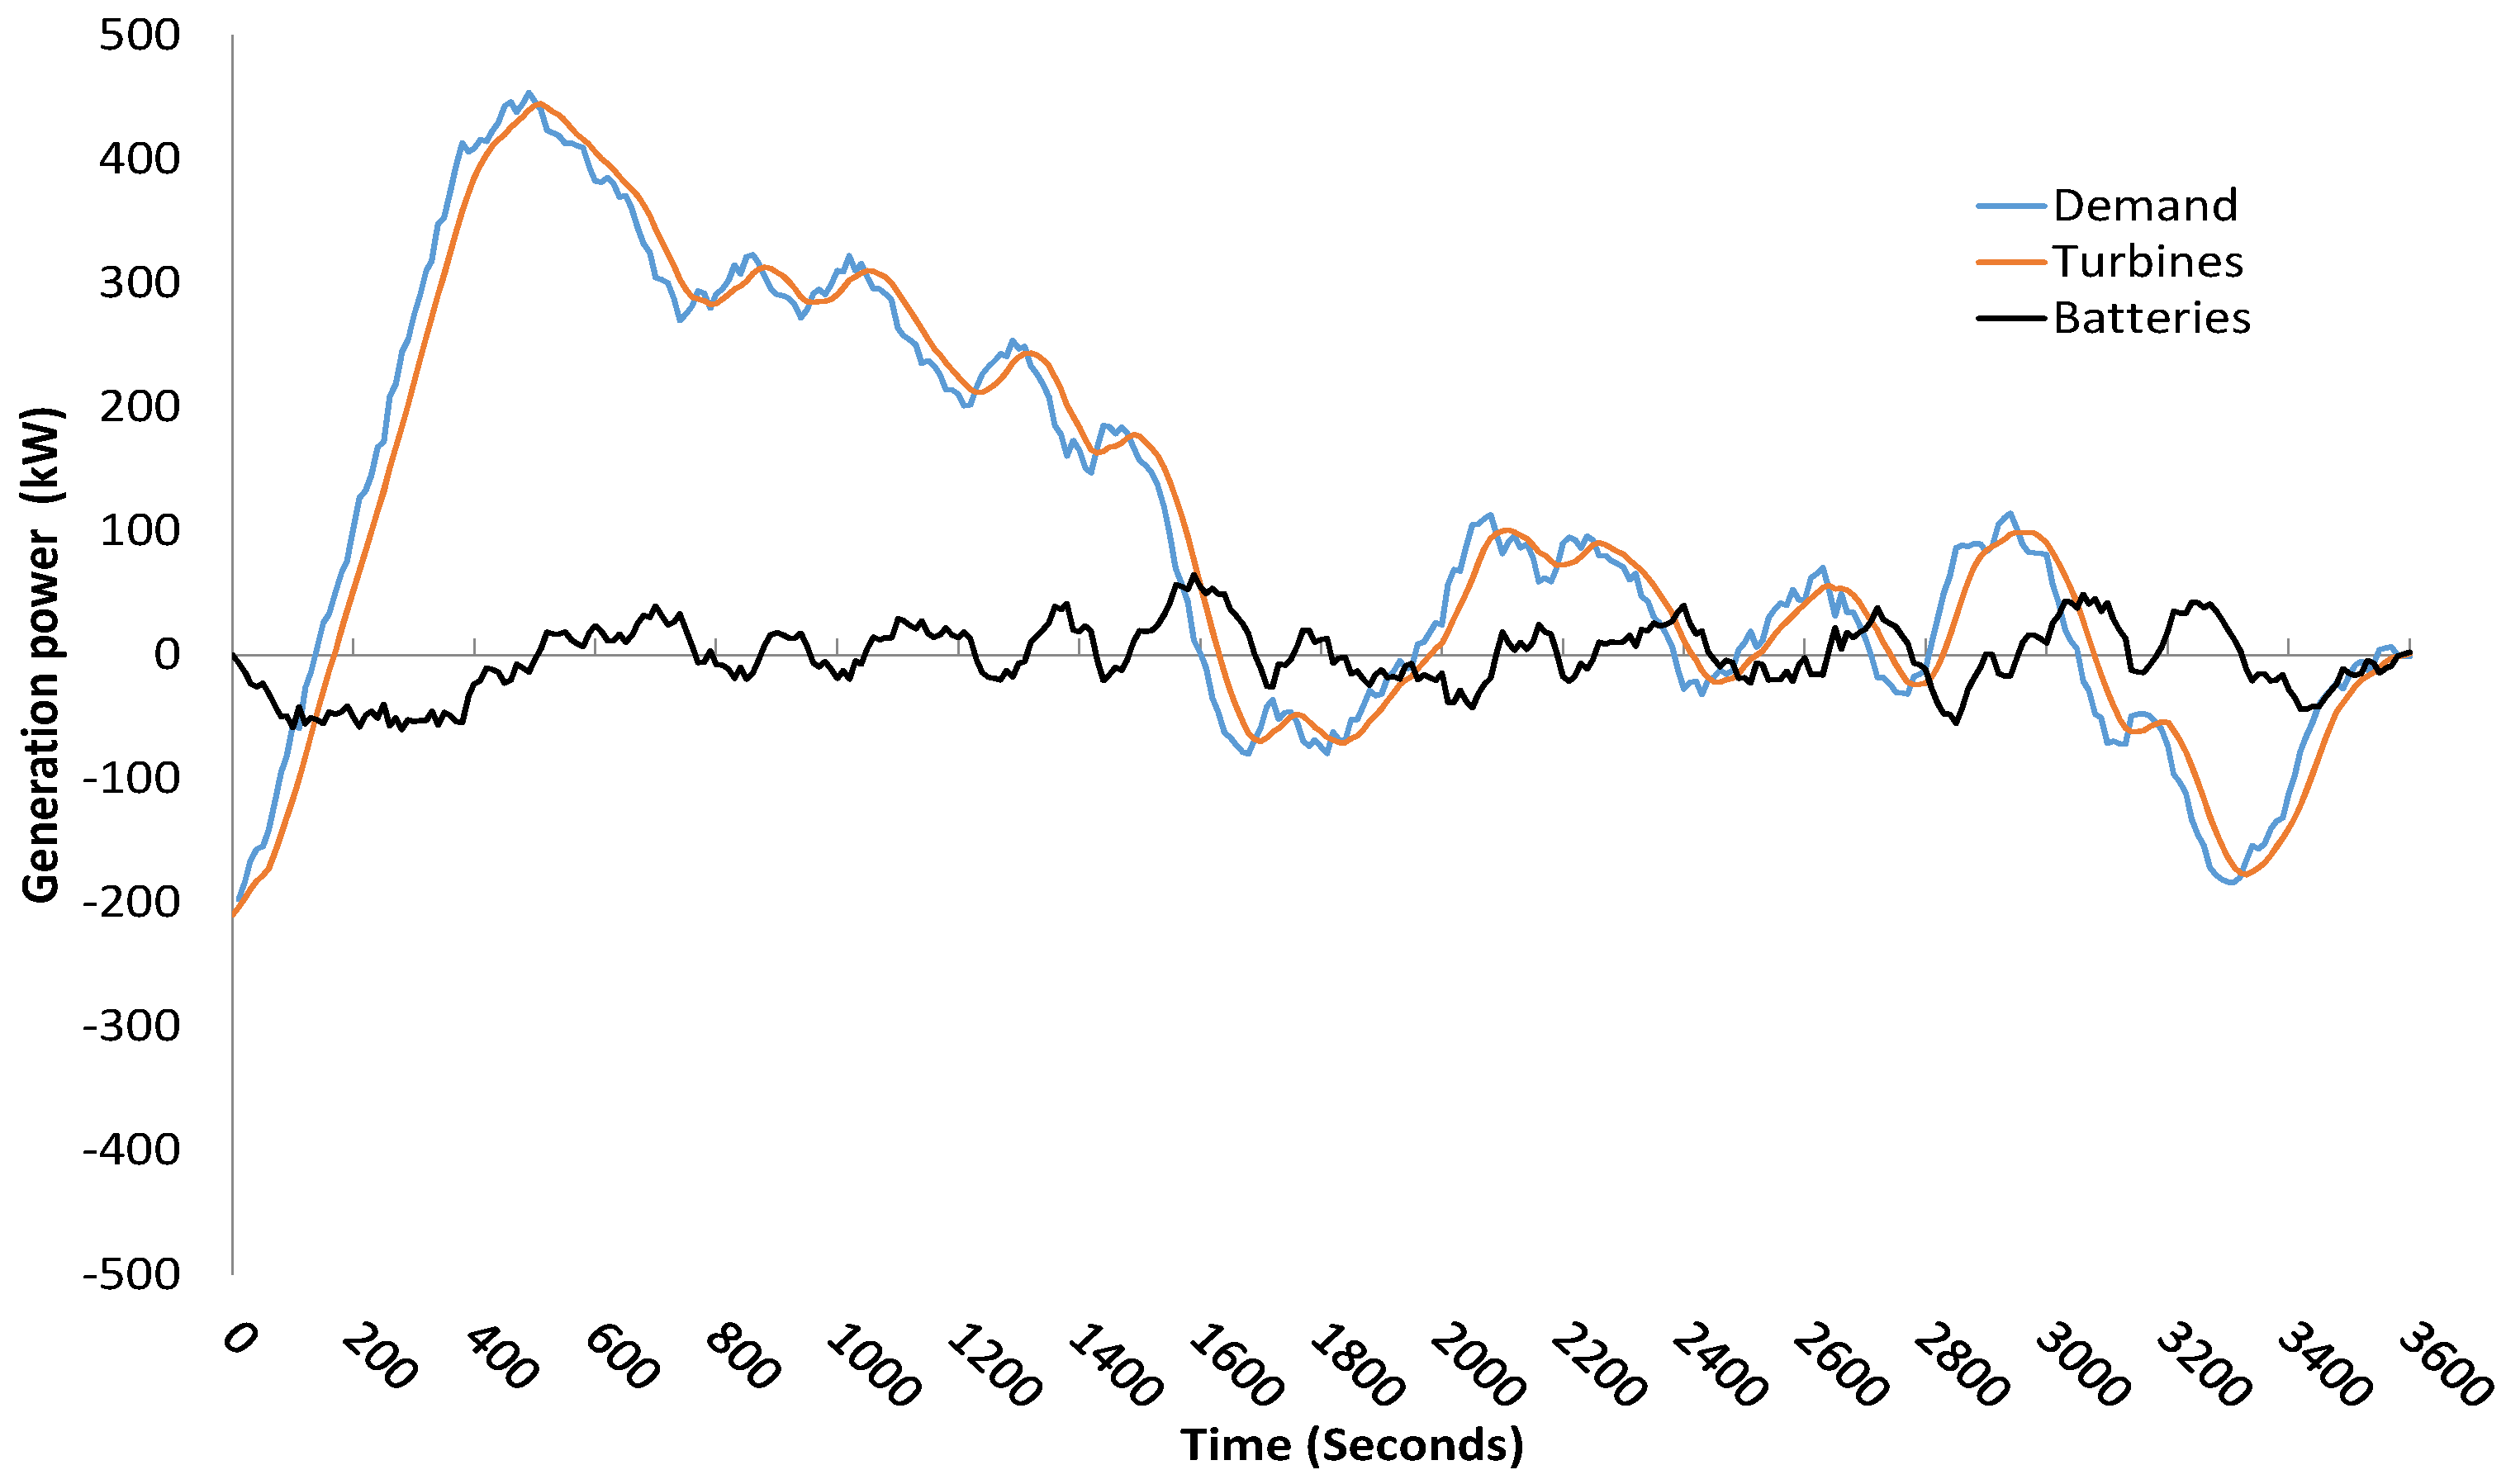
In the first scenario, turbines work under a softened load resulting from the average demand of set points during the previous minute.
Figure 1 presents the resulting working loads for gas turbines (orange) and batteries (black), which together follow the set points (blue) given by the electricity grid operator. The total amount of energy exchanged by the battery during this 1 h period is close to 22.38 kWh, considering charge and discharge together.
On the other hand,
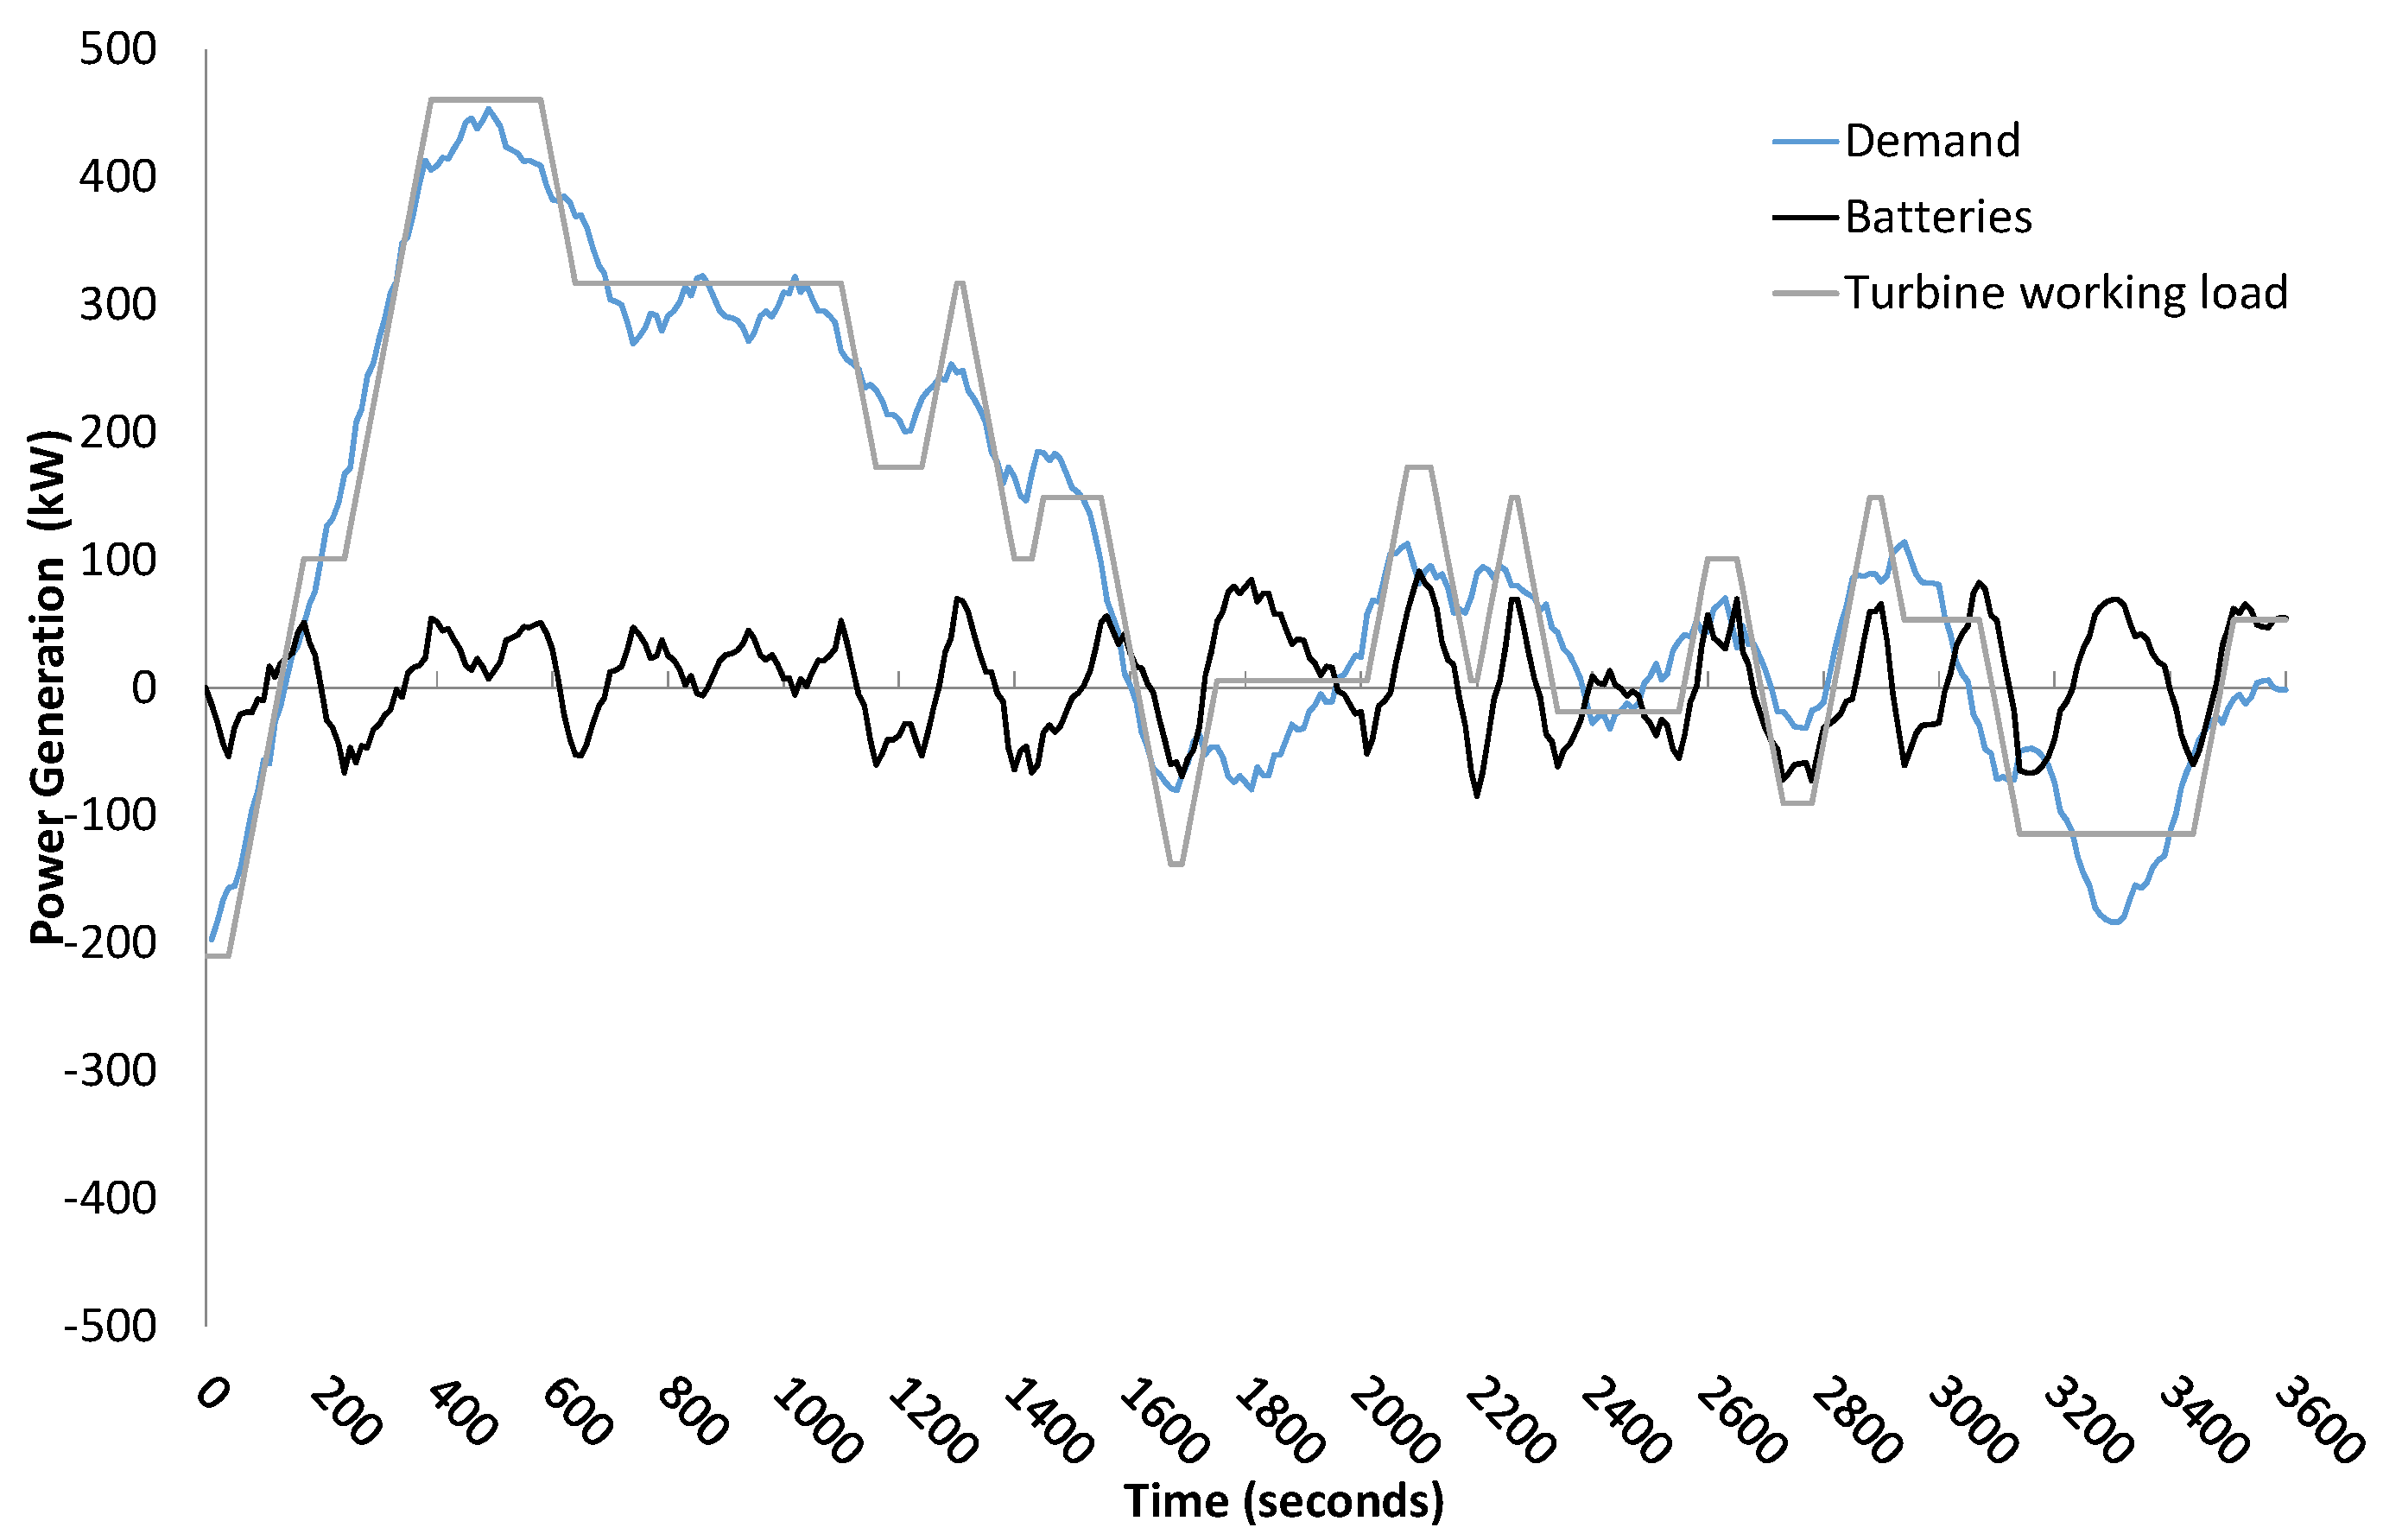
Figure 2 presents the working loads for turbines (grey) and batteries (black) resulting from the second scenario, where turbines work under constant power or constant acceleration/deceleration states.
Notice that the energy exchanged by the battery in this second scenario raises above 40 kWh (20 kWh charge/discharge), which almost doubles the amount of energy exchanged in scenario 1. Additionally, this scenario requires higher power rates to the battery than the first scenario.
Considering the extreme load conditions, 24 and 22 continuous cycles per day in the first and second scenario, respectively, it is not surprising that batteries age quickly.
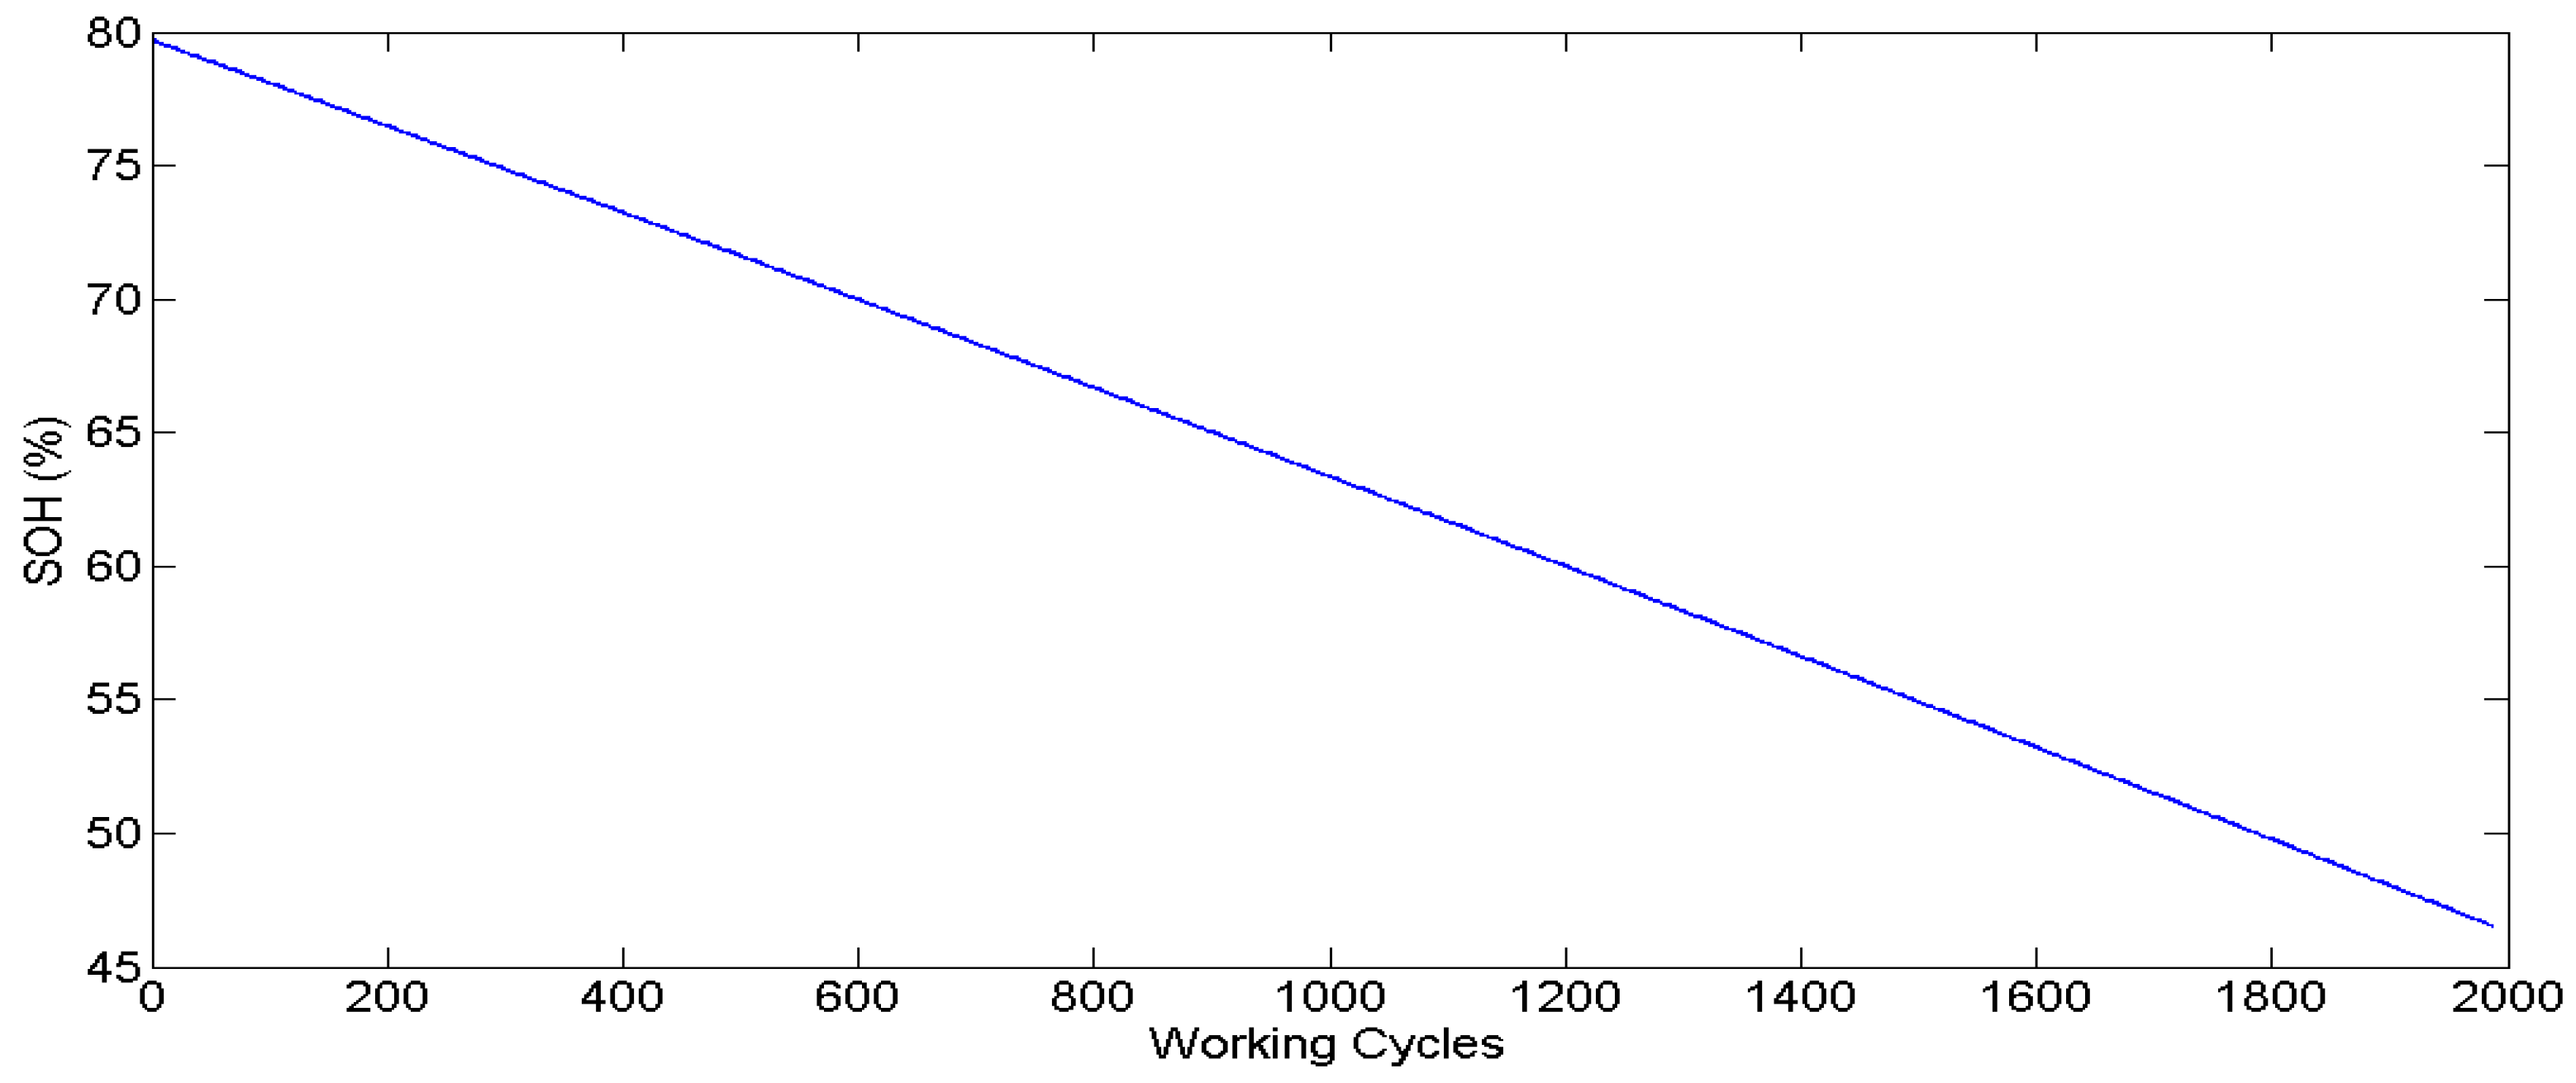
Figure 3 shows the aging or SoH evolution against the number of cycles for the first scenario. These results indicate that the EV battery—installed to provide softer working changes to turbines—lasts over 2000 cycles before reaching its end of life (EoL). The EoL occurs when the battery cannot provide all the energy needed to fulfill the demand set points given by the electricity regulator. That is, the battery reaches its minimum SoC conditions while the systems still demand energy. This EoL corresponds to a 46.53% SoH (
Figure 3) and it is reached after 84 days working nonstop, which represent a total amount of energy drawn from the battery of 22,293 kWh.
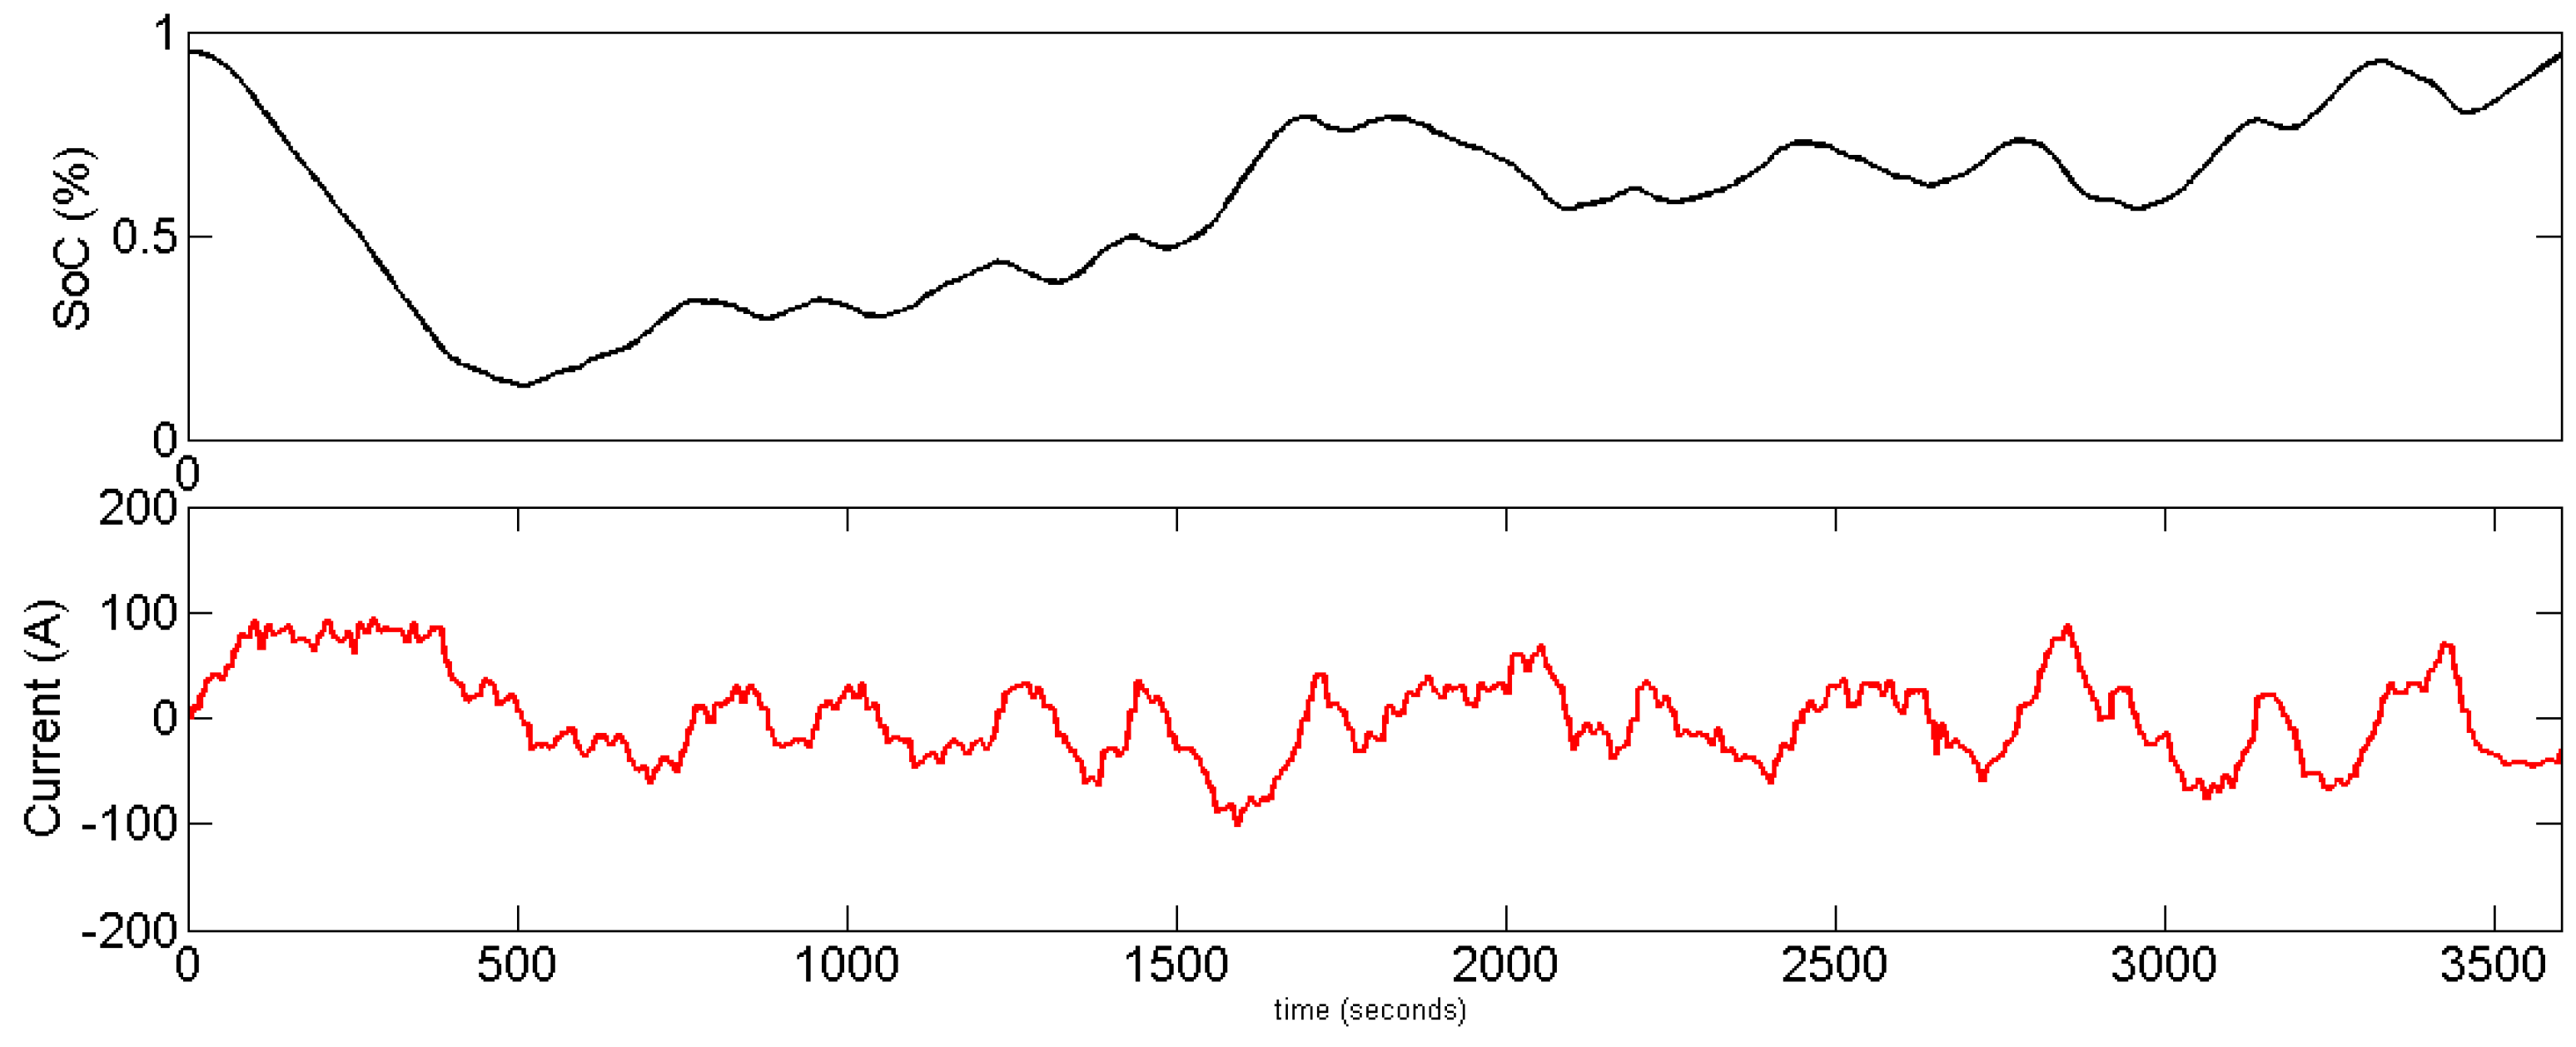
Figure 4 presents the evolution of SoC (black) according to the input current load (red) in one of the last cycles of the battery for the first scenario. Notice that minimum SoC is close to 10% and maximum SoC is near 95%, while at the beginning of the second life, SoC ranged from 95% to 40%. In fact, 95% and 10% SoC are some working limitations fixed by the car manufacturer to ensure battery lifespan during its first life. These limitations cannot be modified for the second life if we expect car manufacturers to maintain the warranty during the second life.
Finally,
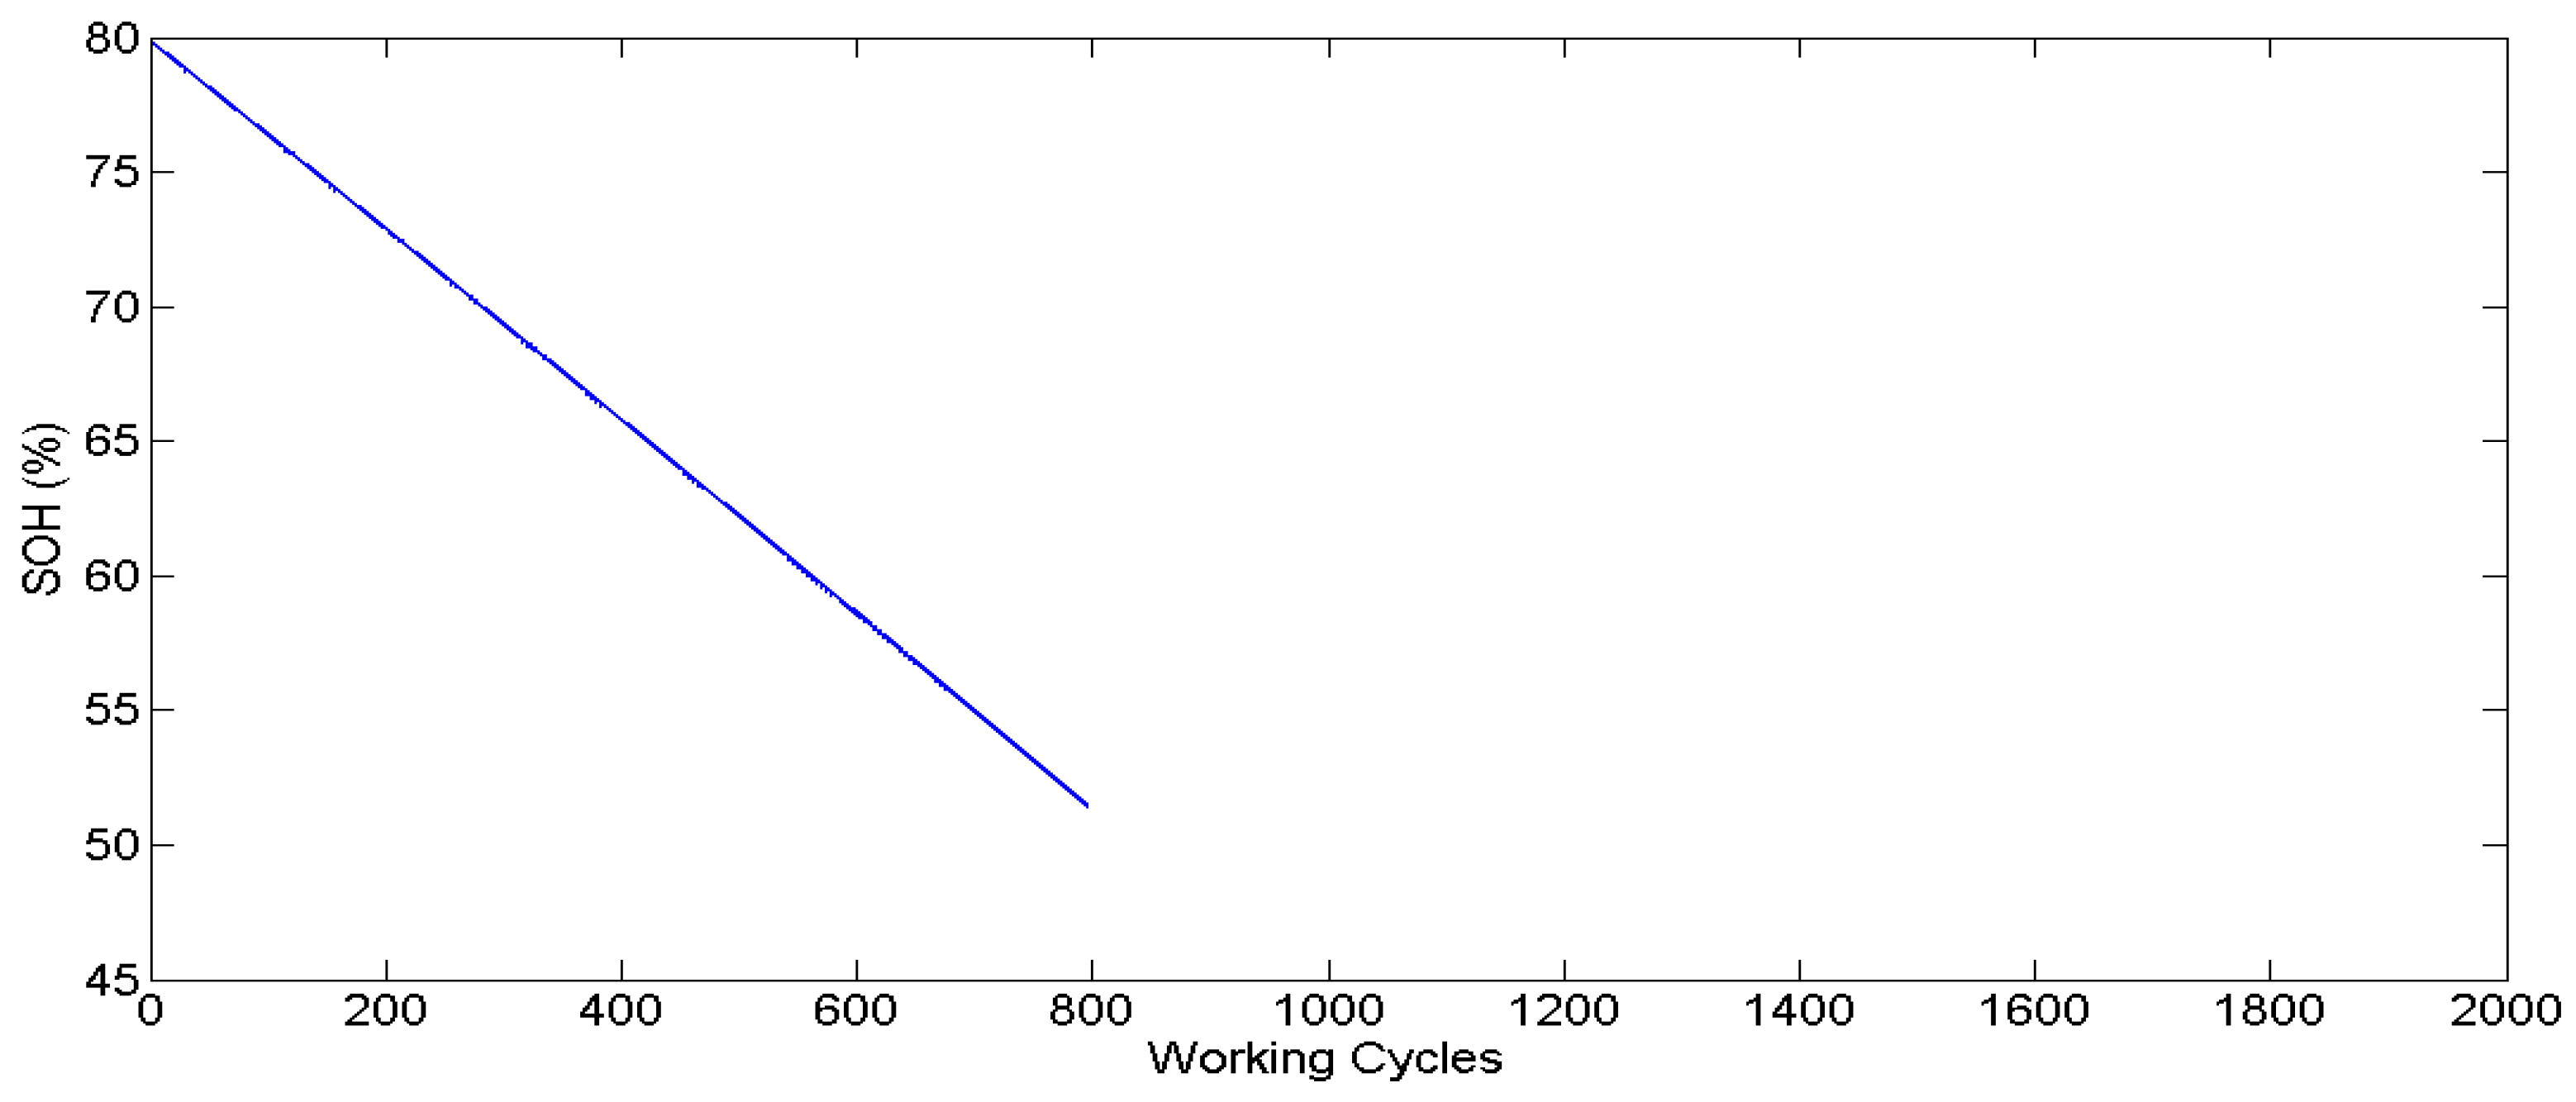
Figure 5 presents the evolution of SoH (or aging) for the second scenario. Having higher power and energy demand than the battery, the EoL in this scenario corresponds to 51.43% SoH, which is a 5% higher than in the first scenario. Moreover,
Figure 5 shows that it takes less than 800 cycles to reach this EoL, which correspond to only 36 days and a total amount of energy drawn by the battery of 15,919 kWh. This means that, under the second scenario, the battery’s lifespan is less than half the lifespan of the first scenario.
A comparison between
Figure 3 and
Figure 5 is enough to appreciate how higher load requirements have a strong impact on battery aging.
Knowing that, for security reasons and to enlarge lifespan, the EV battery capacity range is limited to a 95%–10% SoC range and that the EV battery has 24 kWh capacity when fresh, its available capacity is reduced to 20.4 kWh at the beginning of the first life. In addition, if the second life begins at 80% SoH, the available capacity at the beginning of the second life is reduced to 16.32 kWh. Finally, at the EoL of scenario 1 and 2, the battery capacity decreases until 9.49 and 10.49 kWh, respectively.
Lifespan results are expressed in working cycles, which are different for both scenarios. Thus, in order to compare result, they should be translated to full equivalent cycles. A full equivalent cycle is a complete discharge and charge cycle, from 100% SoC to 0% and back to 100% SoC. In our case, as the battery degrades over time, the capacity of a full equivalent cycle also declines. In consequence, the battery does 0.69 equivalent full cycles per working cycle at the beginning of the second life for the first scenario, which corresponds to 16.45 equivalent full cycles per day, and ends up doing 1.18 equivalent full cycles per working hour at the EoL (when the battery has only 9.49 kWh capacity), corresponding to 28.3 equivalent full cycles per day. This means that, during the whole lifespan, the battery performs 1880 equivalent full cycles.
Similarly, the second scenario has a ratio between equivalent full cycles and working cycles of 1.23 at the beginning of the second life and 1.91 when the battery reaches the EoL. This represents the battery performing 29 equivalent full cycles per day at the beginning of the second life, and ends up doing 42 equivalent full cycles, which corresponds to a lifespan of 1241 equivalent full cycles. This is still lower than in scenario 1, but 1/3 higher in comparison to working cycles.
Finally, the difference in aging per cell should be considered. In fact, although using the same type of cells, not all of them will age in exactly in the same manner. Some age slightly faster or slower than others. Most of the aging studies in literature use commercial 18650-format Li-ion cells, which have a relevant deviation regarding aging [
22]. However, EV batteries use improved cells with temperature and balancing control devices that reduce this deviation. In fact, a study of cell aging in an EV [
23] reported that the deviation observed between all cells when they reached 80% SoH corresponded to only 3%. Assuming that aging deviation increases linearly, when they reach the EoL in the analyzed scenarios (51% and 46% SoH), the deviation would be close to 7.35% and 8.1%, respectively. This variation means that the EoL may occur within the 51% ± 3.675% and 46% ± 4.05% confidence range.
3. Discussion
Based on the results presented in
Section 2, it seems that battery aging is almost 2.5 times more aggressive when working in the second scenario, which does 800 cycles during 36 days in comparison to the almost 2000 cycles and 84 days in the first scenario. However, this huge difference is blurred by several aspects, such as the working cycle differences and the EoL variation. When comparing results using full equivalent life cycles, their endurance translates to 1880 and 1241 full equivalent cycles for the first and second scenario, respectively. This represents a 6% reduction for the first scenario and a 56% increase in the second study case.
Finally, in order to correctly evaluate the aggressiveness of the working loads on battery aging, it is necessary to compare the equivalent full cycles considering the same EoL. To do so, the final SoH will be that of the second scenario, which has a higher value. With this correction, the number of full equivalent cycles performed to reach the 51.43% SoH of the battery in the first scenario is reduced to 1508. Thereby, after these corrections, results show that the aging aggressiveness of the second scenario is just 21% stronger than the aging from the first scenario.
These results do not seem bad when regarding the number of cycles these batteries can do in comparison to the 1000 cycles reported by Ciccioni et al. [
24], the 1500 cycles on ancillary services from Strickland et al. [
25], or between 2000 and 1000 full equivalent cycles reported by Muenzel et al. [
26] on batteries working in the range from 40% to 100%
DoD, but they are alarming in terms of days. If batteries should work continuously under exposed load conditions, they will certainly not enter into the market.
However, as expressed in the Methodology section regarding the study limitations, a nonstop continuous working condition is rare for gas turbine plants in the area regulation market. Thus, if the number of cycles per day reduces significantly, battery lifespan will increase accordingly.
Furthermore, notice that the EoL estimated for these two second-life applications fall below the 60% SoH. There are not many studies on EV cells and batteries that cycle batteries until such a low SoH. In fact, most of them finish when the battery reaches the 80% SoH. Therefore, it is possible that other unexpected circumstances will occur beyond this limit, such as the aging knee phenomena.
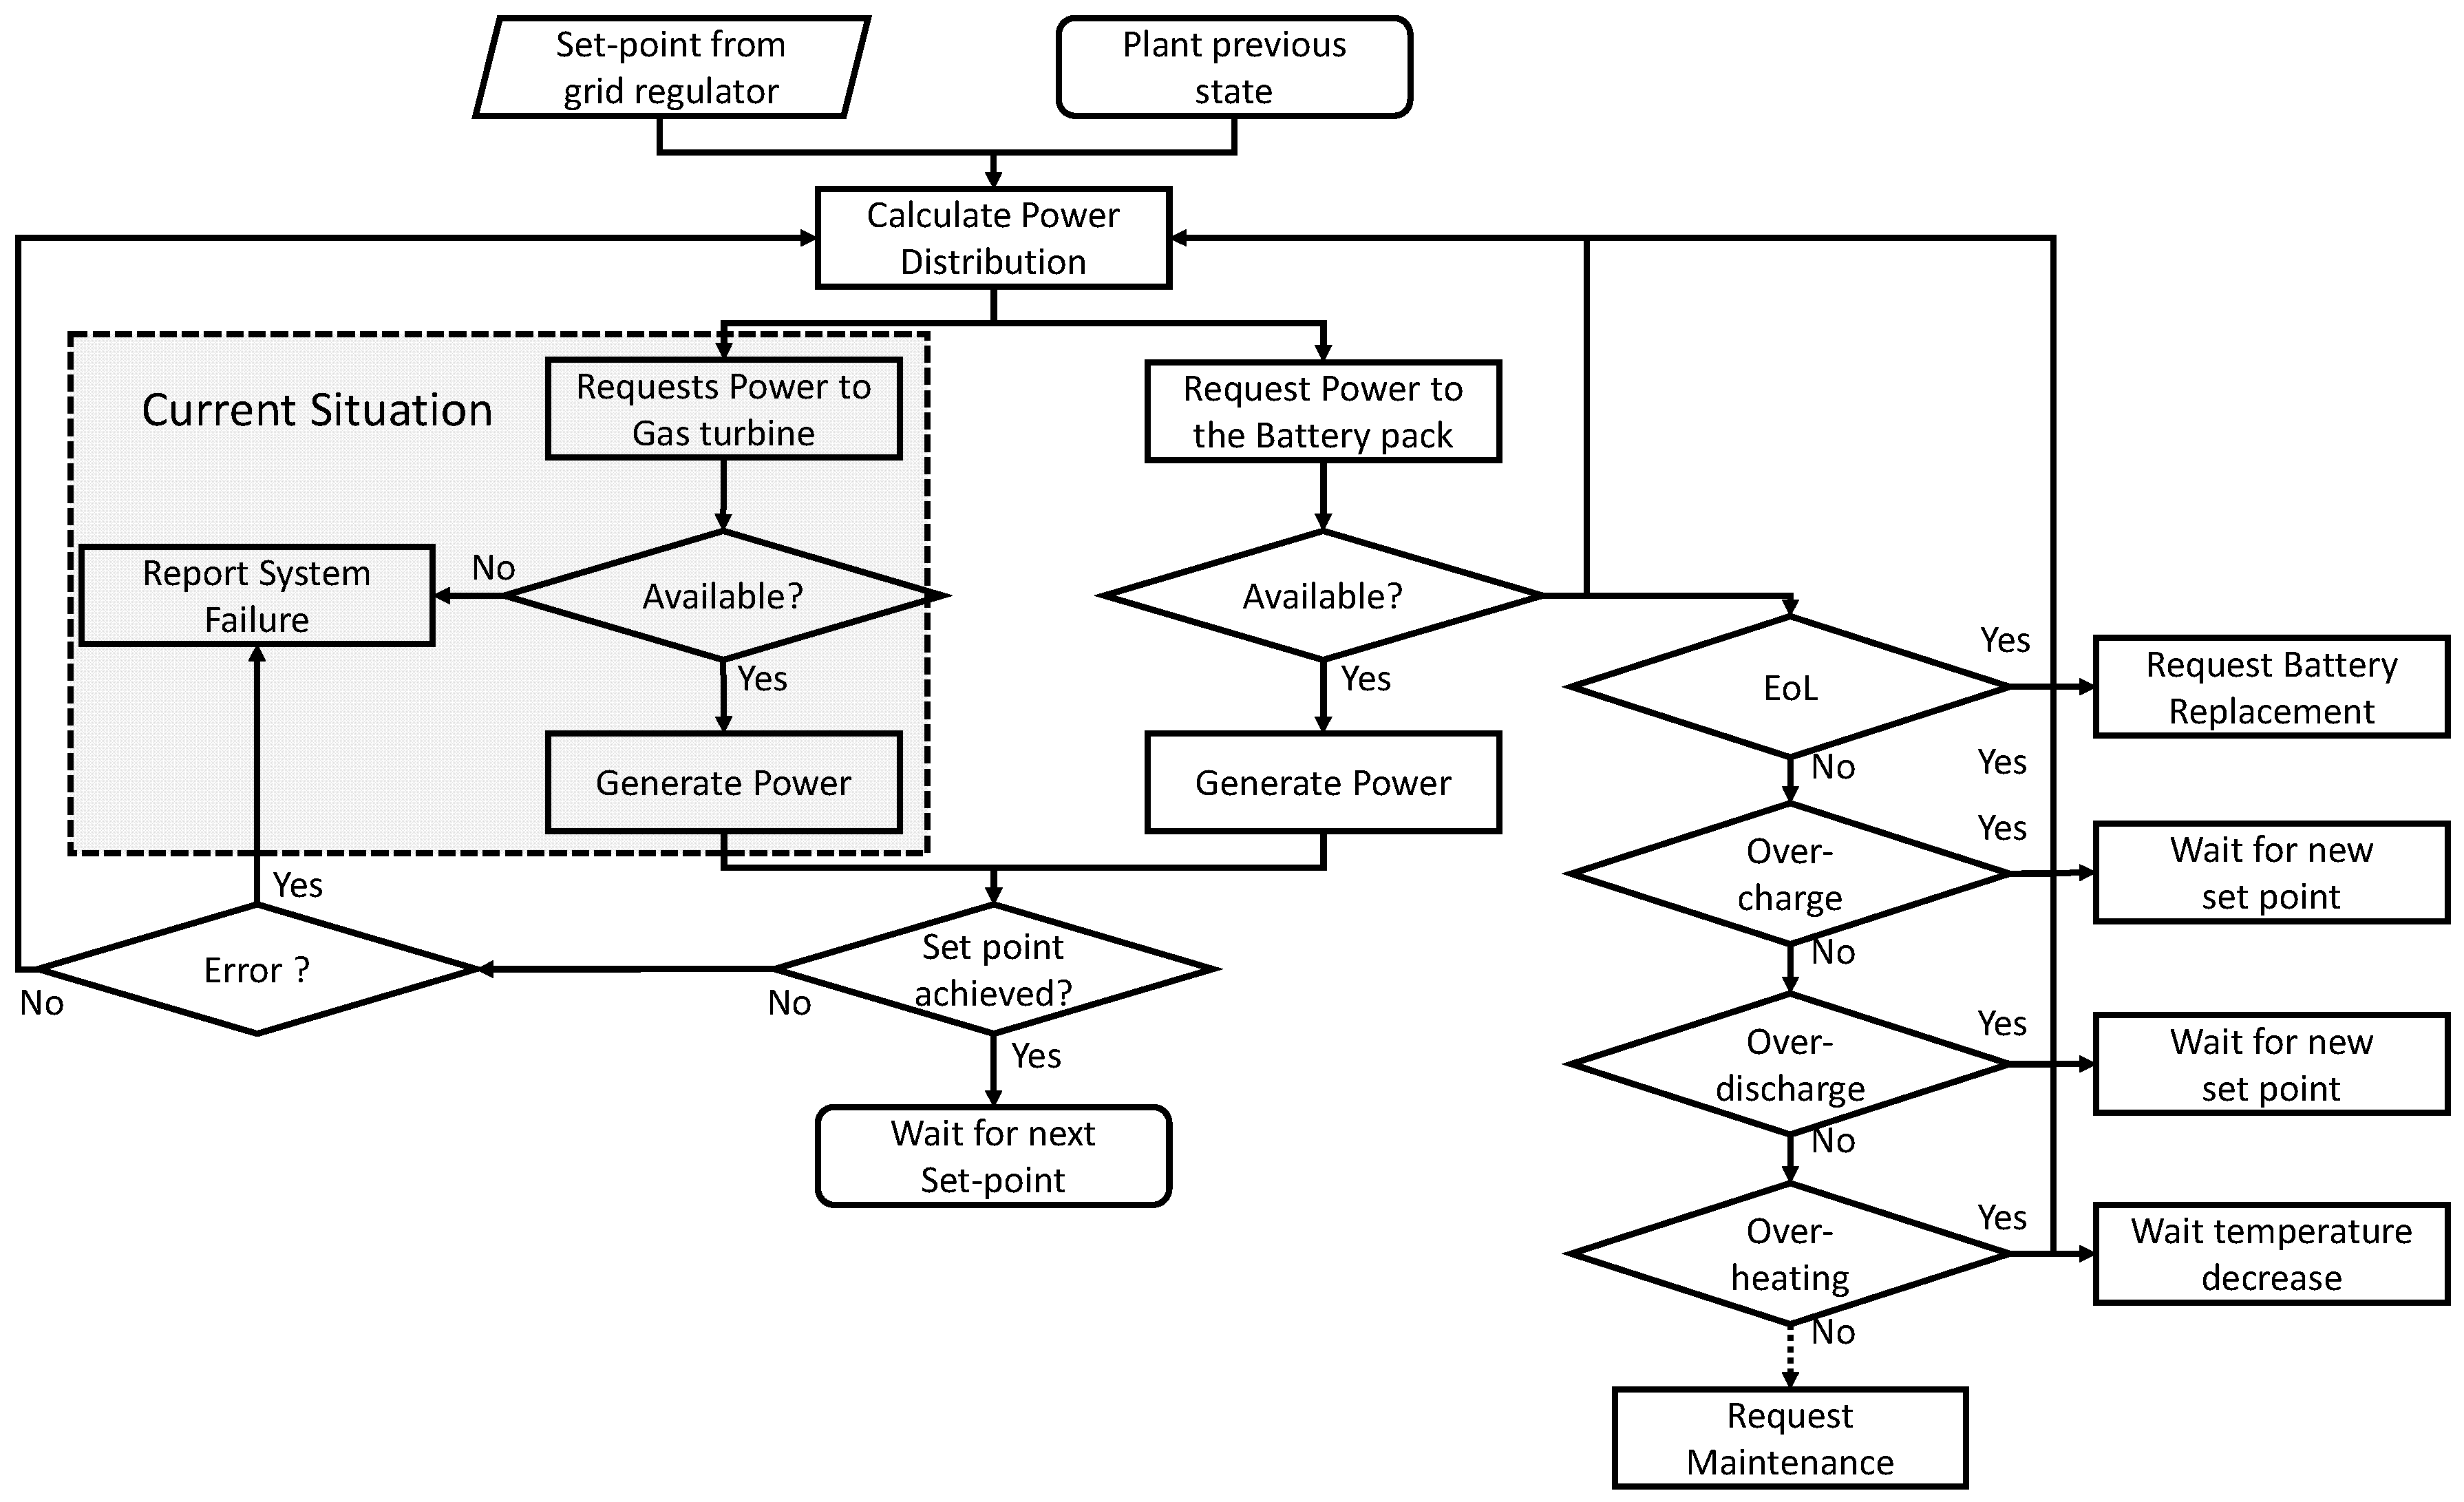
Nonetheless, the battery control system, being part of the EV battery pack, ensures that the working conditions of the battery will always be under the safety and secure working limits. That is, there would be no overvoltage, overcharge, over-discharge, or overheating, among others. In fact, if the battery management system (BMS) reports to the power plant that the battery is close to any of its working limits, the system would gradually decrease the battery load demand so that it is only able to work with the gas turbine on its current configuration until the battery is checked, replaced, or ready to work again.
Figure 6 presents a simplified control diagram that exemplifies how the plant should always work properly, even if there is a failure on the battery stack.
Additionally, this study assumes that there is only one reused EV battery to give support to the whole gas turbine system. Putting more batteries in series or parallel, thus multiplying their power and capacity, would significantly improve these aging results, as some of the aging factors would reduce their impact, such as DoD, C-rate, and Ah throughput. Howbeit, investments would increase in consequence, forcing a deep economic study to be performed.
Technically, batteries could participate directly in the area regulation market, absorbing or providing energy to the grid when needed. That is, there would be no baseline of energy to inject as it occurs now. Unfortunately, Spanish legislation does not allow batteries to participate in the area regulation market, so they need to work by the hand of another energy generation system.
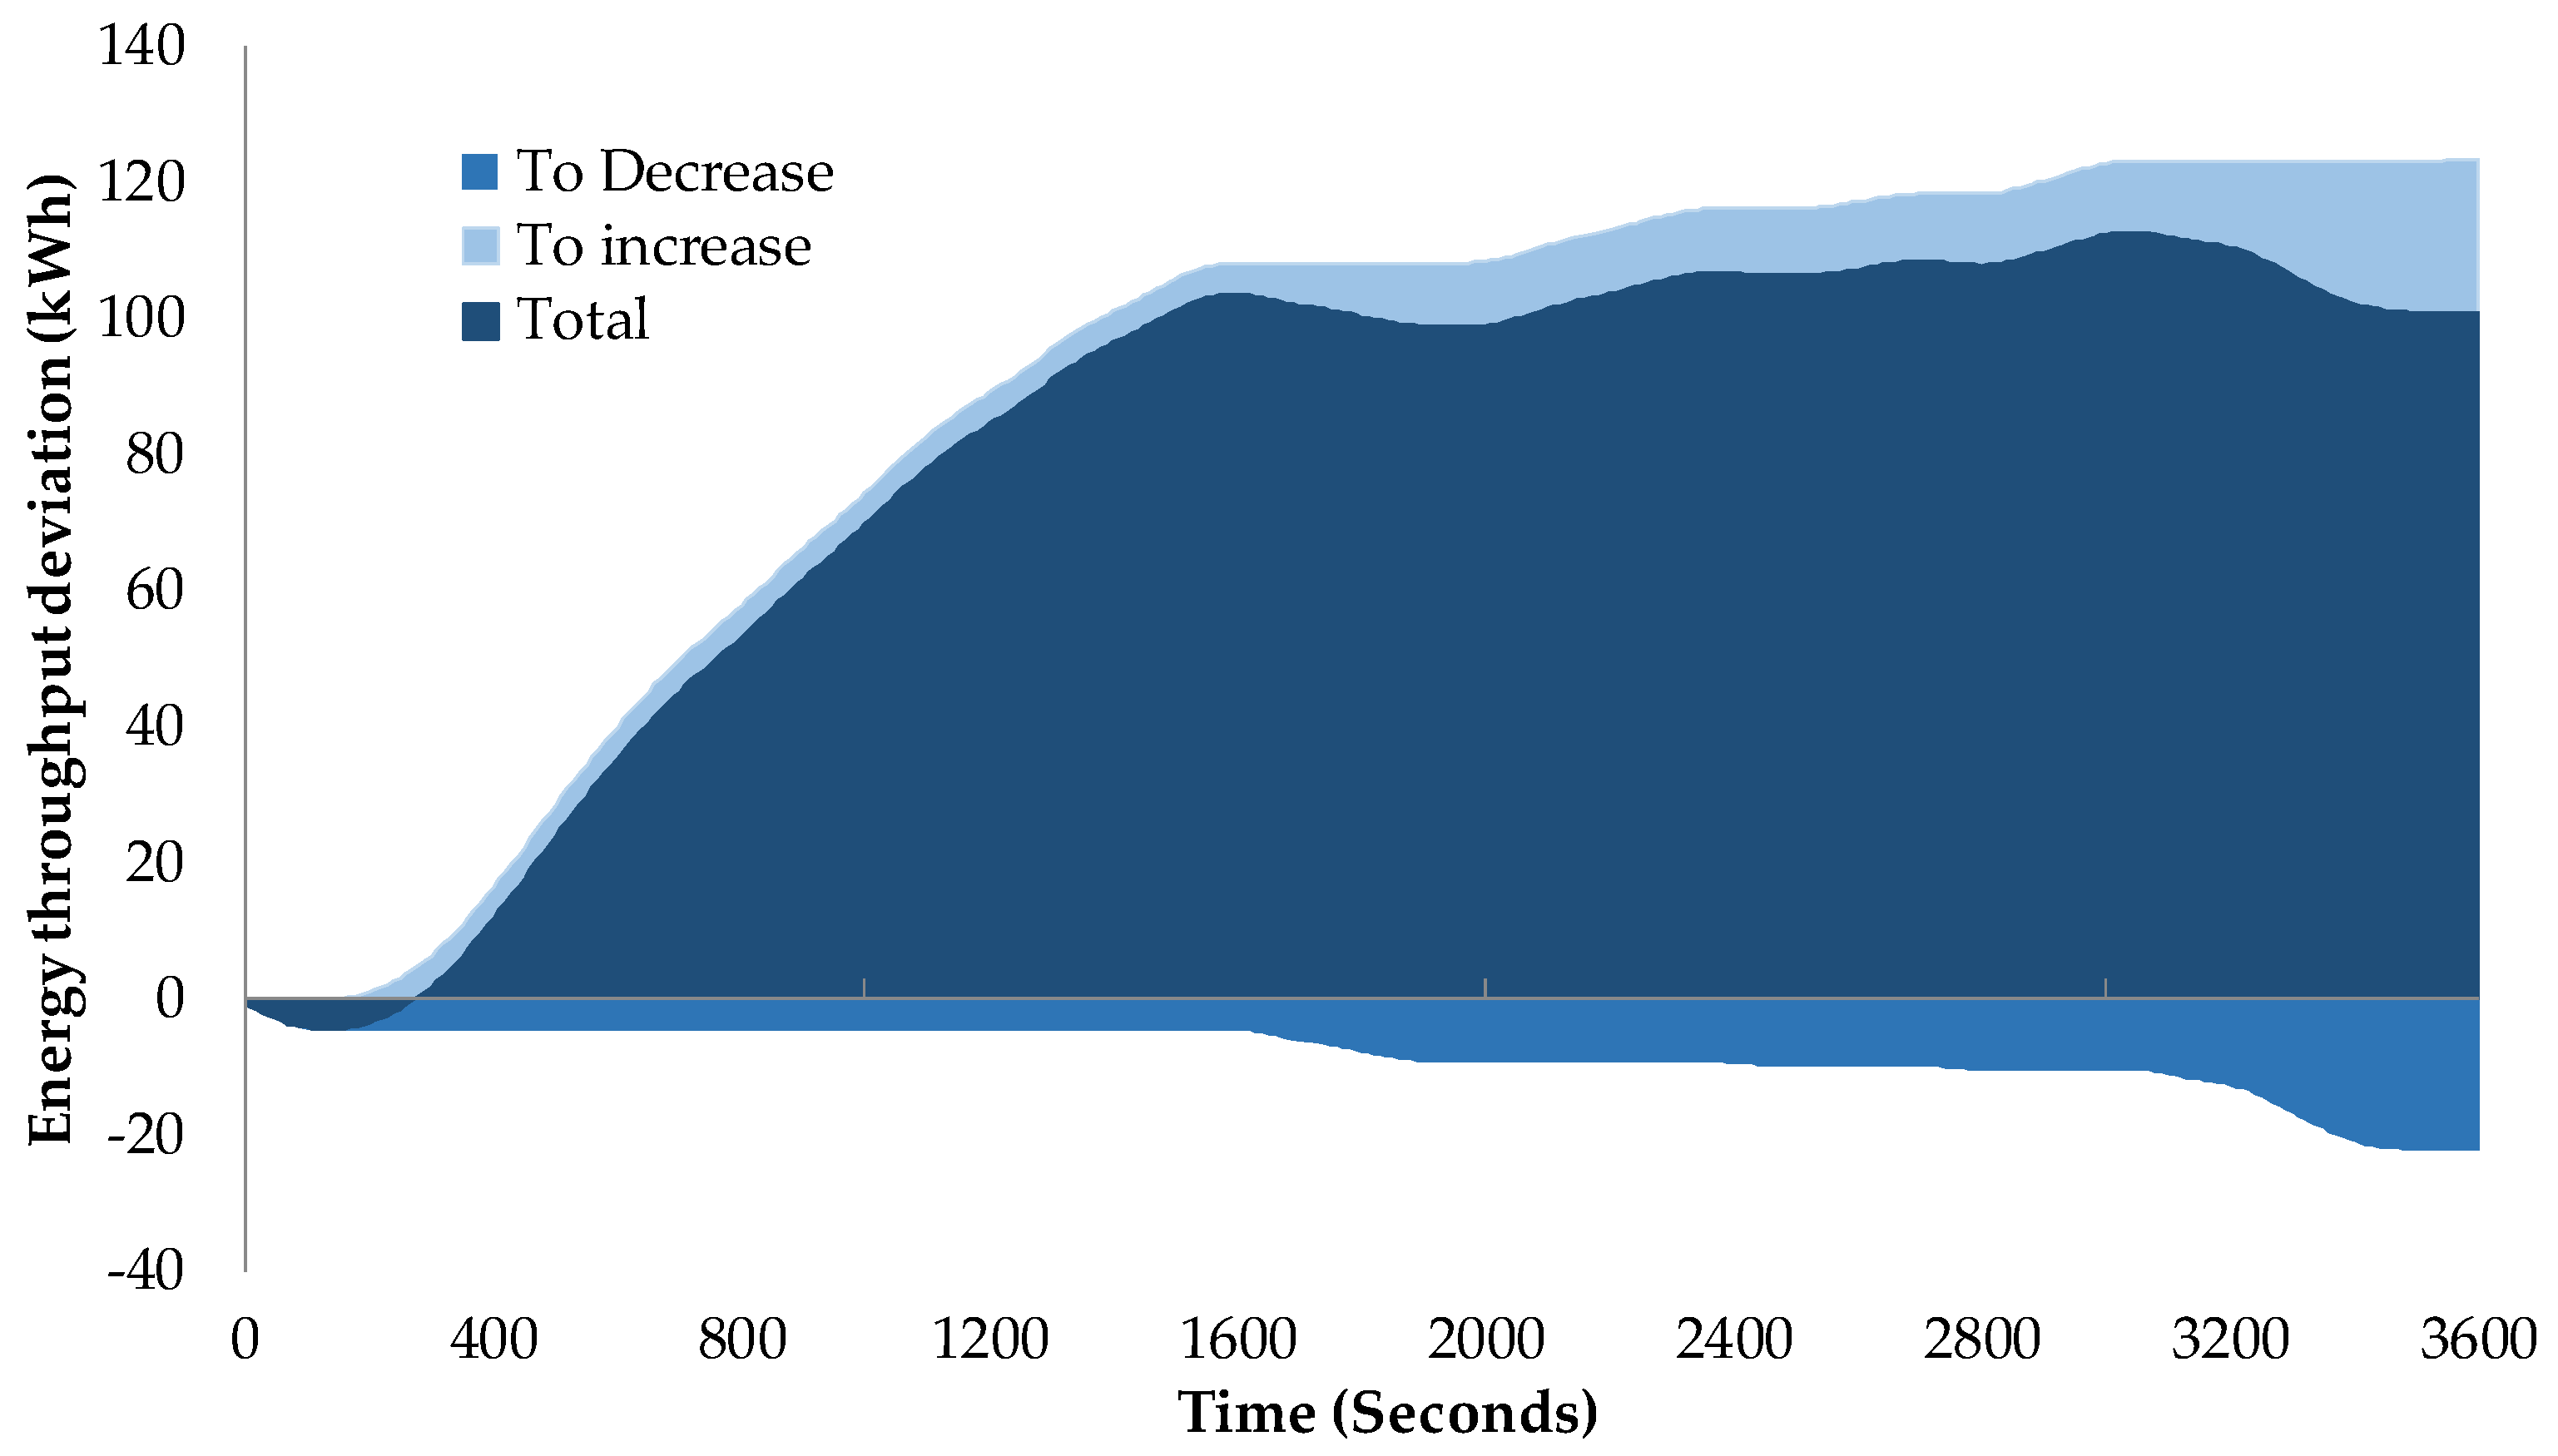
Nonetheless, area regulation has a stronger tendency to increase the load demand rather than to decrease it, which is why the electricity grid presents the increase/decrease ratio as 58%/42% . This means that batteries would tend to be empty after some cycles and would need to recharge to be capable of running the system again. This is exactly the case of the presented hour timeframe, where the grid operator asks for higher amount of energy to inject to the grid, rather than to reduce it.
Figure 7 presents how, between second 150 and 1550, the system is constantly injecting more energy than the baseline, and from there to second 3600 it stabilizes, finishing with an accumulated total energy of 101 kWh. In the presented situation, there is 123 accumulated kWh to increase and 22 kWh to decrease during this 1 h period.
Moreover, the amount of batteries needed to provide 0.5 MW power and the enormous quantity of energy derived represent a lot of batteries stacked together, needing deep economic business and cost analysis, which should be discussed in future works.
4. Materials and Methods
Generally, when a system enters into the area regulation market, the electricity grid operator examines it and fixes its maximum working load conditions and ramps up or down so the operator will not demand something that the facility cannot provide. In Spain, the market tendering fixes which system provides or reduces the energy to or from the grid 15 min prior to its incorporation, leaving little time for gas turbines to react. Each candidate offers a basic range of energy and a capability of 58% to increase and 42% to decrease it during 1 h periods, and the operator adapts the set points to the proposed bid.
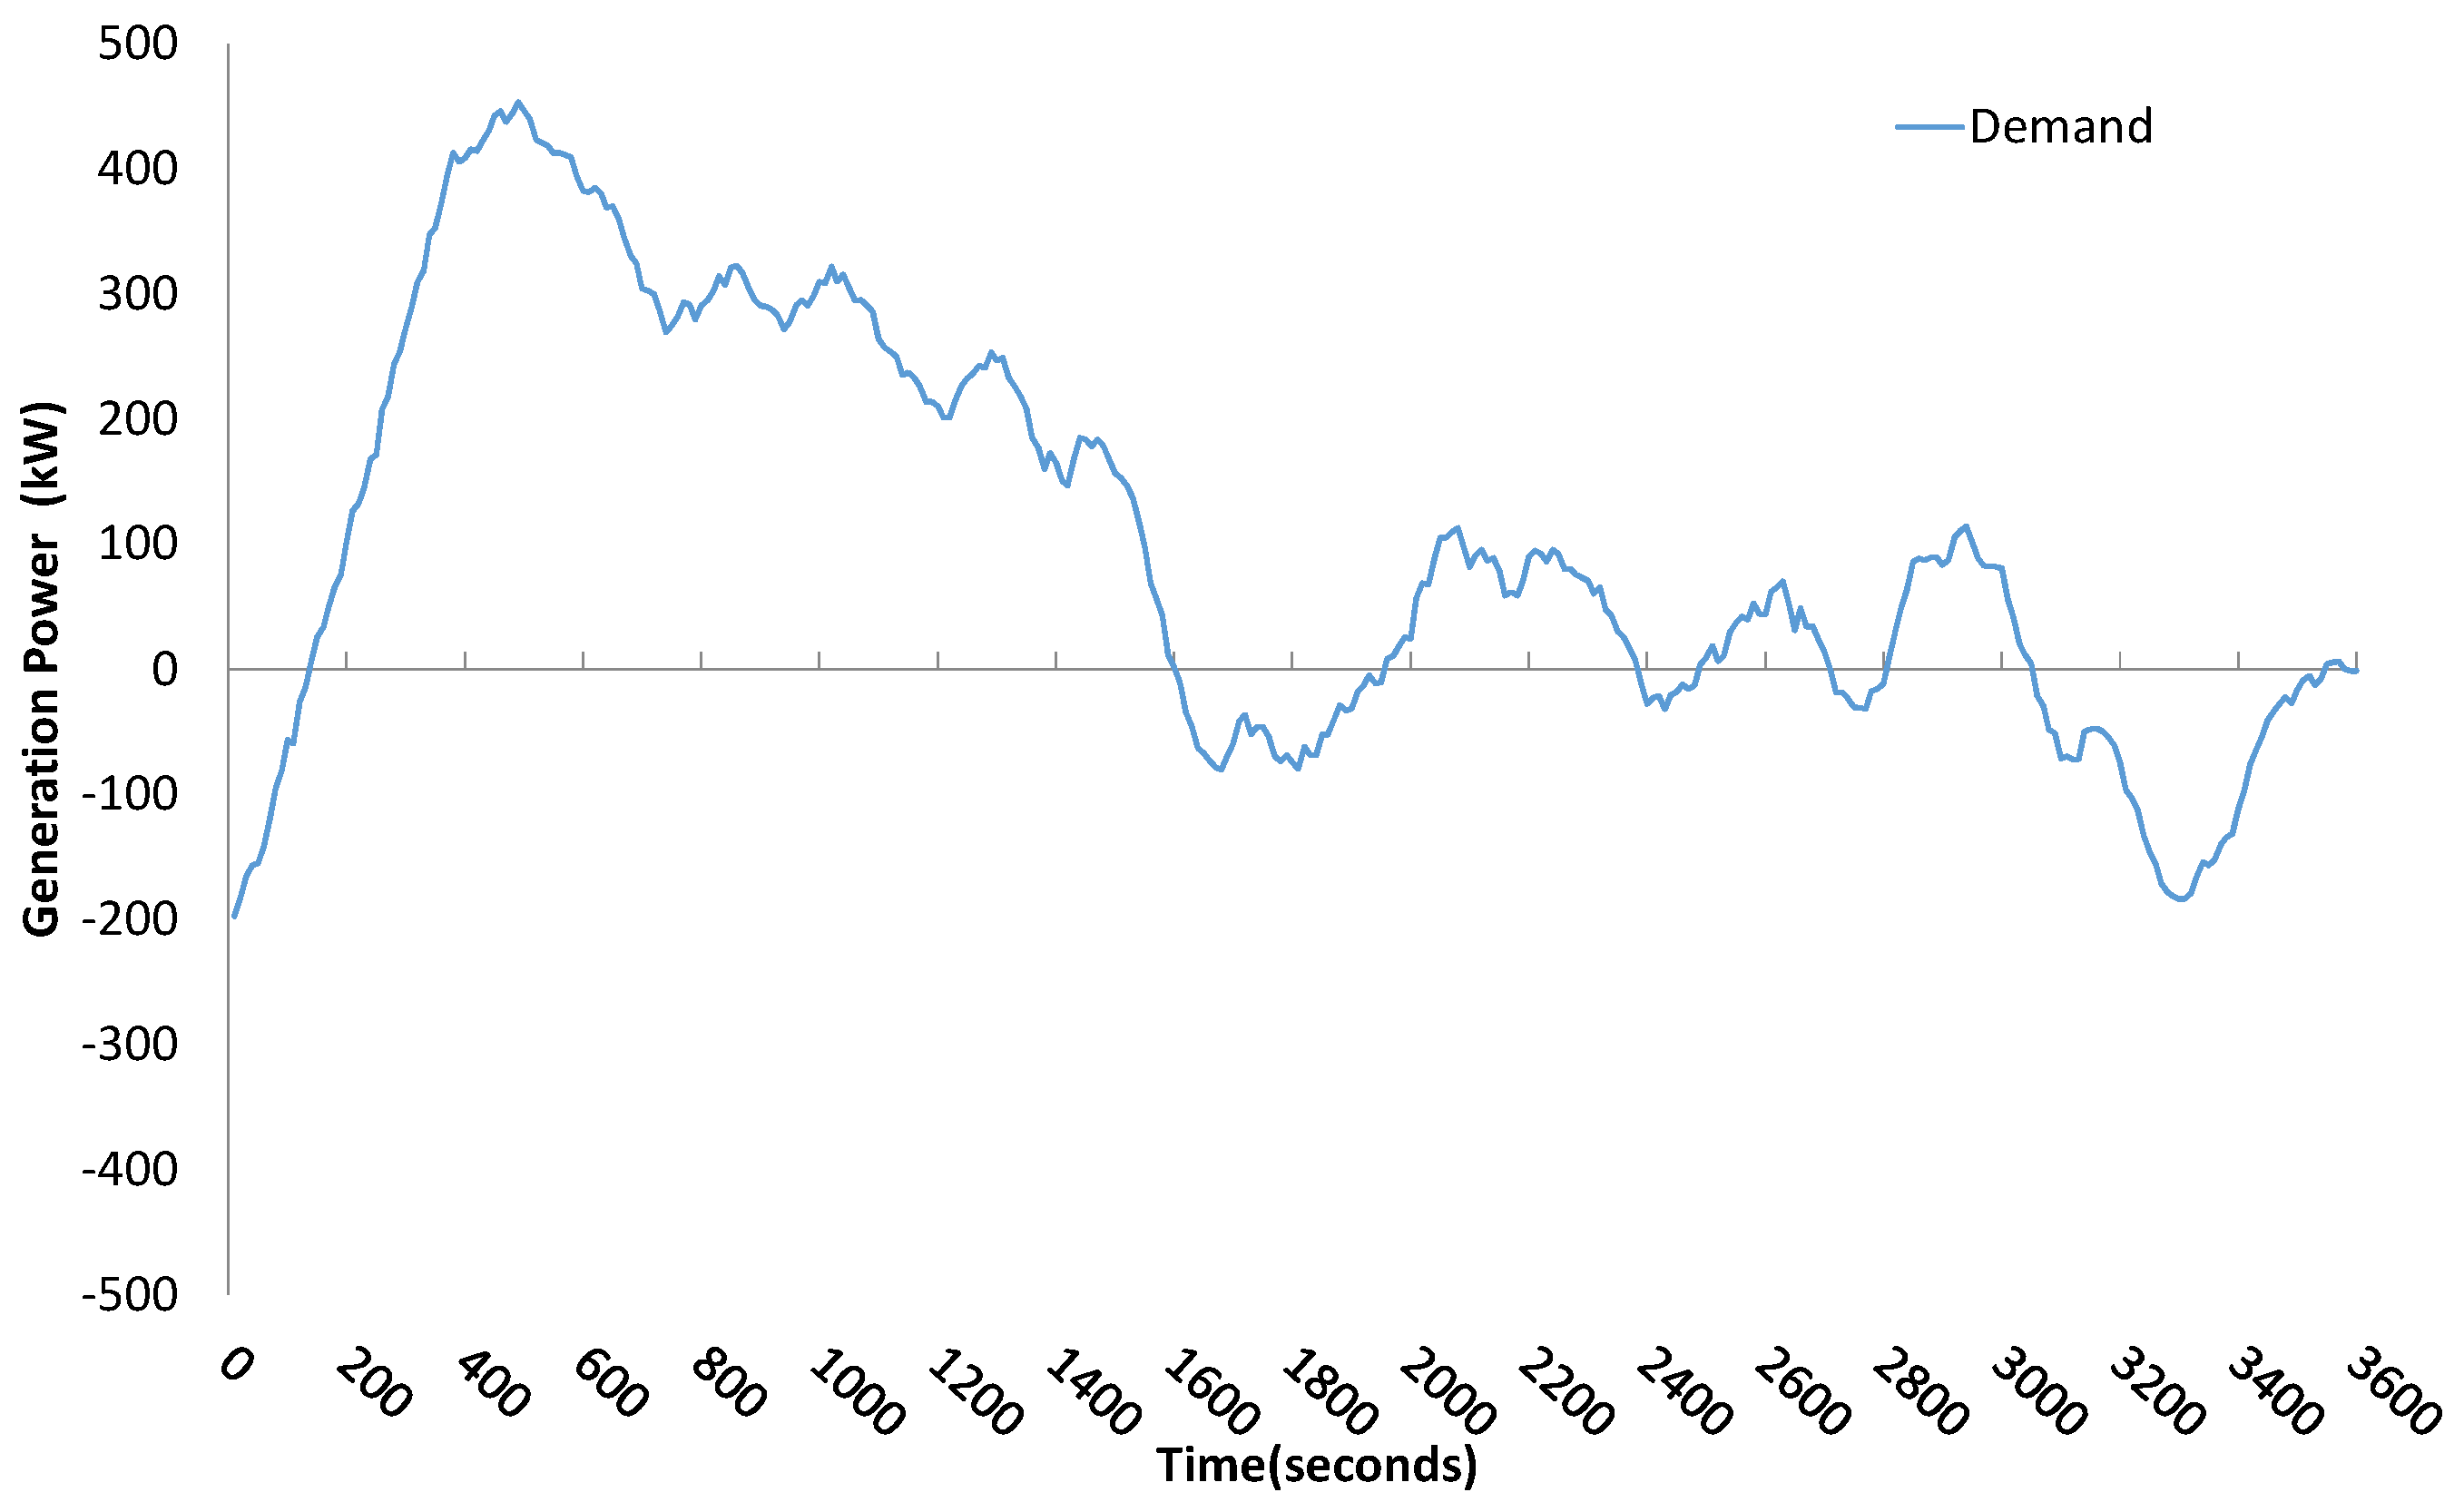
This study bases its calculations on real demand area regulation data from the Spanish operator “Red Eléctrica” given to a gas turbine power plant. This power plant has several 50 kW gas turbines able to provide 0.5 MW up/down.
Figure 8 presents the set points that the plant should follow during 1 h. Notice that these set points actualize every 4 s, forcing the system to rapidly adapt to it.
Trying to upgrade this facility to a more competitive one, this study presents the possibility to improve the plant’s time response and functionality by adding a second-life EV battery pack. This study presents two preliminary scenarios:
Scenario 1: This scenario tries to minimize complications caused by fluctuations from the transitory states between set points [
27]. This softening is achieved by transferring a recalculated working set point to turbines, based on the average power demand from the previous minute. In consequence, the response of turbines is softer and displaced 1 min while batteries provide or consume the lack or excess of energy.
Figure 1 in the Results section presents the resulting load curves for turbines and battery.
Scenario 2: Turbines work at constant speed or under constant acceleration/deceleration rates fixed at 2/3 of the maximum capacity of the system, eliminating transitory inefficiencies and improving the turbine’s lifespan by never working close to maximum acceleration rates. Similar to scenario 1, batteries provide or accumulate the necessary energy to adapt the turbine’s electricity generation to the set point required by the grid operator. The maximum sustained power that the battery pack offers and accepts is 60 kW. This value marks the maximum difference between the operator’s set point and the working conditions of turbines. Thus, when the difference exceeds this limit, turbines will accelerate, stabilize, or reduce its velocity according to the previous working state. That is, if turbines were working at constant speed and the battery needs to provide more than 60 kW, turbines will increase their power rate. On the other hand, if battery charge exceeds this limit, turbines will start to decrease their speed.
Figure 2 in the Results section clarifies these explanations.
However, there are many aspects to take into account when repurposing an EV battery pack for second-life applications. In this study, we follow the direct reuse strategy, which means that the system uses the same battery pack of the vehicle, including the BMS. This strategy implies that there is no need to build a new BMS controlling different types or aged cells, as happens when following other strategies [
28]. Moreover, as the use of one EV battery pack is enough to provide the power that the system demands, there is no need to develop an energy management system that balances power and capacity among multiple battery packs as reported by other studies [
29,
30]. Unfortunately, the direct reuse strategy needs to incorporate a gateway to communicate with the power system [
31]. In addition, contrary to the example of a second-life battery pack developed for a smart grid-tied photovoltaic system that used a 48 V reassembled battery [
32], the relatively high voltage of the reused EV battery pack of our study (which may reach up to 370 V), and the power peak loads that raise above 50 kW, force the development of specifically designed converters not available in the market at reasonable prices.
Concerning the delays in the system response, there are several aspects that ensure the correct or even better working operation of the system, even if the upgrade includes more elements in the communication’s chain (see
Figure 6 in
Section 3 for more control details). As mentioned above, the grid regulator provides new set points every 4 s. After the reception of the set point, the system calculates the power needed from the battery and turbines. Then, it sends the request to the converter and to the gas injectors. The converter activates the battery by increasing or decreasing the voltage and the battery responds much faster than the inertia from turbines to apply the power increase due to gas burn. Therefore, the introduction of battery storage systems does not increase the response delay, but instead provides a time buffer to correct the signal if any deviation is observed.
4.1. Second-Life EV Battery Aging Model
The second part of this study analyzes the second-life EV battery aging evolution under both scenarios. To do so, this study takes advantage of a previous work, which is a more accurate evolution from the model used in [
33]. This aging model is based on an equivalent electric circuit that simulates the battery’s behavior to calculate aging at every instant [
21]. Typically, battery equivalent circuit models incorporate an ideal source that provides the open-circuit voltage (OCV in
Figure 9) against SoC and a resistance in series with resistance and capacitator pairs (RC) in parallel. The resistance provides the instant voltage drop due to current load changes, while the first RC pair corresponds to fast voltage transitions. The use of simple models with a resistance and a single RC pair, such as the ones developed by Liaw et al. [
34] or Cho et al. [
35], is often chosen when fast calculations are needed. However, the addition of RC pairs, impedances, and Warburg impedances provide more accurate results [
36,
37].
Figure 9 shows the schema of the equivalent electric circuit model used in this study, which counts on a resistance (R) connected to four resistance and capacitator (RC) pairs. This model runs on Matlab
® using Simulink
® tools (MathWorks, Natick, NA, USA). The R and RC parameters were extracted from electrochemical impedance spectroscopy tests done at several temperatures between 0 and 55 °C. This aging model is based on nickel manganese cobalt (NMC)-chemistry prismatic cells. The capacity of the cells when fresh or new is 25 Ah, and they are used in commercial EV batteries. The whole battery pack uses 262 cells packed in modules forming two strings in parallel with a nominal voltage of 323 V. To calculate the current going through a single cell, the battery power demand presented previously in
Section 3 for each study case was divided by the OCV at each SoC, considering the whole battery. The resulting value was then divided by 2, which corresponds to the number of parallel strings of modules in series. This approximation considers that all cells are identical and age similarly.
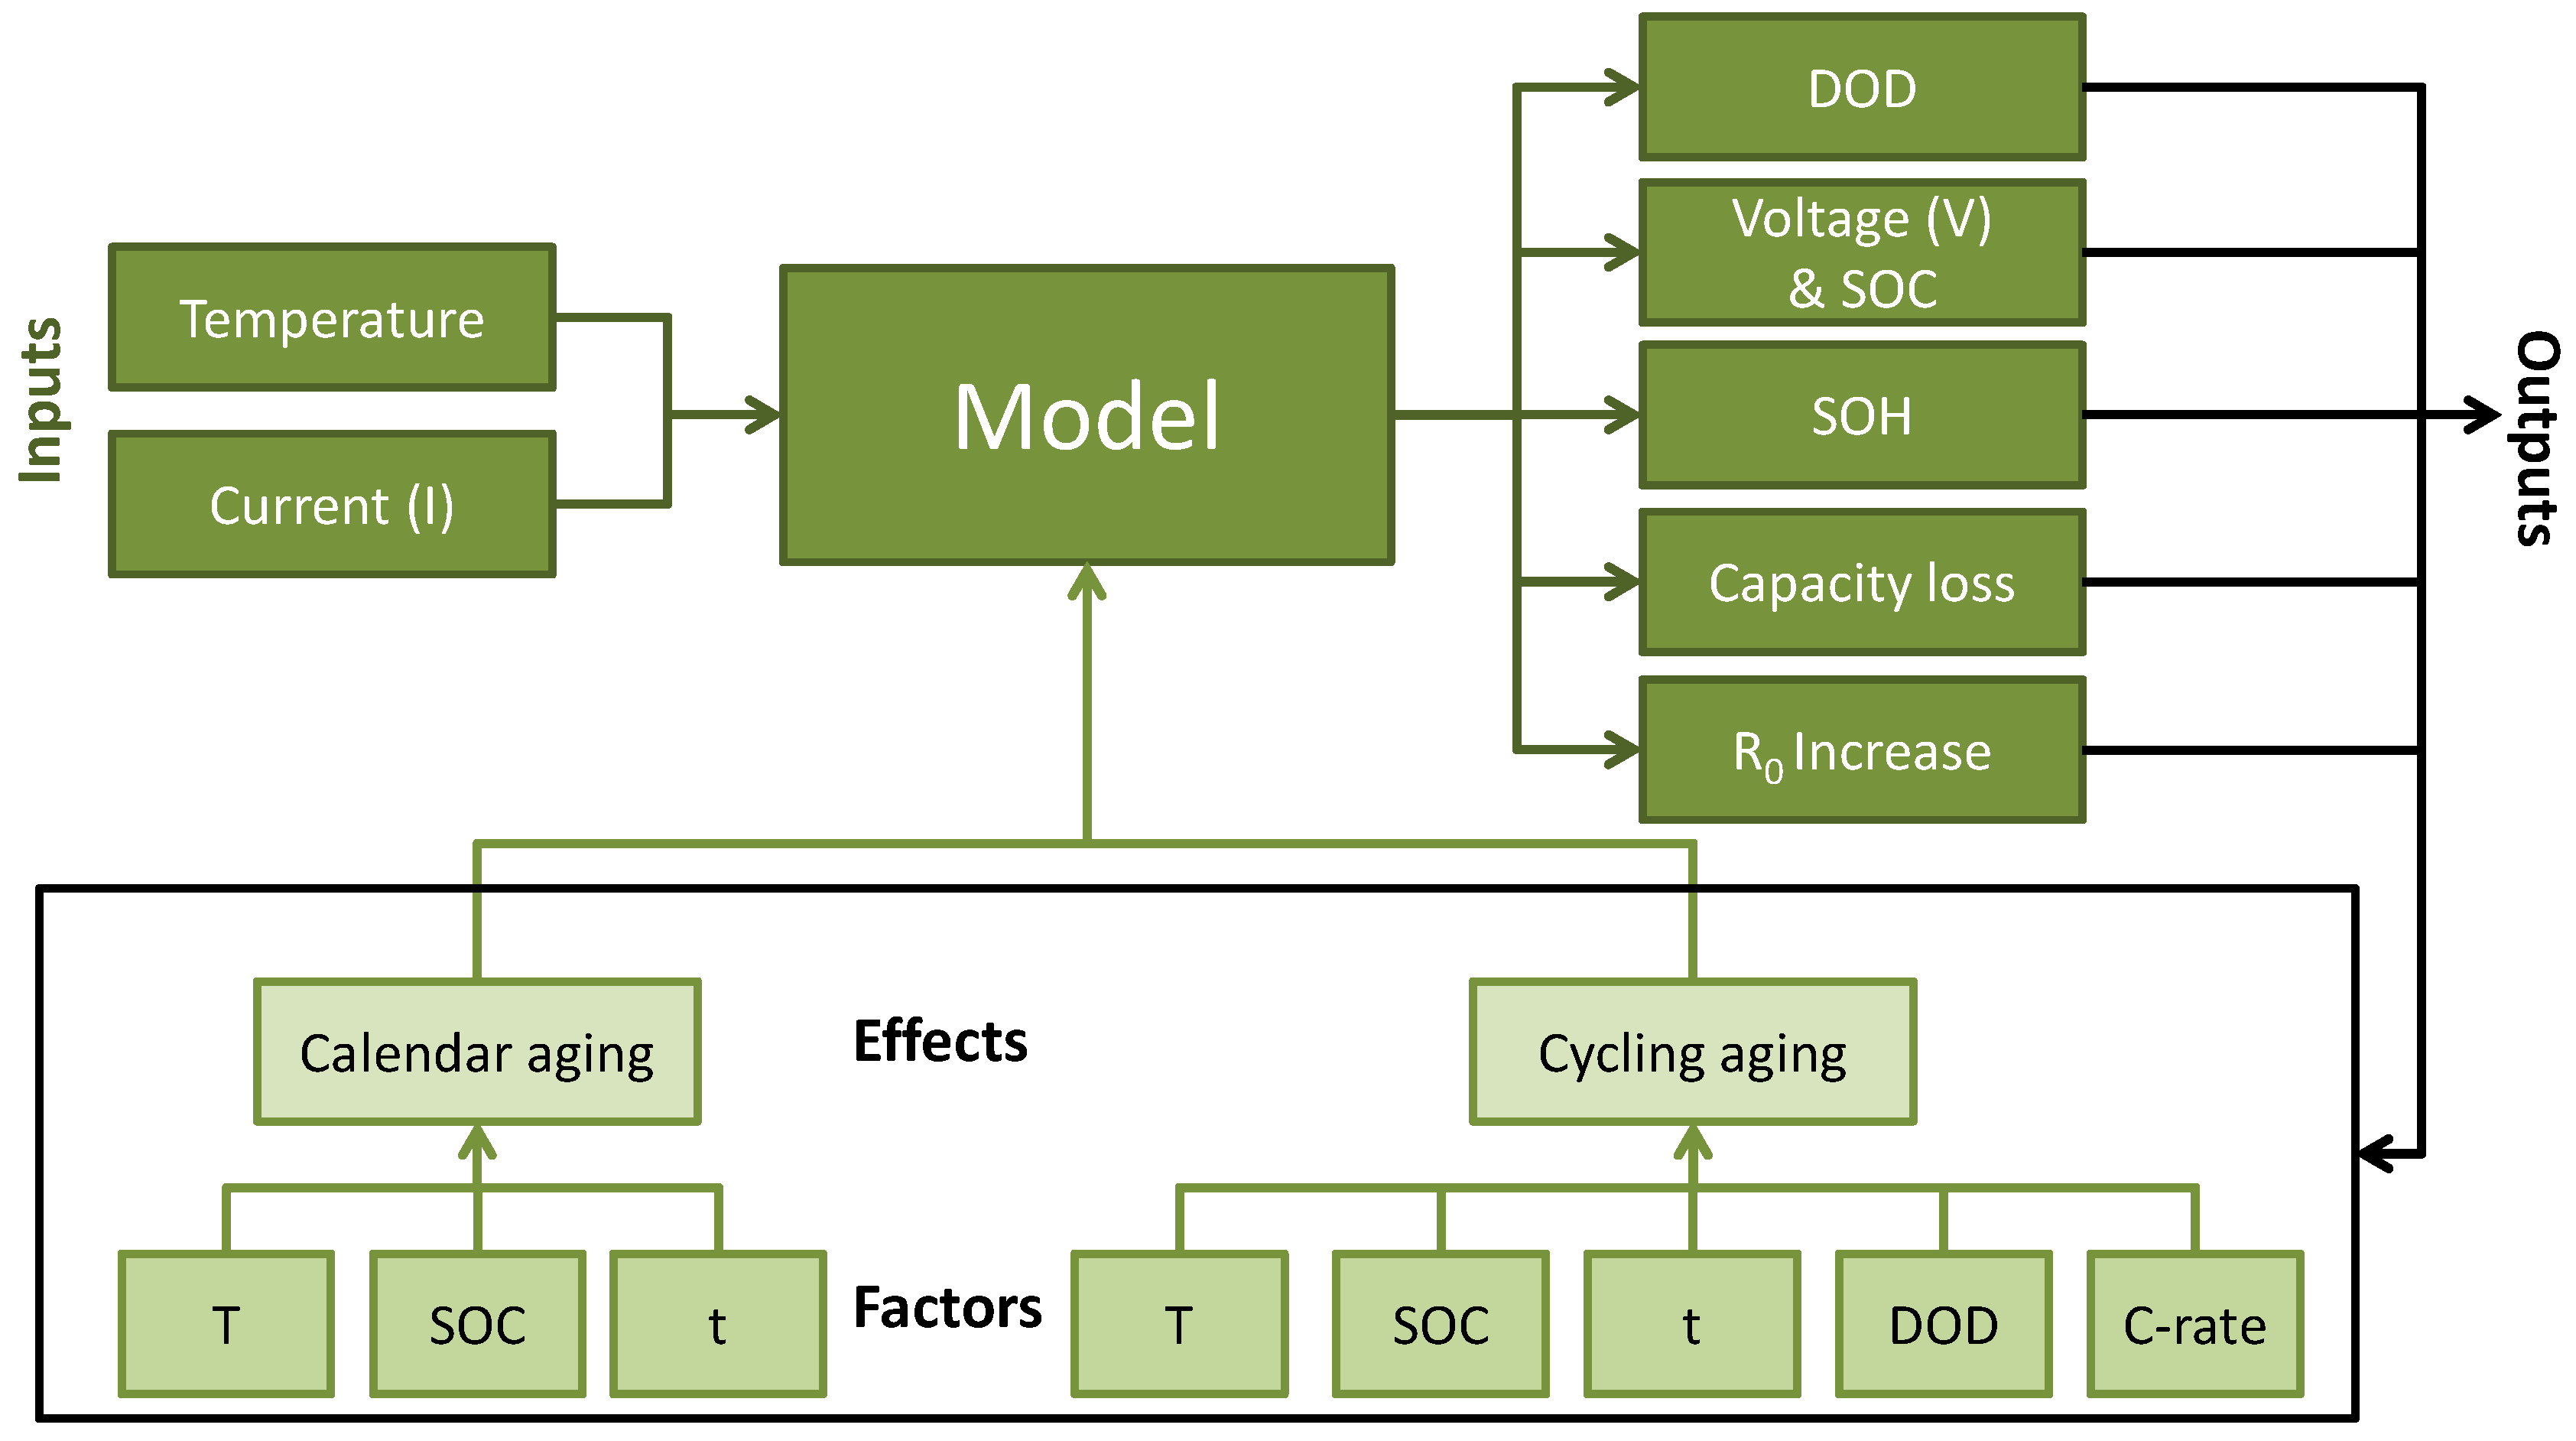
As presented in
Figure 10, this aging model uses current and temperature as inputs to simulate the behavior of the battery along time. With the variation of current demand from and to the battery, SoC changes (
Figure 4) and
DoD is extracted by rain-flow counting, obtaining all the parameters needed to estimate the capacity loss of the battery. The model takes into account calendar and cycling aging of batteries and most of the known factors affecting batteries’ degradation. These factors are: temperature (
T), depth of discharge (
DoD), state of charge (SoC), and current or intensity (C-rate) [
38,
39,
40], which are incorporated in the aging model following Equations (1) and (2).
Calendar aging follows an Arrhenius-like curve related to voltage and temperature, which is defined by Equation (3).
This model uses voltage to represent the aging effect of SoC, presented in Equations (1) and (2) and supported by literature [
41,
42]. In particular, its impact on cycling follows Equation (4):
Regarding the cycling conditions,
DoD and C-rate affect battery aging following a logarithmic and second-degree polynomial expression, respectively [
43,
44], represented by Equations (5) and (6),
Finally, the effect of temperature while cycling is related to the base-case degradation, according to Equation (7).
In fact, Equations (3)–(7) represent the effect of these factors (
V, C-rate,
DoD, and
T) against its base degradation, which is the capacity loss that occurs when cycling at 25 °C, 1C, 100%
DoD, and 50% average SoC. Moreover, parameters β
1, β
2, β
3, θ
1, θ
2, θ
3, θ
4, θ
5, and θ
6, whose values are shown in
Table 1, are representative of one battery type.
Then, SoH evolution, presented in
Figure 3 and
Figure 5, is calculated by dividing the capacity of the battery at any instant by the initial capacity when fresh or new.
To ensure that no overvoltage occurs during the simulation, the model incorporates a condition that stops it when the battery voltage exceeds the working limits.
The last aspect to consider regarding the RUL estimation is that it is necessary to know the departing SoH of batteries. There are plenty of methods to estimate SoH of batteries, ranging from internal resistance and capacity measurements to fully automated onboard supervision of various battery parameters [
45]. In this study, we expect to obtain SoH directly from the EV, as most EV models incorporate algorithms to estimate it. This study considers that second-life batteries will have an 80% SoH, although there are some critical voices to this limit, as many drivers may continue using EVs well beyond it [
46].
4.2. Study Limitations
This study presents a first battery lifespan estimation approach on area regulation considering all known aging factors. However, it has several limitations to notice.
First, it takes only a 1 h cycle to simulate the whole working conditions of the system along time. This is unlikely to happen, as area regulation changes constantly and the demand curve will never be the same. Nonetheless, it seemed a good assumption for an initial estimation. Future works will have to deal with this variability, where more than one battery will be certainly needed. Moreover, in this study, the system is assumed to be working 24 h a day, which is also difficult to occur, as it would mean that the system is always winning the auctions.
The turbine’s upgrade scenarios may be improved by incorporating predictive tools and other factors that are closer to the problem in the reality of a turbine’s regulation. However, it seemed inappropriate to use any, having only one representative curve, as they should be validated for several real cases. Therefore, we assumed that, in the scenarios presented, there was already an interest in batteries giving support to turbines on area regulation.
Finally, the aging model does not consider the “aging knee”, a moment in which the aging mechanisms change and battery degradation may substantially accelerate [
47].
5. Conclusions
This study presents the expected lifespan of second-life, directly reused, EV batteries giving power and energy support to gas turbine systems providing area and frequency regulation services under two working scenarios.
Batteries are responsible for absorbing the sudden changes from the electricity grid operator while smoothening the working conditions of gas turbines.
Results show that batteries age differently depending on the aggressiveness of the energy load. In fact, in the first scenario, which has lower battery requirements, the second-life EV battery works correctly for 1880 equivalent full cycles. On the other hand, more demanding load requirements, such as the one presented in the second scenario, lowers the battery lifespan down to 1241 equivalent full cycles, with the battery degradation accelerated by 21%.
This paper also presents the relation between equivalent full cycles of the battery and working cycles, which shows that, for the analyzed scenarios, battery lifespan of the working cycles corresponds to 2000 and 800 cycles, respectively.
Finally, this study shows that, effectively, batteries may give support to area and frequency regulation services to gas turbines by improving the energy and electricity quality of the system.


