Article

A Ni/MH Pouch Cell with High-Capacity Ni(OH)2

1
BASF/Battery Materials—Ovonic, 2983 Waterview Drive, Rochester Hills, MI 48309, USA
2
Department of Chemical Engineering and Materials Science, Wayne State University, Detroit, MI 48202, USA
*
Author to whom correspondence should be addressed.
Batteries 2017, 3(4), 38; https://doi.org/10.3390/batteries3040038
Submission received: 26 September 2017 / Revised: 16 November 2017 / Accepted: 21 November 2017 / Published: 4 December 2017
(This article belongs to the Special Issue Nickel Metal Hydride Batteries 2017)

Abstract

:
Electrochemical performances of a high-capacity and long life β-α core-shell structured Ni0.84Co0.12Al0.04(OH)2 as the positive electrode active material were tested in a pouch design and compared to those of a standard β-Ni0.91Co0.045Zn0.045(OH)2. The core-shell materials were fabricated with a continuous co-precipitation process, which created an Al-poor core and an Al-rich shell during the nucleation and particle growth stages, respectively. The Al-rich shell became α-Ni(OH)2 after electrical activation and remained intact through the cycling. Pouch cells with the high-capacity β-α core-shell positive electrode material show higher charge acceptances and discharge capacities at 0.1C, 0.2C, 0.5C, and 1C, improved self-discharge performances, and reduced internal and surface charge-transfer resistances, at both room temperature and −10 °C when compared to those with the standard positive electrode material. While the high capacity of the core-shell material can be attributed to the α phase with a multi-electron transfer capability, the improvement in high-rate capability (lower resistance) is caused by the unique surface morphology and abundant interface sites at the β-α grain boundaries. Gravimetric energy densities of pouch cells made with the high-capacity and standard positive materials are 127 and 110 Wh·kg−1, respectively. A further improvement in capacity is expected via the continued optimization of pouch design and the use of high-capacity metal hydride alloy.

Graphical Abstract

1. Introduction

Transportation electrification is essential for controlling the greenhouse effect by reducing CO2 emissions from burning fossil energy. Li-ion battery technology is the mainstream energy/power source for electric vehicle (EV) applications because of its relatively high gravimetric energy density. In a comparison of commercially available Li-ion batteries (first nine rows in Table 1), cylindrical cells with the size of 18650 made by Panasonic (Tokyo, Japan) show the highest volumetric and gravimetric energy densities at the cell level. However, their gravimetric energy density drops from 233 to 140 Wh·kg−1 in the transition from a single cell to a complete battery pack [1]. Other vendors offer either pouch- (aluminum laminated with plastics) or prismatic- (metal case) types of Li-ion batteries that increase the package density because no space is needed between adjacent cells. In comparison, pouch cells have both higher volumetric and gravimetric energy densities than prismatic cells.
There are five types of commonly used nickel/metal hydride (Ni/MH) batteries (Figure 1). Their capacities, constructions, and pros and cons are compared in Table 2. Coin cells are used in personal computer memory backup and real-time clock applications. The cylindrical design is the most popular type for various portable consumer electronics. In the past, a stick design was put in personal digital assistants and cellphones. Hybrid electric vehicles (HEV), manufactured by Toyota Motor (Tokyo, Japan), use the HEV-type prismatic Ni/MH cells because of their excellent high-rate discharge capability. Stainless steel-cased prismatic Ni/MH batteries were used to power the first commercially available EVs (EV-1 by General Motor, Inc., Detroit, MI, USA) back in 1999 [2], but they were later replaced by Li-ion batteries by all of the EV makers because of the limitation in gravimetric energy density. In 2015, a program that was funded by the United States Department of Energy, ARPA-E RANGE, investigated the possibility of using a pouch design for Ni/MH batteries [3]. Inspired by the success of pouch design for Li-ion batteries, researchers designed Ni/MH pouch cells (Figure 23 in [4]) to achieve the following advantages: higher gravimetric and volumetric energies, a higher packaging density, a lower fabrication cost, an increase in safety in case of battery puncture (with electrodes in a flooded mode), and an increase in pack design flexibility (where bending is possible) [3] over the conventional hard-cased Ni/MH cells. At the end of the program, a 100-Ah pouch design with the advanced positive and negative active materials was proposed with an expected energy density of 145 Wh·kg−1 discharged at C/3 [4].
Ni/MH pouch cells in the ARPA-E RANGE program achieved three major accomplishments: the discovery of high-capacity Si-anode with ionic liquid electrolyte [5], use of ionic liquid as electrolyte [6], and a high-capacity β-α core-shell Ni(OH)2 positive electrode [7]. This paper elaborates on the continuing efforts to validate the third item—high-capacity positive electrode material in the pouch design tested with various regimens.

2. Experimental Setup

Negative electrode active material is a commercially available misch metal-based metal hydride (MH) alloy (AB5) with a nominal composition of La10.5Ce4.3Pr0.5Nd1.4Ni60Co12.7Mn5.9Al4.7 and a plateau pressure of about 0.06 MPa [8]; it was supplied by Eutectix (Troy, MI, USA). Positive electrode active materials (AP50 and WM12) were fabricated by a continuous stirred-tank reactor process [7,9,10] in BASF—Ovonic (Rochester Hills, MI, USA). Electrochemical charge/discharge tests were performed on an Arbin BT-2143 battery test station (Arbin, College Station, TX, USA). AC impedance measurements were performed on a Solartron S1287 potentiostat/galvanostat, with an S1255 frequency response analyzer (Solatron, Farnborough, Hampshire, UK).

2.1. Cell Assembely

Around 1.2 g mixture of positive electrode active material (hydroxide of nickel and other transition metals, 90 wt %) and polytetrafluorethylene-acetylene black composite (10 wt %) was spread evenly and compacted onto a 1″ × 1″ nickel foam substrate by applying a pressure of 250 MPa with a hydraulic press to form the positive electrode. The negative electrode was fabricated by a continuous dry compaction process, which directly pressed the AB5 MH alloy powder onto an expanded nickel substrate. A negative-to-positive (N/P) capacity ratio of 1.4 was adopted to prevent sudden gassing in the pouch cell. Future development using a MH alloy with a lower plateau pressure and a flatter pressure-concentration-temperature isotherm can reduce this N/P ratio. Individual Ni tab strips were welded onto both the negative and positive electrodes. A piece of grafted polypropylene/polyethylene was used as a separator. 30 wt % aqueous KOH solution was used as electrolyte. EQ-alf-400-7.5M (MTI Corporation, Richmond, CA, USA), an aluminum foil that was laminated with polyamide (inside) and polypropylene (outside), was used for the construction of the pouch cell. The laminated aluminum foil was cut into 4″ × 2.2″ pieces, and each piece was heat sealed at 200 °C and 0.3 MPa for 1.5 s with a MTI MSK-140 heating sealer without vacuum to form a 2″ × 2.2″ pouch for cell housing.

2.2. Activation Process

After completing the pouch assembly, each cell was set aside for 3 h. Next, each cell was charged at 0.1C (calculated based on the positive electrode active material weight) at room temperature (RT) for 10 h and relaxed for 10 min before being discharged at 0.1C to 0.9 V. This process was repeated until a stablized discharge capacity was obtained.

2.3. Charge Rate Capability

After activation, each cell was set aside for 3 h at RT. Next, each cell was charged at 0.1C to 90% state-of-charge (SOC) to a cutoff voltage of 1.6 V, relaxed for 10 min, before being discharged at 0.1C to 0.9 V, and finally relaxed for 10 min. This charge/discharge process was repeated, but with charge rates of 0.2C, 0.5C, and 1C in the next three cycles.
After completing the RT charge rate capability test, each cell was charged/discharged at 0.1C for five cycles to reactivate. Each cell was then placed in a temperature-controlled chamber at −10 °C for 3 h. Next, −10 °C charge rate capability test was conducted in the same manner as the experiment at RT described above.

2.4. Discharge Rate Capability

Test procedure for discharge rate capaibility is similar to that for charge rate capability, but with the charge rate fixed at 0.1C and discharge rates of 0.1C, 0.2C, 0.5C, and 1C.

2.5. Self-Discharge

Each cell was charged at 0.1C to 60% or 80% of SOC after activation and then relaxed for 3 h. More relaxation time may be required to ensure that stablized open-circuit potential was obtained. Open-circuit potential was again obtained every seven days. Self-discharge measurements were performed at both RT and −10 °C.

2.6. Internal Resistance Measurement

After activation, each cell was charged at 0.1C to 60% SOC and relaxed for 1 h at RT. Next, each cell was discharged at 0.1C for 15 s, relaxed for 10 min, before being charged at 0.1C for 15 s, and finally relaxed for 10 min. This pulse discharge/charge process continued on, but with discharge/charge rates of 0.2C, 0.5C, and 1C. Internal resistance (Rint) at RT was calculated based on the equation,
Rint = ΔVI
where V and I are the voltage at the end of each charge or discharge pulse and corresponding rate, respectively.
After completing the RT Rint measurement, each cell was charged/discharged at 0.1C for two cycles to reactivate. Each cell was then placed in a temperature-controlled chamber at −10 °C for 3 h, charged at 0.1C to 60% SOC, and relaxed for 1 h. Next, −10 °C Rint measurement was conducted in the same manner as the experiment at RT described above. Equation 1 was also used to calculate Rint at −10 °C.

2.7. Charge-Transfer Resistance Measurement

Each cell was charged at 0.1C to 60% SOC and relaxed for 30 min. Next, AC impedance measurements were performed with an amplitude of 10 mV and a frequency range of 0.005 to 10 KHz at RT and 0.002 to 100 KHz at −10 °C. Charge-transfer resistances (Rct) at RT and −10 °C of each cell were obtained from the resulted Cole-Cole plots.

3. Results and Discussion

3.1. Ni(OH)2 Selection

Two types of positive electrode materials are compared in this study—AP50 and WM12. The important parameters of these two materials are compared in Table 3. AP50 with a nominal cation composition of Ni91Co4.5Zn4.5, a standard positive electrode material for commercial Ni/MH batteries, was chosen as control. During charge, AP50 goes through a transformation from β-Ni(OH)2 to β-NiOOH (and vice versa during discharge). WM12 is a newly developed high-capacity Ni(OH)2-based positive electrode material [4]. In WM12, zinc—the γ-phase inhibitor in AP50—is replaced by aluminum, the γ-phase promoter, which results in a nominal cation composition of Ni84Co12Al4. After activation, WM12 has a structure consisted of a β-rich core and a α-rich shell that was confirmed by both scanning and transmission electron microscopes [7]. Although being similar in shape (both spherical), WM12 has a highly-decorated surface while AP50’s surface is relatively smooth (Figure 2). WM12’s high surface area may contribute positively in the electrochemical environment. Half-cell capacity measurement results for WM12 and AP50 (using a counter electrode made with the standard AB5 MH alloy) are shown in Figure 3. After activation, WM12 demonstrates a 40% increase in discharge capacity over AP50 (350 vs. 250 mAh·g−1) at 30 mA·g−1. The extra capacity of WM12 comes from the α-shell, which is capable of an electron transfer of up to 1.67 electrons per Ni atom during the redox reaction [11,12]. Other than the usual transformation from β-Ni(OH)2 to β-NiOOH during charge (and vice versa during discharge), the evolution in half-cell voltage profile of WM12 shows that once the activation (Figure 4a–c, where only a single voltage plateau is observed during charge or discharge) is complete, a transformation of α-Ni(OH)2 to γ-NiOOH during charge (and vice versa during discharge) appears (Figure 4d,e, where two voltage plateaus are observed during charge or discharge). Although WM12 delivers a higher gravimetric energy density, its lower tap density (0.9 g·cc−1) [7] when compared to that of AP50 (2.3 g·cc−1) decreases the volumetric energy density of the battery. Details about the microstructures of WM12 at different states and after cycling were reported previously [7]. In this study, pouch cells made with AP50 and WM12 are identified as Cell AP50 (control) and Cell WM12 (experimental).

3.2. Charge Rate Capability

Effects of varying the charge rate on pouch cell charge and discharge capacities are shown in Figure 5. Similar to earlier reports [9,10], a smaller charge rate results in a higher charge and discharge capacities, and a lower operation temperature yields lower charge and discharge capacities. Charge and discharge capacities that are obtained with different charge rates at both RT and −10 °C are listed in Table 4. Cell WM12 has higher charge and discharge capacities than Cell AP50 at both RT and −10 °C for all of the rates. Moreover, Cell WM12 shows superior high-rate charge capabilities, especially at a lower temperature, as demonstrated by the more-than-double charge/discharge capacities of Cell WM12 as compared to the corresponding charge/discharge capacities of Cell AP50 at 0.5C and 1C at −10 °C. RT energy densities obtained from Cell WM12 and Cell AP15 are 127 and 110 Wh·kg−1, respectively. As the negative electrode material used is the conventional AB5 MH alloy (320 mAh·g−1), and the pouch design has not been optimized, further increase in energy density can be accomplished by using the new Laves phase-related body-centered-cubic MH alloy (400 mAh·g−1) developed in the ARPA-E RANGE program [4] in an improved pouch design.

3.3. Discharge Rate Capability

The effects of varying the discharge rate on pouch cell discharge capacity are shown in Figure 6. Since the charge capacity curves are very similar (all of the measurements were charged at 0.1C), only the discharged curves are presented. Discharge capacities that are obtained at different rates are summarized in Table 5. Cell WM12 has much higher discharge capacities than Cell AP50 at both RT and −10 °C for all of the rates. In addition, Cell WM12 shows superior high-rate discharge capabilities, especially at a lower temperature. For instance, at −10 °C and 1C, discharge capacity of Cell WM12 is more than six times higher than that of Cell AP50. The abnormal lowering in cell voltage during the initial high-rate discharges (0.5C and 1C) at RT in Figure 6a is related to the sudden decrease in MH alloy volume and insufficient time for the electrolyte to flow in, causing an increase in cell impedance. At −10 °C, the cell impedance is large, and the depth-of-discharge is small, which overshadow the electrolyte refilling phenomena observed in Figure 6a.

3.4. Self-Discharge

Effects of SOC and temperature on self-discharge are shown in Figure 7a,b. A higher SOC leads to a higher open-circuit voltage for both Cell AP50 and Cell WM12. At −10 °C, both Cell AP50 and Cell WM12 have a better self-discharge performances than at RT. For the 32-day storage test, Cell WM12 shows higher voltages during storage and better self-discharge performances (higher voltages at the end of storage) than Cell AP50 at RT and −10 °C. Charge retentions that were measured at RT and 80% SOC for Cells AP50 and WM12 are plotted in Figure 7c, which also shows the superiority of WM12 over AP50 in self-discharge performance.

3.5. Internal Resistance

Rints of Cell AP50 and Cell WM12 are listed in Table 6. Rint of Cell WM12 is dramatically lower than that of Cell AP50. More specifically, a 47% decrease in Rint at RT and a 56% decrease in Rint at −10 °C are observed in Cell WM12. According to our previous works [7,13,14], the lower Rint of WM12 can be attributed to its higher surface area (Table 3), higher surface pore density (Table 3), large interface region between the α and β phases, and special core-shell structure.

3.6. Charge-Transfer Resistance

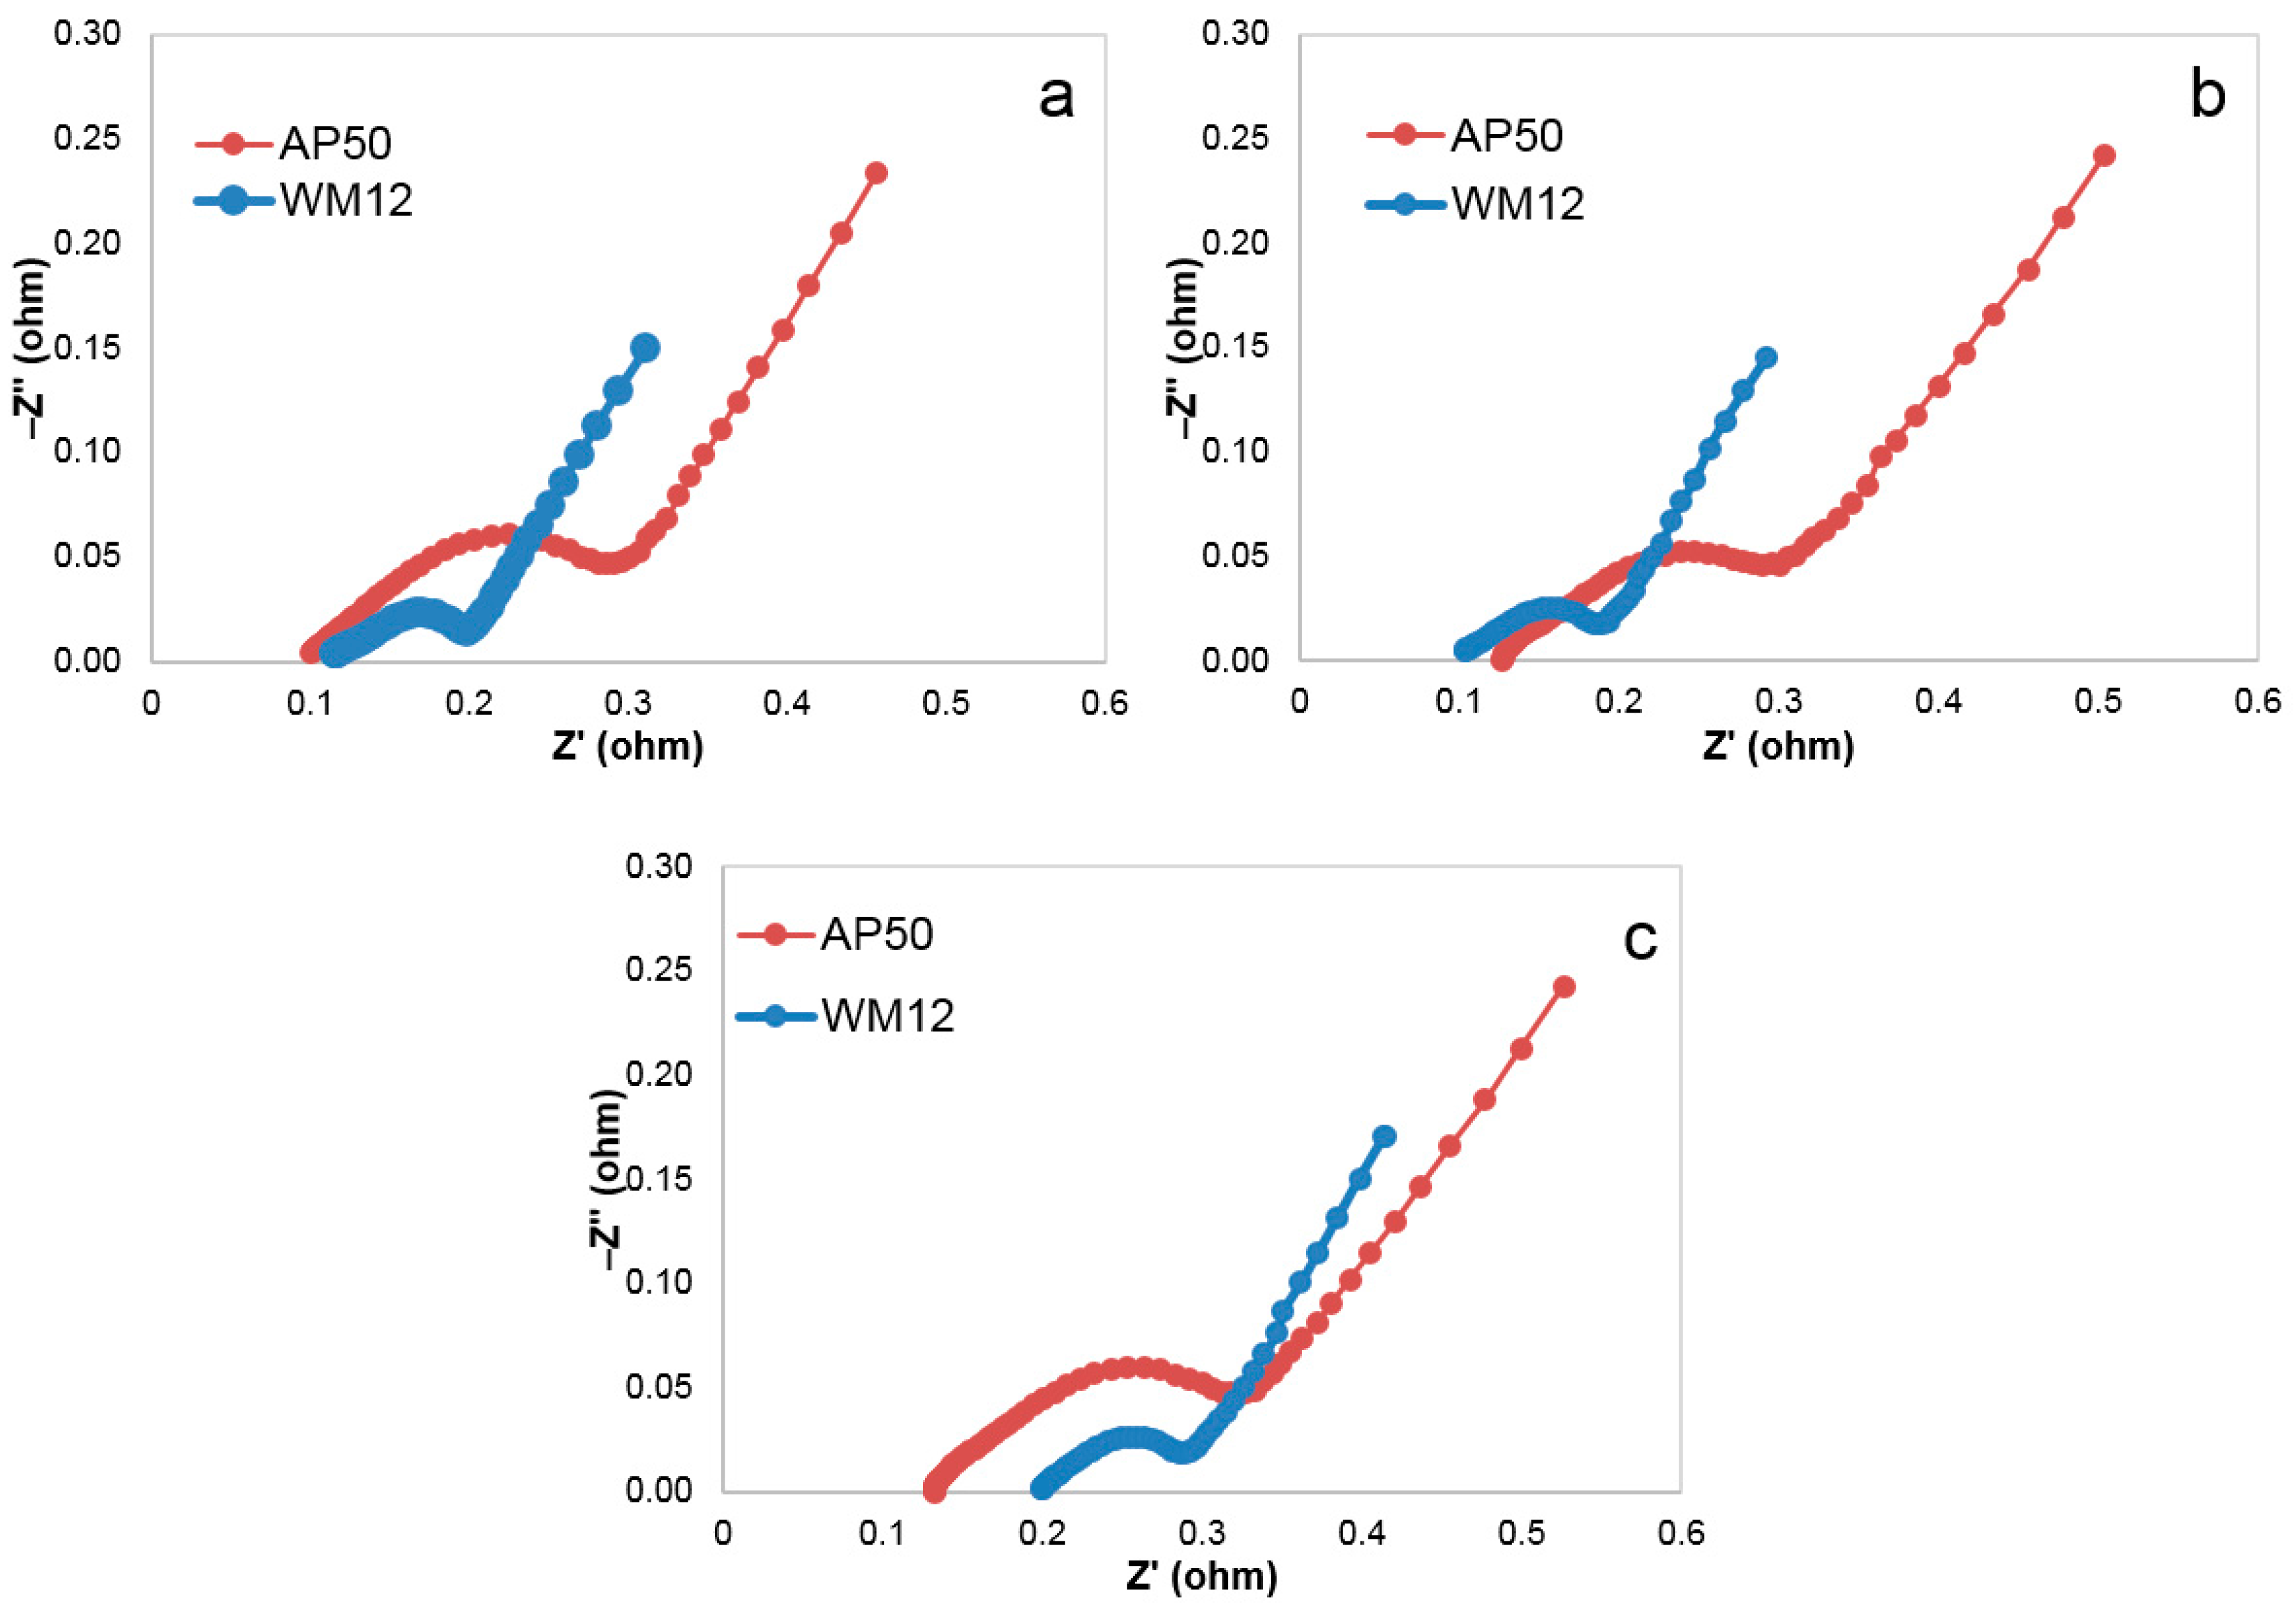
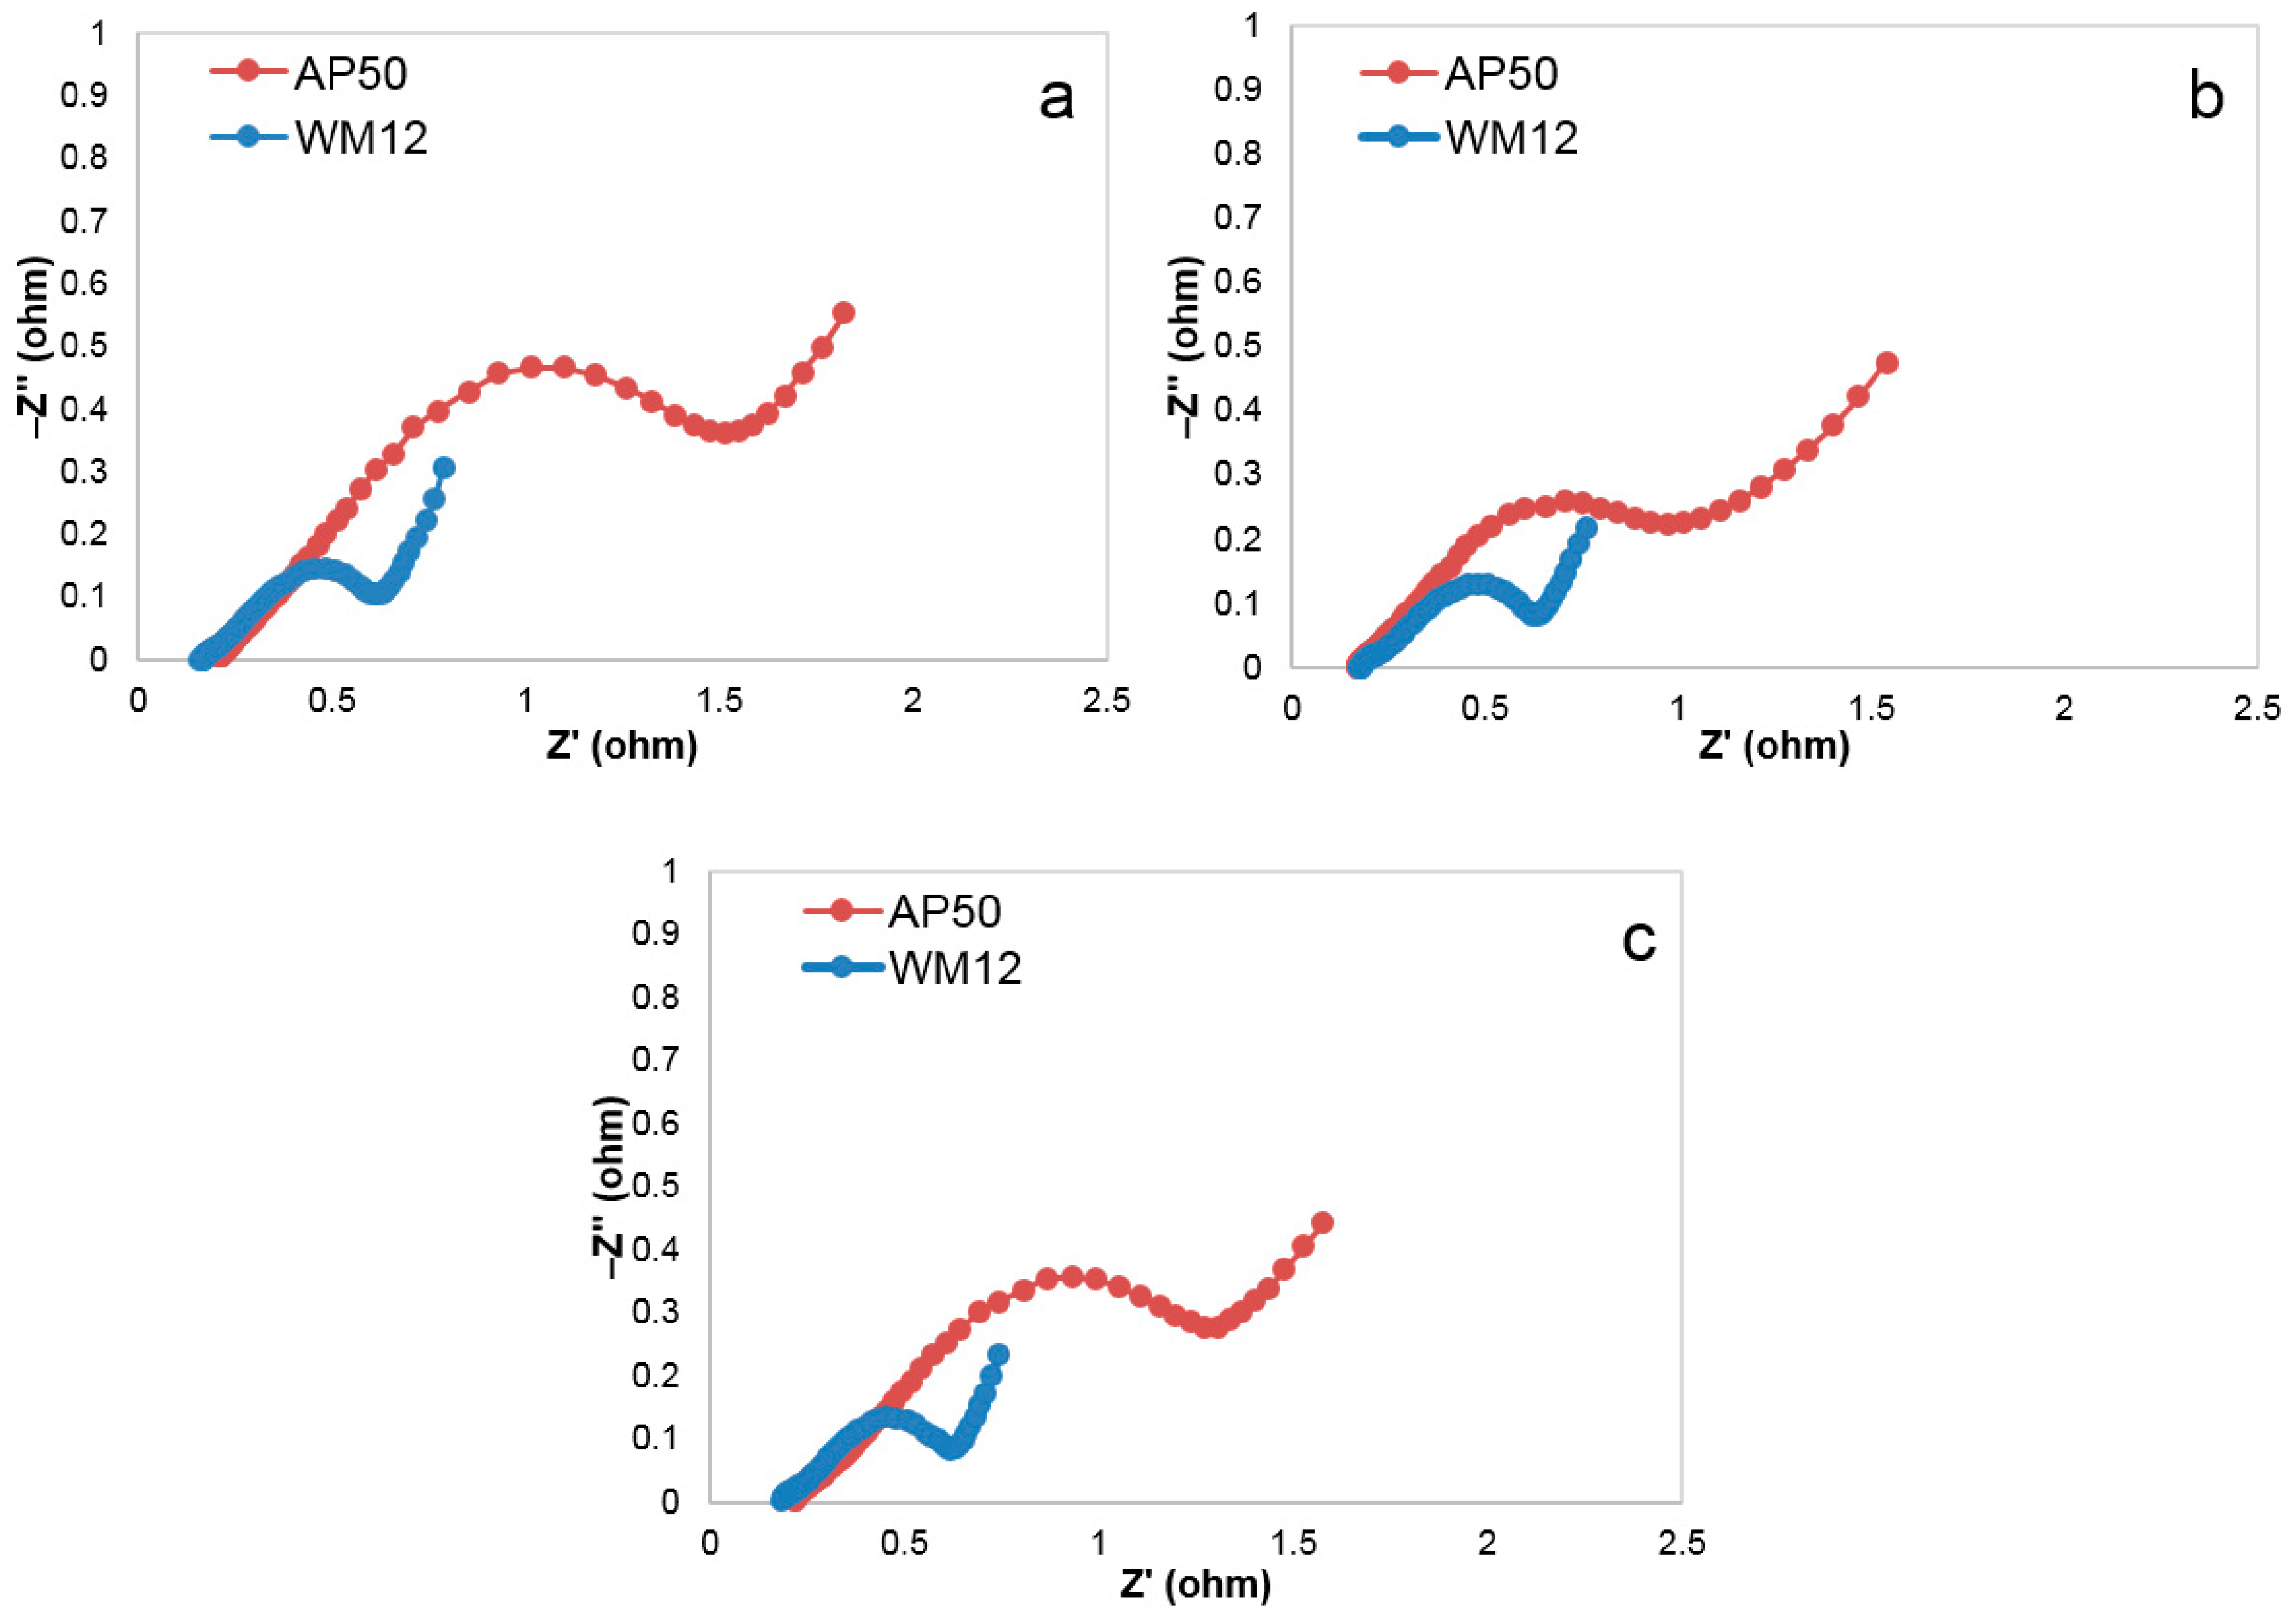
AC impedance measurement was employed to study the surface electrochemical reaction [15]. Figure 8 (RT) and Figure 9 (−10 °C) illustrate the resulting Cole-Cole plots for Cell AP50 and Cell WM12 at the 0th, 20th, and 50th cycles. A reported equivalent circuit model [16], as shown in Figure 10, was used for the simulation of Figure 8 and Figure 9. Table 7 lists the solution resistances (R0) and Rcts for Cell AP50 and Cell WM12 at different temperatures and cycle numbers. R0 is the resistance of ions traveling through the electrolyte and separator and the start value of Z’ in the Cole-Cole plot (x-axis intercept). Rct is closely related to the semicircle in the Cole-Cole plot. The linear part after the semicircle in the Cole-Cole plot is linked to the Warburg impedance, a parameter that is associated with the diffusion of hydrogen atoms into the electrodes. We will conduct more detailed research on Warburg impedance in our future work. From Table 7, Rcts of Cell WM12 are 0.10 Ω at RT and 0.52 Ω at −10 °C, which are only 31 to 48% of those observed in Cell AP50.

4. Summary

A systematic study on pouch cells made with a high-capacity β-α core-shell Ni(OH)2 (experimental) was performed, and the charge and discharge rate capabilities, self-discharge, and internal and charge-transfer resistances were obtained and compared with pouch cells that were made with a standard β-Ni(OH)2 as control. The experimental cells exhibit superior performances in all of the tests. When compared to the control cells, the experimental cells show a higher energy density (127 vs. 110 Wh·kg−1) and better charge/discharge rate capabilities, especially at a higher rate and lower temperature. For example, at 0.5 C and −10 °C, charge capacity is 3.51 times higher than the control; and at 1 C and −10 °C, discharge capacity is 6.45 times higher than the control. Furthermore, the experimental cells also demonstrate better self-discharge performances and reduced internal and charge-transfer resistances, measured at both room temperature and −10 °C.

Acknowledgments

The authors would like to thank the following individuals from BASF—Ovonic for their help: Taihei Ouchi, Shiuan Chang, Su Cronogue, Baoquan Huang, Chaolan Hu, Benjamin Reichman, William Mays, Diana F. Wong, David Pawlik, Allen Chan, and Ryan J. Blankenship.

Author Contributions

Shuli Yan composed the manuscript. Tiejun Meng performed the experiment and analyzed results. Kwo-Hsiung Young and Jean Nei helped in data analysis and manuscript preparation.

Conflicts of Interest

The authors declare no conflict of interest.

Abbreviations

The following abbreviations are used in this manuscript:
EVElectric vehicle
GGraphite
LTOLi-titanate
LMOLi-spinel
NCALiNiCoAl oxide
NMCLiNiMnCo oxide
LFPLiFePO4
Ni/MHNickel/metal hydride
HEVHybrid electric vehicle
MHMetal hydride
N/P ratioNegative-to-positive capacity ratio
RTRoom temperature
SOCState of charge
RintInternal resistance
RctCharge transfer resistance
R0Solution resistance

References

  1. Tesla Model S Battery. Available online: http://enipedia.tudelft.nl/wiki/Tesla_Model_S_Battery (accessed on 11 July 2017).
  2. General Motors EV1. Available online: https://en.wikipedia.org/wiki/General_Motors_EV1 (accessed on 11 July 2017).
  3. Young, K.; Nei, J.; Meng, T. Alkaline and Non-Aqueous Proton-Conducting Pouch-Cell Batteries. U.S. Patent Application 20160233461, 11 August 2016. [Google Scholar]
  4. Young, K.; Ng, K.Y.S.; Bendersky, L.A. A technical report of the Robust Affordable Next Generation Energy Storage System-BASF program. Batteries 2016, 2, 2. [Google Scholar] [CrossRef]
  5. Meng, T.; Young, K.; Beglau, D.; Yan, S.; Zeng, P.; Cheng, M. Hydrogenated amorphous silicon thin film anode for proton conducting batteries. J. Power Sources 2016, 302, 31–38. [Google Scholar] [CrossRef]
  6. Meng, T.; Young, K.; Wong, D.F.; Nei, J. Ionic liquid-based non-aqueous electrolytes for nickel/metal hydride batteries. Batteries 2017, 3, 4. [Google Scholar] [CrossRef]
  7. Young, K.; Wang, L.; Yan, S.; Liao, X.; Meng, T.; Shen, H.; Mays, W.C. Fabrications of high-capacity alpha-Ni(OH)2. Batteries 2017, 3, 6. [Google Scholar] [CrossRef]
  8. Meng, T.; Young, K.; Hu, C.; Reichman, B. Effects of alkaline pre-etching to metal hydride alloys. Batteries 2017, 3, 30. [Google Scholar] [CrossRef]
  9. Young, K.; Ng, K.Y.S. Reviews on the Chinese Patents regarding nickel/metal hydride battery. Batteries 2017, 3, 24. [Google Scholar] [CrossRef]
  10. Chang, S.; Young, K.; Nei, J.; Fierro, C. Reviews on the US Patents regarding nickel/metal hydride battery. Batteries 2016, 1, 10. [Google Scholar] [CrossRef]
  11. Corrigan, D.A.; Knight, S.L. Electrochemical and spectroscopic evidence on the participation of quadrivalent nickel in the nickel hydroxide redox reaction. J. Electrochem. Soc. 1989, 136, 613–619. [Google Scholar] [CrossRef]
  12. Corrigan, D.A.; Bendert, R.M. Effect of coprecipitated metal ions on the electrochemistry of nickel hydroxide thin films: cyclic voltammetry in 1M KOH. J. Electrochem. Soc. 1989, 136, 723–728. [Google Scholar] [CrossRef]
  13. Fierro, C.; Zallen, A.; Koch, J.; Fetcenko, M.A. The influence of nickel-hydroxide composition and microstructure on the high-temperature performance of nickel metal hydride batteries. J. Electrochem. Soc. 2006, 153, A492–A496. [Google Scholar] [CrossRef]
  14. Fierro, C.; Fetcenko, M.A.; Young, K.; Ovshinsky, S.R.; Sommers, B.; Harrison, C. Nickel Hydroxide Positive Electrode Material Exhibiting Improved Conductivity and Engineered Activation Energy. U.S. Patent 6,228,535, 8 May 2001. [Google Scholar]
  15. Zhang, L. AC impedance studies on sealed nickel metal hydride batteries over cycle life in analog and digital operations. Electrochim. Acta 1998, 43, 3333–3342. [Google Scholar] [CrossRef]
  16. Zhang, W.; Kumar, M.P.S.; Srinivasan, S. AC impedance studies on metal hydride electrodes. J. Electrochem. Soc. 1995, 142, 2935–2943. [Google Scholar] [CrossRef]
Figure 1. Nickel/metal hydride (Ni/MH) batteries in (a) a coin cell, (b) a cylindrical cell, (c) a stick cell (small prismatic), (d) an EV cell (large prismatic), and (e) an hybrid electric vehicles (HEV) cell (large prismatic).
Batteries 03 00038 g001
Figure 2. Scanning electron micrographs of (a) a heavily decorated WM12 surface and (b) a relatively smooth AP50 surface.
Batteries 03 00038 g002
Figure 3. Half-cell capacities obtained at a discharge current of 30 mA·g−1 for WM12 and AP50.
Batteries 03 00038 g003
Figure 4. Half-cell voltage profiles of WM12 at (a) cycle 1, (b) cycle 2, (c) cycle 3, (d) cycle 10, and (e) cycle 20. The blue and greens arrows point to the α-to-γ and γ-to-α transitions, respectively.
Batteries 03 00038 g004
Figure 5. Charge rate evaluation by measuring both the charge and discharge capacities of (a) Cell AP50 and (b) Cell WM12 at room temperature and (c) Cell AP50 and (d) Cell WM12 at −10 °C. All measurements were discharged at 0.1C.
Batteries 03 00038 g005
Figure 6. Discharge rate evaluation by measuring the discharge capacities of (a) Cell AP50 and (b) Cell WM12 at room temperature and (c) Cell AP50 and (d) Cell WM12 at −10 °C. All o the measurements were charged at 0.1C.
Batteries 03 00038 g006
Figure 7. Self-discharge evaluations of Cell AP50 and Cell WM12 by the open-circuit voltages at both (a) room temperature (RT) and (b) −10 °C at both 60% and 80% state-of-charge (SOC), and (c) by the capacity retention at RT and 80% SOC.
Batteries 03 00038 g007
Figure 8. Room temperature Cole-Cole plots for Cell AP50 and Cell WM12 at the (a) 0th, (b) 20th, and (c) 50th cycles obtained at 60% SOC.
Batteries 03 00038 g008
Figure 9. −10 °C Cole-Cole plots for Cell AP50 and Cell WM12 at the (a) 0th, (b) 20th, and (c) 50th cycles obtained at 60% SOC.
Batteries 03 00038 g009
Figure 10. Proposed equivalent circuit model for pouch cells AP50 and WM12.
Batteries 03 00038 g010
Table 1. Gravimetric and volumetric energy densities of several batteries used in electric vehicle (EVs). G and LTO are graphite and Li-titanate anodes for Li-ion batteries, respectively. LMO, NCA, NMC, and LFP are Li-spinel, LiNiCoAl oxide, LiNiMnCo oxide, and LiFePO4 cathodes for Li-ion batteries, respectively.
Cell MakerChemistryConfigurationEnergy Density
(Wh·L−1)
Energy Density
(Wh·kg−1)
Used in
AESCG/LMO-NCAPouch309155Leaf by Nissan
LG-ChemG/NMC-LMOPouch275157Zoe by Renault
Li-TecG/NMCPouch316152Smart by Daimler
LG-ChemG/Ni-richPrismatic208136Bolt by General Motor
Li-EnergyG/LMO-NMCPrismatic218109i-MiEV by Mitsubishi
SamsungG/NMC-LMOPrismatic243132500 by Fiat
LishenG/LFPPrismatic226116EV by Coda
ToshibaLTO/NMCPrismatic20089Fit by Honda
PanasonicG/NMCCylindrical630233Model S by Tesla
BASF–OvonicNi/MHPouch427145Not yet
Table 2. Comparisons among various cell packaging types for Ni/MH batteries.
TypeCapacity
(Ah)
Case MaterialVent CapProsCons
Coin0.02–0.4Stainless steelNoHigh volume mass-productionOnly for low-rate application
Cylindrical0.3–10Stainless steelYesHigh volume mass-productionLimited capacity
Stick1–2Stainless steelYesHigh packing densityHigher cost and lower energy density
HEV-prismatic6.5Plastic or metalYesHigh power density, easy packingLower pressure rating, poor heat transfer
EV-prismatic20–100Stainless steelYesLarge format (>100 Ah)High manufacture cost
Pouch0.2–100Aluminum laminated with plasticsYes/NoHigh gravimetric energy densityLow pressure rating
Table 3. Various properties of AP50 and WM12.
MaterialsAP50WM12
CompositionNi0.91Co0.045Zn0.045(OH)2Ni0.84Co0.12Al0.04(OH)2
Original structureβ-Ni(OH)2β-Ni(OH)2
Structure after activationβ-Ni(OH)2α-β core-shell Ni(OH)2
Tap density2.3 g·cc−10.9 g·cc−1
Discharge capacity250 mAh·g−1350 mAh·g−1
BET surface area13.7 m2·g−151.98 m2·g−1
Pore density0.022 cc·g−10.027 cc·g−1
Average pore size19.7 Å24.6 Å
Table 4. Charge and discharge capacities obtained with different charge rates for Cells AP50 and WM12 at both room temperature (RT) and −10 °C.
Test #Temperature
(°C)
RateStepCell AP50 Capacity
(mAh·g−1)
Cell WM12 Capacity
(mAh·g−1)
1RT0.1CCharge225279
0.1CDischarge205269
2RT0.2CCharge225279
0.1CDischarge201260
3RT0.5CCharge151279
0.1CDischarge143250
4RT1CCharge90269
0.1CDischarge89238
5−100.1CCharge153279
0.1CDischarge149269
6−100.2CCharge111279
0.1CDischarge110268
7−100.5CCharge53186
0.1CDischarge53184
8−101CCharge1437
0.1CDischarge1439
Table 5. Discharge capacities at different rates for Cells AP50 and WM12 at both room temperature (RT) and −10 °C.
Test #Temperature
(°C)
RateStepCell AP50 Capacity
(mAh·g−1)
Cell WM12 Capacity
(mAh·g−1)
1RT0.1CCharge225279
0.1CDischarge203272
2RT0.1CCharge225279
0.2CDischarge196270
3RT0.1CCharge225279
0.5CDischarge157256
4RT0.1CCharge225279
1CDischarge99223
5−100.1CCharge225279
0.1CDischarge160271
6−100.1CCharge225279
0.2CDischarge130259
7−100.1CCharge225279
0.5CDischarge63210
8−100.1CCharge225279
1CDischarge22142
Table 6. Charge and discharge internal resistances (Rint) at 60% SOC of Cells AP50 and WM12 measured at room temperature (RT) and −10 °C.
Temperature
(°C)
CellRint-Charge
(Ω)
Rint-Charge
(Ω)
Average Rint
(Ω)
RTAP500.360.400.38
RTWM120.170.230.20
−10AP501.061.071.07
−10WM120.450.490.47
Table 7. Summary of solution resistances (R0) and charge-transfer resistances (Rct) for Cell AP50 and Cell WM12 measured at room temperature (RT) and −10 °C at different cycles.
Temperature
(°C)
Cycle #CellR0
(Ω)
Rct
(Ω)
RT0AP500.100.23
RT0WM120.110.10
RT20AP500.130.21
RT20WM120.100.10
RT50AP500.130.23
RT50WM120.200.10
−100AP500.211.64
−100WM120.160.51
−1020AP500.171.18
−1020WM120.170.53
−1050AP500.201.30
−1050WM120.180.52