1. Introduction
With the continuously increasing energy and power densities as well as the decreasing cost, the lithium-ion battery (LIB) has been widely acknowledged as the most promising technology for energy storage in electric vehicles (EVs) [
1,
2,
3]. Nonetheless, battery aging, which results from extremely complicated physicochemical reactions and coupled degradation mechanisms upon impacts from both intrinsic and extrinsic factors, has become one of the most challenging topics in the advancement of LIB technologies [
2] and remains a major concern in the public acceptance towards EV. Hence the battery management system (BMS) is designed to improve battery lifetime control strategies based on an accurate battery state-of-health (SOH) estimation and a reliable remaining useful life (RUL) prediction [
4,
5]. Immense research efforts have been dedicated into LIB aging assessment, in particular the SOH evaluation, which serves as a quantitative metric of aging and also as the foundation for predicting RUL. An extensive literature review indicates that state-of-the-art on LIB aging can be classified into three main categories: the model-based approach [
6,
7,
8,
9,
10,
11,
12,
13,
14,
15,
16], the data-driven methods [
17,
18,
19,
20], and the experimental techniques [
21,
22,
23,
24,
25,
26,
27,
28,
29,
30,
31].
The model-based approach can be further divided into two branches: the empirical or semi-empirical approach [
6,
7,
8,
9] and the physics-based approach [
10,
11,
12,
13,
14,
15,
16]. The former normally describes battery dynamics with equivalent circuit models (ECMs) through empirical relations from data fitting. The simplicity and superiority in real-time computation have given rise to their wide applications in BMS [
9]. Yet the lack of physical representation makes it unable to interpret battery degradation mechanisms and ultimately suffers from insufficient estimation accuracy. In contrast, the physics-based approach is built upon electrochemical models (EChMs) to gain insights into the internal physicochemical processes related with aging. However, the high modeling precision comes at the price of demanding computation resources, given that the governing equations of EChMs are mostly partial differential equations (PDEs) [
11], which are not amendable for BMS application. Despite multiple model order reduction (MOR) techniques [
14] to reduce the computational complexity with various introduced approximations, the balance between modeling precision and computation efficiency still faces severe challenges.
The data-driven methods [
17,
18,
19,
20] have attracted tremendous attention in LIB aging research owing to their flexibilities from the model-free feature. The independence from battery physical properties makes it feasible for the application of various machine learning methods, including support vector machines (SVM) [
17], artificial neural networks (ANN) [
18], relevance vector machines (RVM) [
19], and particle swarm optimization [
20], etc., to develop mathematical descriptions of battery degradation behaviors through statistical learning from a large amount of data. Nevertheless, data-driven methods are often subject to certain drawbacks, such as data saturation and specific input requirement. And the reliability of data-driven methods strongly depends on the scope of training data, which severely hinders their application in BMS.
The experimental techniques [
21,
22,
23,
24,
25,
26,
27,
28,
29,
30,
31] are based on electrochemical principles and can be grouped into ex-situ and in-situ methods. Common ex-situ methods, such as scanning electron microscopy (SEM), energy dispersive spectrometry (EDS), and X-ray diffractometry (XRD), apply physicochemical and electrochemical invasive techniques to study the battery cell internally. On the contrary, in-situ methods, including incremental capacity (IC), differential voltage (DV) and electrochemical impedance spectroscopy (EIS), etc., take the non-invasive approach to characterize battery degradation, which make them more suitable for BMS application. In particular, the incremental capacity (IC) analysis has recently gained great popularity as an effective tool for battery aging assessment [
21]. It enjoys the advantage of utilizing data from readily available on-board sensors and possesses the capability of interpreting battery capacity fade, which is a key health indicator (HI), without relying on a physics-based model. Specifically, IC analysis transforms voltage plateaus on the charging/discharging voltage-capacity (V-Q) curve into clearly identifiable dQ/dV peaks on the IC curve, by differentiating the charge capacity (Q) versus the voltage (V) [
23]. The peaks on the IC curve can be associated with the phase transition during lithium intercalation and de-intercalation [
24]. And the characteristics of extracted peak properties, such as position and amplitude, can be applied for battery health monitoring and aging assessment.
However, the IC analysis is not without limitations. For instance, an accurate V-Q curve would typically require static charging/discharging protocol [
25] with low C-rate throughout the full SOC range. In addition, the voltage plateau of V-Q curve is flat and easily subject to measurement noise, rendering difficulty for extracting dQ/dV from raw data. Hence, the reported research on IC analysis for LIB health assessment are mainly focused on either the degradation mechanisms [
26,
27] or the design of robust algorithms to obtain an improved IC curve [
23,
24,
25,
28,
29,
30,
31], often confined to a specific battery cell under a given load profile. There has been scarce published work on applying IC analysis to study impacts of diverse usage patterns on battery capacity fade, which is a realistic and highly challenging problem in practical automotive applications. This paper is presented to address the aforementioned issues and the contributions of this study are twofold: the optimal health feature (HF) and the optimal data profile for capacity fade assessment are identified through IC analysis and further validated with real experimental aging data; different stress factors, which jointly characterize diverse usage patterns, are studied for their impacts on battery capacity fade, providing useful information for BMS design to improve the prediction and control of RUL. It should be noted that this paper applies IC analysis to assess battery aging through the lumped capacity fade, which may result from multiple different aging mechanisms. Differentiation and quantification of each contributing aging mechanism towards the lumped capacity fade is beyond the scope of discussion of this paper. The remainder of this paper is structured as follows:
Section 2 describes the aging campaign experiment that generates data under different load profiles;
Section 3 starts with obtaining the IC curve, followed by the identification of the optimal HF and the optimal data profile through IC analysis, then details the impacts of different stress factors on capacity fade;
Section 4 summarizes the discoveries and clarifies the future work.
3. Impact Analysis of Usage Patterns on Aging
3.1. Obtain the Incremental Capacity (IC) Curve
It is acknowledged that an accurate V-Q curve for further IC analysis typically requires static charging/discharging protocol at very low C-rate (e.g., <C/10). However, it is common that experimental data under such an ideal condition is unavailable. Hence, the capacity test data at 1C is applied in this study. The accuracy and validity of employing 1C capacity test data to assess battery capacity fade across different aging stages have been proved in References [
14] and [
16]. In addition, this study seeks to identify the optimal data profile for battery aging assessment in the real world EV operating scenario, for which 1C is more realistic than C/10. Moreover, the data of 1C capacity test (
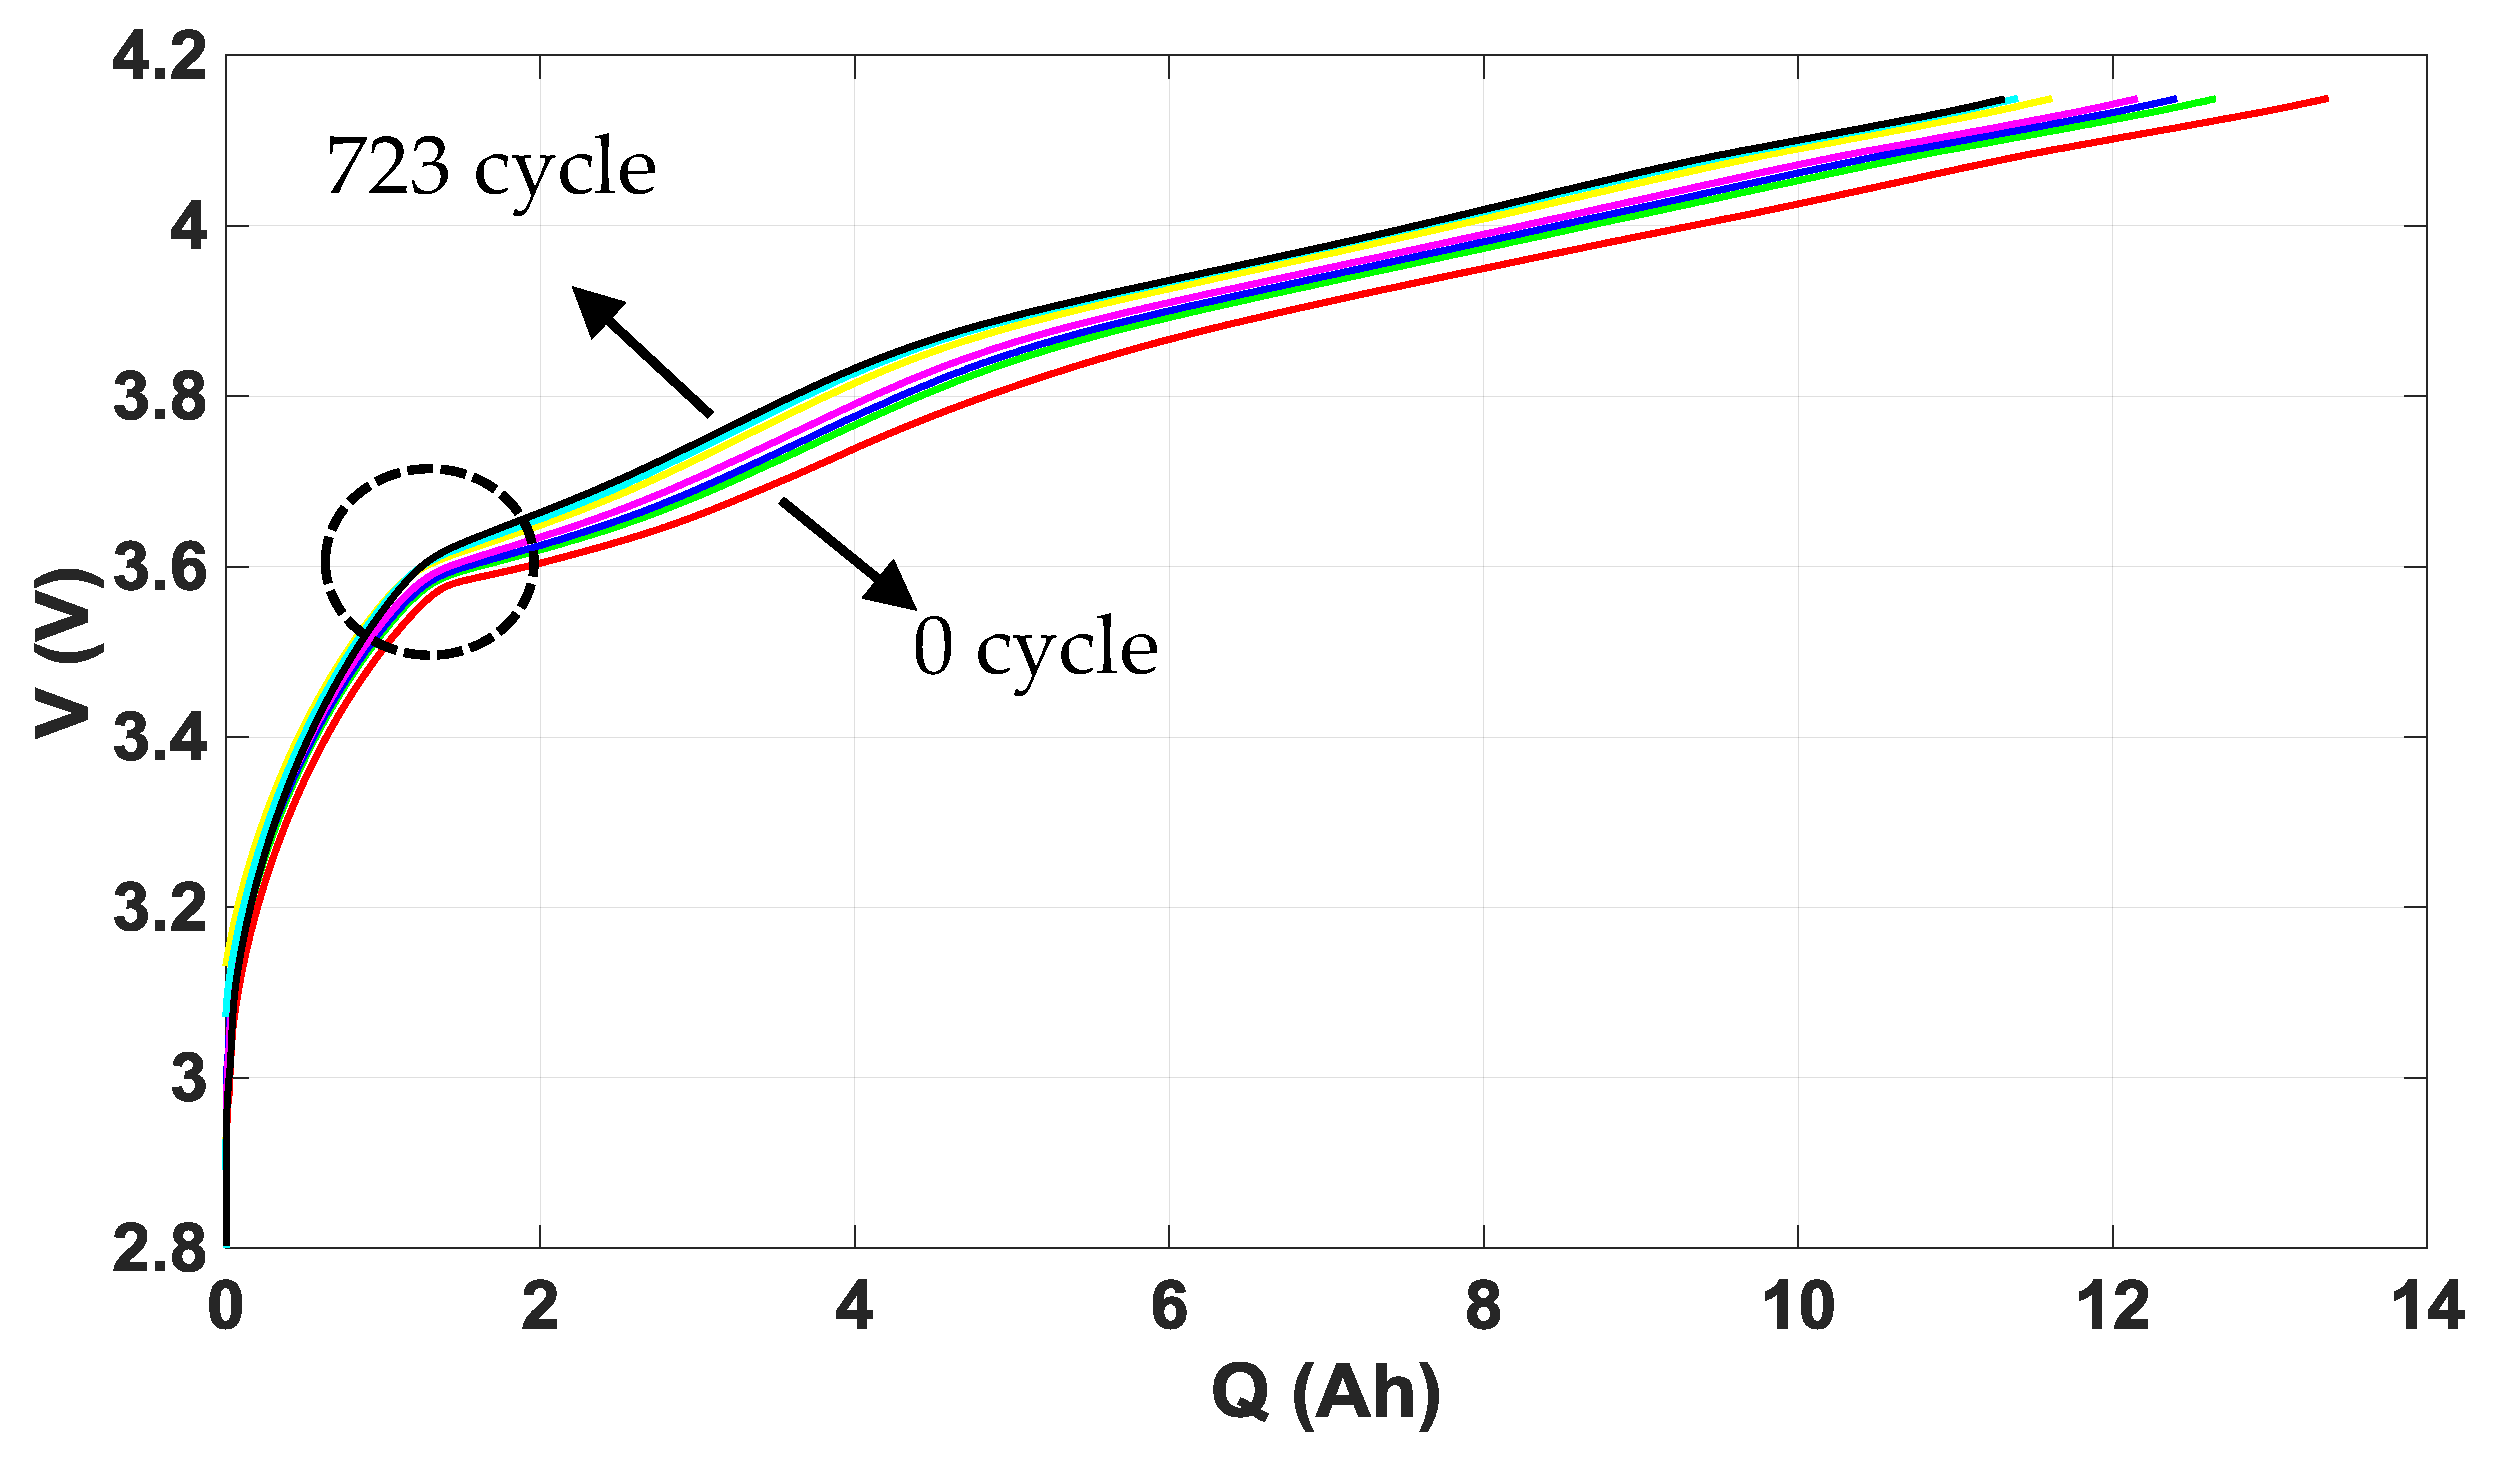
Figure 2) from constant charging is selected over constant discharging to obtain the V-Q curves across different aging stages shown in
Figure 5, given that constant discharging is not realistic outside the laboratory-controlled situation.
Apparently, the charge capacity Q at the higher cut-off voltage gradually decreases as the cell ages and there consistently present the gradient tuning point of V-Q curves around 3.6 V from different aging stages. This can be attributed to the gradient turning point of cell level OCV-SOC curve around 3.6 V [
11,
14] determined by the inherent properties of cell chemistry.
As mentioned in
Section 1, the flat V-Q curve can be greatly affected by measurement noise as illustrated in
Figure 6, thus creating challenges for extracting accurate HFs. Therefore, it is important to determine an appropriate resample frequency of the original data and a proper smoothing method before conducting any further analysis. By the definition of IC analysis in Equation (1), the differential voltage interval
plays a critical role, given that a small
may introduce errors due to measurement noise, while a large
could result in a smoother IC curve but with the risk of losing key features [
21]. There have been plenty of different methods proposed to obtain an accurate and smooth IC curve, such as the moving average filter [
31], the Gaussian filter [
24], and the improved center least squares method [
30]. Detailed comparative study of these methods is not the focus of this paper and the filtfilt() from Matlab is selected due to its simplicity under comparable smoothing effect and its advantage in zero phase delay. The resample frequency of 0.5 Hz is chosen via comparison as a balance between accuracy and smoothness, as shown in
Figure 7.
3.2. The Optimal Health Feature and Optimal Data Profile
Five HFs can be extracted in general from the filtered IC curve at each aging stage, as shown in
Figure 8. Specifically, as the cell ages through increased cycle number, the magnitudes of these HFs gradually decrease, and their positions featured by the corresponding voltages shift in a consistent pattern, which jointly deliver a reduced area under the curves that signifies a fading capacity as the cell ages. In particular, the peak A and valley D present comparatively the most significant evolving trends as the cell ages, making them promising candidates for the optimal HF to assess cell capacity fade.
Therefore, to examine the relation between the extracted HFs and the capacity fade, the HF amplitude and positions (with respect to both the cell voltage V and the corresponding SOC) are fitted versus capacity loss Q
loss, both measured from aging experiment across different aging stages and further projected until the end of life (EOL), which is 20% capacity loss defined for automotive applications, as shown in
Figure 9. As an initial validation of the extracted HFs and of the method for analyzing the relation between properties of extracted HFs and Q
loss, the cell #9, which is aged under an extensively different load profile than that of cell #1, is employed for the same analysis and the corresponding results are respectively plotted next to those of cell #1 in
Figure 9.
It can be seen from
Figure 9a,b that the amplitude (dQ/dV) of each of the five HFs for both cell #1 and #9 has presented linear dependence on Q
loss, among which the dQ/dV of peak A has demonstrated relatively the largest gradient in decreasing as the cell ages. In
Figure 9c–f, the positions of HFs with respect to cell voltage V and the corresponding SOC also present linear relation versus Q
loss. The V as well as SOC for peak A and valley D gradually increase with Q
loss. Joint analysis reveals that the voltage window between peak A and peak C decreases as the cell ages, while the dQ/dV of each HF decreases (except the peak C of cell #1 which presents extremely mild increase) with the increase of Q
loss, resulting in a shrinking area under the IC curve between peak A and C, which is closely related with the extractable cell capacity. Hence the voltage window between peak A and peak C, as well as the corresponding area under the IC curve, can also potentially characterize cell capacity fade. Yet, this study would seek the optimal HF as not only effective in characterizing capacity fade, but also obtainable in a relatively straight forward way, without potentially introducing additional error from prior computations. Hence the peak A is selected as the optimal HF with its amplitude dQ/dV to characterize the cell capacity fade, given the practical on-board voltage sensor precision and the realistically achievable SOC estimation accuracy.
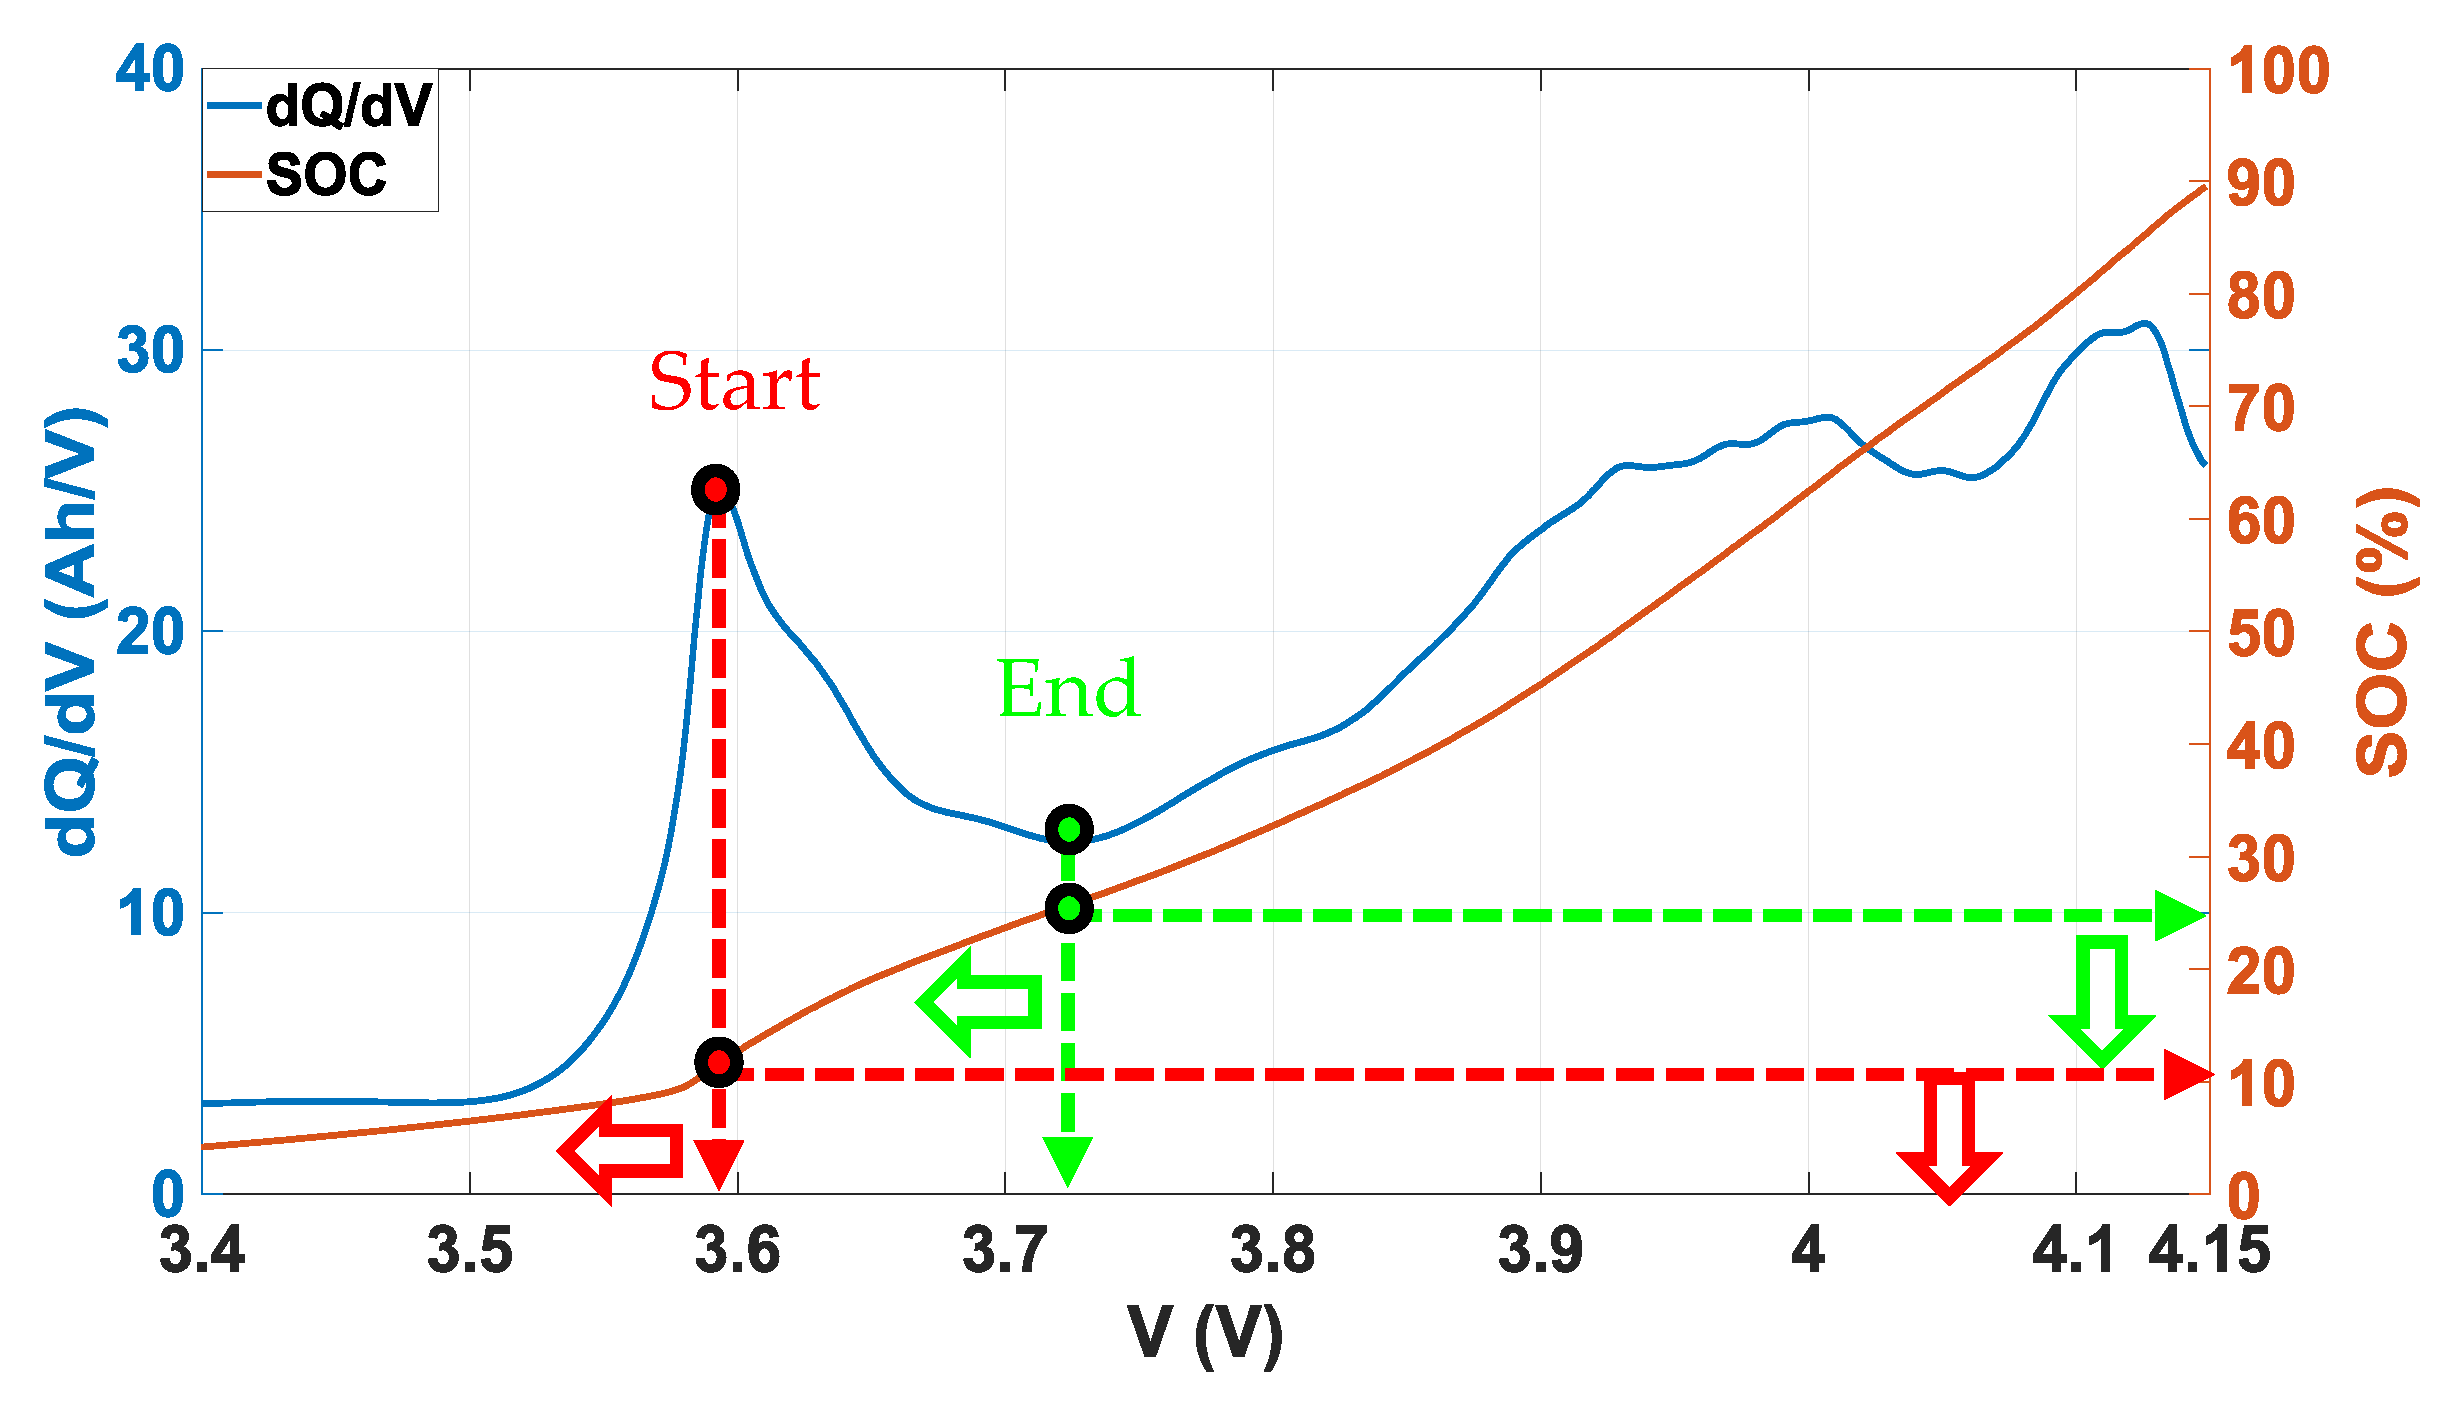
Figure 9e,f show that the absolute variation of SOC for peak A throughout life under the projected linear trajectory is very limited, despite an observable gradient for increase. Namely, the cell SOC corresponds to the identified optimal HF peak A, stays within a very limited range across different aging stages, which benefits the determination of SOC-based optimal data profile for capacity fade evaluation. Now that dQ/dV of peak A is identified as the optimal HF, a partial SOC range that can accommodate the computation of the optimal HF would be sufficient to evaluate Q
loss, rather than using the full SOC range. Hence, the optimal testing profile (
Figure 10) is identified as constant charging below 25% SOC with the initial SOC lower than 10%, which is achievable for realistic PHEV application.
Despite certain similarities shared between cell #1 and #9 in the fitted linear relations among properties of HFs versus Q
loss, some differences still get reflected, such as the gradients of dQ/dV of peak C versus Q
loss. Hence, the load profile characterized by different stress factors indeed has impacts on capacity fade, which will be analyzed in detail in
Section 3.3.
3.3. Impacts from Different Stress Factors
To validate the optimal HF and SOC-based optimal data profile for capacity fade assessment identified in
Section 3.2, dQ/dV of peak A computed from the optimal partial SOC range across different aging stages are fitted versus Q
loss, both from measurement and projected until EOL. Besides the linear fit, weighted linear fit without consideration of the first data point (given the significantly sharp drop between the first two data points) has been conducted as well. In addition, polynomial fit of different orders has also been tested out on each cell and only the results that “make sense” in the projected trajectory of dQ/dV versus Q
loss under an appropriate polynomial fit order has been plotted out (except the demonstrations of incorrect polynomial fit). Typical cases where the polynomial fit doesn’t “make sense” include: the projected dQ/dV drops to zero before EOL (
Figure 11c) and the excessive dynamics of dQ/dV from fitting (
Figure 11b).
To study the impacts of various usage patterns characterized by a combination of different stress factors on capacity fade, the fitting results of nine independent cells from four groups defined in
Table 1 are summarized in
Figure 11 (each row corresponds to one group) with 95% confidence interval boundaries shown altogether. Statistics of fitting, including coefficients R
2 and standard deviation
, are listed in
Table 3 and the standardized residuals from fittings are shown in
Figure 12. Joint analysis of
Figure 11 and
Figure 12 and
Table 3 reveals that:
• Group 1—impacts of depth-of-discharge (DOD):
When aged under the equally low charging rate of C/3, the cell (#1) that has been cycled with the largest DOD (75%) presents comparatively strongest (versus cell #2 and #3) linear dependence of dQ/dV towards Q
loss, with the highest R
2 above 0.99 from both linear fit and weighted linear fit. As the cycling DOD decreases, the gradient of linear fit of dQ/dV clearly increases, indicating an elevated capacity fade, while the gradient of weighted linear fit basically remains unchanged, resulting in a diverging gap between the two fits.
Figure 11b,c show that at lower DODs, the 95% confidence interval from the weighted linear fit is significantly narrower than that from the linear fit, indicating that the weighted linear fit is the preferred solution in relating dQ/dV with Q
loss when a cell is cycled without sufficiently deep discharge. Polynomial fit of order up to 5 are unable to generate reasonable fit of dQ/dV versus projected Q
loss till EOL. The standardized residual of both linear and weighted linear fit under different DODs in general are all bounded within ±2, except the one corresponding to the first data point from weighted linear fit. Apart from the first data point, the standardized residuals from weighted linear fit are more closely centered around zero compared with those from liner fit.
• Group 2—impacts of charging C-rate:
Given the same high DOD of 75% during cycling, the cell (#1) charged at relatively the lowest C-rate demonstrates the strongest (versus cell # 4 and #5) linear dependence of dQ/dV towards Qloss, with comparatively the highest R2. As the charging C-rate increases, the gradient of dQ/dV versus Qloss from linear fit increases, projecting an elevated capacity fade, which is not reflected in the gradient from weighted linear fit. With a comparatively narrower 95% confidence interval and higher R2, the weighted linear fit proves to be a better solution than linear fit under a charging rate higher than 1C. The standardized residual of both linear and weighted linear fit under different charging C-rates during cycling are basically bounded within ±1.5, with the ones from weighted linear fit under higher charging C-rates performing especially well and bounded within ±0.5 (except the first data point). The third order polynomial fit presents as an acceptable solution under high charging rate of 5C with a ten times smaller standard deviation (0.131) than that from weighted linear fit (1.451). Yet the projected dynamics of dQ/dV from the third order polynomial fit may still need further theoretical and experimental verifications.
• Group 3—impacts of operating mode:
Under different ratios of CD versus CS, there presents clear linear dependence of dQ/dV towards Qloss from both linear and weighted linear fit. With the increase of the proportion of CS, the gradient of dQ/dV from linear fit increases as well, which is not clearly reflected in the gradient from weighted linear fit until CS becomes the dominating operation mode (cell #7). The linear and weighted linear fit are comparable under each operating mode ratio, with the latter outperforms the former under CS dominating operation through a slightly higher R2 and a narrower 95% confidence interval. The standardized residual from two linear filters are bounded within ±1.5 (except the first data point). The comparatively (versus cell #1 and #6) largest drop of projected dQ/dV under CS-dominated operation (cell #7) indicates the most significant capacity fade. This indicates that the CS dominating operation mode, especially for long-term sustaining at a low SOC (25% in this case), can be detrimental for battery capacity.
• Group 4—impacts of temperature:
When battery operates under low (cell #8) and high (cell #9) temperatures, the 95% confidence intervals are apparently wider than that under normal temperature (cell #6), indicating a relatively weakened linear dependence of dQ/dV towards Qloss. This is consistent with the discovery that the third order polynomial fit can generate a reasonable projection trajectory of dQ/dV with a limited standard deviation three times smaller than those under two linear fits. Namely, the variation of operating temperature could introduce more dynamics that are potentially beyond the description based on a linear relation. Especially for the cell (#8) under low temperature, the standard deviation from linear fit presents to be the highest among those of all the tested cells. This verifies the importance of accurate characterization of cell thermodynamics in heath assessment. The standardized residuals from three kinds of fits under the low and high operating temperature are bounded within ±1.5 (except the first data point), and those under the normal operating temperature are more closely distributed around zero and bounded within ±1 (except the first data point).
4. Conclusions
As an increasingly popular tool for LIB health evaluation and aging assessment, the IC analysis enjoys advantages in both the flexibility from the readily available measurement data through on-board sensors, and the capability in interpreting capacity fade mechanisms from the physics-based perspective. This paper extracts multiple HFs and investigates into various properties of the extracted HFs across multiple aging stages to identify the optimal HF for capacity fade assessment. The peak amplitude in the relatively lowest SOC level, namely, dQ/dV of peak A, is eventually selected as the optimal HF, given that it is effective in characterizing the long-term cell capacity fade and is straight forward to obtain. The SOC-based optimal data profile corresponding to the optimal HF is identified as well, which enables LIB capacity fade evaluation through only a partial SOC section below 25% with the initial SOC lower than 10%, a scenario achievable for practical PHEV application.
Multi-stage experimental aging data of nine independent cells, which are designed to be of the same specifications but are aged under significantly different load profiles, are applied to not only validate the identified optimal HF and SOC-based optimal data profile for LIB health monitoring, but more importantly, to investigate the impacts of different usage patterns on LIB capacity fade. Four key stress factors, including DOD, charging C-rate, operating mode, and temperature, are employed to characterize various practical usage patterns. Impact analysis of four stress factors indicate that:
- 1
Under a low cycling charge rate of C/3, dQ/dV from larger DOD presents a better linear dependence towards Qloss. Lower DODs during cycling could disrupt the linear dependence, making the weighted linear fit a preferred solution for estimation and prediction of dQ/dV throughout life.
- 2
Under a high cycling DOD of 75%, dQ/dV under charging rate above 1C presents more dynamics compared with its strong linear dependence towards Qloss from low charge rate of C/3. Therefore, the dQ/dV under high charging rates can be more accurately characterized and further projected by weighted linear fit and potentially polynomial fit.
- 3
Under the blended operation mode of CD and CS, cell capacity fade could be elevated under the CS dominating scenario, especially when sustained at a low SOC level of 25%.
- 4
Under the high and low operating temperatures, more dynamics of dQ/dV could be introduced compared with that from the normal temperature, thus demanding more flexible fitting technique than linear fit to appropriately characterize thermodynamics within the cell for more accurate aging assessment.
These discoveries from the impact study of different stress factors can provide useful information closely related with diverse practical automotive usage patterns, such as when (DOD) to recharge batteries, how aggressive (C-rate) the charging profile should be, how to allocate different driving modes (CD:CS), and how to determine a healthy battery operating temperature. All of these can help improve the lifetime control strategies within BMS.
For future work, further aging experiments are planned to obtain data under more diversified scenarios to better approximate different battery practical usage patterns. For a given aging scenario, multiple battery cells are scheduled for tests to mitigate the intrinsic impacts on degradation evaluation. The design of large-scale Monte Carlo simulations is in progress for more accurate prediction of the LIB long-term aging propagation.


